
Perception of office space accessibility in Beijing urban area
Online published: 2014-12-19
Copyright
Urban traffic condition is a fundamental aspect of city operation and development, also determines the operational efficiency of cities and the optimization of urban spatial structure. The ring and dispersal pattern of urban road network in Beijing influences the internal structure and form of the urban space, also affects the spatial accessibility of different functional districts. Based on the sampling data of a questionnaire survey, this paper examines accessibility of 10 office clusters of Beijing. By multidimensional scaling analysis, we evaluate the respondents' subjective perception of accessibility in the research areas. Meanwhile, using ArcGIS spatial analysis tools, we analyze the actual accessibility of office clusters and classify the evaluation results of accessibility. Through a comparison of the subjective perception based on the questionnaire survey data and the objective assessment result, we analyze the accessibility in different office clusters of the inner city. The result shows that, first, in different office clusters, there is no obvious difference in the selection of transportation means, but non-motor vehicles and private cars were used frequently in certain areas. Ground transportation and rail transportation as leading public transport tools are the main transport methods that urban residents in Beijing choose to use in commuting. Nearly 50% of people preferred to walk 5~10 minutes to public transportation sites and entertainment facilities. Second, there are significant differences between commuters' subjective perception of accessibility and objective assessment result in different office clusters of the inner city. Respondents had different perception of accessibility in different office clusters. Third, the difference between subjective and objective accessibility assessments indicates that transport accessibility assessment should not only focus on the distance to public transport sites, but also on travelers' psychological perception and the convenience of transfer between different lines and transport means, especially the connection of "the last kilometer" between public transportation sites and workplace. Fourth, 5~10 minutes walking distance is the basic space of activities for city residents. This not only provide the basis for the planning and design of public transportation sites and supporting facilities, but also make constructing the "5~10 minutes walking circle" an important tool for improving the spatial accessibility in Beijing's urban area. These results can be useful for optimizing the location of office spaces in the city of Beijing.
Key words: accessibility; perception; office clusters; Beijing urban area
WANG Dandan , ZHANG Jingqiu , SUN Rui . Perception of office space accessibility in Beijing urban area[J]. PROGRESS IN GEOGRAPHY, 2014 , 33(12) : 1676 -1683 . DOI: 10.11820/dlkxjz.2014.12.011
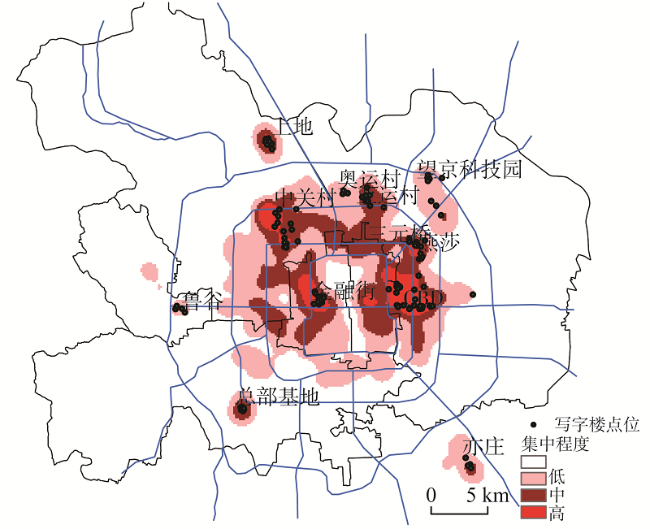
Fig. 1 Location of the surveyed areas图1 调查区域区位 |
Tab. 1 Characteristics of the samples表1 样本属性构成 |
| 办公区 | 性别 | 年龄 | 受教育程度① | 职位 | ||||||||||||
|---|---|---|---|---|---|---|---|---|---|---|---|---|---|---|---|---|
| 男 | 女 | ≤30 | 31~40 | 41~50 | >50 | 低 | 中 | 高 | 职员 | 主管 | 经理 | 临时 | ||||
| CBD | 92 | 112 | 104 | 71 | 21 | 8 | 11 | 180 | 13 | 127 | 54 | 18 | 5 | |||
| 45.1% | 54.9% | 51.0% | 34.8% | 10.3% | 3.9% | 5.4% | 88.2% | 6.4% | 62.3% | 26.5% | 8.8% | 2.4% | ||||
| 金融街 | 64 | 68 | 53 | 57 | 22 | 0 | 2 | 103 | 27 | 87 | 38 | 7 | 0 | |||
| 48.5% | 51.5% | 40.2% | 43.2% | 16.7% | 0.0% | 1.5% | 78.0% | 20.5% | 65.9% | 28.8% | 5.3% | 0.0% | ||||
| 中关村 | 40 | 30 | 45 | 17 | 4 | 4 | 11 | 56 | 3 | 62 | 7 | 1 | 0 | |||
| 57.1% | 42.9% | 64.3% | 24.3% | 5.7% | 5.7% | 15.7% | 80.0% | 4.3% | 88.6% | 10.0% | 1.4% | 0.0% | ||||
| 上地 | 30 | 38 | 55 | 9 | 4 | 0 | 11 | 57 | 0 | 58 | 9 | 1 | 0 | |||
| 44.1% | 55.9% | 80.9% | 13.2% | 5.9% | 0.0% | 16.2% | 83.8% | 0.0% | 85.3% | 13.2% | 1.5% | 0.0% | ||||
| 亚运村+奥运村 | 26 | 29 | 32 | 5 | 18 | 0 | 1 | 48 | 6 | 39 | 14 | 2 | 0 | |||
| 47.3% | 52.7% | 58.2% | 9.1% | 32.7% | 0.0% | 1.8% | 87.3% | 10.9% | 70.9% | 25.5% | 3.6% | 0.0% | ||||
| 望京科技园 | 21 | 29 | 38 | 9 | 2 | 1 | 2 | 40 | 8 | 42 | 5 | 2 | 1 | |||
| 42.0% | 58.0% | 76.0% | 18.0% | 4.0% | 2.0% | 4.0% | 80.0% | 16.0% | 84.0% | 10.0% | 4.0% | 2.0% | ||||
| 鲁谷 | 15 | 18 | 10 | 11 | 8 | 4 | 9 | 23 | 1 | 12 | 12 | 6 | 3 | |||
| 45.5% | 54.5% | 30.4% | 33.3% | 24.2% | 12.1% | 27.3% | 69.7% | 3.0% | 36.4% | 36.4% | 18.2% | 9.1% | ||||
| 总部基地 | 15 | 15 | 17 | 6 | 5 | 2 | 5 | 24 | 1 | 24 | 4 | 0 | 2 | |||
| 50.0% | 50.0% | 56.7% | 20.0% | 16.7% | 6.7% | 16.7% | 80.0% | 3.3% | 80.0% | 13.3% | 0.0% | 6.7% | ||||
| 亦庄 | 20 | 13 | 21 | 11 | 1 | 0 | 1 | 32 | 0 | 26 | 6 | 1 | 0 | |||
| 60.6% | 39.4% | 63.7% | 33.3% | 3.0% | 0.0% | 3.0% | 97.0% | 0.0% | 78.8% | 18.2% | 3.0% | 0.0% | ||||
| 燕莎+三元桥 | 14 | 43 | 22 | 21 | 11 | 3 | 6 | 44 | 7 | 36 | 17 | 4 | 0 | |||
| 24.6% | 75.4% | 38.6% | 36.8% | 19.3% | 5.3% | 10.5% | 77.2% | 12.3% | 63.2% | 29.8% | 7.0% | 0.0% | ||||
| 合计 | 347 | 385 | 397 | 230 | 83 | 22 | 59 | 607 | 66 | 513 | 166 | 42 | 11 | |||
| 47.4% | 52.6% | 54.3% | 31.4% | 11.3% | 3.0% | 8.1% | 82.9% | 9.0% | 70.1% | 22.6% | 5.8% | 1.5% | ||||
注:① 受教育程度由低到高分为3个水平:低学历对应高中及以下学历、中等学历对应大学本科或职高、高学历对应研究生学历。 |
Tab. 2 Commuters' accessibility perception of office clusters表2 从业人员对办公集聚区通达性感知 |
| 不同感知时间占比/% | 到达最近公交站点 | 到达最近地铁站点 | 到达附近休闲餐饮等设施 |
|---|---|---|---|
| 5以内 | 30.10 | 19.5 | 27.6 |
| 5~10 | 56.10 | 48.5 | 48.4 |
| 10~15 | 8.75 | 18.6 | 20.9 |
| 15以上 | 5.05 | 13.4 | 3.1 |
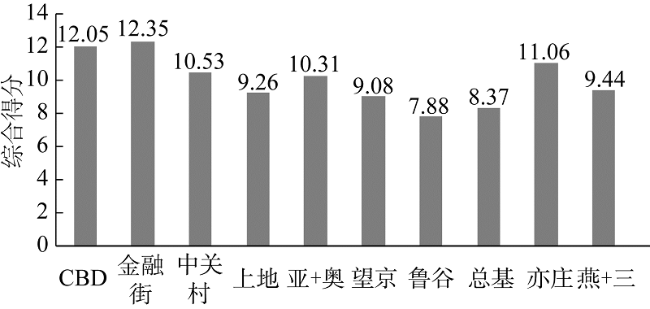
Fig. 2 Composite scores of office clusters图2 办公集聚区综合得分图 |
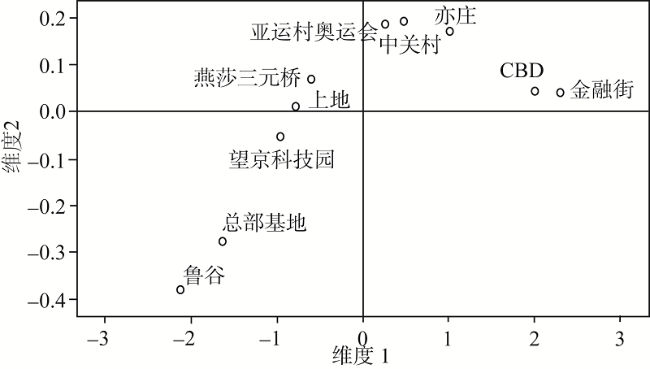
Fig. 3 Perception of accessibility to office clusters图3 办公集聚区通达性空间感知图 |
Tab. 3 Score of parameters表3 不同选项涉及的时间段和问题选项对应赋值 |
| 时间段和问题选项 | 5min以内 | 5~10min | 10~15min | 15min以上 | 是 | 否 | 收费 | 免费 |
|---|---|---|---|---|---|---|---|---|
| 分值 | 4 | 3 | 2 | 1 | 1 | 0 | 0 | 1 |
注:所赋予的分值只是用于比较最终的综合得分,分值之间不存在比较关系。 |
Tab. 4 Average travel time by public transportation and numbers of stations in office clusters表4 办公集聚区的公共交通平均达到时间和站点数量 |
| 办公集聚区 | 到地面公交站平均时间/min | 到轨道交通站平均时间/min | 二者平均时间/min | 附近公交站点数 | 附近轨道交通站点数 |
|---|---|---|---|---|---|
| CBD | 3.6 | 7.6 | 5.60 | 63 | 2 |
| 金融街 | 2.3 | 10.2 | 6.25 | 39 | 3 |
| 中关村 | 3.2 | 6.5 | 4.85 | 36 | 4 |
| 上地 | 2.9 | 15.3 | 9.10 | 25 | 1 |
| 亚运村+奥运村 | 3.3 | 20.2 | 11.75 | 24 | 2 |
| 望京科技园 | 2.6 | 26.7 | 14.65 | 40 | 1 |
| 鲁谷 | 2.3 | 13.1 | 7.70 | 23 | 1 |
| 总部基地 | 7.7 | 25.6 | 16.65 | 9 | 1 |
| 亦庄 | 1.5 | 8.3 | 4.90 | 37 | 1 |
| 燕莎+三元桥 | 5.0 | 9.6 | 7.30 | 29 | 2 |
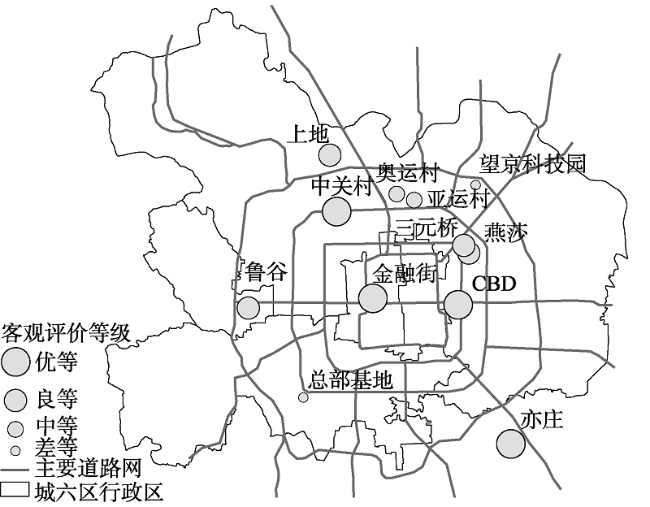
Fig. 4 Result of the objective evaluation of accessibility图4 通达性客观评价等级划分的空间分布 |
Tab. 5 Comparison of subjective and objective evaluations of accessibility of office clusters表5 办公集聚区通达性主客观对比 |
| 办公集聚区通达性等级 | 主观感知 | 客观统计 |
|---|---|---|
| 优 | 金融街、CBD | CBD、中关村、亦庄、金融街 |
| 良 | 亦庄、中关村、亚运村+奥运村 | 燕莎+三元桥、鲁谷、上地 |
| 中 | 燕莎+三元桥、上地、望京 | 亚运村+奥运村 |
| 差 | 总部基地、鲁谷 | 总部基地、望京 |
The authors have declared that no competing interests exist.
| [1] |
[
|
| [2] |
[
|
| [3] |
[
|
| [4] |
[
|
| [5] |
[
|
| [6] |
[
|
| [7] |
[
|
| [8] |
[
|
| [9] |
|
| [10] |
[
|
| [11] |
[
|
| [12] |
[
|
| [13] |
[
|
| [14] |
[
|
| [15] |
[
|
| [16] |
[
|
| [17] |
[
|
| [18] |
[
|
| [19] |
[
|
| [20] |
|
| [21] |
|
| [22] |
|
| [23] |
|
| [24] |
|
| [25] |
|
| [26] |
|
/
| 〈 |
|
〉 |