
Simulation of typhoon storm surge impacts in Shanghai based on storm surge scenarios and disaster prevention measures
Online published: 2014-12-19
Copyright
In order to study coastal flooding in Shanghai caused by typhoons following typical paths, the possible effects of the six severe typhoon storm surges were analyzed using MIKE21 Flow Model. Based on the probable maximum intensity of tropical cyclones and by taking into consideration sea level rise, topographic change, and seawalls subsidence, 12 scenarios were analyzed for potential storm surge impacts. The results show that, because of the high standard protective seawalls, the possibility of overtopping inundation resulting from storm surges is extremely low under the present condition. However, as the strength of influencing factors increases over time, overtopping inundation becomes more likely. In 2040, the inundation caused by a tropical cyclone landing in Shanghai can be very large, and water depth can reach 3.0 meters or more in some local areas. About 25% of seawalls would be at risk of flooding , and the inundation area of the storm surges can reach 910 km2 under the proposed scenarios. Storm surge disaster prevention measures include protecting the source areas of water supply to the city, creating urban flood retention space, increasing the protection standard of seawalls, enhancing the drainage capability of the city, and optimizing the distribution of the emergency shelters.
Key words: storm surge; scenario simulation; MIKE21 FM; hazard analysis; spatial countermeasure; Shanghai
SONG Chengcheng , LI Mengya , WANG Jun , XU Shiyuan , CHEN Zhenlou . Simulation of typhoon storm surge impacts in Shanghai based on storm surge scenarios and disaster prevention measures[J]. PROGRESS IN GEOGRAPHY, 2014 , 33(12) : 1692 -1703 . DOI: 10.11820/dlkxjz.2014.12.013
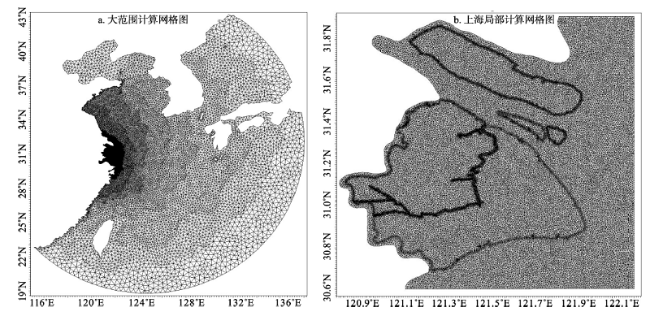
Fig. 1 Multiple embedded triangle mesh of the study area图1 模型计算区域范围和多层嵌套网格 |
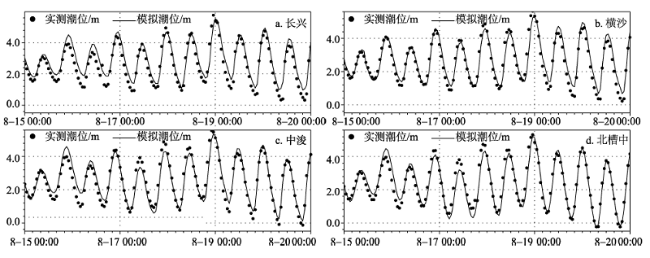
Fig. 2 Observed and simulated tide levels during TC9711图2 9711台风期间上海沿岸各站潮位验证图 |
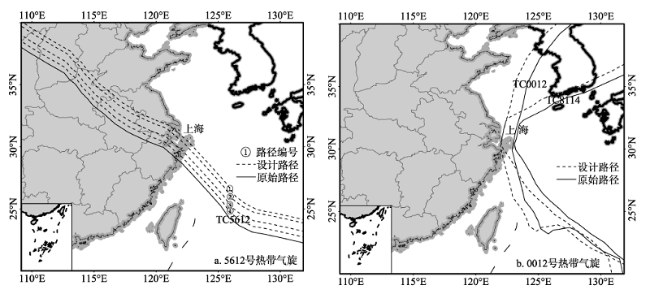
Fig. 3 Original paths and six designed translational paths图3 热带气旋的原始路径及六条平移设计路径 |
Tab. 1 Scenarios of typhoon storm surges in Shanghai表1 上海台风风暴潮复合情景矩阵 |
| 路径类型 | TC模板 | 初始情景(2010年) | 未来情景(2040年) | |||||
|---|---|---|---|---|---|---|---|---|
| S | D | L | S | D | L | |||
| 正面登陆类 | TC5612-1 | 2010 | 2010 | 2010 | 2040 | 2040 | 2040 | |
| TC5612-2 | 2010 | 2010 | 2010 | 2040 | 2040 | 2040 | ||
| 浙北登陆 北上类 | TC5612-3 | 2010 | 2010 | 2010 | 2040 | 2040 | 2040 | |
| TC5612-4 | 2010 | 2010 | 2010 | 2040 | 2040 | 2040 | ||
| 近海北上类 | TC0012-5 | 2010 | 2010 | 2010 | 2040 | 2040 | 2040 | |
| TC8114-5 | 2010 | 2010 | 2010 | 2040 | 2040 | 2040 | ||
注:台风登陆点(基准点):1、2、3、4、5;情景要素:海平面上升(S)、陆域沉降和海域冲淤(D)、海塘沉降(L)。 |
Tab. 2 Inundated areas of scenario storm surges (landing in Shanghai)表2 正面登陆类台风风暴潮各淹没深度所占面积 |
| 年份 | TC路径 | 淹没面积/km2 | ||||
|---|---|---|---|---|---|---|
| 0~0.5m | 0.5~1.2m | 1.2~3m | >3m | 合计 | ||
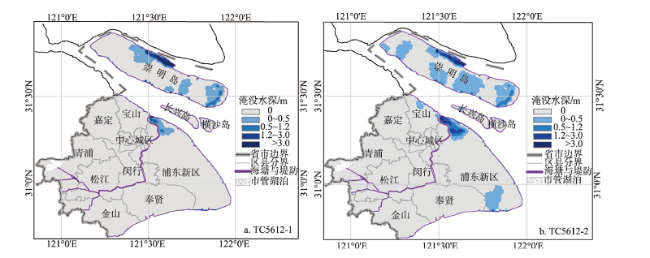
| 2010 | TC5612-1 | 58.99 | 13.93 | 24.15 | 14.99 | 112.06 |
| TC5612-2 | 116.79 | 15.52 | 26.54 | 5.73 | 164.58 | |
| 2040 | TC5612-1 | 374.70 | 70.10 | 41.81 | 25.77 | 512.38 |
| TC5612-2 | 712.95 | 98.82 | 75.87 | 21.89 | 909.53 | |
Fig. 4 Inundated areas under the 2040 storm surge scenarios (landing in Shanghai) (a. TC5612-1, b. TC5612-2)图4 2040年时间情景下台风风暴潮(正面登陆类)淹没分布图 |
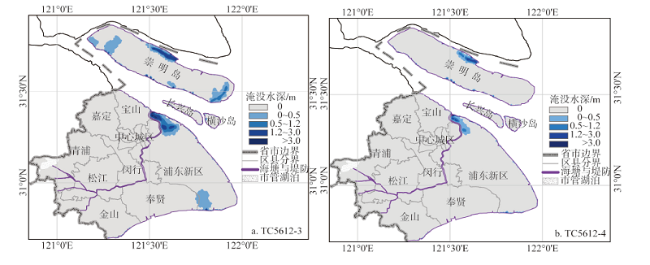
Tab.3 Inundated areas of scenario storm surges (landing in northern Zhejiang Province)表3 浙北登陆北上类台风风暴潮各淹没深度所占面积 |
| 年份 | TC路径 | 淹没面积/km2 | ||||
|---|---|---|---|---|---|---|
| 0~0.5 m | 0.5~1.2 m | 1.2~3 m | >3 m | 合计 | ||
| 2010 | TC5612-3 | 70.37 | 21.94 | 7.61 | 0.11 | 100.03 |
| TC5612-4 | 53.05 | 14.40 | 4.93 | 0.06 | 72.44 | |
| 2040 | TC5612-3 | 335.05 | 85.85 | 62.77 | 9.12 | 492.79 |
| TC5612-4 | 113.53 | 38.16 | 18.74 | 4.62 | 175.05 | |
Fig. 5 Inundated areas under the 2040 storm surge scenarios (landing in northern Zhejiang Province)图5 2040年时间情景下台风风暴潮(浙北登陆北上类)淹没分布图 |
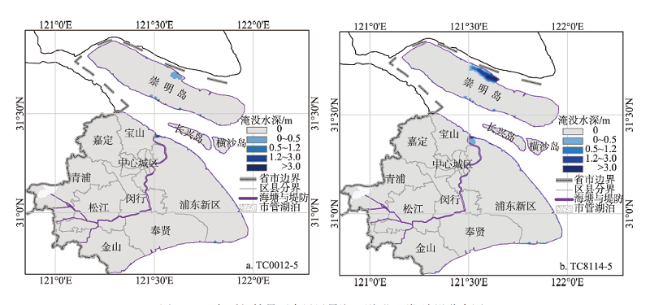
Tab. 4 Inundated areas of scenario storm surges (going northward in the sea around Shanghai)表4 近海北上类台风风暴潮各淹没深度所占面积 |
| 年份 | TC路径 | 淹没面积/km2 | ||||
|---|---|---|---|---|---|---|
| 0~0.5 m | 0.5~1.2 m | 1.2~3 m | >3 m | 合计 | ||
| 2010 | TC0012-5 | 48.49 | 5.24 | 12.34 | 0.05 | 66.13 |
| TC8114-5 | 50.72 | 5.52 | 12.80 | 0.05 | 69.09 | |
| 2040 | TC0012-5 | 82.28 | 7.88 | 2.73 | 1.00 | 93.89 |
| TC8114-5 | 99.87 | 21.91 | 22.80 | 9.07 | 153.65 | |
Fig. 6 Inundated areas under the 2040 storm surge scenarios (going northward in the sea around Shanghai)图6 2040年时间情景下台风风暴潮(近海北上类)淹没分布图 |
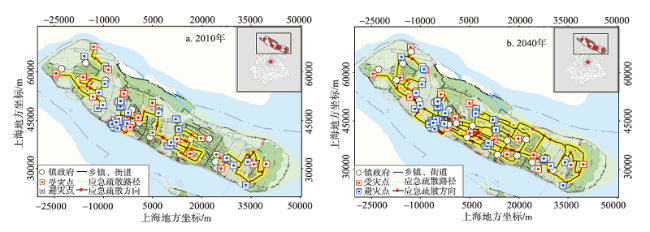
Fig. 7 Evacuation routes of Chongming disaster areas in 2010 and 2040图7 2010、2040年时间情景下崇明岛受灾片区应急疏散路径 |
Fig. 8 Evacuation routes of Wusong disaster areas in 2010 and 2040图8 2010、2040年时间情景下吴淞口受灾片区应急疏散路径 |
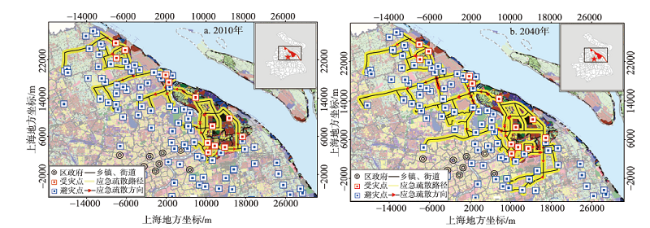
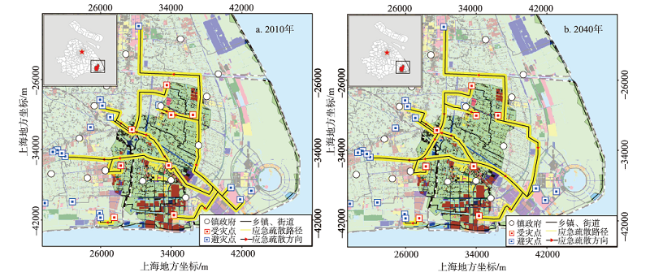
Fig. 9 Evacuation routes of Nanhui disaster areas in 2010 and 2040图9 2010、2040年时间情景下南汇受灾片区应急疏散路径 |
The authors have declared that no competing interests exist.
| [1] |
[
|
| [2] |
[
|
| [3] |
[
|
| [4] |
国家海洋局. 2007. 2007年中国海平面公报[EB/OL]. 2008-01-22[2014-10-10].
[State Oceanic Administration People's Republic of China. 2007. 2007 nian Zhongguo haipingmian gongbao[EB/OL]. 2008-01-22[2014-10-10].
|
| [5] |
国家海洋局. 2014. 2013 年中国海洋灾害公报[EB/OL].2014-03-24[2014-10-10].
[State Oceanic Administration People's Republic of China. 2014. 2013 nian Zhongguo haiyang zaihai gongbao[EB/OL]. 2014 -03-24[<date-in-citation content-type="access-date">2014-10-10</date-in-citation>].
|
| [6] |
[
|
| [7] |
[
|
| [8] |
[
|
| [9] |
上海市水务局. 2013. 上海市海塘规划(2011-2020年)[EB/OL]. 2013-11-07[2014-10-10].
[Shanghai Water Authority. 2013. Shanghai haitang guihua (2011-2020)[EB/OL]. 2013-11-07[2014-10-10].
|
| [10] |
[
|
| [11] |
[
|
| [12] |
[
|
| [13] |
[
|
| [14] |
[
|
| [15] |
[
|
| [16] |
[
|
| [17] |
[
|
| [18] |
[
|
| [19] |
[
|
| [20] |
|
| [21] |
|
| [22] |
|
| [23] |
|
| [24] |
|
| [25] |
|
| [26] |
|
| [27] |
|
| [28] |
|
/
| 〈 |
|
〉 |