
Visualizing time-space compression of urban system in Hunan Province:
Online published: 2014-12-19
Copyright
Measuring and analyzing the time-space compression phenomenon caused by improved road network accessibility in geographical space have been a major challenge for transport researchers. Current attempts of comparing accessibility pattern maps only describe centrality of nodes, and the isochrone approach is capable of analyzing individual cities but fails to provide a complete picture of regions of concern. This study developed an analytical model using time-space map to visualize time-space compression phenomenon, based on a synergy of current big-data available on the internet and statistical and 3D-visualization technologies. OD (Origin and Destination) data matrix (travel distance and duration by cities) was generated from web-map-server's direction API using web-crawling programs. Multidimensional scaling method was then applied to find the best-fit configuration space, which redraw the map by replacing the euclidean distance with network distance or duration. The scale and distribution of errors were statistically tested to verify the validity and reliability of the results. Finally, 3D time-space maps were visualized and overlapped with the geographical map to observe stretching, shrinking, and wrinkling effects of space caused by uneven transportation accessibility improvements. Using Hunan Province as a case, this study produced two time-space maps of travel distance and duration between cities, and analyzed the errors on these maps. The case study supports the view that time-space analysis is a valid method to visualize time-space compression and a useful tool to generate policy recommendations for building a more balanced road network with higher accessibility of regions.
ZHOU Kai , QIAN Fangfang , ZOU Yu . Visualizing time-space compression of urban system in Hunan Province:[J]. PROGRESS IN GEOGRAPHY, 2014 , 33(12) : 1666 -1675 . DOI: 10.11820/dlkxjz.2014.12.010
Fig. 1 Existing time-space mapping cases图1 现有时空图分析研究案例 |
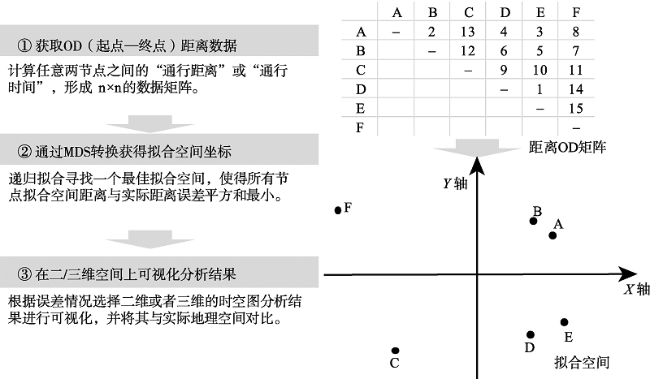
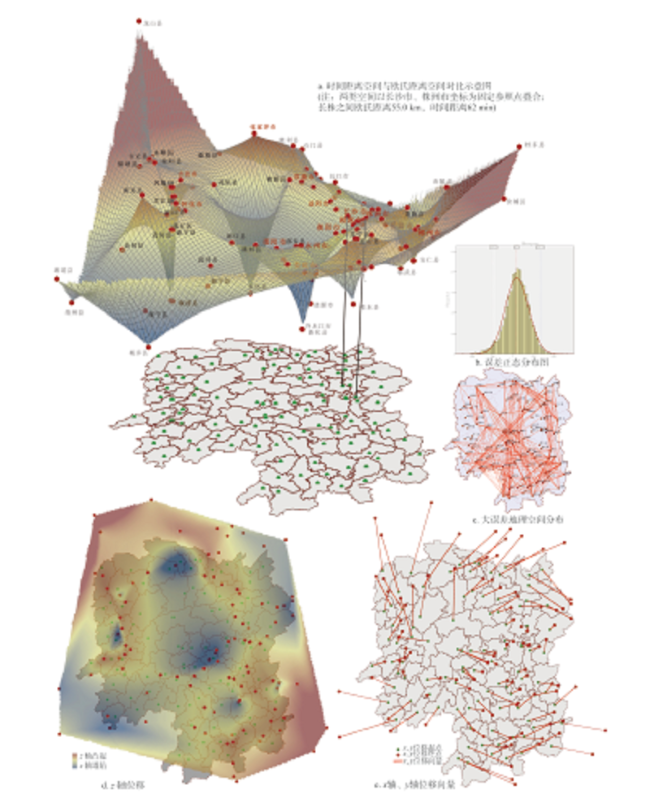
Fig. 2 Time-space mapping method图2 时空图分析方法 |
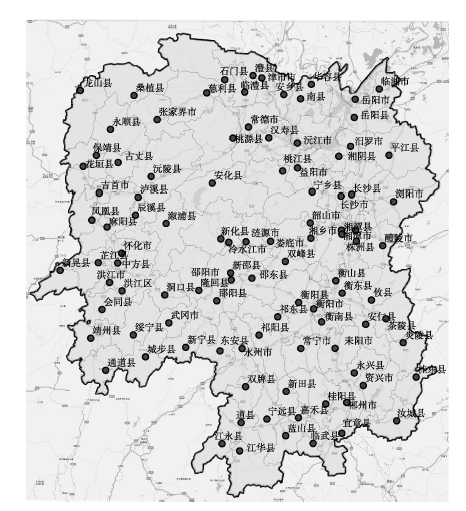
Fig. 3 Cities in Hunan Province as study area图3 湖南省地县级城市 |
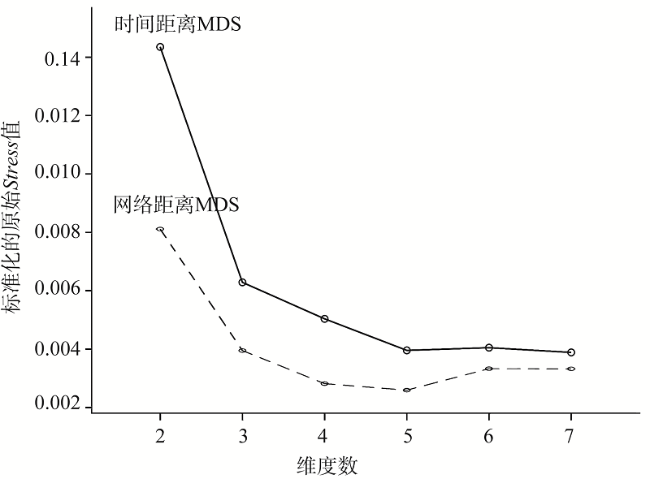
Fig. 4 Stress test on 2~7 dimensions analysis results图4 2~7维MDS分析结果的Stress检验 |
Tab. 1 Time-space analysis results表1 时空图分析拟合结果 |
| 分析参数 | 网络距离时空图 | 时间距离时空图 | |
|---|---|---|---|
| 数据 | 城市样本数 | 101 | 101 |
| 有效OD数据 | 5050 | 5050 | |
| 叠加锚点 | 长沙、株洲 | ||
| 有效性检验 | 标准拟合误差σ值 | 0.00653 | 0.00734 |
| 拟合误差系数Stress-I | 0.0807 | 0.08567 | |
| 误差分析a | 拟合误差平均值 | +4.5 km | +0.18 h |
| 拟合误差标准差 | 31.3 km | 0.47 h | |
| 95%误差范围b | -58.2~+67.2 km | -0.77~+1.12 h | |
| 拟合误差率τ平均值 | +0.00% | +0.00% | |
| 拟合误差率τ标准差 | +12.93% | +20.71% | |
| 95% τ值范围b | -25.86%~+25.86% | -41.42%~41.42% | |
b. 经检验,拟合误差和拟合误差率τ均呈正态分布,根据统计规律95%分布在均值左右2个标准差范围之内。 |
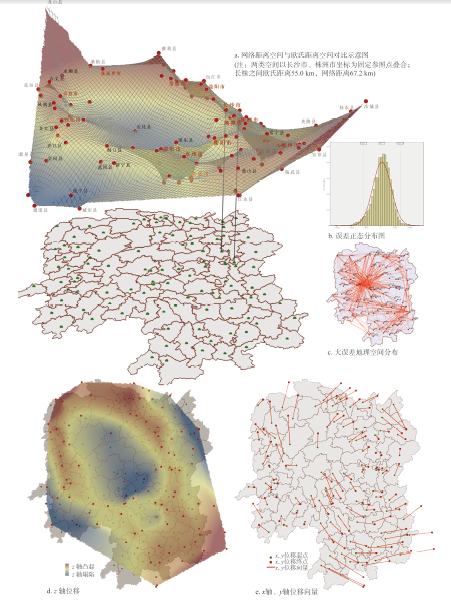
Fig. 5 Time-space map of Hunan Province by travel distance图5 根据通行距离计算的时空图 |
Fig. 6 Time-space map of Hunan Province by travel duration图6 根据通行时间计算的时空图 |
The authors have declared that no competing interests exist.
| [1] |
[
|
| [2] |
[
|
| [3] |
[
|
| [4] |
[
|
| [5] |
|
| [6] |
[
|
| [7] |
[
|
| [8] |
[
|
| [9] |
[
|
| [10] |
[
|
| [11] |
[
|
| [12] |
[
|
| [13] |
[
|
| [14] |
[
|
| [15] |
[
|
| [16] |
[
|
| [17] |
[
|
| [18] |
[
|
| [19] |
[
|
| [20] |
[
|
| [21] |
[
|
| [22] |
|
| [23] |
|
| [24] |
|
| [25] |
|
| [26] |
|
| [27] |
|
| [28] |
|
| [29] |
|
| [30] |
|
| [31] |
|
/
| 〈 |
|
〉 |
