
Classification of China's urban agglomerations
Online published: 2015-03-25
Copyright
Urban agglomeration is an important carrier of China's new urbanization strategy, but also a new geographical unit for participating in global competition and international division of labor. At present, the mode of China's regional spatial governance is undergoing a major shift from the original spatial split according to the administrative divisions to govern in accordance with the type of area. Based on the significant extension of the characteristics of urban agglomerations, we divide the 23 Chinese urban agglomerations at four levels and analyze the spatial variation, aiming to provide a scientific basis for the implementation of China's urban agglomerations spatial pattern optimization and planning. First, the 23 areas are divided into national, regional, sub-regional and local levels of urban agglomerations with reference to the development status of more mature urban agglomerations worldwide, resulting in a "3-5-6-9" pyramid structure for the four levels. Then, based on the five essential characteristics of urban agglomerations, we build an index system for the classification of urban agglomerations that consists of 10 factors and 22 indicators, and a Q-type cluster analysis is employed to quantitatively group five kinds of the urban agglomerations: mature export-oriented type, dual-core catch-up type, environment-friendly type, single nuclear radiation type, and inland extensive type. Finally, by synthesizing the classification results of different levels and quantitative clustering, China's urban agglomerations are divided into 10 subgenera: National mature export-oriented genre, national dual-core catch-up genre, regional dual-core catch-up genre, sub-regional environment-friendly genre, local environment-friendly genre, regional single nuclear radiation genre, local single nuclear radiation genre, regional inland extensive genre, subregional inland extensive genre, and local inland extensive genre.
HUANG Jinchuan , CHEN Shouqiang . Classification of China's urban agglomerations[J]. PROGRESS IN GEOGRAPHY, 2015 , 34(3) : 290 -301 . DOI: 10.11820/dlkxjz.2015.03.004
Tab.1 General information of mature urban agglomerations表1 世界较成熟城市群基本情况一览表 |
| 序号 | 城市群 | 人口数量/万 | 占地面积/万km2 | 人口密度/(人/km2) |
|---|---|---|---|---|
| 1 | 美国大西洋沿岸城市群 | 6500 | 13.80 | 471 |
| 2 | 北美五大湖城市群 | 5000 | 24.50 | 204 |
| 3 | 日本太平洋沿岸城市群 | 7000 | 10.00 | 700 |
| 其中:狭义东京都市圈 | 3400 | 1.34 | 2537 | |
| 4 | 伦敦大都市圈 | 3650 | 4.50 | 811 |
| 5 | 欧洲西北部城市群 | 4600 | 14.50 | 317 |
| 6 | 长三角城市群 | 10166 | 10.10 | 1012 |
| 世界级城市群均值 | 6153 | 12.90 | 586 | |
| 7 | 荷兰兰德斯塔德城市群 | 700 | 1.08 | 667 |
| 8 | 巴黎法兰西岛城市群 | 1120 | 1.10 | 1019 |
| 9 | 英格兰东南部城市群 | 812 | 1.91 | 426 |
| 10 | 比利时法兰德斯城市群 | 582 | 1.35 | 431 |
| 11 | 德国莱茵—鲁尔城市群 | 1038 | 1.28 | 811 |
| 12 | 德国莱茵—美因城市群 | 480 | 1.10 | 436 |
| 欧洲重要城市群均值 | 789 | 1.30 | 632 |
Tab.2 Classification criterion of China's 23 urban agglomerations表2 中国城市群等级划分四项指标及基本信息一览表 |
| 等级 | 城市群名称 | 常住人口/万 | 占地面积/km2 | 人口密度/(人/km2) | 城镇化率/% | 常住人口占比/% | GDP占比/% | 个数 |
|---|---|---|---|---|---|---|---|---|
| 国家级 | 长三角城市群 | 10166.38 | 100504 | 1012 | 70.52 | 32.44 | 45.95 | 3 |
| 珠三角城市群 | 5611.83 | 55570 | 1010 | 82.74 | ||||
| 京津冀城市群 | 8378.53 | 182501 | 459 | 59.95 | ||||
| 指标标准 | ≥5000 | ≥60000 | ≥600 | ≥60 | - | - | ||
| 区域级 | 山东半岛城市群 | 4375.53 | 74074 | 591 | 57.77 | 34.27 | 28.62 | 5 |
| 辽东半岛城市群 | 4070.16 | 127469 | 319 | 63.95 | ||||
| 武汉城市群 | 3024.29 | 58066 | 521 | 55.95 | ||||
| 中原城市群 | 4153.14 | 58840 | 706 | 45.73 | ||||
| 成渝城市群 | 9895.13 | 252073 | 393 | 45.66 | ||||
| 指标标准 | ≥3000 | ≥50000 | ≥400 | ≥55 | - | - | ||
| 次区域级 | 海峡西岸城市群 | 2918.57 | 56098 | 520 | 59.23 | 17.99 | 13.60 | 6 |
| 长株潭城市群 | 1464.83 | 28078 | 522 | 56.82 | ||||
| 江淮城市群 | 3569.00 | 86172 | 414 | 48.71 | ||||
| 环鄱阳湖城市群 | 1906.35 | 57832 | 330 | 49.13 | ||||
| 关中城市群 | 2319.98 | 55451 | 418 | 49.99 | ||||
| 南北钦防城市群 | 1214.75 | 42514 | 286 | 46.33 | ||||
| 指标标准 | ≥1500 | ≥30000 | ≥300 | ≥50 | - | - | ||
| 地区级 | 哈大长城市群 | 3388.04 | 185576 | 183 | 54.81 | 15.30 | 11.83 | 9 |
| 晋中城市群 | 881.95 | 27925 | 316 | 64.89 | ||||
| 呼包鄂城市群 | 745.77 | 131744 | 57 | 70.35 | ||||
| 银川平原城市群 | 507.32 | 52170 | 97 | 54.06 | ||||
| 酒嘉玉城市群 | 132.69 | 196909 | 7 | 58.15 | ||||
| 黔中城市群 | 1946.35 | 104597 | 186 | 34.61 | ||||
| 天山北坡城市群 | 392.76 | 31721 | 124 | 87.84 | ||||
| 兰白西城市群 | 1217.90 | 70398 | 173 | 45.29 | ||||
| 滇中城市群 | 2177.61 | 94204 | 231 | 43.75 | ||||
| 指标标准 | ≥500 | ≥20000 | ≥200 | ≥45 | - | - | ||
Tab.3 Attention frequency on the main features of urban agglomerations表3 国内外学者对城市群主要特征关注频度统计表 |
| 时间 | 提出者 | 层级结构/多中心特征 | 外部通达性及内部连通性 | 内聚力特征 | 辐射影响范围 | 经济与社会联系特征 |
|---|---|---|---|---|---|---|
| 1910 | 库恩 | ▲ | ▲ | |||
| 1915 | 盖迪斯 | ▲ | ||||
| 1951 | 英国政府 | ▲ | ▲ | |||
| 1956 | 卡罗尔 | ▲ | ▲ | |||
| 1957 | 戈特曼 | ▲ | ▲ | ▲ | ||
| 1960 | 日本政府 | ▲ | ▲ | |||
| 1978 | 帕佩约阿鲁 | ▲ | ▲ | ▲ | ||
| 1987 | 麦吉 | ▲ | ▲ | ▲ | ||
| 1990 | 美国政府 | ▲ | ▲ | ▲ | ||
| 1990年代 | 卡斯特尔斯、帕尔等 | ▲ | ▲ | |||
| 1990 | 高汝熹 | ▲ | ▲ | ▲ | ||
| 1991 | 周一星 | ▲ | ▲ | ▲ | ▲ | |
| 2000 | 张京祥 | ▲ | ▲ | ▲ | ||
| 1998 | 姚士谋 | ▲ | ▲ | ▲ | ▲ | ▲ |
| 2007 | 顾朝林 | ▲ | ▲ | |||
| 2009 | 方创琳 | ▲ | ▲ | ▲ | ▲ | |
| 使用频数 | 9 | 12 | 10 | 6 | 7 | |
注:该表为作者依据相关资料整理而得,其中库恩、盖迪斯、英国政府、卡罗尔、帕佩约阿鲁、卡斯特尔斯、帕尔、高汝熹的观点引自史育龙等, 刘荣增, 姚士谋等,罗海明等的研究成果(史育龙等, 1997; 刘荣增, 2003; 姚士谋等, 2006; 罗海明等, 2007)。 |
Tab.4 Index system of quantitative classification for urban agglomerations表4 城市群类型定量划分的指标体系 |
| 目标层 | 因素解释 | 因子层 | 指标层 | 指标代码 | 指标解释及计算方法 |
|---|---|---|---|---|---|
| 开放程度 | 衡量城市群融入全球经济体系程度的重要因子 | 全球化程度 | 经济外向度 | L1 | 城市群进出口贸易总额与城市群国内生产总值之比 |
| 外资利用程度 | L2 | 城市实际使用外资占固定资产投资额的比重 | |||
| 发育程度 | 反映城市群的城市群发展综合水平,表征吸引外部要素的聚集能力,是城市群进一步发展发育的基础 | 要素集聚度 | 经济集聚指数 | L3 | 城市群人均GDP与地均GDP(经济密度)之积的平方根 |
| 人口集聚指数 | L4 | 城市常住人口与城市户籍人口之差与城市群常住人口之比 | |||
| 联通程度 | 航空联系度 | L5 | 城市群内所有民航机场的航空旅客吞吐量 | ||
| 铁路联系度 | L6 | 城市群内前三位城市(人口)的火车站客车发车对数 | |||
| 信息联系度 | L7 | 城市群移动电话拥有量、邮政业务总量、电信业务总量之积的三次方根 | |||
| 公路联系度 | L8 | 城市群内公路里程与城市群区域土地面积之比 | |||
| 城镇化率 | 人口城镇化率 | L9 | 城市群城镇人口占常驻总人口比重(或城市群非农业人口占常驻总人口的比例) | ||
| 土地城镇化率 | L10 | 城市群识别面积与城市群规划面积之比 | |||
| 分散程度 | 反映城市群内部经济社会要素分散化程度,是从城市群区域尺度衡量多中心化发展结果的重要因子 | 要素均衡分布 | 人口多中心度 | L11 | 城市群内各城市人口规模四城市指数。计算方法采用四城市指数P1/(P2+P3+P4) |
| 经济多中心度 | L12 | 城市群内各城市经济规模四城市指数。计算方法采用四城市指数P1/(P2+P3+P5) | |||
| 产业结构 | 从就业人口角度,反映城市群内部的产业结构 | 工业结构 | 一般加工制造业就业比重 | L13 | 机械、化工、纺织、服装、食品、造纸等制造业就业人口比重 |
| 能源原材料产业就业比重 | L14 | 采矿业、电力、燃气、供水等能源原材料产业的就业人口比重 | |||
| 服务业结构 | 交通金融商贸房地产就业比重 | L15 | 交通运输及仓储、金融业、批发和零售商贸业、房地产业等产业的就业人口比重 | ||
| 计算机科研技术就业比重 | L16 | 信息传输、软件业、科学研究、技术服务等行业的就业比重 | |||
| 居民公共服务业就业比重 | L17 | 住宿餐饮业、租赁业、教育业、文化娱乐业、体育业的就业人口比重 | |||
| 资环效应 | 反映城市群经济发展的环境效应与资源利用效率 | 物耗水平 | 工业增加值率 | L18 | 规模以上工业增加值与规模以上工业总产值之比 |
| 环境污染水平 | 空气污染指数 | L19 | 城市群各城市年均PM2.5的平均浓度值 | ||
| 污染排放指数 | L20 | 城市群工业SO2排放总量与工业烟尘排放总量乘积的平方根与城市群GDP之比 | |||
| 资源利用效率 | 单位产值能耗 | L21 | 城市群能源消耗总量与城市群GDP之比 | ||
| 单位产值水耗 | L22 | 城市群水资源消耗总量与城市群GDP之比 |
Tab.5 Values of the five main characteristics of Chinese urban agglomerations表5 中国城市群五大特征得分汇总表 |
| 序号 | 城市群名称 | 开放程度 | 发育程度 | 分散程度 | 产业结构 | 资环效应 |
|---|---|---|---|---|---|---|
| 指标性质 | 正向 | 正向 | 负向 | 正向 | 负向 | |
| 1 | 长江三角洲城市群 | 80.63 | 100.00 | 24.95 | 80.74 | 75.98 |
| 2 | 珠江三角洲城市群 | 100.00 | 98.90 | 4.59 | 100.00 | 73.13 |
| 3 | 京津冀城市群 | 51.81 | 56.25 | 17.03 | 90.49 | 67.99 |
| 4 | 山东半岛城市群 | 30.37 | 48.31 | 0.00 | 57.53 | 62.85 |
| 5 | 辽东半岛城市群 | 49.38 | 37.57 | 10.85 | 34.15 | 59.07 |
| 6 | 海峡西岸城市群 | 47.43 | 35.28 | 5.11 | 75.71 | 30.01 |
| 7 | 长株潭城市群 | 21.99 | 40.20 | 47.41 | 38.43 | 30.28 |
| 8 | 武汉城市群 | 23.33 | 31.56 | 78.36 | 31.54 | 64.38 |
| 9 | 哈大长城市群 | 9.96 | 26.56 | 4.54 | 37.43 | 29.90 |
| 10 | 中原城市群 | 15.79 | 20.97 | 14.64 | 17.23 | 63.42 |
| 11 | 江淮城市群 | 19.01 | 19.39 | 15.29 | 22.44 | 65.95 |
| 12 | 环鄱阳湖城市群 | 28.65 | 15.70 | 20.68 | 23.95 | 51.89 |
| 13 | 晋中城市群 | 12.31 | 27.42 | 35.85 | 12.54 | 65.11 |
| 14 | 成渝城市群 | 23.97 | 24.56 | 37.23 | 16.49 | 48.89 |
| 15 | 南北钦防城市群 | 11.50 | 15.49 | 59.24 | 43.57 | 34.60 |
| 16 | 关中城市群 | 11.19 | 22.03 | 29.24 | 52.04 | 47.39 |
| 17 | 呼包鄂城市群 | 19.77 | 31.14 | 0.22 | 34.11 | 0.00 |
| 18 | 银川平原城市群 | 2.60 | 16.10 | 29.99 | 0.00 | 72.30 |
| 19 | 黔中城市群 | 2.55 | 0.00 | 11.18 | 22.76 | 50.18 |
| 20 | 天山北坡城市群 | 14.22 | 46.42 | 100.00 | 16.65 | 74.80 |
| 21 | 兰白西城市群 | 0.68 | 10.45 | 22.30 | 28.34 | 100.00 |
| 22 | 滇中城市群 | 14.01 | 11.75 | 20.64 | 38.13 | 13.25 |
Tab.6 Average scores of the main characteristics of the five types of urban agglomeration of China表6 中国5类城市群特征平均得分与类型归纳 |
| 类型 | 特征 | 开放程度 | 发育程度 | 分散程度 | 产业结构 | 资环效应 | 类型归纳 | 包括城市群 |
|---|---|---|---|---|---|---|---|---|
| Ⅰ型(2个) | 均值 | 90.32 | 99.45 | 14.77 | 90.37 | 74.56 | 成熟外向型 | 长三角、珠三角 |
| 离差 | 19.37 | 1.10 | 20.36 | 19.26 | 2.85 | |||
| Ⅱ型(5个) | 均值 | 40.59 | 40.39 | 14.04 | 54.87 | 53.76 | 双核驱动型 | 京津冀、山东半岛、辽东半岛、海峡西岸、成渝 |
| 离差 | 27.84 | 31.69 | 37.23 | 74.00 | 37.98 | |||
| Ⅲ型(5个) | 均值 | 15.45 | 25.03 | 26.41 | 38.33 | 21.61 | 环境友好型 | 长株潭、哈大长、南北钦防、呼包鄂、滇中 |
| 离差 | 12.03 | 28.45 | 59.02 | 9.46 | 34.60 | |||
| Ⅳ型(2个) | 均值 | 18.78 | 38.99 | 89.18 | 24.10 | 69.59 | 单核辐射型 | 武汉、天山北坡 |
| 离差 | 9.11 | 14.86 | 21.64 | 14.89 | 10.42 | |||
| Ⅴ型(8个) | 均值 | 11.60 | 16.51 | 22.40 | 22.41 | 64.53 | 内陆粗放型 | 中原、江淮、环鄱阳、晋中、关中、银川平原、黔中、兰白西 |
| 离差 | 27.97 | 27.42 | 24.67 | 52.04 | 52.61 |
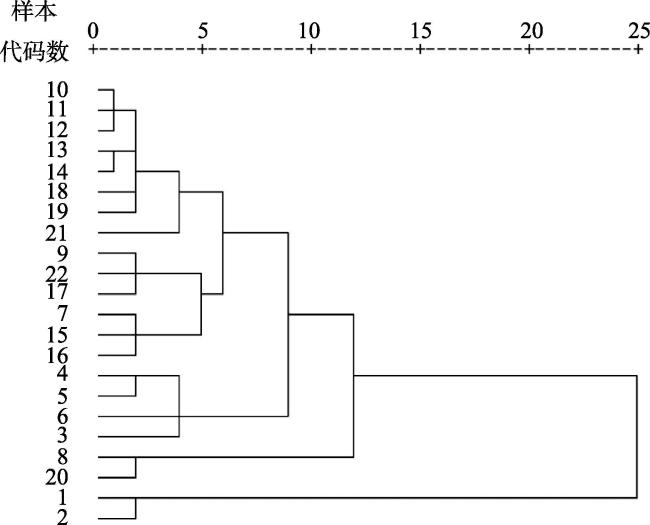
Fig.1 Q type clustering dendrogram of China's 22 urban agglomerations图1 中国22个城市群Q型聚类树状图 |
Tab.7 Classification of china's urban agglomerations表7 中国22个城市群的综合分类结果 |
| 等级/类别 | 成熟外向型 | 双核赶超型 | 环境友好型 | 单核辐射型 | 内陆粗放型 | 合计 |
|---|---|---|---|---|---|---|
| 国家级 | 长三角、珠三角 | 京津冀 | 3 | |||
| 区域级 | 山东半岛、辽东半岛、海峡西岸、成渝 | 武汉 | 5 | |||
| 次区域 | 长株潭、南北钦防 | 中原、江淮、环鄱阳湖、关中 | 6 | |||
| 地区级 | 哈大长、呼包鄂、滇中 | 天山北坡 | 晋中、银川平原、黔中、兰白西 | 8 | ||
| 合计 | 2 | 5 | 5 | 2 | 8 | 22 |
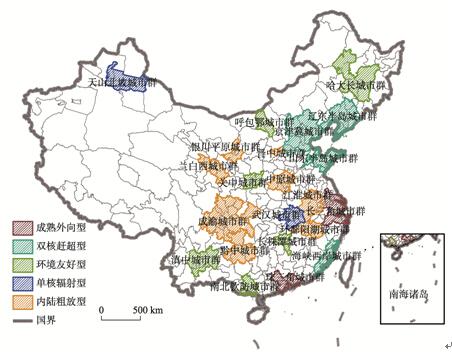
Fig.2 Spatial distribution of China's urban agglomerations图2 中国城市群类型空间分布图 |
The authors have declared that no competing interests exist.
| 1 |
埃比尼泽·霍华德. 2000. 明日的田园城市[M]. 金经元, 译. 北京: 商务印书馆.
[
|
| 2 |
长南成明. 2001. 都市圈最近几年的人口动态[J]. 日本投资政策银行, (9): 2-5.
[
|
| 3 |
[
|
| 4 |
[
|
| 5 |
[
|
| 6 |
[
|
| 7 |
[
|
| 8 |
[
|
| 9 |
富田和晓. 1995. 大都市圈构造的变化[M]. 东京: 古今书院.
[
|
| 10 |
[
|
| 11 |
[
|
| 12 |
[
|
| 13 |
[
|
| 14 |
[
|
| 15 |
[
|
| 16 |
[
|
| 17 |
[
|
| 18 |
[
|
| 19 |
[
|
| 20 |
[
|
| 21 |
[
|
| 22 |
[
|
| 23 |
[
|
| 24 |
[
|
| 25 |
[
|
| 26 |
[
|
| 27 |
[
|
| 28 |
[
|
| 29 |
[
|
| 30 |
[
|
| 31 |
[
|
| 32 |
|
| 33 |
|
| 34 |
|
| 35 |
|
| 36 |
|
| 37 |
|
| 38 |
|
| 39 |
|
| 40 |
|
/
| 〈 |
|
〉 |