
Applicability analysis of the TRMM precipitation data in the Sichuan-Chongqing region
Online published: 2014-10-25
Copyright
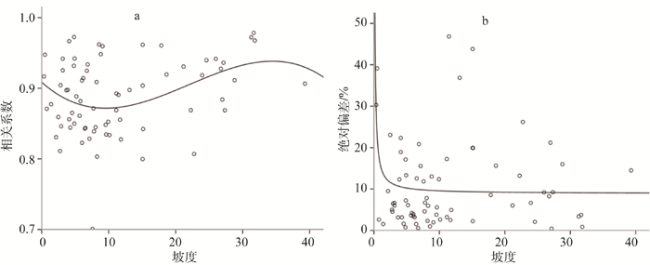
Precipitation data is often needed for hydrological, meteorological, ecological, and other environmental and geographic applications. Currently there are mainly two sources of precipitation estimates: observation at meteorological stations and remote sensing data. However, a large number of studies has demonstrated that measurements at conventional meteorological stations are point data and they cannot reflect the spatial variation of precipitation effectively, especially in areas of more complex terrain. Remote sensing technology, on the other hand, is able to produce reasonably high resolution gridded precipitation fields. Precipitation products obtained by satellites have been widely used in previous studies in the world. The Sichuan-Chongqing region is a typical area with complicated terrain and climate characteristics. The meteorological stations are very unevenly distributed in this region, especially in the western area. Precipitation estimation using satellite data provides potential alternatives to precipitation measurements in this region. In this study,the performance of the TRMM (Tropical Rainfall Measurement Mission) 3B43 monthly precipitation data over 2000-2011 was evaluated in the Sichuan-Chongqing region with rainfall records from 72 meteorological stations at different time intervals. The influence of elevation and slope on the verification result was analyzed at the monthly scale. Finally, principal component analysis was used to compare the effects of elevation and slope on the accuracy of TRMM 3B43 precipitation estimates. The results show that: (1) Regional average annual precipitation estimated by TRMM 3B43 is higher than the observed data from meteorological stations by 5.38%, and the eastern area estimation results are less accurate than the western plateau. Goodness of fit of seasonal precipitation between TRMM 3B43 estimates and observed data is high, but varies between the seasons—the goodness of fit of spring precipitation is higher than other seasons. Correlation between observations at the 72 stations and TRMM 3B43 estimates is high and shows little numerical biases in the whole study area at the monthly scale. (2) For individual stations, at most stations the correlation coefficients are reasonably high and the estimation biases are small, but the correlation coefficient at the Xuyong Station is comparatively low and the estimation biases at the Xiaojin Station, Yaan Station, Leibo Station, Yanyuan Station, and Panzhihua Station are comparatively high. (3) Compared with slope, elevation has greater influence on the accuracy of TRMM 3B43 estimates, which can be characterized by a cubic nonlinear relationship. With the increase of Elevation, R shows an increasing trend and |Bias(%)| increases-decreases-increases. (4) The influence of slope on the accuracy of TRMM 3B43 estimates is more complicated. Generally speaking, slope significantly affects the accuracy of TRMM 3B43 estimates
Key words: TRMM 3B43; precipitation; complex terrain; Sichuan-Chongqing region
JI Tao , YANG Hua , LIU Rui , HE Tairong , WU Jianfeng . Applicability analysis of the TRMM precipitation data in the Sichuan-Chongqing region[J]. PROGRESS IN GEOGRAPHY, 2014 , 33(10) : 1375 -1386 . DOI: 10.11820/dlkxjz.2014.10.009
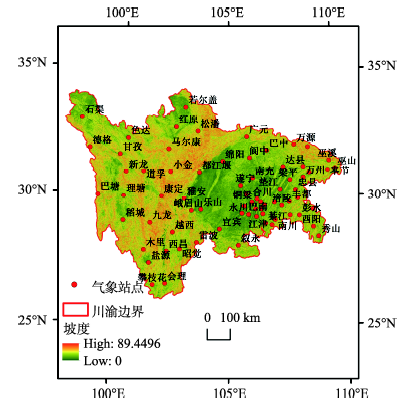
Fig.1 Sichuan-Chongqing region and the distribution of the 72 meteorological stations图1 川渝地区概况以及72个气象站点的分布 |
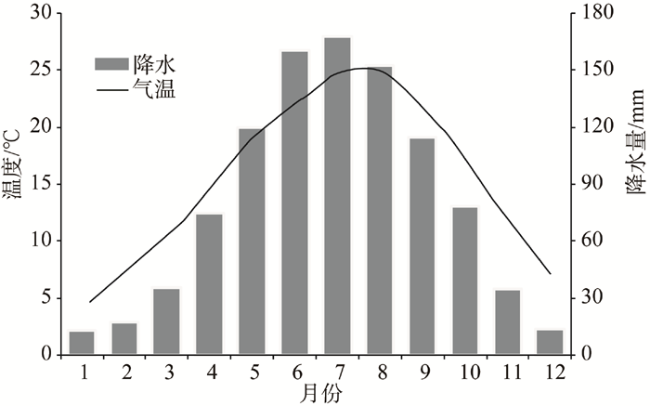
Fig.2 Monthly average precipitation and temperature of Sichuan-Chongqing region图2 川渝地区各月平均降水量和气温 |
 ,
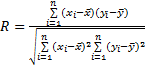
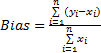
,  ,n为样本容量,xi、yi分别为气象站点实测数据和TRMM 3B43降水数据。R取值范围[0~1],越接近于1,数据一致性越好。Bias反映了TRMM降水数据与站点实测降水值在数值上的偏离程度,Bias越接近0,则说明数据越精确(下文提到的|Bias(%)|表示的是绝对误差,是Bias的绝对值,也能反映TRMM降水数据与站点实测降水值在数值上的偏离程度)。
Tab.1 Comparison of average annual precipitation between TRMM 3B43 and observed data from the 72 meteorological stations, 2000-2011表1 2000-2011年72个气象站点年均降水量与TRMM 3B43对应像元年平均降水量对比 |
| 气象站 | 气象站年降水量/mm | TRMM年降水量/mm | Bias/% | 气象站 | 气象站年降水量/mm | TRMM年降水量/mm | Bias/% |
|---|---|---|---|---|---|---|---|
| 城口 | 1276.5 | 1269.5 | -0.55 | 德格 | 601.0 | 580.6 | -3.39 |
| 开县 | 1279.8 | 1360.9 | 6.34 | 甘孜 | 629.5 | 640.9 | 1.81 |
| 云阳 | 1164.2 | 1316.5 | 13.08 | 色达 | 663.5 | 678.0 | 2.20 |
| 巫溪 | 1112.6 | 1289.3 | 15.88 | 道孚 | 585.5 | 695.9 | 18.87 |
| 奉节 | 1070.6 | 1295.8 | 21.03 | 马尔康 | 766.3 | 835.6 | 9.05 |
| 巫山 | 1018.2 | 1244.3 | 22.21 | 红原 | 705.0 | 715.0 | 1.42 |
| 潼南 | 949.9 | 1006.1 | 5.92 | 小金 | 631.6 | 862.9 | 36.63 |
| 垫江 | 1123.2 | 1177.2 | 4.81 | 松潘 | 704.1 | 750.3 | 6.56 |
| 梁平 | 1154.5 | 1222.5 | 5.90 | 都江堰 | 1047.4 | 805.2 | -23.13 |
| 万州 | 1147.7 | 1325.0 | 15.45 | 绵阳 | 836.8 | 840.9 | 0.50 |
| 忠县 | 1130.7 | 1233.7 | 9.12 | 巴塘 | 488.1 | 564.3 | 15.61 |
| 石柱 | 1025.2 | 1285.9 | 25.43 | 新龙 | 649.6 | 643.0 | -1.00 |
| 大足 | 980.2 | 1004.1 | 2.43 | 理塘 | 765.1 | 634.0 | -17.13 |
| 荣昌 | 957.6 | 986.2 | 2.99 | 雅安 | 1618.9 | 1127.5 | -30.36 |
| 永川 | 923.5 | 988.6 | 7.05 | 稻城 | 663.2 | 657.5 | -0.86 |
| 万盛 | 1237.7 | 1023.0 | -17.35 | 康定 | 865.1 | 882.8 | 2.04 |
| 铜梁 | 1036.2 | 995.1 | -3.97 | 峨眉山 | 1545.8 | 1321.1 | -14.54 |
| 北碚 | 1099.7 | 1047.5 | -4.75 | 乐山 | 1147.1 | 1288.1 | 12.30 |
| 合川 | 1095.4 | 1047.5 | -4.37 | 木里 | 761.1 | 919.5 | 20.82 |
| 渝北 | 1091.0 | 1050.1 | -3.75 | 九龙 | 926.8 | 892.1 | -3.74 |
| 璧山 | 1069.0 | 1019.2 | -4.66 | 越西 | 1074.8 | 1216.3 | 13.17 |
| 沙坪坝 | 1067.8 | 1050.1 | -1.66 | 昭觉 | 1009.7 | 1044.5 | 3.45 |
| 江津 | 940.2 | 1028.1 | 9.35 | 雷波 | 809.6 | 1188.1 | 46.75 |
| 巴南 | 1015.4 | 1046.1 | 3.02 | 宜宾 | 914.1 | 1025.7 | 12.21 |
| 南川 | 1024.5 | 1050.0 | 2.48 | 盐源 | 740.1 | 1029.5 | 39.10 |
| 长寿 | 1061.4 | 1101.6 | 3.79 | 西昌 | 965.1 | 1090.3 | 12.98 |
| 涪陵 | 1041.2 | 1091.7 | 4.85 | 攀枝花 | 815.2 | 1171.8 | 43.74 |
| 丰都 | 970.5 | 1162.6 | 19.79 | 会理 | 1088.4 | 1181.1 | 8.52 |
| 武隆 | 991.4 | 1186.5 | 19.68 | 广元 | 907.9 | 856.4 | -5.67 |
| 黔江 | 1140.4 | 1280.3 | 12.27 | 万源 | 1360.1 | 1268.1 | -6.77 |
| 彭水 | 1180.1 | 1248.5 | 5.79 | 阆中 | 1062.1 | 1026.9 | -3.31 |
| 綦江 | 964.8 | 1028.2 | 6.57 | 巴中 | 1150.7 | 1112.3 | -3.33 |
| 酉阳 | 1302.2 | 1270.8 | -2.42 | 达县 | 1261.8 | 1336.2 | 5.90 |
| 秀山 | 1318.8 | 1283.6 | -2.68 | 遂宁 | 932.3 | 1003.4 | 7.62 |
| 石渠 | 563.1 | 516.7 | -8.25 | 南充 | 1006.4 | 1021.1 | 1.46 |
| 若尔盖 | 627.2 | 621.9 | -0.83 | 叙永 | 1078.3 | 949.3 | -11.96 |
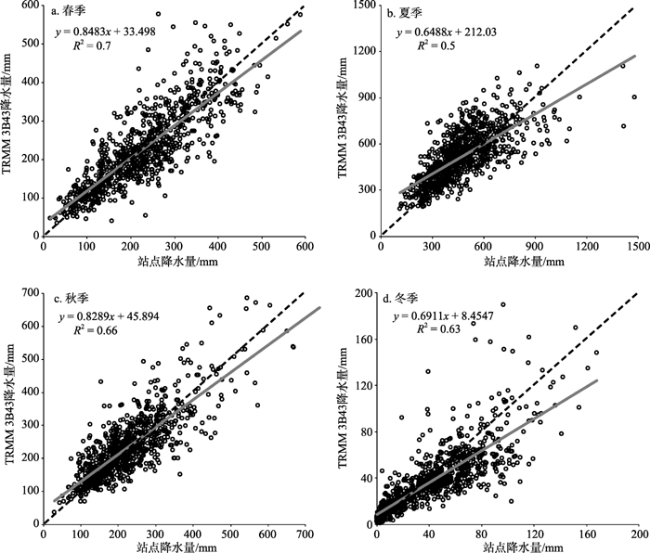
Fig.3 Scatter diagram of seasonal precipitation between TRMM 3B43 and corresponding meteorological stations data, 2000-2011图3 2000-2011年TRMM 3B43与地面观测站各季降水量散点图 |
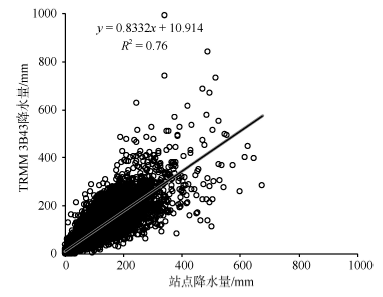
Fig.4 Scatter diagram of monthly precipitation between TRMM 3B43 and corresponding meteorological stations data, 2000-2011图4 2000-2011年TRMM 3B43与地面观测站月降水量散点图 |
Tab.2 Correlation coefficient of average monthly precipitations between TRMM 3B43 and corresponding meteorological station data in Sichuan-Chongqing region, 2000-2011表2 2000-2011年川渝地区基于月平均降水量的TRMM 3B43 数据与站点实测值的相关系数 |
| 站点 | R | 站点 | R | 站点 | R | 站点 | R |
|---|---|---|---|---|---|---|---|
| 城口 | 0.936 | 合川 | 0.882 | 德格 | 0.972 | 木里 | 0.934 |
| 开县 | 0.846 | 渝北 | 0.861 | 甘孜 | 0.960 | 九龙 | 0.978 |
| 云阳 | 0.869 | 璧山 | 0.904 | 色达 | 0.962 | 越西 | 0.942 |
| 巫溪 | 0.911 | 沙坪坝 | 0.877 | 道孚 | 0.967 | 昭觉 | 0.911 |
| 奉节 | 0.884 | 江津 | 0.831 | 马尔康 | 0.942 | 雷波 | 0.891 |
| 巫山 | 0.856 | 巴南 | 0.844 | 红原 | 0.843 | 宜宾 | 0.898 |
| 潼南 | 0.888 | 南川 | 0.834 | 小金 | 0.898 | 盐源 | 0.948 |
| 垫江 | 0.828 | 长寿 | 0.823 | 松潘 | 0.918 | 西昌 | 0.948 |
| 梁平 | 0.925 | 涪陵 | 0.811 | 都江堰 | 0.859 | 攀枝花 | 0.904 |
| 万州 | 0.828 | 丰都 | 0.800 | 绵阳 | 0.925 | 会理 | 0.961 |
| 忠县 | 0.869 | 武隆 | 0.842 | 巴塘 | 0.920 | 广元 | 0.835 |
| 石柱 | 0.807 | 黔江 | 0.844 | 新龙 | 0.962 | 万源 | 0.942 |
| 大足 | 0.871 | 彭水 | 0.803 | 理塘 | 0.973 | 阆中 | 0.914 |
| 荣昌 | 0.897 | 綦江 | 0.839 | 雅安 | 0.917 | 巴中 | 0.893 |
| 永川 | 0.850 | 酉阳 | 0.909 | 稻城 | 0.968 | 达县 | 0.931 |
| 万盛 | 0.869 | 秀山 | 0.856 | 康定 | 0.940 | 遂宁 | 0.845 |
| 铜梁 | 0.848 | 石渠 | 0.928 | 峨眉山 | 0.907 | 南充 | 0.865 |
| 北碚 | 0.872 | 若尔盖 | 0.932 | 乐山 | 0.853 | 叙永 | 0.701 |
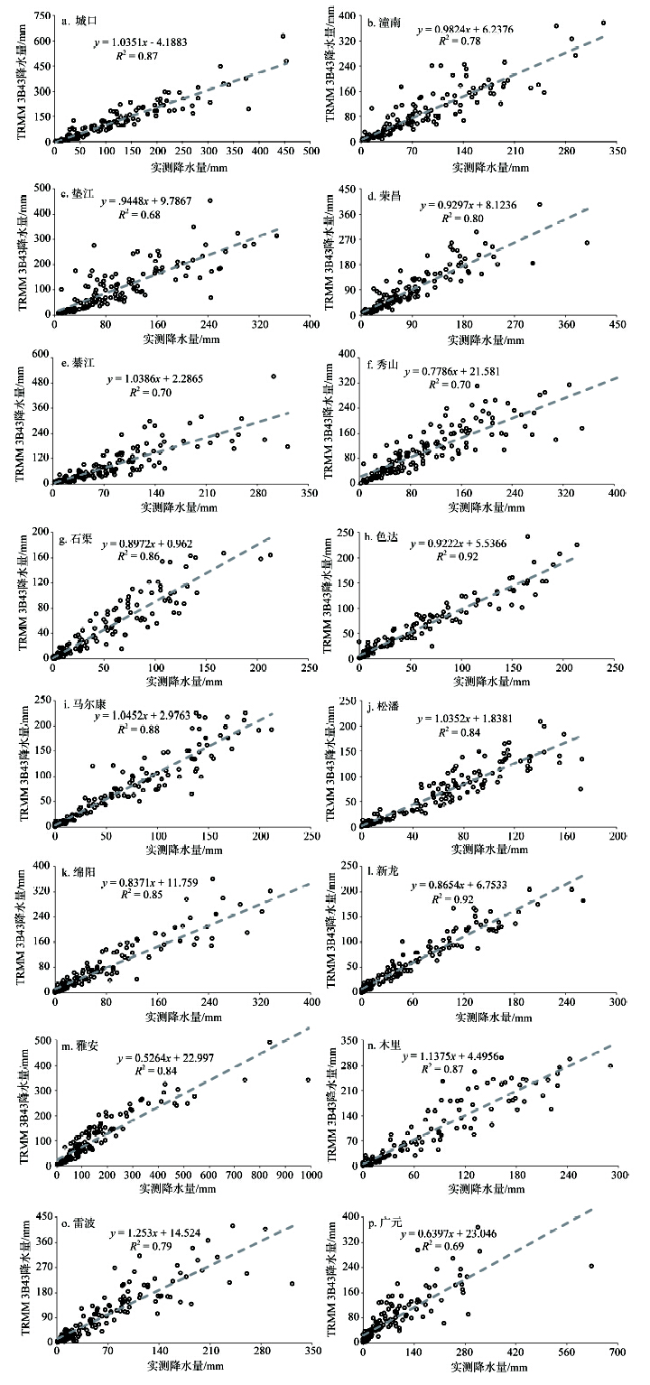
Fig.5 Scatter diagram of monthly precipitation between TRMM 3B43 and observed corresponding meteorological station data in Sichuan-Chongqing region, 2000-2011图5 川渝地区部分站点2000-2011年TRMM 3B43与实测月降水量散点图 |
Tab.3 Bias of monthly precipitation between TRMM 3B43 and observed corresponding meteorological station data in Sichuan-Chongqing region, 2000-2011表3 2000-2011年川渝地区TRMM 3B43与各地面实测站点月降水的相对误差 |
| 站点 | Bias/% | 站点 | Bias/% | 站点 | Bias/% | 站点 | Bias/% |
|---|---|---|---|---|---|---|---|
| 城口 | -0.43 | 合川 | -4.21 | 德格 | -3.36 | 木里 | 20.84 |
| 开县 | 6.47 | 渝北 | -3.62 | 甘孜 | 1.92 | 九龙 | -3.73 |
| 云阳 | 13.21 | 璧山 | -4.52 | 色达 | 2.24 | 越西 | 13.30 |
| 巫溪 | 16.00 | 沙坪坝 | -1.53 | 道孚 | 18.93 | 昭觉 | 3.50 |
| 奉节 | 21.17 | 江津 | 9.49 | 马尔康 | 9.18 | 雷波 | 46.83 |
| 巫山 | 22.33 | 巴南 | 3.15 | 红原 | 1.53 | 宜宾 | 12.31 |
| 潼南 | 6.12 | 南川 | 2.60 | 小金 | 36.85 | 盐源 | 39.13 |
| 垫江 | 4.93 | 长寿 | 3.94 | 松潘 | 6.65 | 西昌 | 13.01 |
| 梁平 | 6.01 | 涪陵 | 4.97 | 都江堰 | -23.05 | 攀枝花 | 43.82 |
| 万州 | 15.56 | 丰都 | 19.92 | 绵阳 | 0.57 | 会理 | 8.55 |
| 忠县 | 9.23 | 武隆 | 19.91 | 巴塘 | 15.63 | 广元 | -5.57 |
| 石柱 | 26.20 | 黔江 | 12.54 | 新龙 | -0.99 | 万源 | -6.65 |
| 大足 | 2.59 | 彭水 | 5.96 | 理塘 | -17.12 | 阆中 | -3.19 |
| 荣昌 | 3.15 | 綦江 | 6.71 | 雅安 | -30.32 | 巴中 | -3.19 |
| 永川 | 7.22 | 酉阳 | -2.30 | 稻城 | -0.85 | 达县 | 6.02 |
| 万盛 | -17.25 | 秀山 | -2.50 | 康定 | 2.07 | 遂宁 | 7.79 |
| 铜梁 | -3.80 | 石渠 | -8.23 | 峨眉山 | -14.49 | 南充 | 1.61 |
| 北碚 | -4.59 | 若尔盖 | -0.75 | 乐山 | 12.37 | 叙永 | -11.83 |
Tab.4 Model summary and parameter estimates of elevation, R and |Bias(%)| in Sichuan-Chongqing region表4 川渝地区高程与相关系数、|Bias(%)|的回归模型检验及参数估算值 |
| 方程 | 回归模型检验 | 参数估算值 | ||||||||
|---|---|---|---|---|---|---|---|---|---|---|
| R2 | F | df1 | df2 | Sig. | Constant | b1 | b2 | b3 | ||
| 三次方 | 0.462 | 19.439 | 3 | 68 | .000 | 0.836 | 8.667E-5 | -2.536E-8 | 2.673E-12 | |
| 三次方 | 0.202 | 5.739 | 3 | 68 | .001 | -0.745 | 0.034 | -1.588E-5 | 1.911E-9 | |
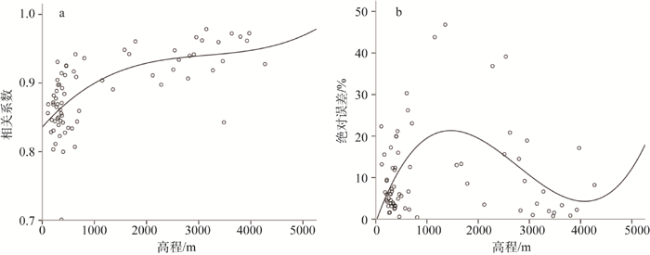
Fig.6 Scatter diagram of Elevation, R and |Bias(%)| in Sichuan-Chongqing region图6 川渝地区高程与相关系数R、绝对误差|Bias(%)|的散点图 |
Fig.7 Distribution of slope in Sichuan-Chongqing region图7 川渝地区坡度空间分布 |
Tab.5 Model summary and parameter estimates of slope, R and |Bias(%)|in Sichuan-Chongqing region表5 川渝地区坡度与相关系数、|Bias(%)|的回归模型检验及参数估算值 |
| 方程 | 回归模型检验 | 参数估算值 | ||||||||
|---|---|---|---|---|---|---|---|---|---|---|
| R2 | F | df1 | df2 | Sig. | Constant | b1 | b2 | b3 | ||
| 三次方 | 0.133 | 3.485 | 3 | 68 | .020 | 0.909 | -0.009 | 0.001 | -8.630E-6 | |
| 反函数 | 0.080 | 6.076 | 1 | 70 | .016 | 8.886 | 6.756 | |||
Fig.8 Scatter diagram of Slope, R and |Bias(%)| in Sichuan-Chongqing region图8 川渝地区坡度与相关系数R、|Bias(%)|的散点图 |
The authors have declared that no competing interests exist.
| [1] |
|
| [2] |
|
| [3] |
|
| [4] |
|
| [5] |
|
| [6] |
|
| [7] |
|
| [8] |
|
| [9] |
|
| [10] |
|
| [11] |
|
| [12] |
|
| [13] |
|
| [14] |
|
| [15] |
|
| [16] |
|
| [17] |
|
| [18] |
|
| [19] |
|
| [20] |
|
| [21] |
|
| [22] |
|
| [23] |
|
| [24] |
|
| [25] |
|
| [26] |
|
| [27] |
|
| [28] |
|
/
| 〈 |
|
〉 |
