
数字经济提升旅游经济韧性的作用机制及空间效应
|
朱静敏(1989— ),女,博士生,研究方向为旅游经济可持续发展。E-mail: zhujingmin@mail.dlut.edu.cn |
收稿日期: 2024-03-31
修回日期: 2024-08-21
网络出版日期: 2024-10-23
基金资助
国家社会科学基金项目(21GBL290)
Mechanism of impact and spatial effects of digital economy in enhancing tourism economic resilience
Received date: 2024-03-31
Revised date: 2024-08-21
Online published: 2024-10-23
Supported by
National Social Science Foundation of China(21GBL290)
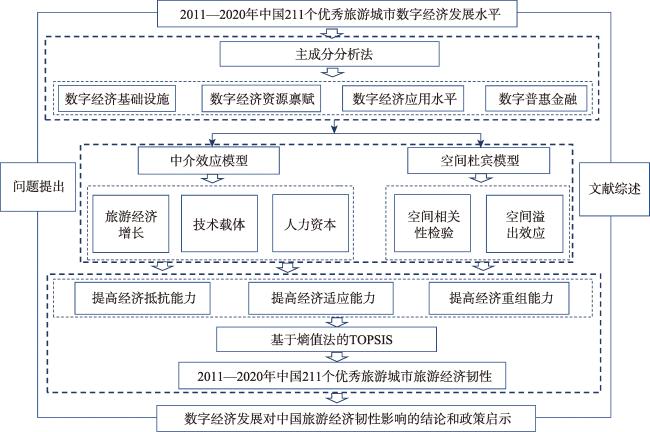
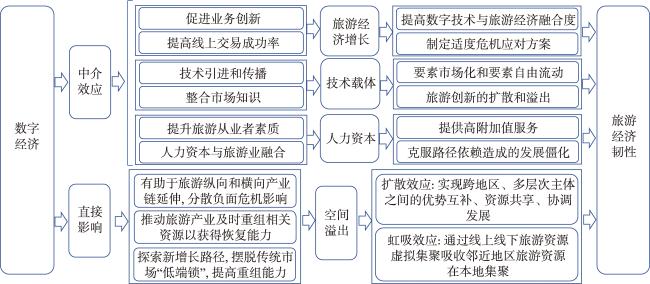
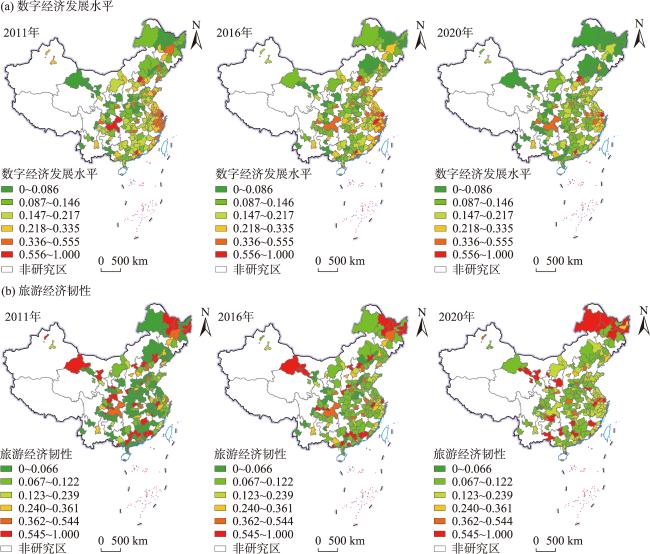
数字经济赋能旅游智慧化转型,成为中国旅游经济稳定可持续发展的新着力点。论文在厘清数字经济对旅游经济韧性的时空影响机理基础上,基于中国211个优秀旅游城市2011—2020年面板数据,采用中介效应模型、空间面板杜宾模型等方法检验了数字经济对旅游经济韧性的影响机制及空间溢出效应,研究发现:① 空间分布上,研究期内数字经济发展始终呈现出东高西低的分布态势,并在区域内呈“组团式”片状分布形态;旅游经济韧性在研究期内分布相对分散,东、中、西以及东北地区空间差距呈现收敛趋势;② 数字经济对旅游经济韧性产生显著的正向影响,数字经济发展水平每提高1个单位,旅游经济韧性提升0.2748,该结果通过了稳健性检验;③ 在数字经济对旅游经济韧性的影响机制方面,数字经济通过在抵抗力维度提高旅游经济增长水平、在恢复力维度提高技术载体和在重组能力维度提高人力资本从而促进旅游经济韧性的提升,即旅游经济增长、技术载体和人力资本是数字经济对旅游经济韧性产生显著正向影响的主要路径;④ 数字经济发展赋能了本地旅游经济韧性提升,但对相邻城市的旅游经济韧性产生“虹吸效应”。研究结果不仅丰富了数字经济作为旅游经济韧性的前置影响因素的研究,而且为数字经济赋能旅游经济高质量发展提供参考。
朱静敏 , 卢小丽 . 数字经济提升旅游经济韧性的作用机制及空间效应[J]. 地理科学进展, 2024 , 43(10) : 2004 -2020 . DOI: 10.18306/dlkxjz.2024.10.008
The digital economy enables the intelligent transformation of tourism, and has become a new focus for the stable and sustainable development of China's tourism economy. On the basis of clarifying the spatiotemporal mechanism of impact of the digital economy on tourism economic resilience, this study used the panel data from 211 excellent tourism cities in China from 2011 to 2020 and the mediation effect model and panel threshold spatial Durbin model to test the mechanism and spatial spillover effect of the digital economy impact on tourism economic resilience. The results show that: 1) Spatially, the development of the digital economy during the research period consistently showed a distribution trend of high in the east and low in the west, and exhibited a clustered patchy distribution pattern within regions; tourism economic resilience was relatively dispersed during the research period, and the spatial differences between the eastern, central, western, and northeastern regions showed a trend of convergence. 2) The digital economy had a significant positive impact on tourism economic resilience. For every 1 unit increase in the level of digital economy development, tourism economic resilience increased by 0.2748, which has passed the robustness test. 3) In terms of the mechanism of impact of the digital economy on tourism economic resilience, the digital economy promoted the improvement of tourism economic resilience by increasing the level of tourism economic growth in the dimension of resistance ability, improving the technology carrier in the dimension of recovery capacity, and improving human capital in the dimension of reorganization ability. That is, tourism economic growth, technology carrier, and human capital are the main paths through which the digital economy has a significant positive impact on tourism economic resilience. 4) The development of the digital economy has empowered the local tourism economy to enhance its resilience, but it has a siphon effect on tourism economic resilience of neighboring cities. The results of this study enrich the research on the antecedent factors affecting tourism economic resilience, and provide a reference for decision making based on the digital economy to empower high-quality development of the tourism economy.
表1 旅游经济韧性评价指标体系Tab.1 Tourism economic resilience evaluation indicator system |
| 系统层 | 准则层 | 一级指标 | 指标说明 | 单位 | 方向 |
|---|---|---|---|---|---|
| 旅游经济韧性指体系 | 抵抗力 | 旅游经济基础 | 第三产业产值/GDP | % | + |
| 人均可支配收入 | 元 | + | |||
| 旅游经济规模 | 旅游人均消费 | 万元 | + | ||
| 旅游经济脆弱程度 | 旅游人数/地区常住人口 | % | - | ||
| 旅游经济敏感程度 | 城镇登记失业人数 | 人 | - | ||
| 恢复力 | 旅游人力资本 | 批发和零售贸易从业人员数量 | 万人 | + | |
| 运输、仓储、邮政业从业人员数量 | 万人 | + | |||
| 住宿餐饮业从业人员数量 | 万人 | + | |||
| 社会服务从业者数量 | 万人 | + | |||
| 旅游消费潜力 | 年末城乡居民储蓄余额 | 万元 | + | ||
| 旅游经济集聚 | 旅游GDP/城市面积 | 亿元/km2 | + | ||
| 重组力 | 旅游结构合理化 | 旅游总收入/第三产业产值 | % | + | |
| 旅游结构高级化 | 入境旅游人数/旅游总人数 | % | + | ||
| 旅游创新能力 | 高等学校数量 | 所 | + | ||
| 旅游接待效率 | 旅游人数/客运总量 | % | + |
表2 数字经济发展水平评价指标体系Tab.2 Evaluation indicator system of the development level of the digital economy |
| 准则层 | 指标层及说明 | 单位 | 数据来源 |
|---|---|---|---|
| 数字经济基础设施 | 互联网宽带接入用户数 | 万户 | 《中国城市统计年鉴》 |
| 移动电话年末用户数 | 万户 | 《中国城市统计年鉴》 | |
| 年末固定电话用户数量 | 万户 | 《中国城市统计年鉴》 | |
| 科学技术支出 | 亿元 | 《中国城市统计年鉴》 | |
| 教育支出 | 亿元 | 《中国城市统计年鉴》 | |
| 数字经济创新禀赋 | 在校大学生人数 | 人 | 《中国城市统计年鉴》 |
| 信息传输、计算机、服务和软件业从业人员数量 | 万人 | 《中国城市统计年鉴》 | |
| 科研、技术服务和地质勘查业从业人员数量 | 万人 | 《中国城市统计年鉴》 | |
| 数字经济应用 | 电信业务总量 | 万元 | 《中国城市统计年鉴》 |
| 人均GDP | 万元 | 《中国城市统计年鉴》 | |
| 批发零售贸易业商品销售总额 | 万元 | 《中国城市统计年鉴》 | |
| 年末邮电局数量 | 所 | 《中国城市统计年鉴》 | |
| 数字普惠金融 | 数字普惠金融总指数 | — | 北京大学数字金融研究中心 |
| 数字普惠金融覆盖广度 | — | 北京大学数字金融研究中心 | |
| 数字普惠金融覆盖深度 | — | 北京大学数字金融研究中心 | |
| 数字支付 | — | 北京大学数字金融研究中心 | |
| 数字保险 | — | 北京大学数字金融研究中心 | |
| 数字信用 | — | 北京大学数字金融研究中心 | |
| 数字化水平 | — | 北京大学数字金融研究中心 |
表3 变量的描述性统计Tab.3 Descriptive statistics of variables |
| 变量 | 符号 | 样本量 | 平均值 | 标准差 | 最小值 | 最大值 | 单位 |
|---|---|---|---|---|---|---|---|
| 旅游经济韧性 | tres | 2110 | 0.17634 | 0.14007 | 1.00e-07 | 1.00000 | — |
| 数字经济(主成分分析) | dig | 2110 | 0.20371 | 0.07551 | 0.12085 | 0.73661 | — |
| 数字经济(熵值法) | dig2 | 2110 | 0.14144 | 0.11673 | 0.01914 | 0.64021 | — |
| 旅游经济增长 | lvgdp | 2110 | 490.237 | 654.813 | 1.30000 | 5866.20 | 亿元 |
| 技术载体 | fiber | 2110 | 52148.9 | 71918.8 | 9.09936 | 805605 | km |
| 人力资本 | work | 2110 | 0.04404 | 0.09064 | 0.00018 | 0.91310 | — |
| 城市人口集聚 | popd | 2110 | 485.020 | 378.342 | 5.10000 | 2926.70 | 万人/km2 |
| 经济发展密度 | densityGDP | 2110 | 34.1097 | 56.0086 | 0.10538 | 1385.58 | 万元/ km2 |
| 政府干预 | fis | 2110 | 4917744 | 7453557 | 167839 | 8.35e+07 | 万元 |
| 实际利用外资额 | fore | 2110 | 116125 | 235039 | 10.0000 | 2113444 | 万美元 |
| 产业结构高级化 | adindus | 2110 | 1.06840 | 0.61228 | 0.11356 | 5.35000 | — |
| 市场化指数 | market | 2110 | 11.8654 | 2.25050 | 4.95962 | 18.7400 | — |
| 交通通达度 | rode | 2110 | 0.45507 | 0.08741 | 0.21306 | 0.90759 | — |
| 城乡融合程度 | urban | 2110 | 0.45507 | 0.08741 | 0.21306 | 0.90759 | — |
表4 数字经济对旅游经济韧性影响的基础回归结果Tab.4 Benchmark regression results of the digital economy impact on tourism economic resilience |
| 变量 | (1) | (2) | (3) | (4) | (5) | (6) | (7) |
|---|---|---|---|---|---|---|---|
| tres | tres | tres | tres | tres | tres | tres | |
| dig | 0.3589*** | 0.3435*** | 0.3338*** | 0.3089*** | 0.2696*** | 0.2724*** | 0.2748*** |
| (30.6668) | (26.2373) | (23.7215) | (18.4550) | (15.9630) | (15.8296) | (15.9691) | |
| popd | 1.1e-05** | 2.6e-06 | -1.8e-06 | 3.2e-06 | 3.0e-06 | 3.1e-06 | |
| (2.4818) | (0.4745) | (-0.3225) | (0.5882) | (0.5671) | (0.5766) | ||
| ln densityGDP | 0.0054*** | 0.0064*** | 0.0047** | 0.0047** | 0.0047** | ||
| (2.7851) | (3.2373) | (2.4489) | (2.4036) | (2.4238) | |||
| fis | 8.0e-10*** | -8.1e-11 | -6.2e-11 | -6.4e-11 | |||
| (3.1965) | (-0.3117) | (-0.2360) | (-0.2438) | ||||
| fore | 6.6e-08*** | 6.6e-08*** | 6.6e-08*** | ||||
| (9.7531) | (9.7906) | (9.8144) | |||||
| adindus | 0.0013 | 0.0016 | |||||
| (0.5886) | (0.6861) | ||||||
| market | -0.0008 | ||||||
| (-0.9616) | |||||||
| 常数项 | 0.1285*** | 0.1262*** | 0.1185*** | 0.1208*** | 0.1266*** | 0.1250*** | 0.1318*** |
| (37.3986) | (35.2785) | (27.8986) | (28.2197) | (30.4095) | (27.1762) | (15.2581) | |
| 城市固定 | Yes | Yes | Yes | Yes | Yes | Yes | Yes |
| 时间固定 | Yes | Yes | Yes | Yes | Yes | Yes | Yes |
| 样本量 | 2110 | 2110 | 2110 | 2110 | 2110 | 2110 | 2110 |
注:***、**、*分别代表通过1%、5%、10%的显著性水平检验;括号中的数值为t统计值。下同。 |
表5 旅游经济增长、技术载体和人力资本的传导效应Tab.5 Transmission mechanisms of tourism economic growth, technology carriers, and human capital |
| 变量 | (1) | 旅游经济增长 | 技术载体 | 人力资本 | |||||
|---|---|---|---|---|---|---|---|---|---|
| (2) | (3) | (4) | (5) | (6) | (7) | ||||
| tres | ln lvgdp | tres | fiber | tres | work | tres | |||
| dig | 0.2748*** | 1.1576*** | 0.2324*** | 0.2886*** | 0.2450*** | 0.1675*** | 0.1056*** | ||
| (15.9691) | (4.5797) | (13.5195) | (11.6566) | (14.0308) | (13.4732) | (6.1822) | |||
| ln lvgdp | 0.0158*** | ||||||||
| (10.8282) | |||||||||
| fiber | 0.1014*** | ||||||||
| (7.3850) | |||||||||
| work | 0.5251*** | ||||||||
| (22.7626) | |||||||||
| 常数项 | 0.1318*** | 3.6171*** | 0.0780*** | -0.0243** | 0.1343*** | -0.0166* | 0.1504*** | ||
| (15.2581) | (21.2680) | (8.0487) | (-2.1596) | (15.7000) | (-1.8543) | (19.7997) | |||
| 城市固定 | Yes | Yes | Yes | Yes | Yes | Yes | Yes | ||
| 地区固定 | Yes | Yes | Yes | Yes | Yes | Yes | Yes | ||
| 控制变量 | Yes | Yes | Yes | Yes | Yes | Yes | Yes | ||
| 样本量 | 2110 | 2110 | 2110 | 2110 | 2110 | 2110 | 2110 | ||
表6 全局莫兰指数(Moran's I)检验结果Tab.6 Results of the global Moran's I tests |
| 年份 | 数字经济(W1) | 旅游经济韧性(W1) | 数字经济(W2) | 旅游经济韧性(W2) | |||||||
|---|---|---|---|---|---|---|---|---|---|---|---|
| Moran's I | z值 | Moran's I | z值 | Moran's I | z值 | Moran's I | z值 | ||||
| 2011 | 0.2306*** | 7.4358 | 0.0814*** | 2.8185 | 0.2272*** | 7.6258 | 0.0760*** | 2.7473 | |||
| 2012 | 0.2282*** | 7.4017 | 0.0897*** | 3.0391 | 0.2314*** | 7.8073 | 0.0694** | 2.4813 | |||
| 2013 | 0.2209*** | 7.2026 | 0.0799*** | 2.7099 | 0.2262*** | 7.6676 | 0.0390 | 1.4575 | |||
| 2014 | 0.2125*** | 6.9450 | 0.0826*** | 2.7998 | 0.2206*** | 7.4931 | 0.0471* | 1.7297 | |||
| 2015 | 0.2325*** | 7.4978 | 0.0802*** | 2.7200 | 0.2223*** | 7.4676 | 0.0461* | 1.6932 | |||
| 2016 | 0.2462*** | 7.9492 | 0.0905*** | 3.0654 | 0.2289*** | 7.7029 | 0.0719** | 2.5657 | |||
| 2017 | 0.2676*** | 8.5857 | 0.0801*** | 2.7359 | 0.2509*** | 8.3883 | 0.0571** | 2.0761 | |||
| 2018 | 0.1667*** | 5.5296 | 0.1406*** | 4.6941 | 0.1604*** | 5.5386 | 0.1646*** | 5.6893 | |||
| 2019 | 0.1374*** | 4.5844 | 0.2151*** | 6.9473 | 0.1220*** | 4.2540 | 0.2381*** | 7.9840 | |||
| 2020 | 0.1718*** | 5.6491 | 0.2050*** | 6.6110 | 0.1566*** | 5.3711 | 0.2272*** | 7.6059 | |||
表7 空间面板计量模型检验结果Tab.7 Test results of the spatial panel econometric model |
| 检验统计量 | 检验效应 | 统计值(W1) | P值(W1) | 统计值(W2) | P值(W2) |
|---|---|---|---|---|---|
| LM(LAG) | 空间滞后 | 64.719*** | <0.001 | 73.168*** | <0.001 |
| LM(ERR) | 空间误差 | 7.474*** | <0.001 | 10.136*** | <0.001 |
| R-LM(LAG) | 空间滞后 | 63.363*** | <0.01 | 69.739*** | <0.01 |
| R-LM(ERR) | 空间误差 | 6.109** | <0.05 | 6.707** | <0.05 |
| Wald(LAG) | 空间滞后 | 94.120*** | <0.001 | 28.720*** | <0.001 |
| Wald(ERR) | 空间误差 | 476.660*** | <0.001 | 9.750*** | <0.001 |
| LR(LAG) | 空间滞后 | 66.860*** | <0.001 | 95.280*** | <0.001 |
| LR(ERR) | 空间误差 | 52.500*** | <0.01 | 74.600*** | <0.001 |
| LR-test | 个体固定效应 | 1629.100*** | <0.001 | 1693.090*** | <0.001 |
| LR-test | 时间固定效应 | 236.530*** | <0.001 | 348.230*** | <0.001 |
| Hausman | 136.650*** | <0.001 | 143.560*** | <0.001 |
表8 空间杜宾模型回归结果Tab.8 Regression results of the panel threshold SPDM |
| 变量 | 直接效应(W1) | 直接效应(W2) | 空间溢出效应(W1) | 空间溢出效应(W2) |
|---|---|---|---|---|
| dig | 0.3627*** | 0.3113*** | -0.2962*** | -0.2256*** |
| (0.0251) | (0.0322) | (0.0305) | (0.0299) | |
| popd | 1.4e-05** | 8.4e-06 | -1.8e-05* | 5.7e-06 |
| (6.1e-06) | (6.4e-06) | (1.0e-05) | (8.6e-06) | |
| ln densityGDP | 8.8e-04 | 0.0019 | 9.8e-04 | 0.0063 |
| (0.0023) | (0.0024) | (0.0040) | (0.0042) | |
| fis | -1.2e-09*** | -9.6e-10*** | 4.3e-09*** | 2.3e-09*** |
| (2.9e-10) | (3.2e-10) | (7.4e-10) | (4.1e-10) | |
| fore | 6.1e-08*** | 6.2e-08*** | -3.5e-08* | -1.8e-08 |
| (6.8e-09) | (7.1e-09) | (1.9e-08) | (1.1e-08) | |
| adindus | 0.0024 | -5.9e-04 | -0.0118* | 0.0074 |
| (0.0027) | (0.0031) | (0.0062) | (0.0059) | |
| market | -0.0010 | -0.0012 | 0.0015 | -9.7e-04 |
| (0.0008) | (0.0009) | (0.0014) | (0.0015) | |
| σ2 | 7.1e-04*** | 7.4e-04*** | 7.1e-04*** | 7.4e-04*** |
| (2.7e-05) | (3.2e-05) | (2.7e-05) | (3.2e-05) | |
| ρ | 0.3959*** | 0.1705*** | 0.3959*** | 0.1705*** |
| (0.0334) | (0.0285) | (0.0334) | (0.0285) | |
| 时间固定 | Yes | Yes | Yes | Yes |
| 个体固定 | Yes | Yes | Yes | Yes |
| 样本量 | 2110 | 2110 | 2110 | 2110 |
表9 空间杜宾模型溢出效应分解结果Tab.9 Results of the SPDM spillover effect decomposition |
| 变量 | 直接效应(W1) | 直接效应(W2) | 间接效应(W1) | 间接效应(W2) | 总效应(W1) | 总效应(W2) |
|---|---|---|---|---|---|---|
| dig | 0.3557*** | 0.3097*** | -0.2422*** | -0.2037*** | 0.1136*** | 0.1060*** |
| (0.0251) | (0.0328) | (0.0371) | (0.0300) | (0.0328) | (0.0263) | |
| popd | 1.3e-05** | 8.3e-06 | -2.0e-05 | 8.8e-06 | -6.6e-06 | 1.7e-05 |
| (5.8e-06) | (6.1e-06) | (1.5e-05) | (1.0e-05) | (1.6e-05) | (1.1e-05) | |
| ln densityGDP | 0.0011 | 0.0022 | 0.0016 | 0.0074 | 0.0027 | 0.0096** |
| (0.0022) | (0.0023) | (0.0059) | (0.0047) | (0.0062) | (0.0049) | |
| fis | -1.0e-09*** | -9.3e-10*** | 6.2e-09*** | 2.5e-09*** | 5.2e-09*** | 1.6e-09*** |
| (2.8e-10) | (3.1e-10) | (1.2e-09) | (5.1e-10) | (1.3e-09) | (6.0e-10) | |
| fore | 6.0e-08*** | 6.2e-08*** | -2.0e-08 | -9.3e-09 | 4.0e-08 | 5.3e-08*** |
| (6.6e-09) | (6.9e-09) | (3.0e-08) | (1.2e-08) | (3.2e-08) | (1.5e-08) | |
| adindus | 0.0020 | -2.2e-04 | -0.0176* | 0.0086 | -0.0156 | 0.0084 |
| (0.0026) | (0.0031) | (0.0098) | (0.0072) | (0.0098) | (0.0072) | |
| market | -9.9e-04 | -0.0012 | 0.0017 | -0.0014 | 7.3e-04 | -0.0026 |
| (0.0008) | (0.0009) | (0.0021) | (0.0018) | (0.0021) | (0.0017) | |
| 时间固定 | Yes | Yes | Yes | Yes | Yes | Yes |
| 个体固定 | Yes | Yes | Yes | Yes | Yes | Yes |
| 样本量 | 2110 | 2110 | 2110 | 2110 | 2110 | 2110 |
表10 稳健性检验Tab.10 Robustness test results |
| 变量 | 替换解释 变量 | 剔除特殊 年份 | 剔除直辖市 样本 | 增加控制 变量 |
|---|---|---|---|---|
| dig2 | 0.1873*** (3.8151) | |||
| dig3 | 0.2818*** (16.6495) | |||
| dig4 | 0.1889*** (10.9962) | |||
| dig | 0.2802*** (16.3215) | |||
| rode | 0.2782*** (3.6883) | |||
| ln urban | -0.1345*** (-3.8621) | |||
| 地区固定 效应 | Yes | Yes | Yes | Yes |
| 时间固定 效应 | Yes | Yes | Yes | Yes |
| 控制变量 | Yes | Yes | Yes | Yes |
| 样本量 | 2110 | 1899 | 2070 | 2110 |
| R2 | 0.9202 | 0.9176 | 0.8685 | 0.8887 |
注:替换解释变量指替换变换计算方法后的数字经济;剔除特殊年份指除去2020年受疫情影响的年份;剔除直辖市样本指除去北京、天津、上海和重庆4个直辖市样本;增加控制变量指增加交通通达度(rode)和城乡融合程度(urban)。 |
| [1] |
马丽君, 敖烨. 数字经济对旅游业高质量发展的影响及空间溢出效应[J]. 地理科学进展, 2023, 42(12): 2296-2308.
[
|
| [2] |
王永贵, 高佳. 新冠疫情冲击、经济韧性与中国高质量发展[J]. 经济管理, 2020, 42(5): 5-17.
[
|
| [3] |
|
| [4] |
|
| [5] |
许宪春, 张美慧. 中国数字经济规模测算研究: 基于国际比较的视角[J]. 中国工业经济, 2020(5): 23-41.
[
|
| [6] |
于婷婷, 左冰. 信息化对旅游经济效率的影响及其作用机制研究[J]. 地理科学, 2022, 42(10): 1717-1726.
[
|
| [7] |
|
| [8] |
|
| [9] |
|
| [10] |
生延超, 谭左思, 李倩, 等. 数字经济能否促进黄河流域旅游经济韧性提升?[J]. 干旱区地理, 2023, 46(10): 1704-1713.
[
|
| [11] |
|
| [12] |
王龙杰, 曾国军, 毕斗斗. 信息化对旅游产业发展的空间溢出效应[J]. 地理学报, 2019, 74(2): 366-378.
[
|
| [13] |
荆文君, 孙宝文. 数字经济促进经济高质量发展: 一个理论分析框架[J]. 经济学家, 2019(2): 66-73.
[
|
| [14] |
杨勇, 眭霞芸, 刘震. 中国省际虚拟旅游流网络结构的空间演变特征研究[J]. 地理科学进展, 2022, 41(8): 1349-1363.
[
|
| [15] |
|
| [16] |
刘和东, 鲁晨曦. 创新生态系统韧性对经济高质量发展的影响[J]. 中国科技论坛, 2023(1): 48-57.
[
|
| [17] |
|
| [18] |
|
| [19] |
张思思, 马晓钰, 崔琪. 可持续发展、 数字经济与经济韧性互动关系的统计检验[J]. 统计与决策, 2023, 39(5): 92-97.
[
|
| [20] |
|
| [21] |
|
| [22] |
郭冬梅, 王继彬, 王韬, 等. 城市互联网发展对劳动力流动影响研究[J]. 管理评论, 2022, 34(10): 304-318.
[
|
| [23] |
赵涛, 张智, 梁上坤. 数字经济、 创业活跃度与高质量发展: 来自中国城市的经验证据[J]. 管理世界, 2020, 36(10): 65-76.
[
|
| [24] |
|
| [25] |
|
| [26] |
|
| [27] |
张英浩, 汪明峰, 匡爱平, 等. 数字经济赋能中国城市创新发展的多维机制与空间效应研究[J]. 地理科学进展, 2023, 42(12): 2283-2295.
[
|
| [28] |
周五七. 基于新经济地理学的长三角环境治理地区差异研究[J]. 中国人口·资源与环境, 2023, 33(9): 111-122.
[
|
| [29] |
麻学锋, 赵洁. 旅游产业集聚对民生福利的影响研究: 以湘西地区为例[J]. 地理科学进展, 2023, 42(8): 1486-1500.
[
|
| [30] |
张胜武, 韩日, 李小胜, 等. 新型城镇化促进水生态文明建设: 影响机制及空间效应[J]. 地理科学进展, 2024, 43(1): 1-16.
[
|
| [31] |
刘震, 杨勇, 眭霞芸. 互联网发展、 市场活力激发与旅游经济增长: 基于空间溢出视角的分析[J]. 旅游科学, 2022, 36(2): 17-43.
[
|
| [32] |
毛熙彦, 贺灿飞. 经济全球化新叙事与中国经济地理学发展新趋势[J]. 地理学报, 2023, 78(12): 2905-2921.
[
|
| [33] |
谭前进, 聂鸿鹏, 于涛. 高新技术产业集聚对经济韧性的影响及空间溢出效应分析[J]. 管理现代化, 2023, 43(2): 119-128.
[
|
| [34] |
王兆峰, 张先甜. 黄河流域旅游经济系统韧性的时空差异特征及其影响因素[J]. 地理与地理信息科学, 2023, 39(3): 112-121.
[
|
| [35] |
刘家树, 顾为都. 数字技术影响城市经济韧性的机制与效应: 基于中国265个城市的实证检验[J]. 江淮论坛, 2023(2): 67-73.
[
|
| [36] |
贺灿飞, 盛涵天. 区域经济韧性: 研究综述与展望[J]. 人文地理, 2023, 38(1): 1-10.
[
|
| [37] |
侯娜, 张靖怡, 赵婉争, 等. 数字创新能力对农业价值链变革的影响: 基于两家农业企业的案例研究[J]. 管理案例研究与评论, 2024, 17(2): 242-262.
[
|
| [38] |
王琴, 李敬, 丁可可, 等. 数字基础设施、要素配置效率与城乡收入差距[J]. 统计与决策, 2023, 39(9): 29-34.
[
|
| [39] |
刘明, 范丹雪, 施子杨. 空间溢出视角下数字经济与经济高质量发展[J]. 统计与决策, 2023(13): 22-27.
[
|
| [40] |
方叶林, 王秋月, 黄震方, 等. 中国旅游经济韧性的时空演化及影响机理研究[J]. 地理科学进展, 2023, 42(3): 417-427.
[
|
| [41] |
吴丹丹, 冯学钢, 马仁锋, 等. 数字经济发展对旅游业全要素生产率的非线性效应[J]. 旅游学刊, 2023, 38(2): 47-65.
[
|
| [42] |
吴丹丹, 马仁锋, 郝晨, 等. 数字经济对市域旅游业高质量发展水平的空间效应及机制[J]. 经济地理, 2023, 43(4): 229-240.
[
|
| [43] |
郭峰, 王靖一, 王芳, 等. 测度中国数字普惠金融发展: 指数编制与空间特征[J]. 经济学(季刊), 2020, 19(4): 1401-1418.
[
|
| [44] |
|
/
| 〈 |
|
〉 |