
数字经济对旅游业高质量发展的影响及空间溢出效应
|
马丽君(1981— ),男,山东临沂人,博士,教授,博士生导师,研究方向为旅游地理与经济地理。E-mail: ljmaljly@163.com |
收稿日期: 2023-05-24
修回日期: 2023-07-24
网络出版日期: 2023-12-22
基金资助
国家自然科学基金项目(41871123)
Influence and spatial spillover effects of the digital economy on the high-quality development of the tourism industry
Received date: 2023-05-24
Revised date: 2023-07-24
Online published: 2023-12-22
Supported by
National Natural Science Foundation of China(41871123)
数字经济是促进新时代旅游业高质量发展的重要引擎。论文基于中国280个地级以上城市2011—2019年面板数据,采用熵权TOPSIS法测算旅游业高质量发展水平与数字经济发展水平,依托空间杜宾模型揭示数字经济对旅游业高质量发展的影响及空间溢出效应。研究发现:数字经济对旅游业高质量发展具有直接影响,且存在“倒U”型的非线性关系,该结论经过一系列稳健性检验后仍显著成立;进一步分析表明,数字经济对邻近地区的旅游业高质量发展具有空间溢出效应,且存在“U”型的非线性关系。研究结果为数字经济对旅游业高质量发展的影响研究提供了新的视角,也为深化数字经济助力旅游业高质量发展提供了理论借鉴和经验证据。
马丽君 , 敖烨 . 数字经济对旅游业高质量发展的影响及空间溢出效应[J]. 地理科学进展, 2023 , 42(12) : 2296 -2308 . DOI: 10.18306/dlkxjz.2023.12.002
The digital economy is a new driving force for the high-quality development of the tourism industry in the new era. In recent years, with the emergence of blockchain, artificial intelligence, Internet of Things, and other emerging technologies, scientific and technological achievements have been rapidly transformed and put into production. Digital technology has become an important force to promote the restructuring of production factors, the improvement of production efficiency, and the optimization and upgrading of industrial structure. The deep integration of tourism—as a tertiary sector of the economy—and digital technology has become the key factor in promoting the upgrading of tourism industry structure. The digital economy, with its powerful productivity and high knowledge intensive form, reshapes the production mode of the tourism industry, improves its efficiency, and injects new momentum into the high-quality development of the tourism industry. However, there is a lack of theoretical exploration and empirical testing of the relationship between the digital economy and the high-quality development of the tourism industry. On the basis of analyzing the role of the digital economy in the high-quality development of the tourism industry, this study constructed an indicator system to measure the level of digital economy development and high-quality development of the tourism industry in 280 cities at the prefecture level and above in China from 2011 to 2019, and used the spatial Durbin model to empirically test the impact of the digital economy on the high-quality development of the tourism industry and its spatial spillover effects. The results show that the digital economy had a direct impact on the high-quality development of the tourism industry, and there was an inverted U-shaped nonlinear relationship. This result is still significantly valid after a series of robustness tests. Further analysis indicates that the digital economy had a spatial spillover effect on the high-quality development of tourism in neighboring regions, and a U-shaped nonlinear relationship existed. The results offer a new perspective for analyzing the impact of the digital economy on the high-quality development of the tourism industry, and provide theoretical reference and empirical evidence for leveraging the digital economy to support the high-quality development of the tourism industry.
表1 变量说明Tab.1 Description of variables |
| 变量 | 符号 | 变量说明(单位) |
|---|---|---|
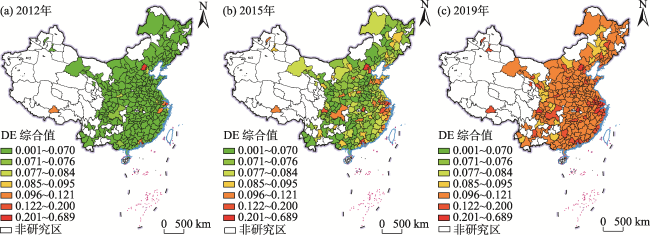
| 数字经济 | DE | 基于计算得到的数字经济发展水平测度值 |
| 政府效率 | Gov | 地区生产总值与财政支出的比值(%) |
| 科教发展水平 | Sci | 政府科研教育财政支出与地区生产总值的比值(%) |
| 经济发展水平 | ln gdp | 人均GDP(万元,取自然对数) |
| 对外开放程度 | ln open | 外商投资企业投资总额(万美元,取自然对数) |
| 交通通达度 | ln road | 公路客运量(万人,取自然对数) |
| 城乡融合度 | Rcty | 农村人均纯收入与城镇人均可支配收入的比值 |
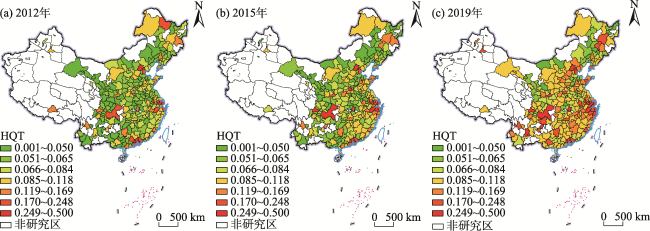
表2 旅游业高质量发展指数指标体系Tab.2 Indicator system of the high-quality development of the tourism industry |
| 系统层 | 一级指标 | 二级指标 | 三级指标 | 属性 |
|---|---|---|---|---|
| 旅游业高质量发展 水平评价指标体系 | 运行稳定 | 旅游业规模基础 | 旅游总收入(亿元) | 正 |
| 旅游接待总人数(万人) | 正 | |||
| 旅游经济韧性 | 旅游经济韧性指数 | 正 | ||
| 创新驱动 | 旅游业全要素生产率 | 旅游业全要素生产率指数 | 正 | |
| 旅游业技术进步贡献率 | 旅游业技术进步指数 | 正 | ||
| 旅游创新成果产出 | 旅游发明专利授权量 | 正 | ||
| 效率提升 | 旅游业资本生产率 | 旅游总收入/旅游业固定资产投资(%) | 正 | |
| 旅游业劳动生产率 | 旅游总收入/旅游业从业人员(元/人) | 正 | ||
| 旅游业接待效率 | 旅游总人数/旅游业从业人员(%) | 正 | ||
| 结构优化 | 旅游产业结构高级化 | 入境旅游人数/旅游总人数(%) | 正 | |
| 旅游产业结构合理化 | 旅游总收入/第三产业产值(%) | 正 | ||
| 协调共享 | 旅游经济发展效应 | 旅游—经济协调指数 | 正 | |
| 旅游社会繁荣效应 | 旅游—社会协调指数 | 正 | ||
| 旅游环境友好效应 | 旅游—环境协调指数 | 正 |
表3 数字经济发展水平测度评价体系Tab.3 Evaluation indicator system of the development level of the digital economy |
| 目标层 | 准则层 | 指标层 | 指标说明(单位) | 数据来源 |
|---|---|---|---|---|
| 数字 经济 | 数字基础设施 | 宽带互联网基础 | 每百人互联网宽带接入用户数量(户) | 《中国城市统计年鉴》 |
| 移动互联网基础 | 每百人移动电话用户数量(户) | 《中国城市统计年鉴》 | ||
| 数字产业发展 | 电商产业发展 | 人均邮政业务收入(元) | 《中国城市统计年鉴》 | |
| 电信产业发展 | 人均电信业务收入(元) | 《中国城市统计年鉴》 | ||
| 信息产业基础 | 信息传输、计算机服务和软件业从业人员数(万人) | 《中国城市统计年鉴》 | ||
| 数字创新能力 | 数字高新技术渗透 | 上市公司中数字高新技术应用渗透程度 | CSMAR 数据库 | |
| 数字创新要素支撑 | 科学技术支出(万元) | 《中国城市统计年鉴》 | ||
| 数字普惠金融 | 覆盖广度 | 数字普惠金融覆盖广度指数 | 北京大学数字金融普惠中心 | |
| 使用深度 | 数字普惠金融使用深度指数 | 北京大学数字金融普惠中心 | ||
| 数字化程度 | 数字普惠金融数字化程度指数 | 北京大学数字金融普惠中心 |
表4 空间面板计量模型的检验结果Tab.4 Spatial panel regression model test |
| 检验统计量 | 统计值 | P值 | 检验统计量 | 统计值 | P值 |
|---|---|---|---|---|---|
| LM-spatial lag | 43.927 | < 0.001 | Moran's I lag | 17.383 | < 0.001 |
| Robust LM-spatial lag | 10.369 | < 0.01 | Wald-spatial lag | 52.780 | < 0.001 |
| LM-spatial error | 292.353 | < 0.001 | LR-spatial lag | 52.130 | < 0.001 |
| Robust LM-spatial error | 258.795 | < 0.001 | Wald-spatial error | 49.320 | < 0.001 |
| Hausman | 8545.840 | < 0.001 | LR-spatial error | 49.350 | < 0.001 |
表5 空间杜宾模型估计结果Tab.5 Estimation results of the spatial Durbin model (SPDM) |
| 解释变量 | 地理权重 | 经济—地理嵌套 | |||
|---|---|---|---|---|---|
| X | W×X | X | W×X | ||
| DE | 0.632***(8.622) | -1.040***(-5.302) | 0.628***(8.558) | -0.913***(-6.028) | |
| DE2 | -0.337***(-4.303) | 0.849***(3.971) | -0.331***(-4.229) | 0.733***(4.693) | |
| Gov | 0.001**(2.410) | 0.001(0.447) | 0.001**(2.303) | 0.001(0.849) | |
| Sci | <0.001(0.263) | -0.001(-0.290) | <0.001(0.379) | -0.002(-0.667) | |
| ln gdp | 0.004(1.058) | 0.017**(2.073) | 0.005(1.267) | 0.014*(1.915) | |
| ln open | 0.001*(1.864) | 0.002**(2.144) | 0.001**(2.062) | 0.002**(2.002) | |
| ln road | 0.002**(1.989) | 0.003(1.418) | 0.002*(1.663) | 0.004*(1.805) | |
| Rcty | -0.010(-0.735) | 0.041(1.323) | -0.012(-0.868) | 0.079***(2.599) | |
| ρ | 0.348***(8.298) | 0.300***(7.661) | |||
| 城市固定效应 | YES | YES | |||
| 时间固定效应 | YES | YES | |||
| 观测样本 | 2240 | 2240 | |||
| R2 | 0.626 | 0.613 | |||
| log-likelihood | 6149.140 | 6151.333 | |||
注:***、**和*分别代表通过1%、5%和10%的显著性水平检验;括号里的数值表示t值。YES表示变量固定,X代表各变量。下同。 |
表6 空间杜宾模型溢出效应分解结果Tab.6 Results of spatial Durbin model spillover effect decomposition |
| 变量 | 经济权重 | 经济—地理嵌套 | |||||
|---|---|---|---|---|---|---|---|
| 直接效应 | 间接效应 | 总效应 | 直接效应 | 间接效应 | 总效应 | ||
| DE | 0.606***(7.908) | -1.209***(-4.005) | -0.602*(-1.828) | 0.609***(7.994) | -0.999***(-4.597) | -0.389(-1.579) | |
| DE2 | -0.315***(-3.829) | 1.082***(3.240) | 0.767**(2.088) | -0.316***(-3.877) | 0.875***(3.821) | 0.559**(2.118) | |
| Gov | 0.002***(2.715) | 0.002(0.814) | 0.003(1.535) | 0.001***(2.595) | 0.002(1.267) | 0.003**(2.083) | |
| Sci | <0.001(0.254) | -0.001(-0.210) | -0.001(-0.164) | <0.001(0.320) | -0.003(-0.578) | -0.003(-0.523) | |
| ln gdp | 0.005(1.281) | 0.027**(2.411) | 0.032***(2.874) | 0.005(1.450) | 0.021**(2.241) | 0.026***(2.806) | |
| ln open | 0.001**(2.168) | 0.003**(2.400) | 0.004***(2.910) | 0.001**(2.322) | 0.003**(2.251) | 0.004***(2.853) | |
| ln road | 0.002**(2.075) | 0.006*(1.840) | 0.008**(2.437) | 0.002*(1.744) | 0.006**(2.207) | 0.008***(2.783) | |
| Rcty | -0.009(-0.694) | 0.057(1.264) | 0.047(1.055) | -0.010(-0.762) | 0.106**(2.563) | 0.096**(2.339) | |
表7 稳健性检验Tab.7 Results of robustness test |
| 解释变量 | 模型1 | 模型2 | 模型3 | ||||||||
|---|---|---|---|---|---|---|---|---|---|---|---|
| X | W×X | X | W×X | X | W×X | ||||||
| DE | 0.626***(8.49) | -0.147(-1.52) | 15.074***(5.62) | -14.025***(-3.98) | 15.548***(5.89) | -30.923***(-5.59) | |||||
| DE2 | -0.364***(-4.62) | 0.315**(2.46) | -9.035***(-3.15) | 26.184***(5.61) | -9.517***(-3.37) | 30.703***(5.41) | |||||
| Gov | 0.002***(3.27) | -0.001(-1.10) | 0.097***(4.59) | -0.037(-1.14) | 0.097***(4.55) | -0.095**(-2.17) | |||||
| Sci | <-0.001(-0.09) | <0.001(0.20) | -0.035(-1.24) | -0.041(-0.71) | -0.027(-0.99) | -0.292**(-2.45) | |||||
| ln gdp | 0.005(1.37) | 0.013**(2.51) | -0.024(-0.18) | 0.281(1.44) | -0.110(-0.81) | 0.461*(1.82) | |||||
| ln open | 0.001(1.46) | 0.001*(1.91) | -0.013(-0.86) | 0.025(0.99) | -0.004(-0.26) | -0.015(-0.46) | |||||
| ln road | 0.003***(3.15) | <0.001(0.25) | 0.016(0.45) | 0.035(0.58) | 0.017(0.50) | -0.073(-0.92) | |||||
| Rcty | -0.023(-1.56) | 0.039(1.63) | -1.843***(-3.48) | 1.543*(1.76) | -1.842***(-3.61) | 2.206**(2.01) | |||||
| ρ | 0.200***(7.28) | 0.086***(2.79) | 0.385***(10.41) | ||||||||
| 城市固定效应 | YES | YES | YES | ||||||||
| 时间固定效应 | YES | YES | YES | ||||||||
| 观测样本 | 2240 | 2240 | 2240 | ||||||||
| R2 | 0.249 | 0.027 | 0.050 | ||||||||
| log-likelihood | 6133.320 | -1900.000 | -1900.000 | ||||||||
| [1] |
中国信息通信研究院. 中国数字经济发展白皮书(2022年)[R]. 上海: 中国信息通信研究院, 2022.
[China Academy of Information and Communications Technology. White paper on China's digital economy development (2022). Shanghai, China: China Academy of Information and Communications Technology, 2022.]
|
| [2] |
赵磊. 数字经济赋能旅游业高质量发展的内涵与维度[J]. 旅游学刊, 2022, 37(4): 5-6.
[
|
| [3] |
何红, 拓守恒, 寇敏. 新一代数字技术赋能旅游高质量发展的作用机制与实现路径[J]. 商业经济, 2022(4): 35-39.
[
|
| [4] |
杨勇, 邬雪. 从数字经济到数字鸿沟: 旅游业发展的新逻辑与新问题[J]. 旅游学刊, 2022, 37(4): 3-5.
[
|
| [5] |
陈琳琳, 徐金海, 李勇坚. 数字技术赋能旅游业高质量发展的理论机理与路径探索[J]. 改革, 2022(2): 101-110.
[
|
| [6] |
王龙杰, 曾国军, 毕斗斗. 信息化对旅游产业发展的空间溢出效应[J]. 地理学报, 2019, 74(2): 366-378.
[
|
| [7] |
凌常荣, 罗正芳. 消费数字化对旅游高质量发展的影响研究[J]. 商学研究, 2022, 29(2): 55-62.
[
|
| [8] |
蒋瑛, 刘琳, 刘寒绮. 智慧旅游建设促进了旅游经济高质量发展吗? 全要素生产率视角下的准自然实验[J]. 旅游科学, 2022, 36(2): 44-62.
[
|
| [9] |
杨勇. 数字经济如何重塑区域旅游经济地理空间格局?[J]. 旅游科学, 2022, 36(6): 1-19.
[
|
| [10] |
杨勇. 互联网促进旅游产业动态优化了吗?[J]. 经济管理, 2019, 41(5): 156-170.
[
|
| [11] |
唐睿. 长三角数字经济和旅游业高质量发展的空间特征分析[J]. 经济体制改革, 2022(5): 51-59.
[
|
| [12] |
魏敏, 魏海湘, 许锐. 数字经济对区域旅游经济增长的影响研究[J]. 统计与信息论坛, 2023, 38(4): 59-70.
[
|
| [13] |
吴丹丹, 冯学钢, 马仁锋, 等. 数字经济发展对旅游业全要素生产率的非线性效应[J]. 旅游学刊, 2023, 38(2): 47-65.
[
|
| [14] |
王少剑, 王洋, 赵亚博. 1990年来广东区域发展的空间溢出效应及驱动因素[J]. 地理学报, 2015, 70(6): 965-979.
[
|
| [15] |
方远平, 谢蔓, 林彰平. 信息技术对服务业创新影响的空间计量分析[J]. 地理学报, 2013, 68(8): 1119-1130.
[
|
| [16] |
吴丹丹, 马仁锋, 郝晨, 等. 数字经济对市域旅游业高质量发展水平的空间效应及机制[J]. 经济地理, 2023, 43(4): 229-240.
[
|
| [17] |
于婷婷, 左冰. 信息化对旅游经济效率的影响及其作用机制研究[J]. 地理科学, 2022, 42(10): 1717-1726.
[
|
| [18] |
李恒, 全华. 基于大数据平台的旅游虚拟产业集群研究[J]. 经济管理, 2018, 40(12): 21-38.
[
|
| [19] |
|
| [20] |
王铮, 马翠芳, 王莹, 等. 区域间知识溢出的空间认识[J]. 地理学报, 2003, 58(5): 773-780.
[
|
| [21] |
程广斌, 吴家庆, 李莹. 数字经济、绿色技术创新与经济高质量发展[J]. 统计与决策, 2022, 38(23): 11-16.
[
|
| [22] |
冀雁龙, 李金叶. 数字经济发展对旅游经济增长的影响研究[J]. 技术经济与管理研究, 2022(6): 13-18.
[
|
| [23] |
孙才志, 宋现芳. 数字经济时代下的中国海洋经济全要素生产率研究[J]. 地理科学进展, 2021, 40(12): 1983-1998.
[
|
| [24] |
李瑞, 郭谦, 贺跻, 等. 环渤海地区城市旅游业发展效率时空特征及其演化阶段: 以三大城市群为例[J]. 地理科学进展, 2014, 33(6): 773-785.
[
|
| [25] |
孙晓, 刘力钢, 陈金. 东北三省旅游经济质量的区域差异、动态演进及影响因素[J]. 地理科学, 2021, 41(5): 832-841.
[
|
| [26] |
李涛, 薛领, 李国平. 产业集聚空间格局演变及其对经济高质量发展的影响: 基于中国278个城市数据的实证分析[J]. 地理研究, 2022, 41(4): 1092-1106.
[
|
| [27] |
刘英基, 韩元军. 要素结构变动、制度环境与旅游经济高质量发展[J]. 旅游学刊, 2020, 35(3): 28-38.
[
|
| [28] |
师博, 张冰瑶. 全国地级以上城市经济高质量发展测度与分析[J]. 社会科学研究, 2019(3): 19-27.
[
|
| [29] |
王兆峰, 谢佳亮, 吴卫. 环长株潭城市群旅游业高质量发展水平变化及其影响因素[J]. 经济地理, 2022, 42(3): 172-181, 221.
[
|
| [30] |
方叶林, 王秋月, 黄震方, 等. 中国旅游经济韧性的时空演化及影响机理研究[J]. 地理科学进展, 2023, 42(3): 417-427.
[
|
| [31] |
刘建国, 刘宇. 2006—2013年杭州城市旅游全要素生产率格局及影响因素[J]. 经济地理, 2015, 35(7): 190-197.
[
|
| [32] |
张军, 吴桂英, 张吉鹏. 中国省际物质资本存量估算: 1952—2000[J]. 经济研究, 2004(10): 35-44.
[
|
| [33] |
马丽君, 孙根年, 黄芸玛, 等. 城市国内客流量与游客网络关注度时空相关分析[J]. 经济地理, 2011, 31(4): 680-685.
[
|
| [34] |
|
| [35] |
|
| [36] |
李芸, 雷宏振, 张小筠. 基于SBM模型的科技创新效率及影响因素研究[J]. 技术经济, 2020, 39(5): 1-8.
[
|
| [37] |
蔡乌赶, 周小亮. 中国环境规制对绿色全要素生产率的双重效应[J]. 经济学家, 2017(9): 27-35.
[
|
| [38] |
崔兴华, 林明裕. FDI如何影响企业的绿色全要素生产率? 基于Malmquist-Luenberger指数和PSM-DID的实证分析[J]. 经济管理, 2019, 41(3): 38-55.
[
|
| [39] |
郭丽佳, 李畅, 彭红松, 等. 节能减排约束下中国省域旅游生态效率评估及空间格局研究[J]. 地理科学进展, 2021, 40(8): 1284-1297.
[
|
| [40] |
徐维祥, 周建平, 刘程军. 数字经济发展对城市碳排放影响的空间效应[J]. 地理研究, 2022, 41(1): 111-129.
[
|
| [41] |
赵涛, 张智, 梁上坤. 数字经济、创业活跃度与高质量发展: 来自中国城市的经验证据[J]. 管理世界, 2020, 36(10): 65-76.
[
|
/
| 〈 |
|
〉 |
