
中国人才分布的学历梯度分异性:时空格局及影响机理
|
齐宏纲(1992— ),男,河北唐山人,博士,讲师,主要从事人口地理与城市地理研究。E-mail: qihg192@163.com |
收稿日期: 2022-09-19
修回日期: 2022-11-10
网络出版日期: 2023-05-24
基金资助
国家自然科学基金项目(42101237)
江苏省社会科学基金青年项目(22SHC003)
江苏省高校自然科学面上项目(21KJB170015)
Heterogeneity of educational attainment of talents in China: Spatial and temporal patterns and driving factors
Received date: 2022-09-19
Revised date: 2022-11-10
Online published: 2023-05-24
Supported by
National Natural Science Foundation of China(42101237)
Social Science Foundation of Jiangsu Province(22SHC003)
University Natural Science Research Project of Jiangsu Province(21KJB170015)
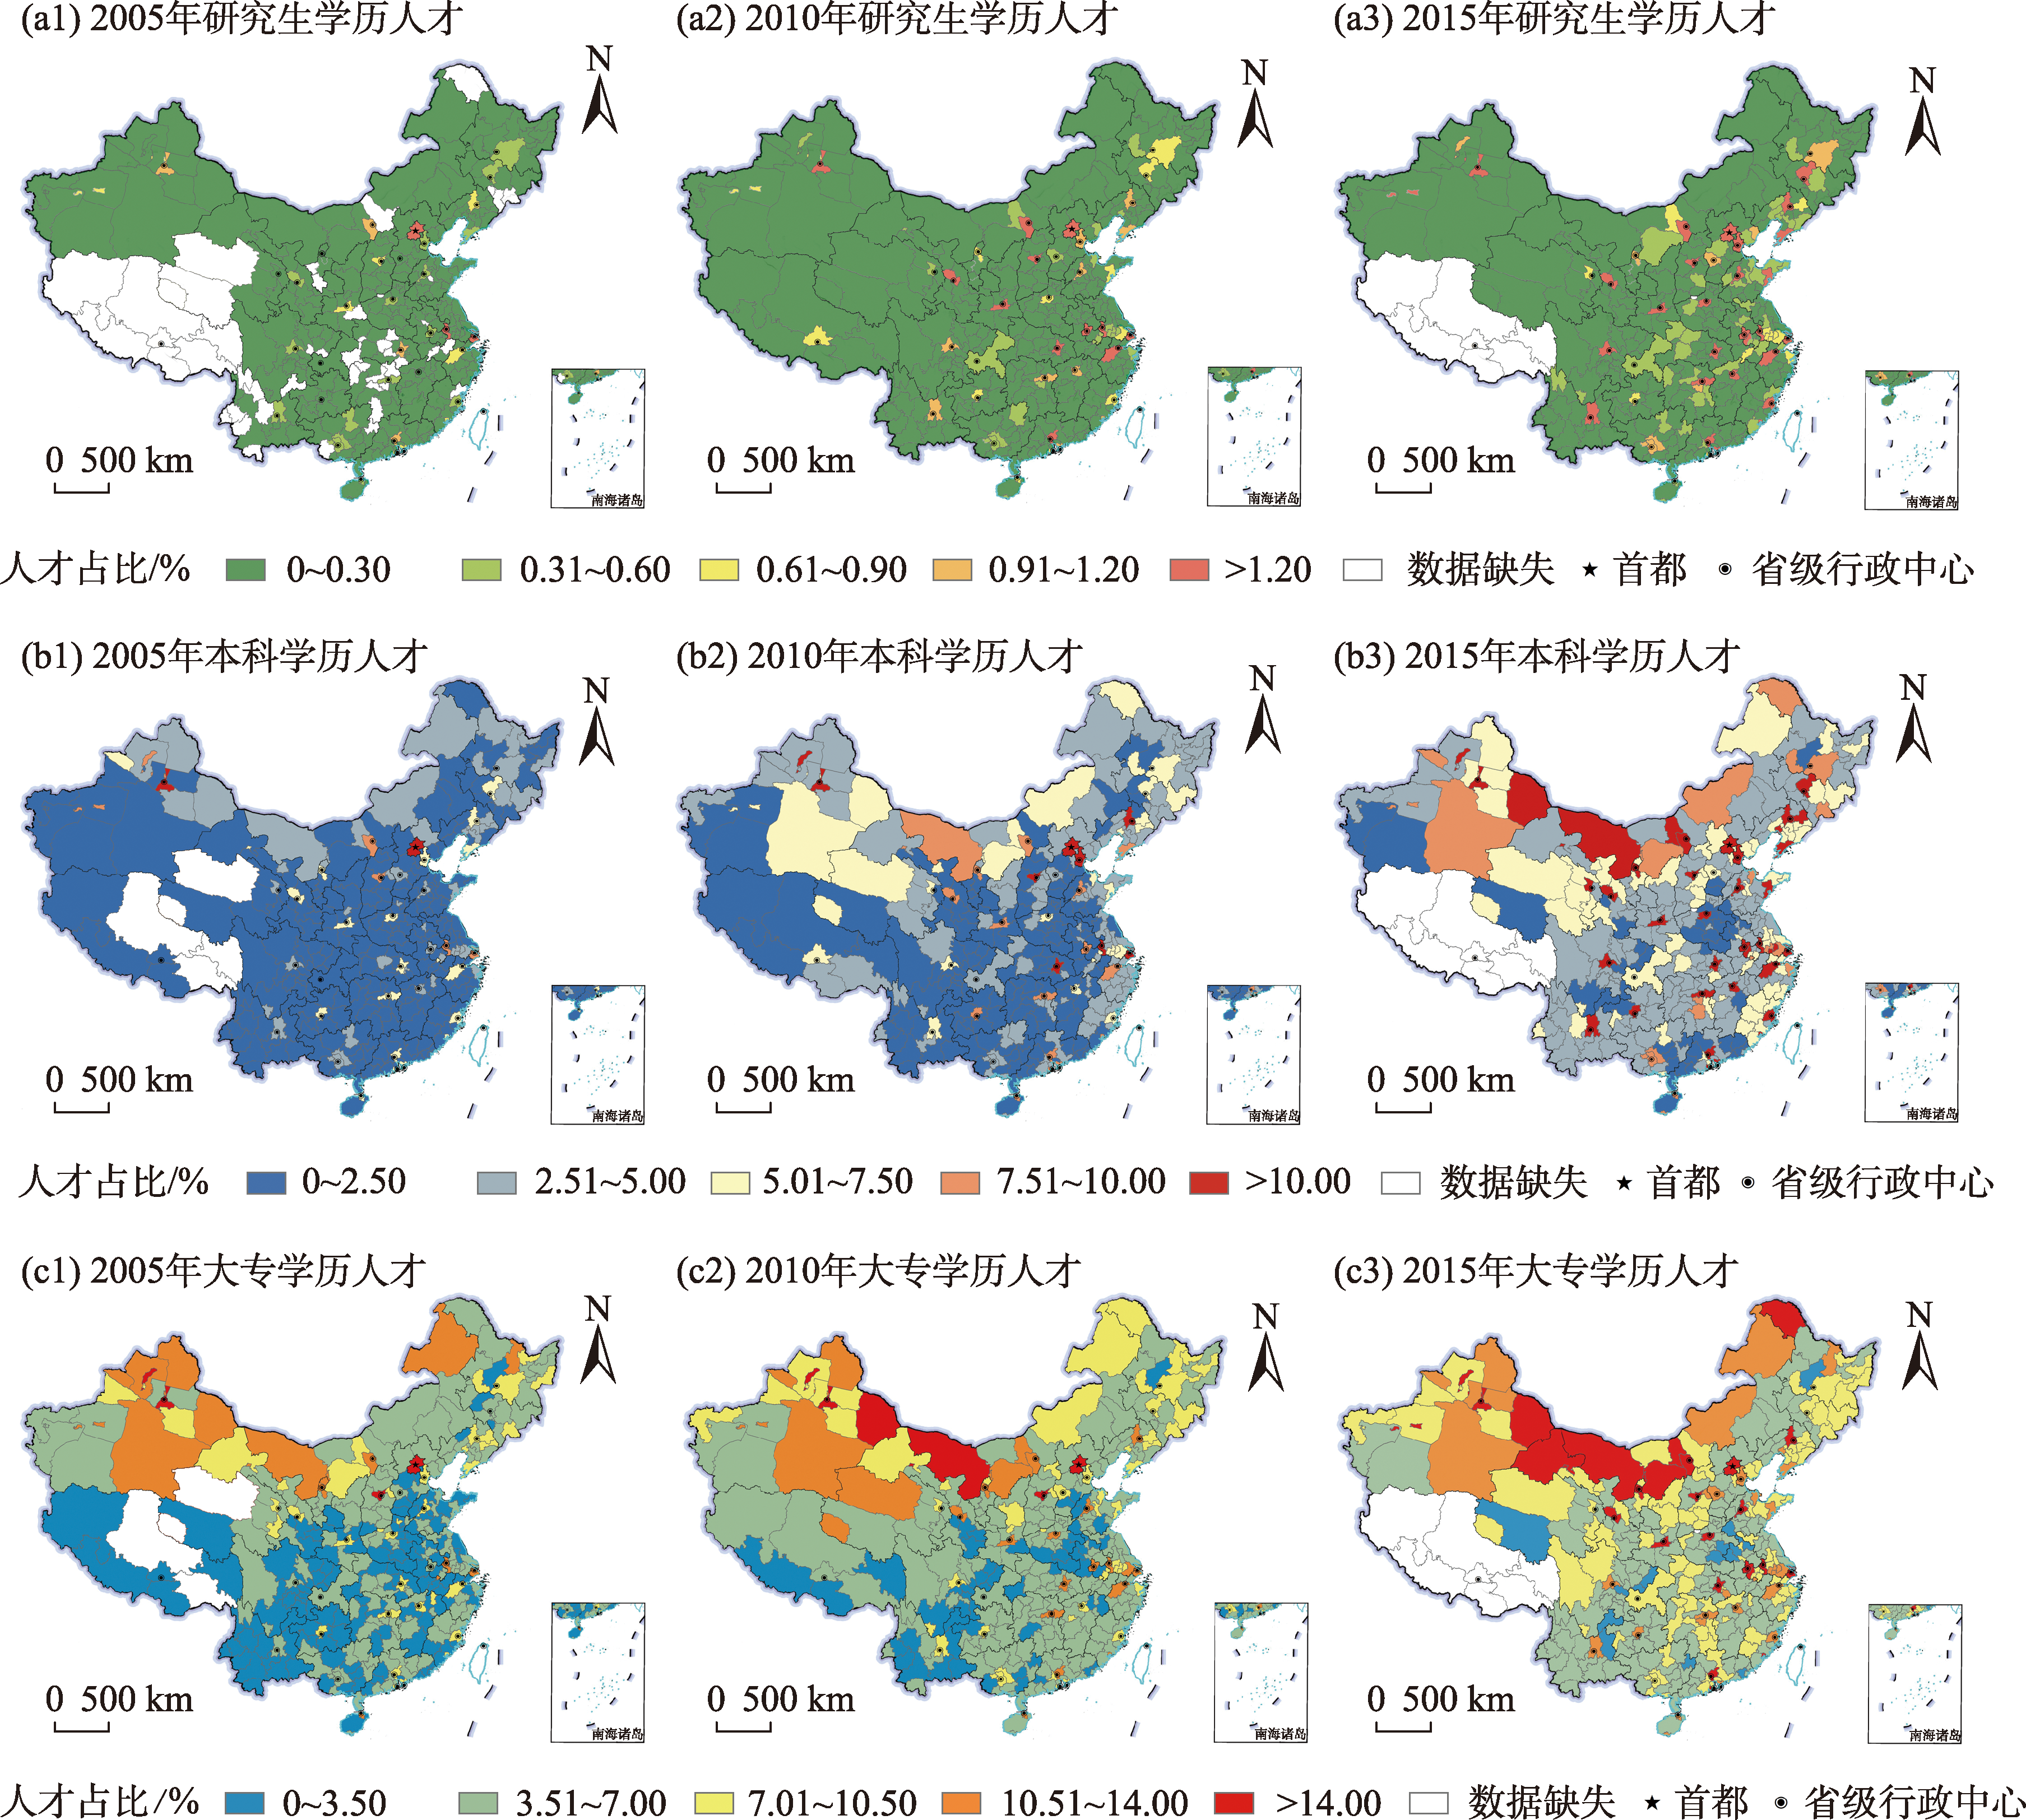
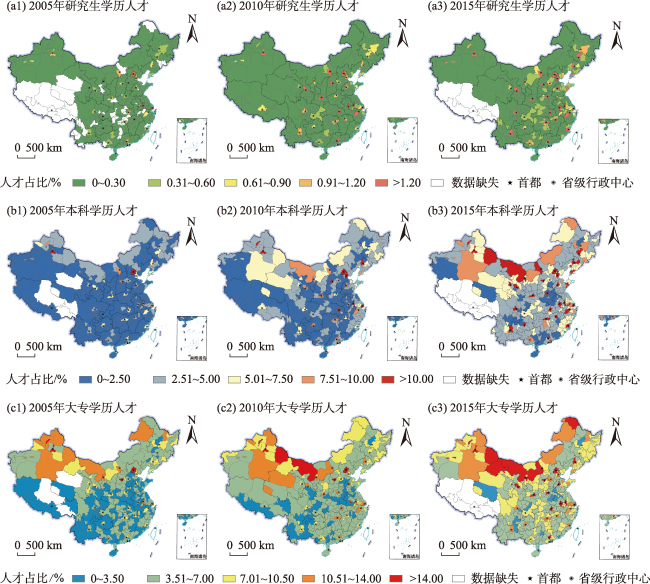
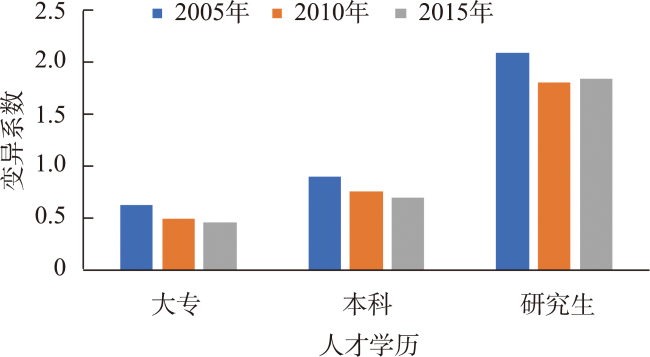
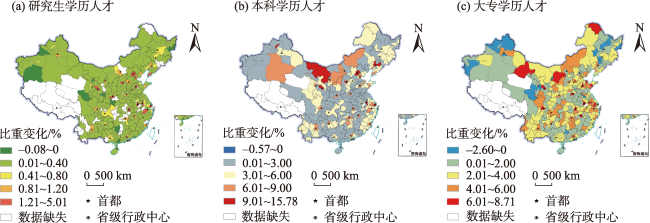
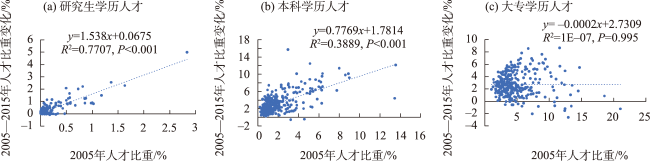
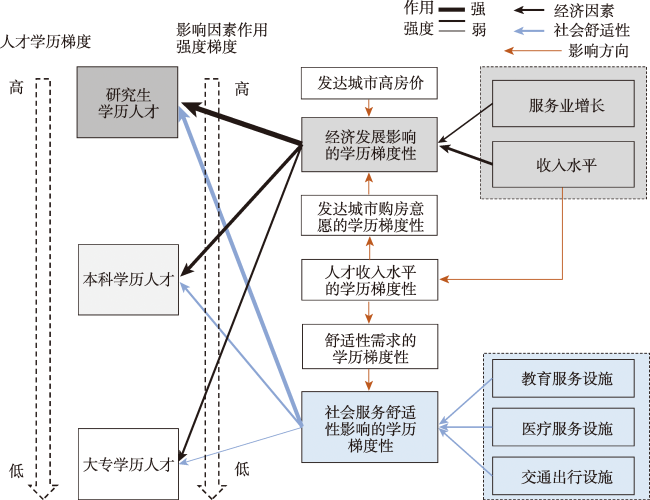
人才内部存在着受教育程度由低到高的学历梯度,关注不同学历人才分布影响机理的差异性,对于制定因类而异的人才政策和优化城市体系的经济高质量发展格局具有重要意义。论文利用中国2005、2010和2015年人口抽样调查数据资料,从地级尺度上揭示了2005—2015年中国大专、本科及研究生学历人才分布的时空格局特征差异,采用空间计量模型解释了不同学历人才时空分布差异的影响机理。结果发现:① 中国不同学历人才的空间分布高度不均衡,大专、本科及研究生学历人才均主要集聚在直辖市、省会城市和计划单列市,而本科及大专学历人才在内蒙古西部和新疆北部等西北地区资源型城市也具有一定的集聚优势,人才集聚的不均衡度随着学历提升而依次递增。人才集聚的不均衡程度均随时间而有所缓解,但缓解程度随学历提升而依次递减。② 人才动态集聚呈现出初期人才比重越高、期间人才比重增幅越大的马太效应,人才动态集聚的马太效应强度随学历提升而逐渐增强。③ 中国大专、本科及研究生学历人才集聚均主要为经济主导型,薪资待遇是不同学历人才集聚的最重要影响因素,中国区域间薪资水平差距的缩小是不同学历人才分布不均衡态势缓解的主要原因。服务业快速增长,中学教育、医疗条件和交通出行等社会舒适性也会促进不同学历人才的集聚,海拔高度及绿化休憩等环境舒适性整体上并未显著推动中国人才的集聚。④ 经济及社会舒适性因素对人才集聚的促进作用均呈现出随学历提升而依次增加的趋势。
齐宏纲 , 戚伟 , 刘振 , 赵美风 . 中国人才分布的学历梯度分异性:时空格局及影响机理[J]. 地理科学进展, 2023 , 42(5) : 821 -836 . DOI: 10.18306/dlkxjz.2023.05.001
Educational attainments of talents are different, and exploring the spatiotemporal distribution of talents with different educational attainments and its driving factors is of key significance for formulating different kinds of talent policies and optimizing the high-quality economic development pattern of the urban system. Using data of the 2005, 2010 and 2015 population sample surveys of China, this study examined the differences in the spatial and temporal patterns of China's talents with college, undergraduate, and graduate degrees from 2005 to 2015 at the prefecture level, and used a spatial econometric model to explain the driving factors of these differences. The results show that: 1) The spatial distribution of China's talents with different educational attainments was highly uneven, and talents with college, undergraduate, and graduate degrees were mainly concentrated in the municipalities, provincial capitals, and independent plan cities. There was also some concentration of talents with college and undergraduate degrees in resource-based cities of the northwestern region, such as western Inner Mongolia and northern Xinjiang. The level of uneven distribution of talents increased with the increment of educational attainments and the unevenness was alleviated through time, but the degree of its alleviation decreased with the increase of educational attainment. 2) The dynamic agglomeration of talents showed the Matthew effect—the higher the proportion of talents at the beginning of the study period, the greater the increase of the proportion of talents during the period. The intensity of the Matthew effect of dynamic agglomeration of talents gradually increased with the increase of educational attainment. 3) The concentration of China's talents with college, undergraduate, and graduate degrees was mainly economic driven, and salary played the most important role in influencing the concentration of talents with different educational attainments. The reduction of regional salary gaps in China had caused a decrease in the level of uneven distribution of talents with different educational attainments. The rapid growth of service industry and improvements in social amenities such as secondary education, medical service, and transportation had also promoted the agglomeration of talents with different educational attainments. Nevertheless, environmental factors such as elevation and green leisure space did not significantly boost the agglomeration of talents in China. The role of both economic development and social amenities in promoting talent agglomeration showed a tendency to increase with increasing educational attainments.
表1 解释变量的描述Tab.1 Description of the explanatory variables |
| 类型 | 变量 | 描述 |
|---|---|---|
| 经济因素 | tez | 各城市第三产业增加值占GDP的比重(%) |
| wag | 各城市城镇在岗职工平均工资(元) | |
| 社会舒适性因素 | sta | 各城市中学生师比(人/人) |
| doc | 各城市每万人执业医生数(人/万人) | |
| roa | 各城市市辖区人均道路面积(m2/人) | |
| 自然环境舒适性因素 | gre | 各城市市辖区建成区绿化覆盖率(%) |
| pm | 各城市年均PM2.5浓度(μg/m3) | |
| dem | 各城市海拔高度(m) | |
| 控制变量 | edu | 各城市万人高等院校在校生数(人/万人) |
| sef | 各城市财政支出中的科技支出和教育支出占比(%) | |
| den | 各城市人口密度(人/km2) |
表2 不同学历劳动力占比的全局自相关指数Tab.2 Global Moran's I of percentage of labor force with different educational attainments |
| 指标 | 2005年 | 2010年 | 2015年 | |||||
|---|---|---|---|---|---|---|---|---|
| Moran's I | Z值 | Moran's I | Z值 | Moran's I | Z值 | |||
| 研究生学历劳动力占比 | -0.009 | -0.243 | 0.002 | 0.243 | 0.006 | 0.406 | ||
| 本科学历劳动力占比 | 0.170*** | 6.960 | 0.140*** | 5.808 | 0.138*** | 5.556 | ||
| 大专学历劳动力占比 | 0.312*** | 12.322 | 0.226*** | 8.888 | 0.143*** | 5.622 | ||
注: ***表示通过了1%的显著性水平检验;P<0.01显著水平下的Z值临界值是2.58。 |
表3 回归结果Tab.3 Regression results |
| 变量 | 研究生 | 本科 | 大专 | ||||||
|---|---|---|---|---|---|---|---|---|---|
| OLS | SAR | SEM | OLS | SAR | SEM | OLS | SAR | SEM | |
| tez | 0.529*** | 0.529*** | 0.533*** | 0.253*** | 0.247*** | 0.270*** | 0.141*** | 0.137*** | 0.156*** |
| (4.439) | (4.451) | (4.452) | (3.788) | (3.719) | (4.028) | (2.841) | (2.778) | (3.149) | |
| wag | 0.607*** | 0.605*** | 0.701*** | 0.476*** | 0.468*** | 0.557*** | 0.160*** | 0.160*** | 0.220*** |
| -4.884 | (4.775) | (5.426) | (6.834) | (6.671) | (7.637) | (3.093) | (3.112) | (4.074) | |
| sta | -0.309** | -0.306** | -0.276** | -0.256*** | -0.222*** | -0.221*** | -0.122** | -0.103* | -0.132** |
| (-2.291) | (-2.251) | (-2.003) | (-3.385) | (-2.915) | (-2.854) | (-2.165) | (-1.827) | (-2.314) | |
| doc | 0.340*** | 0.339*** | 0.337*** | 0.211*** | 0.207*** | 0.221*** | 0.199*** | 0.192*** | 0.197*** |
| (4.084) | (4.090) | (4.035) | (4.526) | (4.482) | (4.728) | (5.730) | (5.572) | (5.696) | |
| roa | 0.194*** | 0.194*** | 0.198*** | 0.175*** | 0.172*** | 0.176*** | 0.156*** | 0.153*** | 0.157*** |
| (4.657) | (4.670) | (4.776) | (7.458) | (7.388) | (7.630) | (8.964) | (8.883) | (9.217) | |
| gre | -0.064 | -0.064 | -0.07 | 0.009 | 0.007 | 0.005 | -0.029 | -0.031 | -0.035 |
| (-1.025) | (-1.035) | (-1.132) | (0.259) | (0.197) | (0.156) | (-1.112) | (-1.201) | (-1.383) | |
| pm | -0.006 | -0.006 | -0.024 | -0.116*** | -0.103** | -0.127*** | -0.075** | -0.062** | -0.077** |
| (-0.079) | (-0.082) | (-0.300) | (-2.807) | (-2.480) | (-2.757) | (-2.426) | (-1.997) | (-2.224) | |
| dem | 0.022 | 0.023 | 0.021 | -0.005 | 0.004 | -0.004 | 0.002 | 0.008 | 0.0001 |
| (1.013) | (1.001) | (0.900) | (-0.449) | (0.280) | (-0.279) | (0.276) | (0.862) | (-0.005) | |
| edu | 0.525*** | 0.525*** | 0.516*** | 0.223*** | 0.223*** | 0.206*** | 0.122*** | 0.123*** | 0.112*** |
| -16.195 | (16.189) | (15.955) | (12.274) | (12.317) | (11.387) | (9.058) | (9.153) | (8.449) | |
| sef | -0.407*** | -0.407*** | -0.380*** | -0.193*** | -0.190*** | -0.183*** | -0.124*** | -0.127*** | -0.148*** |
| (-3.973) | (-3.992) | (-3.610) | (-3.351) | (-3.332) | (-3.085) | (-2.897) | (-2.986) | (-3.375) | |
| den | 0.037 | 0.038 | 0.052 | -0.088*** | -0.078*** | -0.074*** | -0.097*** | -0.089*** | -0.093*** |
| (0.867) | (0.885) | (1.181) | (-3.658) | (-3.217) | (-2.962) | (-5.412) | (-4.968) | (-5.033) | |
| ρ | 0.022 | 0.315** | 0.370*** | ||||||
| (0.112) | (2.195) | (2.780) | |||||||
| γ | 0.584*** | 0.727*** | 0.830*** | ||||||
| (3.881) | (6.972) | (12.399) | |||||||
| R2 | 0.732 | 0.736 | 0.735 | 0.738 | 0.740 | 0.741 | 0.688 | 0.687 | 0.691 |
| Log-likelihood | -658.406 | -658.404 | -655.316 | -243.436 | -241.965 | -237.592 | -30.916 | -29.519 | -18.921 |
| Durbin-Watson | 1.651 | 1.598 | 1.471 | ||||||
| LM(lag) | 0.011 | 3.528* | 2.766* | ||||||
| R-LM(lag) | 5.505** | 0.118 | 5.760** | ||||||
| LM(error) | 6.407** | 12.380*** | 33.041*** | ||||||
| R-LM(error) | 11.901*** | 8.970*** | 36.035*** | ||||||
| N | 717 | 717 | 717 | ||||||
注:括号中为t统计量;*、**、***分别表示通过10%、5%、1%的显著性水平检验。表中模型均为基于时间固定效应的模型。 |
| [1] |
陈新明, 萧鸣政, 张睿超. 城市“抢人大战”的政策特征、效力测度及优化建议[J]. 中国人力资源开发, 2020, 37(5): 59-69.
[
|
| [2] |
柴浩放. 城市“引才大战”的内在逻辑与效应[J]. 管理观察, 2018(28): 114-117.
[
|
| [3] |
李中斌, 涂满章, 赵聪. 我国城市人才争夺战的比较与思考[J]. 中国劳动关系学院学报, 2018, 32(4): 32-41.
[
|
| [4] |
刘宏. 如何制定全面的人才政策[N]. 社会科学报, 2018-08-30(3).
[
|
| [5] |
杨吉元, 黄丽, 刘鎏, 等. 中小城市人才引进策略研究[J]. 价值工程, 2018, 37(27): 85-87.
[
|
| [6] |
赵国钦, 张战, 沈展西, 等. 新一轮“人才争夺战”的工具导向和价值反思: 基于政策文本分析的视角[J]. 中国人力资源开发, 2018, 35(6): 75-84.
[
|
| [7] |
|
| [8] |
|
| [9] |
|
| [10] |
|
| [11] |
|
| [12] |
|
| [13] |
|
| [14] |
|
| [15] |
|
| [16] |
|
| [17] |
|
| [18] |
|
| [19] |
|
| [20] |
|
| [21] |
|
| [22] |
|
| [23] |
|
| [24] |
张楠, 范洪敏, 穆怀中. 人力资本梯度升级的经济增长效应[J]. 人口与经济, 2020(2): 87-101.
[
|
| [25] |
袁富华, 张平, 陆明涛. 长期经济增长过程中的人力资本结构: 兼论中国人力资本梯度升级问题[J]. 经济学动态, 2015(5): 11-21.
[
|
| [26] |
方超, 罗英姿. 人力资本梯度升级视野下的我国研究生教育供给侧改革[J]. 清华大学教育研究, 2016, 37(5): 68-77.
[
|
| [27] |
古恒宇, 沈体雁. 中国高学历人才的空间演化特征及驱动因素[J]. 地理学报, 2021, 76(2): 326-340.
[
|
| [28] |
古恒宇, 沈体雁. 1995—2015年中国省际人口迁移网络的演化特征: 基于异质性劳动力视角[J]. 地理研究, 2021, 40(6): 1823-1839.
[
|
| [29] |
武荣伟, 王若宇, 刘晔, 等. 2000—2015年中国高学历人才分布格局及其影响机制[J]. 地理科学, 2020, 40(11): 1822-1830.
[
|
| [30] |
齐宏纲, 赵美风, 刘盛和, 等. 2000—2015年中国高学历人才省际迁移的演化格局及影响机理[J]. 地理研究, 2022, 41(2): 456-479.
[
|
| [31] |
|
| [32] |
|
| [33] |
齐宏纲, 戚伟, 刘盛和. 粤港澳大湾区人才集聚的演化格局及影响因素[J]. 地理研究, 2020, 39(9): 2000-2014.
[
|
| [34] |
|
| [35] |
刘晔, 王若宇, 薛德升, 等. 中国高技能劳动力与一般劳动力的空间分布格局及其影响因素[J]. 地理研究, 2019, 38(8): 1949-1964.
[
|
| [36] |
|
| [37] |
|
| [38] |
曹威麟, 姚静静, 余玲玲, 等. 我国人才集聚与三次产业集聚关系研究[J]. 科研管理, 2015, 36(12): 172-179.
[
|
| [39] |
刘涛, 彭荣熙, 卓云霞, 等. 2000—2020年中国人口分布格局演变及影响因素[J]. 地理学报, 2022, 77(2): 381-394.
[
|
| [40] |
赵美风, 汪德根. 中国中西部地区就近城镇化空间分异格局及机理[J]. 地理学报, 2021, 76(12): 2993-3011.
[
|
| [41] |
闫东升, 孙伟, 王玥, 等. 长江三角洲人口分布演变、偏移增长及影响因素[J]. 地理科学进展, 2020, 39(12): 2068-2082.
[
|
| [42] |
陈镘, 黄柏石, 刘晔. PM2.5污染对中国人口死亡率的影响: 基于346个城市面板数据的实证分析[J]. 地理科学进展, 2022, 41(6): 1028-1040.
[
|
| [43] |
李广东, 方创琳. 中国县域国土空间集约利用计量测度与影响机理[J]. 地理学报, 2014, 69(12): 1739-1752.
[
|
| [44] |
李广东, 戚伟. 中国建设用地扩张对景观格局演化的影响[J]. 地理学报, 2019, 74(12): 2572-2591.
[
|
| [45] |
魏后凯, 高春亮. 中国区域协调发展态势与政策调整思路[J]. 河南社会科学, 2012, 20(1): 73-81, 107-108.
[
|
| [46] |
覃成林, 郑云峰, 张华. 我国区域经济协调发展的趋势及特征分析[J]. 经济地理, 2013, 33(1): 9-14.
[
|
| [47] |
刘旭阳, 金牛. 城市“抢人大战”政策再定位: 聚焦青年流动人才的分析[J]. 中国青年研究, 2019(9): 47-53.
[
|
| [48] |
王少剑, 高爽, 陈静. 基于GWR模型的中国城市雾霾污染影响因素的空间异质性研究[J]. 地理研究, 2020, 39(3): 651-668.
[
|
| [49] |
付强, 邱永辉. 中美房价比较分析: 基于Numbeo国际房价统计数据库的实证研究[J]. 中国房地产, 2019(12): 10-19.
[
|
| [50] |
曹倪娜. 2014年全国35个大中城市房价收入比排行榜[J]. 上海房地, 2015(8): 10-12.
[
|
/
| 〈 |
|
〉 |