
多时期演变视角下中国人口收缩区的识别、空间特征与成因类型分析
|
刘振(1990—),男,山东滨州人,博士,研究方向为城市地理和人口地理。E-mail: lzhgeog@sina.cn |
收稿日期: 2020-04-30
要求修回日期: 2020-10-07
网络出版日期: 2021-05-28
基金资助
国家自然科学基金项目(42001166)
国家自然科学基金项目(41771180)
中国博士后科学基金资助项目(2019M660776)
版权
Spatial distribution of population decline areas in China and underlying causes from a multi-periodical perspective
Received date: 2020-04-30
Request revised date: 2020-10-07
Online published: 2021-05-28
Supported by
National Natural Science Foundation of China(42001166)
National Natural Science Foundation of China(41771180)
China Postdoctoral Science Foundation(2019M660776)
Copyright
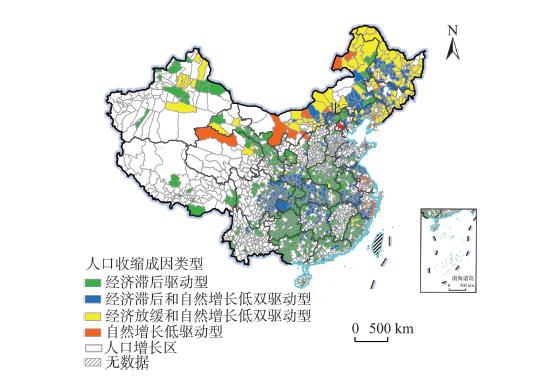
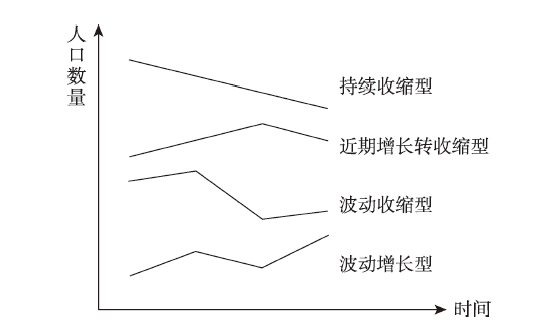
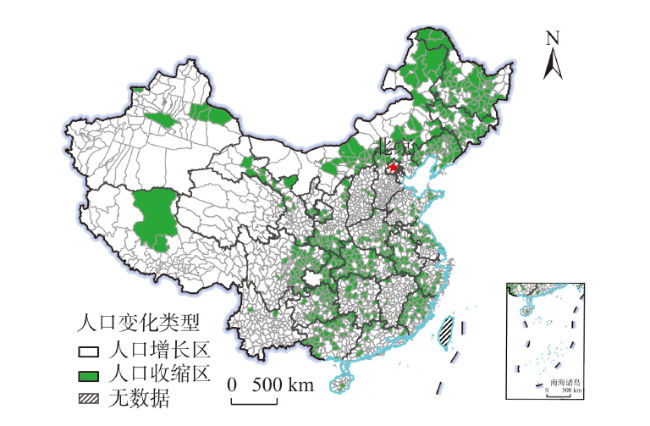
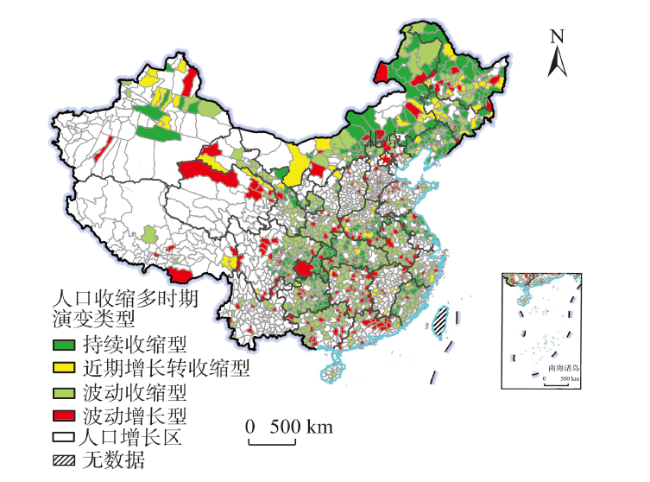
近年来,中国人口增长进入关键转折期,人口收缩现象在区域尺度上呈现快速蔓延趋势。利用全国人口普查和1%人口抽样调查数据,论文从多时期演变视角对1990—2015年县市尺度人口收缩区进行识别,并分析其空间特征;然后,在人口收缩影响因素理论分析的基础上,利用聚类分析的方法划分出不同的成因类型,并进一步选取典型案例进行分析,主要结果如下:① 人口收缩区存在不同的演变路径,约24%的县市为波动收缩,约13%的县市为持续收缩,约5%的县市为近期增长转收缩。② 波动收缩型分布较为广泛,包括长江中游地区、川黔渝地区、甘肃、陕西、江苏北部、福建西部等,持续收缩型主要集中在川黔渝地区和东北地区,而近期增长转收缩型主要集中在东北地区、河南和新疆。③ 人口收缩的成因特征存在明显的区域差异,经济滞后驱动型占比最高,以中西部地区分布最为集中;经济放缓和自然增长低双驱动型主要分布在东北地区;自然增长低驱动型占比较低,主要分布在东部地区。基于以上研究结果,论文认为需要重视区域尺度的人口收缩现象,并根据不同区域人口收缩演变趋势及成因的差异,采取针对性的应对措施。
刘振 , 戚伟 , 齐宏纲 , 刘盛和 . 多时期演变视角下中国人口收缩区的识别、空间特征与成因类型分析[J]. 地理科学进展, 2021 , 40(3) : 357 -369 . DOI: 10.18306/dlkxjz.2021.03.001
Regional population decline has gradually become a new phenomenon in recent years, which has attracted extensive attention from scholars and the government. Using the national census data and 1% population sampling survey data, this study identified the population decline areas at the county level from 1990 to 2015 from a multi-periodical perspective. Based on the theoretical analysis of the driving factors of population decline, a cluster analysis has been conducted to reveal the spatial differences of the driving factors of population decline, which resulted in four typical cases of causes. The findings are as follows: First, the population decline areas have very different trajectories: while about 24% of them are characterized by fluctuating but overall decline, about 13% of them have experienced continuous decline, and about 5% of them have only experienced recent decline. Second, the fluctuating but overall decline county units were mainly distributed in the middle reaches of the Yangtze River and Gansu, Shaanxi, Jiangsu, and Fujian Provinces, and the continuous decline county units were mainly concentrated in Sichuan, Guizhou, Chongqing, and the Northeast region, and the recent decline county units were mainly concentrated in the Northeast region, Henan, and Xinjiang. Third, there are obvious regional differences in the driving factors of population decline: the county units driven by lagged economy accounted for the highest percentage, and these units were mainly distributed in the central and western regions; the county units in the Northeast region were mainly driven by the slowed economic development and the low natural growth level; in contrast, the percentage of county units only driven by the low natural growth level is relatively low, and these units were mainly distributed in the eastern region. Based on these findings, we argue that it is necessary to pay more attention to the phenomenon of population decline at the regional scale, and take targeted measures by fully considering the trend of change and driving factors of population decline in different regions.
Key words: population decline; population change; migration; county-level; China
表1 多时期演化视角下人口收缩区数量及占比特征Tab.1 The number of population decline areas from a multi-periodical perspective |
| 收缩区演变类型 | 全国 | 东部地区 | 中部地区 | 西部地区 | 东北地区 | |||||||||
|---|---|---|---|---|---|---|---|---|---|---|---|---|---|---|
| 数量/个 | 占比/% | 数量/个 | 占比/% | 数量/个 | 占比/% | 数量/个 | 占比/% | 数量/个 | 占比/% | |||||
| 持续收缩型 | 278 | 13.0 | 47 | 9.0 | 51 | 9.5 | 112 | 12.4 | 68 | 39.5 | ||||
| 近期增长转收缩型 | 112 | 5.2 | 17 | 3.3 | 32 | 6.0 | 31 | 3.4 | 32 | 18.6 | ||||
| 波动收缩型 | 511 | 23.9 | 106 | 20.3 | 144 | 26.9 | 227 | 25.1 | 34 | 19.8 | ||||
| 波动增长型 | 205 | 9.6 | 56 | 10.7 | 64 | 12.0 | 71 | 7.9 | 14 | 8.1 | ||||
| 总计 | 1106 | 51.8 | 226 | 43.3 | 291 | 54.4 | 441 | 48.8 | 148 | 86.0 | ||||
表2 人口收缩的影响因素及指标选取Tab.2 Driving factors of population decline and their indicators |
| 影响因素 | 变量 | 变量简称 | 说明 |
|---|---|---|---|
| 经济发展水平 | 人均GDP | Pergdp | 1990年取人均工农业生产总值,其他年份为人均国内生产总值 |
| 非农就业占比 | Pjob | 二三产业从业人口占总人口的比例 | |
| 经济增长速度 | 人均GDP增长率 | Rgdp | 人均GDP期末值相比期初值的增长率 |
| 非农就业占比变化 | Rjob | 非农就业占比期末值与期初值的差值 | |
| 公共服务和基础设施 | 交通便捷度 | Traffic | 公路网总长度与总面积的比值 |
| 教育水平 | Pedu | 按照现行学制为受教育年数计算的6岁以上人口平均受教育年限 | |
| 人口自然增长 | 出生率 | Birth | 年出生人口与年平均人口的比值 |
| 老龄化率 | Aging | 65岁以上人口占总人口的比值 |
注:各指标具体数据来源及处理详见“1.2 数据来源与处理”;在非农就业占比上,一般采用二三产业从业人口占从业人员总数的比例,但是在部分欠发达的区,由于从业人员总体规模较低,也会出现二三产从业人员占比较高的情况,但是这并不代表其就业发展水平较高,因此本文采用二三产业从业人口占总人口的比例来反映一个区域获得非农就业机会的难易程度。 |
表3 县市人口变化与各影响因素的相关分析结果Tab.3 Correlation analysis of population change and influencing factors |
| 变量 | 1990—2000年 | 2000—2010年 | 2010—2015年 |
|---|---|---|---|
| Pergdp | 0.35** | 0.59** | 0.29** |
| Pjob | 0.48** | 0.67** | 0.21** |
| Rgdp | 0.29** | 0.52** | 0.21** |
| Rjob | 0.27** | -0.01 | 0.03* |
| Traffic | 0.16** | 0.39** | 0.26** |
| Pedu | 0.29** | 0.41** | 0.17** |
| Birth | 0.02 | 0.12* | 0.24** |
| Aging | -0.25** | -0.17** | -0.22** |
注:**和*分别表示在1%和5%的显著水平下显著;因变量为各时期的年均人口变化率,自变量为各影响因素相应时期的初期值或变化值。 |
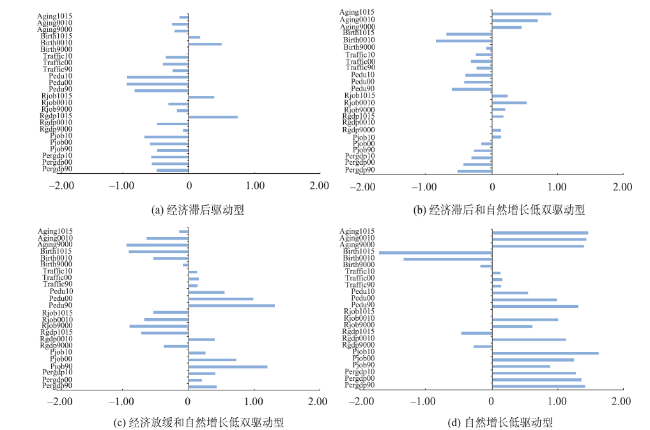
图5 1990—2015年县市尺度人口收缩成因类型划分结果注:本文对各变量进行了Z-score标准化,若横坐标值为负,则表明该指标值低于全国平均水平,其值的绝对值为低于全国平均水平的标准差的倍数,反之亦然;变量后“90”“00”“10”分别指该变量1990、2000、2010年标准化值,Rgdp和Rjob变量后“9000”“0010”“1015”分别指该变量1990—2000、2000—2010、2010—2015年变化值,Birth和Aging变量后“9000”“0010”“1015”分别指上述3个时期的平均值。 Fig.5 Identification of the different causes of population decline at the county level, 1990-2015 |
图6 1990—2015年县市尺度人口收缩成因类型空间分布Fig.6 Spatial distribution of the different causes of population decline at the county level, 1990-2015 |
| [1] |
|
| [2] |
|
| [3] |
|
| [4] |
|
| [5] |
|
| [6] |
|
| [7] |
|
| [8] |
|
| [9] |
|
| [10] |
|
| [11] |
|
| [12] |
|
| [13] |
张青. 总和生育率的测算及分析[J]. 中国人口科学, 2006(4): 35-42, 95.
[
|
| [14] |
周文. 全面二孩政策下中国未来30年人口趋势预测[J]. 统计与决策, 2018, 34(21): 109-112.
[
|
| [15] |
刘振, 戚伟, 王雪芹, 等. 国内外人口收缩研究进展综述[J]. 世界地理研究, 2019, 28(1): 13-23.
[
|
| [16] |
刘振, 齐宏纲, 戚伟, 等. 1990—2010年中国人口收缩区分布的时空格局演变: 基于不同测度指标的分析[J]. 地理科学, 2019, 39(10): 1525-1536.
[
|
| [17] |
朱宇, 丁金宏, 王桂新, 等. 近40年来的中国人口地理学: 一个跨学科研究领域的进展[J]. 地理科学进展, 2017, 36(4): 466-482.
[
|
| [18] |
王露, 封志明, 杨艳昭, 等. 2000—2010年中国不同地区人口密度变化及其影响因素[J]. 地理学报, 2014, 69(12): 1790-1798.
[
|
| [19] |
|
| [20] |
杨艳昭, 赵延德, 封志明, 等. 长三角都市区人口集疏过程及其空间格局变化[J]. 西北人口, 2013, 34(6): 34-39.
[
|
| [21] |
段学军, 王书国, 陈雯. 长江三角洲地区人口分布演化与偏移增长[J]. 地理科学, 2008, 28(2): 139-144.
[
|
| [22] |
游珍, 王露, 封志明, 等. 珠三角地区人口分布时空格局及其变化特征[J]. 热带地理, 2013, 33(2): 156-163.
[
|
| [23] |
戚伟, 刘盛和, 金凤君. 东北三省人口流失的测算及演化格局研究[J]. 地理科学, 2017, 37(12): 1795-1804.
[
|
| [24] |
龚胜生, 陈丹阳, 张涛. 1982—2010年湖北省人口分布格局变迁及其影响因素[J]. 长江流域资源与环境, 2015, 24(5): 728-734.
[
|
| [25] |
刘志敏, 修春亮, 魏冶, 等. 1990—2010年东北地区人口变化的空间格局及影响因素[J]. 西北人口, 2017, 38(5): 19-26.
[
|
| [26] |
张国俊, 黄婉玲, 周春山, 等. 城市群视角下中国人口分布演变特征[J]. 地理学报, 2018, 73(8): 1513-1525.
[
|
| [27] |
杨强, 李丽, 王运动, 等. 1935—2010年中国人口分布空间格局及其演变特征[J]. 地理研究, 2016, 35(8): 1547-1560.
[
|
| [28] |
赵清林, 张伟娜, 李心怡, 等. 2006—2015年湖北省城市相对收缩时空变化[J]. 地理科学进展, 2020, 39(7): 1106-1116.
[
|
| [29] |
杜志威, 李郇. 珠三角快速城镇化地区发展的增长与收缩新现象[J]. 地理学报, 2017, 72(10): 1800-1811.
[
|
| [30] |
龙瀛, 吴康, 王江浩. 中国收缩城市及其研究框架[J]. 现代城市研究, 2015(9): 14-19.
[
|
| [31] |
周恺, 钱芳芳, 严妍. 湖南省多地理尺度下的人口“收缩地图”[J]. 地理研究, 2017, 36(2): 267-280.
[
|
| [32] |
邓沛勇, 刘毅华. 中国县域单元城镇人口收缩的空间格局及其影响因素分析[J]. 现代城市研究, 2018(3): 31-38.
[
|
| [33] |
刘振, 戚伟, 齐宏纲, 等. 1990—2015年中国县市尺度人口收缩的演变特征及影响因素[J]. 地理研究, 2020, 39(7): 1565-1579.
[
|
| [34] |
王桂新. 中国区域经济发展水平及差异与人口迁移关系之研究[J]. 人口与经济, 1997(1): 50-56.
[
|
| [35] |
李扬, 刘慧, 汤青. 1985—2010年中国省际人口迁移时空格局特征[J]. 地理研究, 2015, 34(6): 1135-1148.
[
|
| [36] |
刘晏伶, 冯健. 中国人口迁移特征及其影响因素: 基于第六次人口普查数据的分析[J]. 人文地理, 2014, 29(2): 129-137.
[
|
| [37] |
王婧, 刘奔腾, 李裕瑞. 京津冀人口时空变化特征及其影响因素[J]. 地理研究, 2018, 37(9): 1802-1817.
[
|
| [38] |
王珏, 陈雯, 袁丰. 基于社会网络分析的长三角地区人口迁移及演化[J]. 地理研究, 2014, 33(2): 385-400.
[
|
| [39] |
林李月, 朱宇. 中国城市流动人口户籍迁移意愿的空间格局及影响因素: 基于2012年全国流动人口动态监测调查数据[J]. 地理学报, 2016, 71(10): 1696-1709.
[
|
| [40] |
戚伟, 赵美风, 刘盛和. 1982—2010年中国县市尺度流动人口核算及地域类型演化[J]. 地理学报, 2017, 72(12): 2131-2146.
[
|
| [41] |
刘涛, 齐元静, 曹广忠. 中国流动人口空间格局演变机制及城镇化效应: 基于2000和2010年人口普查分县数据的分析[J]. 地理学报, 2015, 70(4): 567-581.
[
|
| [42] |
封志明, 唐焰, 杨艳昭, 等. 中国地形起伏度及其与人口分布的相关性[J]. 地理学报, 2007, 62(10): 1073-1082.
[
|
| [43] |
罗庆, 王冰冰, 樊新生, 等. 山区县人口分布的时空特征及主要影响因素分析: 以河南省嵩县为例[J]. 地理科学进展, 2020, 39(7): 1073-1084.
[
|
/
| 〈 |
|
〉 |
