
中国城市日企的同业与同源效应——以京、沪、广、深为例
|
刘玉潇(1996- ), 女,河北省石家庄人,硕士生,研究方向为区域与城市规划。E-mail:2170902021@cnu.edu.cn |
收稿日期: 2019-08-29
要求修回日期: 2019-12-06
网络出版日期: 2021-01-28
基金资助
国家自然科学基金项目(41771183)
国家自然科学基金项目(41771183(41571154)
版权
The same industry effect and the same source effect of Japanese companies in China: Take Beijing, Shanghai, Guangzhou and Shenzhen as examples
Received date: 2019-08-29
Request revised date: 2019-12-06
Online published: 2021-01-28
Supported by
National Natural Science Foundation of China(41771183)
National Natural Science Foundation of China(41571154)
Copyright
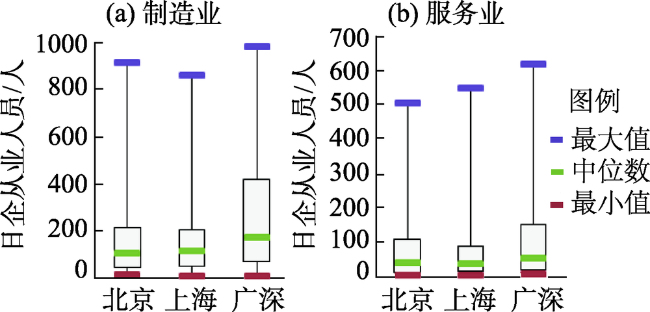
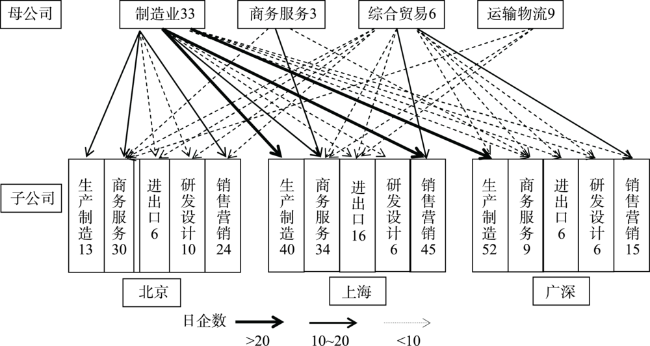
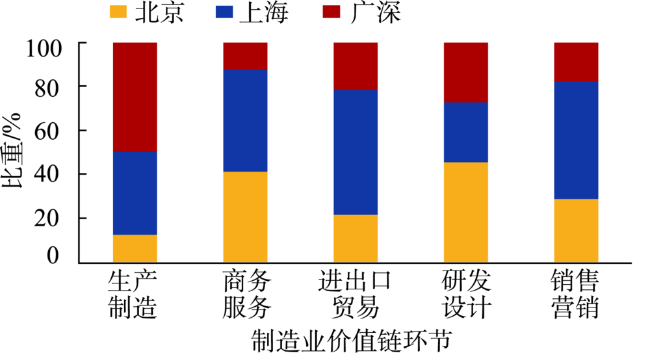
日本外商直接投资(Foreign Direct Investment, FDI)企业在中国北京、上海和广深等典型城市高度集聚,现有研究一方面将FDI均质化处理,缺乏精细的产业划分,另一方面缺少国家内部的同源集聚分析,同时对典型城市集聚的异同性关注不够。为弥补研究不足,论文在集聚的研究基础上,重点关注日企集中分布的典型城市,对比其同业集聚效应和同源集聚效应。选取1984—2017年日本在北京、上海和广深的FDI企业级数据,利用多项Logistic回归分析方法,以广深为参照系,建立分别包括7个方程在内的同业集聚效应模型和同源集聚效应模型,同步考虑企业所属行业和价值链环节、进入模式与时间等企业异质性控制变量,分析京、沪、广深两效应的异同。研究结果表明:日企在中国典型城市的同业效应和同源效应异同性明显。具体表现在:第一,上海同业效应和异业效应最为显著,且结果稳健,广深同业效应略强于北京,但结果稳健性较差;第二,上海同源和异源效应结果稳健且显著,企业的追随效应较强,北京和广深差异较小;第三,企业属性变量的引入,有效提升了模型的解释力度。上海的日企进入时间较早,各地企业规模整体差别不大。上海日企进入模式以独资为主,北京和广深以合资为主,但独资化趋势明显;北京行业结构中服务业占比较高,广深制造业独大;广深和上海产业链环节中侧重生产制造和进出口贸易环节,北京商务服务和研发设计布局较多。
刘玉潇 , 王茂军 . 中国城市日企的同业与同源效应——以京、沪、广、深为例[J]. 地理科学进展, 2020 , 39(11) : 1845 -1859 . DOI: 10.18306/dlkxjz.2020.11.006
The distribution of Japanese foreign direct investment (FDI) companies in China is extremely uneven and these companies are highly concentrated in the Beijing, Shanghai, and Guangzhou-Shenzhen regions. Traditional FDI research has always focused on how urban attributes and conditions affect the location choice of companies. But the role of spatial agglomeration should be equally concerned. Existing research on agglomeration has shortcomings, such as homogenizing FDI and lack of detailed classification of industries, which lead to significant differences in the results of the studies. Whether companies will follow the investment location choice of other companies with the same source country has not received enough attention. At the same time, there is insufficient attention to the similarities and differences of typical urban agglomerations. To address these issues, based on the research of agglomeration and by focusing on typical cities where Japanese companies are concentrated, this study compared and analyzed the same industry agglomeration effect and the same source agglomeration effect. Using the FDI enterprise data of Japan in Beijing, Shanghai, and Guangzhou-Shenzhen in 1984 to 2017 and the multivariate logistic regression analysis method, with Guangzhou-Shenzhen as the reference region, we established the same industry agglomeration effect model and the same source agglomeration effect model, which includes seven equations each. Enterprise heterogeneity control variables such as industry and value chain links, entry mode, and entry time were added to the model to compare and analyze similarities and differences between Beijing, Shanghai, and Guangzhou-Shenzhen. The results show that the similarities and differences of the same industrial agglomeration effect and the agglomeration effects of the same source are obvious for Japanese companies in typical cities in China. Specifically: 1) Shanghai's same industrial agglomeration and cross-industry agglomeration are the most significant, and the results are stable. Guangzhou-Shenzhen's same industrial agglomeration is slightly stronger than Beijing, but the results are less robust. 2) The results of Shanghai's same source agglomeration are stable and significant and the agglomeration effect of enterprises is strong. The difference between Beijing and Guangzhou-Shenzhen is small. 3) The introduction of enterprise attribute variables has effectively improved the explanatory power of the model. The entry time of Japanese companies in Shanghai is earlier, and the overall size of enterprises across the country is not much different. The entry mode of Japanese enterprises in Shanghai is mainly sole proprietorship. In Beijing and Guangzhou-Shenzhen these companies are mainly joint ventures, but the increasing trend of sole proprietorship is obvious. The proportion of companies in the service industry is relatively high in Beijing, and the number of manufacturing companies is the largest in Guangzhou-Shenzhen. The Japanese companies in Guangzhou-Shenzhen and Shanghai focus on manufacturing or import and export trade in the industrial chain, and the number of companies specializing in business services and research and development is the highest in Beijing.
表1 模型变量Tab.1 Model variables |
| 变量名称 | 指标 | 衡量指标 | 单位或说明 |
|---|---|---|---|
| 同业效应 | 同业集聚 | 投资前城市已有同行业日企数 | 个 |
| 异业集聚 | 投资前城市已有其他行业日企数 | 个 | |
| 同源效应 | 同源集聚 | 已有同源子公司数量 | 个 |
| 异源集聚 | 已有不同源子公司数量 | 个 | |
| 异质性因素 | 进入时间 | 日企子公司首次进驻时间 | 年 |
| 企业规模 | 子公司的从业人员规模 | 人 | |
| 进入模式 | 进入城市的所有权形式 | 独资=1,合资=0 | |
| 产业链环节 | 企业所处价值链环节 | 生产制造=0,商务服务=1,进出口贸易=2, 研发设计=3,销售营销=4 | |
| 行业类别 | 企业所属行业 | 服务业=0,制造业=1 |
表2 同业效应模型检验Tab.2 Model test of the same industry effect |
| 指标 | 方程1 | 方程2 | 方程3 | 方程4 | 方程5 | 方程6 | 方程7 | |
|---|---|---|---|---|---|---|---|---|
| N | 342 | 342 | 193 | 342 | 342 | 342 | 186 | |
| 伪R2 | Cox和Snell | 0.183 | 0.226 | 0.178 | 0.218 | 0.288 | 0.278 | 0.670 |
| Nagelkerke | 0.209 | 0.257 | 0.203 | 0.248 | 0.328 | 0.316 | 0.761 | |
| McFadden | 0.096 | 0.121 | 0.093 | 0.117 | 0.161 | 0.154 | 0.522 | |
| 似然比显著性水平 | <0.001 | <0.001 | <0.001 | <0.001 | <0.001 | <0.001 | <0.001 | |
| 分类百分比校正/% | 49.40 | 47.70 | 47.20 | 51.80 | 56.70 | 54.00 | 78.50 | |
表3 同业效应回归结果Tab.3 Results for the same industry clusters effect |
| 变量 | 方程1 | 方程2 | 方程3 | 方程4 | 方程5 | 方程6 | 方程7 | |||||||||||||
|---|---|---|---|---|---|---|---|---|---|---|---|---|---|---|---|---|---|---|---|---|
| 北京 | 上海 | 北京 | 上海 | 北京 | 上海 | 北京 | 上海 | 北京 | 上海 | 北京 | 上海 | 北京 | 上海 | |||||||
| 进入时间 | 0.104**(0.025) | 0.002*(0.093) | 0.143(0.391) | -1.373***(<0.001) | ||||||||||||||||
| 企业规模 | <0.001(0.173) | <0.001(0.286) | <0.001(0.794) | -0.001(0.177) | ||||||||||||||||
| 合资 | -1.475**(0.001) | -1.314**(0.002) | -1.263*(0.051) | -1.182(0.158) | ||||||||||||||||
| 生产制造 | -2.519***(<0.001) | -1.090**(0.010) | -1.066(0.253) | 2.857 (0.145) | ||||||||||||||||
| 商务服务 | 0.033(1.034) | 0.035(0.941) | 0.031(0.968) | 3.290*(0.062) | ||||||||||||||||
| 进出口贸易 | -1.162** (0.036) | -0.472(0.310) | -0.362(0.623) | 3.719**(0.035) | ||||||||||||||||
| 研发设计 | -0.182(0.777) | -1.113*(0.098) | -0.131(0.888) | 3.978*(0.065) | ||||||||||||||||
| 服务业 | 2.277*** (<0.001) | 0.742**(0.012) | 2.087**(0.006) | -0.649(0.480) | ||||||||||||||||
| 同业集聚 | 0.008(0.700) | 0.057**(0.001) | -0.005(0.817) | 0.056**(0.001) | -0.005(0.879) | -0.028(0.270) | 0.014(0.524) | 0.062*** (<0.001) | 0.003(0.907) | -0.060**(0.001) | 0.006(0.804) | 0.055**(0.010) | -0.045(0.425) | 0.282**(0.003) | ||||||
| 异业集聚 | -0.006(0.218) | 0.014**(0.001) | -0.002**(0.022) | 0.014**(0.001) | -0.008(0.269) | 0.016**(0.006) | -0.008(0.113) | 0.012**(0.004) | -0.014**(<0.001) | -0.014***(<0.001) | -0.016**(0.007) | 0.010**(0.012) | -0.046(0.233) | 0.210*** (<0.001) | ||||||
| 百分比校正/% | 19.3 | 75.8 | 19.3 | 77.0 | 29.8 | 74.5 | 14.5 | 72.0 | 45.8 | 67.7 | 48.2 | 64.6 | 60.0 | 93.0 | ||||||
注:***、**、*分别表示通过0.01、0.05、0.1显著性水平检验;括号中数据为Sig显著性。下同。 |
表4 同源效应模型检验Tab.4 Model test of the same source effect |
| 指标 | 方程1 | 方程2 | 方程3 | 方程4 | 方程5 | 方程6 | 方程7 | |
|---|---|---|---|---|---|---|---|---|
| N | 342 | 340 | 187 | 342 | 342 | 342 | 186 | |
| 伪R2 | Cox和Snell | 0.189 | 0.383 | 0.205 | 0.220 | 0.288 | 0.283 | 0.678 |
| Nagelkerke | 0.215 | 0.436 | 0.233 | 0.251 | 0.328 | 0.322 | 0.771 | |
| McFadden | 0.099 | 0.229 | 0.108 | 0.118 | 0.161 | 0.158 | 0.535 | |
| 似然比显著性水平 | <0.001 | <0.001 | <0.001 | <0.001 | <0.001 | <0.001 | <0.001 | |
| 分类百分比校正/% | 47.10 | 66.20 | 47.10 | 51.20 | 56.10 | 54.70 | 78.00 | |
表5 同源效应回归结果Tab.5 Results for the same source city clusters effect |
| 变量 | 方程1 | 方程2 | 方程3 | 方程4 | 方程5 | 方程6 | 方程7 | |||||||
|---|---|---|---|---|---|---|---|---|---|---|---|---|---|---|
| 北京 | 上海 | 北京 | 上海 | 北京 | 上海 | 北京 | 上海 | 北京 | 上海 | 北京 | 上海 | 北京 | 上海 | |
| 进入时间 | 0.185**(0.006) | -0.487***(<0.001) | 0.093(0.579) | -1.392** (<0.001) | ||||||||||
| 企业规模 | <0.001(0.204) | <0.001(0.401) | <0.001(0.996) | -0.001(0.199) | ||||||||||
| 合资 | -1.432***(0.001) | -1.220**(0.004) | -1.360**(0.042) | -1.065(0.210) | ||||||||||
| 生产制造 | -2.505***(<0.001) | -1.098 (<0.001) | -1.105(0.225) | 2.978(0.130) | ||||||||||
| 商务服务 | 0.038(0.939) | -0.180(0.175) | 0.198(0.802) | 3.374*(0.054) | ||||||||||
| 进出口贸易 | -1.115** (0.036) | -0.630(0.175) | 0.032(0.996) | 3.691**(0.033) | ||||||||||
| 研发设计 | -0.135(0.832) | -0.858(0.183) | -0.234(0.800) | 4.164*(0.052) | ||||||||||
| 服务业 | 2.298*** (<0.001) | 0.693** (0.017) | 2.140**(0.005) | -0.531(0.564) | ||||||||||
| 同源集聚 | -0.014(0.168) | 0.030***(<0.001) | 0.017(0.258) | 0.102*** (<0.001) | -0.031(0.003) | -0.029**(0.003) | -0.014(0.155) | 0.030*** (<0.001) | -0.023(0.030) | -0.026***(<0.001) | -0.026**(0.017) | 0.026*** (<0.001) | -0.072*(0.068) | 0.237*** (<0.001) |
| 异源集聚 | -0.002(0.769) | 0.014**(0.001) | 0.032(0.022) | 0.089*** (<0.001) | -0.003(0.594) | 0.013**(0.021) | -0.003(0.623) | 0.014**(0.003) | -0.008(0.140) | -0.011**(0.015) | -0.009*(0.096) | 0.012**(0.012) | -0.026(0.475) | 0.220*** (<0.001) |
| 百分比校正/% | 21.7 | 75.2 | 19.3 | 86.3 | 32.6 | 74.4 | 15.7 | 71.4 | 45.8 | 67.7 | 48.2 | 66.5 | 64.4 | 93.0 |
表6 日本FDI股权结构变化Tab.6 Shareholding structure change of Japanese FDI |
| 地区 | 2001年前 | 2002—2012年 | 2013年后 | 合计 | |||||||
|---|---|---|---|---|---|---|---|---|---|---|---|
| 合资数量/家 | 比重/% | 合资数量/家 | 比重/% | 合资数量/家 | 比重/% | 合资企业/家 | 比重/% | ||||
| 北京 | 70 | 63.63 | 119 | 60.71 | 20 | 42.55 | 209 | 59.21 | |||
| 上海 | 282 | 53.80 | 527 | 39.80 | 115 | 47.13 | 924 | 44.17 | |||
| 广深 | 77 | 81.00 | 178 | 64.96 | 32 | 69.56 | 267 | 64.34 | |||
注:样本量北京353家,上海2092家,广深415家。 |
| [1] |
刘作丽, 贺灿飞. 在华外商直接投资区位研究述评[J]. 地理科学进展, 2009,28(6):952-961.
[
|
| [2] |
文余源. FDI理论与区位决策研究述评[J]. 地理科学进展, 2008,27(2):60-73.
[
|
| [3] |
夏良科. 外商直接投资动态演变: 基于城市数据的经验分析[J]. 国际商务研究, 2013,34(3):5-15.
[
|
| [4] |
田素华, 杨烨超. FDI 进入中国区位变动的决定因素: 基于D-G 模型的经验研究[J]. 世界经济, 2012(11):59-87.
[
|
| [5] |
|
| [6] |
|
| [7] |
杨仁发, 刘纯彬. 中国生产性服务业 FDI 影响因素实证研究[J]. 国际贸易问题, 2012(11):107-116.
[
|
| [8] |
曾鹏, 秦艳辉. 城市行政级别、产业集聚对外商直接投资的影响[J]. 国际贸易问题, 2017(1):104-115.
[
|
| [9] |
|
| [10] |
崔庆欢. 集聚视角下生产性服务业在我国区位选择研究[D]. 蚌埠: 安徽财经大学, 2015.
[
|
| [11] |
孙浦阳, 韩帅, 靳舒晶. 产业集聚对外商直接投资的影响分析: 基于服务业与制造业的比较研究[J]. 数量经济技术经济研究, 2012(9):40-57.
[
|
| [12] |
赵伟, 张萃. FDI与中国制造业区域集聚: 基于20个行业的实证分析[J]. 经济研究, 2007(11):82-90.
[
|
| [13] |
梁琦. 跨国公司海外投资和产业集聚[J]. 世界经济, 2003(9):29-37.
[
|
| [14] |
张俊妮, 陈玉宇. 产业集聚、所有制结构与外商投资企业区位选择[J]. 经济学, 2006,5(4):1091-1108.
[
|
| [15] |
王丽艳. 产业专业化、多样化与FDI引资转型[D]. 湘潭: 湘潭大学, 2015.
[
|
| [16] |
肖文, 林高榜. 产业集聚和外国直接投资区位选择: 基于长三角地区经济发展的视角[J]. 国际贸易问题, 2008(7):82-86.
[
|
| [17] |
胡平, 伍新木, 文余源. 基于面板数据SDM的长江中游城市群FDI决定因素分析[J]. 经济地理, 2014,34(1):15-21.
[
|
| [18] |
胡志强, 苗长虹, 华明芳, 等. 中国外商直接投资区位选择的时空格局与影响因素[J]. 人文地理, 2018,33(5):88-96.
[
|
| [19] |
唐宜红, 王林. 我国服务业外商直接投资的决定因素分析: 基于行业面板数据的实证研究[J]. 世界经济研究, 2012(10):75-81.
[
|
| [20] |
|
| [21] |
颜银根. FDI 区位选择: 市场潜能、地理集聚与同源国效应[J]. 财贸经济, 2014(9):103-113.
[
|
| [22] |
|
| [23] |
|
| [24] |
刘晓宁. 企业对外直接投资区位选择: 东道国因素与企业异质性因素的共同考察[J]. 经济经纬, 2018,35(3):59-66.
[
|
| [25] |
符文颖, 吴艳芳. 德国在华知识密集制造业投资进入方式的时空特征及区位影响因素[J]. 地理学报, 2017,72(8):1361-1372.
[
|
| [26] |
王茂军, 徐永平. 中国在美洲的OFDI基本特征与决定因素[J]. 地理学报, 2017,72(8):1373-1391.
[
|
/
| 〈 |
|
〉 |


