
中间产品贸易网络结构及其演化的影响因素探究——基于贸易成本视角
|
马佳卉(1995— ),女,陕西咸阳人,硕士生,研究方向为经济地理。E-mail: majiahui@pku.edu.cn |
收稿日期: 2019-06-05
要求修回日期: 2019-09-11
网络出版日期: 2019-11-01
基金资助
国家自然科学基金重点项目(No. 41731278)
国家自然科学基金杰出青年基金项目(No. 41425001)
版权
Structure and change of international trade network of intermediate goods: From the perspective of trade costs
Received date: 2019-06-05
Request revised date: 2019-09-11
Online published: 2019-11-01
Supported by
Key Project of National Natural Science Foundation of China(No. 41731278)
National Science Fund for Distinguished Young Scholars(No. 41425001)
Copyright
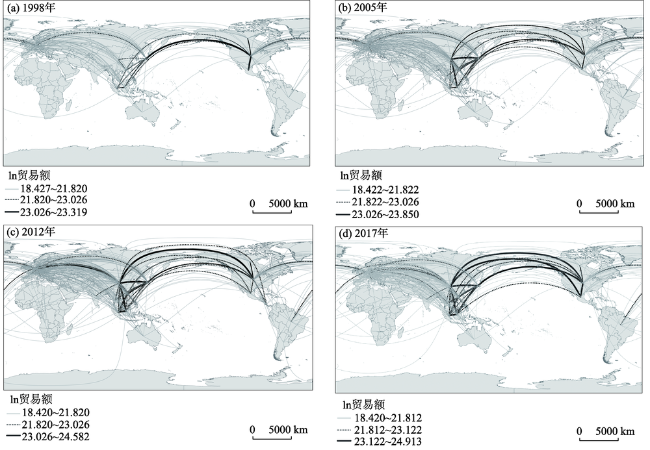
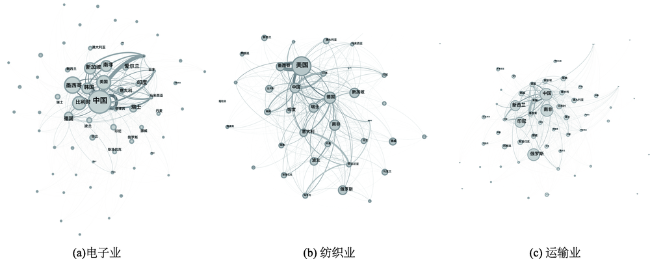
随着经济全球化不断地扩展和加深,生产分工进入产品内分工阶段,中间产品贸易所占比重逐渐增加。中间产品贸易是产品内分工的主要表现形式。论文选取了纺织业、运输业和电子产业分别作为劳动力密集型产业、传统全球分工产业和技术密集型产业的代表,研究其贸易网络结构的特征与演化趋势。并以中国为中心的中间产品贸易网络为例,探究了影响贸易网络变化的因素。研究表明:① 3种产业的中间产品贸易网络结构有明显差异,电子产业网络联系紧密,而运输业和纺织业的结构则相对松散。② 1998—2017年,中国在全球贸易网络中的地位明显提升。③ 从影响中间产品贸易网络结构的因素来看:地理距离对中间产品出口偏好的影响显著,但是仅纺织业体现出了地理距离衰减效应,在电子和运输业中,地理距离越大,贸易偏好反而越高;沟通成本显著影响中国对目的地国家的出口偏好,中国文化在目的地国家推广能够提高贸易偏好;目的国制度质量对贸易偏好的影响显著,国家的话语权和可靠性能够提高中国对目的地国家的中间产品出口偏好,但同时,规制的质量越高,中国对其出口偏好则更低。④ 劳动力成本的差异在3种产业中均体现出十分重要的作用。
马佳卉 , 贺灿飞 . 中间产品贸易网络结构及其演化的影响因素探究——基于贸易成本视角[J]. 地理科学进展, 2019 , 38(10) : 1607 -1620 . DOI: 10.18306/dlkxjz.2019.10.015
With the expansion and continuous deepening of globalization, more countries are involved in the trend. In the meantime, the segregation of production has entered the stage of intra-product specialization. Trade of intermediate goods, as an embodiment of intra-product specialization, is taking up a growing proportion of global trade. In this study, we examined the structure and change of the intermediate goods trade network of textile industry, automobile industry, and electronic industry as typical examples of labor-intensive industry, traditional globalized industry, and tech-intensive industry, respectively. Then, we took China's exportation network as an example and looked into the factors that influenced its change. The results are as follows: 1) Structures of the three networks of difference industries show great heterogeneity—the network of electronics is more condensed, while the other two are looser. 2) During 1998-2017, China had been playing an increasingly more significant role in the global intermediate goods trade network. 3) Geographic distance significantly influences trade preference, yet only in the textile industry does the distance attenuation effect stand; Lower communication cost significantly increases trade preference and promotion of Chinese culture also increases trade preference; Institution of destination countries significantly influences trade preference—stronger voice and accountability of the state increases trade preference, while higher institutional quality repulses trade preference. Labor cost also affects trade preference significantly.
Key words: intermediate goods; trade network; cost of trade
表1 进出口前10名的贸易伙伴Tab.1 Top 10 trade partners with China |
| 排序 | 1998年 | 2007年 | 2016年 | |||||
|---|---|---|---|---|---|---|---|---|
| 出口 | 进口 | 出口 | 进口 | 出口 | 进口 | |||
| 1 | 美国 | 日本 | 美国 | 日本 | 美国 | 韩国 | ||
| 2 | 日本 | 韩国 | 日本 | 韩国 | 韩国 | 马来西亚 | ||
| 3 | 新加坡 | 美国 | 韩国 | 菲律宾 | 墨西哥 | 日本 | ||
| 4 | 韩国 | 新加坡 | 新加坡 | 马来西亚 | 日本 | 美国 | ||
| 5 | 德国 | 德国 | 德国 | 美国 | 新加坡 | 菲律宾 | ||
| 6 | 马来西亚 | 马来西亚 | 墨西哥 | 新加坡 | 德国 | 新加坡 | ||
| 7 | 法国 | 芬兰 | 马来西亚 | 德国 | 马来西亚 | 泰国 | ||
| 8 | 英国 | 英国 | 英国 | 泰国 | 印度 | 越南 | ||
| 9 | 加拿大 | 法国 | 西班牙 | 哥斯达黎加 | 越南 | 德国 | ||
| 10 | 墨西哥 | 瑞典 | 泰国 | 法国 | 泰国 | 墨西哥 | ||
表2 自变量基本信息Tab.2 Independent variables |
| 解释维度 | 变量名称 | 变量描述 | 数据来源 | |
|---|---|---|---|---|
| 交通运输成本 | TransCost | contig, s_dist | 目的地与中国是否接壤,目的地国与中国最大城市间的地理距离 | CEPII |
| 沟通成本 | CommCost | comlang_off | 使用相同的官方语言 | CEPII |
| kzpp | 人均孔子学院数量 | 孔子学院官方网站整理 | ||
| 制度壁垒成本 | InstCost | vad, pvd, rqd | 话语权和可靠性,政治稳定性与无暴乱,恐怖主义管制质量 | 全球治理指数 World Bank |
| 劳动力成本 | LaborCost | s_income | 人均国民收入 | World Bank |
| s_laborratio | 15~64岁劳动力占比 | World Bank | ||
| 控制变量 | GDP | s_gdp | GDP | World Bank |
| Population | s_popu | 总人口 | World Bank | |
表3 自变量相关系数Tab.3 Correlation of independent variable |
| 变量 | RTPij | contig | s_dist | comlang_off | kzpp | s_income | s_laborratio | vad | pvd | rqd | s_gdp | s_popu |
|---|---|---|---|---|---|---|---|---|---|---|---|---|
| RTPij | 1.000 | |||||||||||
| contig | 0.231 | 1.000 | ||||||||||
| s_dist | -0.105 | -0.418 | 1.000 | |||||||||
| comlang_off | 0.183 | 0.262 | -0.262 | 1.000 | ||||||||
| kzpp | -0.076 | -0.017 | -0.067 | -0.028 | 1.000 | |||||||
| s_income | -0.143 | -0.026 | -0.300 | 0.294 | 0.132 | 1.000 | ||||||
| s_laborratio | -0.056 | 0.133 | -0.377 | 0.233 | 0.173 | 0.624 | 1.000 | |||||
| vad | -0.239 | -0.217 | 0.100 | -0.031 | 0.227 | 0.427 | 0.295 | 1.000 | ||||
| pvd | -0.283 | -0.111 | -0.091 | 0.157 | 0.226 | 0.595 | 0.429 | 0.662 | 1.000 | |||
| rqd | -0.202 | -0.126 | -0.176 | 0.237 | 0.185 | 0.705 | 0.508 | 0.768 | 0.699 | 1.000 | ||
| s_gdp | 0.149 | 0.083 | -0.059 | -0.030 | -0.007 | 0.214 | 0.127 | 0.179 | 0.026 | 0.172 | 1.000 | |
| s_popu | 0.168 | 0.347 | -0.133 | -0.046 | -0.068 | -0.079 | -0.008 | 0.009 | -0.218 | -0.091 | 0.531 | 1.000 |
表4 全产业回归结果Tab.4 Regression results of all industries |
| 维度 | 变量 | 模型1 | 模型2 | 模型3 | 模型4 | 模型5 |
|---|---|---|---|---|---|---|
| TransCost | contig | 0.251*** | 0.367*** | |||
| s_dist | 0.029 | -0.009 | ||||
| CommCost | comlang_off | 0.393*** | 0.519*** | |||
| kzpp | 0.030*** | 0.023*** | ||||
| LaborCost | s_income | 0.009 | 0.004 | |||
| s_laborratio | 0.149*** | 0.170*** | ||||
| InstCosti | vad | 0.048*** | ||||
| pvd | -0.027*** | 0.184*** | ||||
| rqd | -0.118*** | 0.076*** | ||||
| s_gdp | 0.051*** | 0.014** | 0.062*** | -0.005 | 0.006 | |
| s_popu | 0.094*** | 0.097*** | 0.166*** | 0.102*** | 0.052** | |
| 常数 | -0.207*** | -0.216*** | -0.185*** | -0.164*** | 1.532*** | |
| 观测值 | 8698 | 10844 | 10776 | 8796 | 10781 | |
| N | 648 | 700 | 696 | 657 | 695 |
注:***、**、*分别表示P<0.01、P<0.05、P<0.1。下同。 |
表5 电子产业回归结果Tab.5 Regression results of electronic industry |
| 维度 | 变量 | 模型6 | 模型7 | 模型8 | 模型9 | 模型10 |
|---|---|---|---|---|---|---|
| TransCost | contig | 0.348*** | 0.421*** | |||
| s_dist | 0.101*** | 0.063* | ||||
| CommCost | comlang_off | 0.319* | 0.318 | |||
| kzpp | 0.040*** | 0.025*** | ||||
| LaborCost | s_income | 0.015 | 0.012 | |||
| s_laborratio | 0.119*** | 0.135*** | ||||
| InstCosti | vad | 0.023 | ||||
| pvd | -0.038** | 0.183*** | ||||
| rqd | -0.103*** | 0.067*** | ||||
| s_gdp | 0.055*** | 0.000 | 0.062*** | -0.015 | 0.007 | |
| s_popu | 0.052 | 0.085*** | 0.114*** | 0.082*** | 0.055 | |
| 常数 | -0.016 | -0.053* | -0.014 | -0.003 | 1.527*** | |
| 观测值 | 2225 | 2787 | 2770 | 2242 | 2787 | |
| N | 167 | 178 | 177 | 168 | 178 |
表6 纺织行业回归结果Tab.6 Regression results of textile industry |
| 维度 | 变量 | 模型11 | 模型12 | 模型13 | 模型14 | 模型15 |
|---|---|---|---|---|---|---|
| TransCost | contig | 0.102 | 0.323*** | |||
| s_dist | -0.095*** | -0.127*** | ||||
| CommCost | comlang_off | 0.414** | 0.673*** | |||
| kzpp | 0.011 | 0.021*** | ||||
| LaborCost | s_income | 0.018 | -0.005 | |||
| s_laborratio | 0.143*** | 0.175*** | ||||
| InstCosti | vad | 0.041 | ||||
| pvd | -0.043* | 0.190*** | ||||
| rqd | -0.131*** | 0.109*** | ||||
| s_gdp | 0.087*** | 0.057*** | 0.096*** | 0.027 | 0.006 | |
| s_popu | 0.094** | 0.029 | 0.164*** | 0.084** | 0.058 | |
| 常数 | -0.276*** | -0.318*** | -0.290*** | -0.274*** | 1.530*** | |
| 观测值 | 2061 | 2502 | 2485 | 2078 | 2503 | |
| N | 159 | 170 | 169 | 160 | 170 |
表7 运输产业回归结果Tab.7 Regression results of automobile industry |
| 维度 | 变量 | 模型16 | 模型17 | 模型18 | 模型19 | 模型20 |
|---|---|---|---|---|---|---|
| TransCost | contig | 0.345*** | 0.422*** | |||
| s_dist | 0.101*** | 0.064* | ||||
| CommCost | comlang_off | 0.330* | 0.318 | |||
| kzpp | 0.033*** | 0.025*** | ||||
| LaborCost | s_income | 0.012 | 0.013 | |||
| s_laborratio | 0.110*** | 0.135*** | ||||
| InstCosti | vad | 0.020 | ||||
| pvd | -0.036** | 0.179*** | ||||
| rqd | -0.104*** | 0.064*** | ||||
| s_gdp | 0.057*** | 0.000 | 0.062*** | -0.015 | 0.007 | |
| s_popu | 0.048 | 0.085*** | 0.114*** | 0.082*** | 0.050 | |
| 常数 | -0.006 | -0.052* | -0.014 | -0.000 | 1.541*** | |
| 观测值 | 2194 | 2778 | 2761 | 2241 | 2714 | |
| N | 161 | 178 | 177 | 167 | 173 |
表8 稳健性检验Tab.8 Robust test |
| 变量 | 缩尾2.5% | 缩尾5% | ||||||||
|---|---|---|---|---|---|---|---|---|---|---|
| 总产业 | 电子 | 纺织 | 运输 | 总产业 | 电子 | 纺织 | 运输 | |||
| TransCost | contig | 0.249*** | 0.345*** | 0.105 | 0.341*** | 0.242*** | 0.336*** | 0.094 | 0.333*** | |
| s_dist | 0.030* | 0.102*** | -0.094*** | 0.102*** | 0.030* | 0.101*** | -0.092*** | 0.102*** | ||
| CommCost | comlang_off | 0.374*** | 0.292* | 0.404** | 0.302* | 0.360*** | 0.279 | 0.394** | 0.289* | |
| kzpp | 0.029*** | 0.037*** | 0.011 | 0.032*** | 0.028*** | 0.035*** | 0.011 | 0.031*** | ||
| LaborCost | s_income | 0.015 | 0.026 | 0.022 | 0.020 | 0.017 | 0.029 | 0.024 | 0.022 | |
| s_laborratio | 0.148*** | 0.115*** | 0.140*** | 0.110*** | 0.146*** | 0.111*** | 0.137*** | 0.109*** | ||
| InstCosti | vad | 0.051*** | 0.026 | 0.046 | 0.024 | 0.050*** | 0.024 | 0.045 | 0.023 | |
| pvd | -0.029*** | -0.040*** | -0.047** | -0.037** | -0.029*** | -0.040*** | -0.047** | -0.037*** | ||
| rqd | -0.119*** | -0.104*** | -0.133*** | -0.105*** | -0.119*** | -0.103*** | -0.132*** | -0.107*** | ||
| s_gdp | 0.050*** | 0.053*** | 0.087*** | 0.055*** | 0.050*** | 0.053*** | 0.086*** | 0.056*** | ||
| s_popu | 0.096*** | 0.054 | 0.094** | 0.050 | 0.096*** | 0.055 | 0.094** | 0.050 | ||
| 常数 | -0.212*** | -0.019 | -0.285*** | -0.012 | -0.211*** | -0.015 | -0.283*** | -0.012 | ||
| 观测值 | 8698 | 2225 | 2061 | 2194 | 8698 | 2225 | 2061 | 2194 | ||
| N | 648 | 167 | 159 | 161 | 648 | 167 | 159 | 161 | ||
| [1] |
卜国琴, 刘德学 . 2006. 中国服装加工贸易升级研究: 基于全球服装生产网络视角[J]. 国际贸易, ( 11):27-31.
[
|
| [2] |
戴翔, 金碚 . 2014. 产品内分工、制度质量与出口技术复杂度[J]. 经济研究, 49(7):4-17, 43.
[
|
| [3] |
彼得·迪肯 . 2007. 全球性转变: 重塑21世纪的全球经济地图 [M]. 刘卫东, 等, 译. 北京: 商务印书馆.
[
|
| [4] |
段颀 . 2011. 企业异质性与企业内贸易:新新贸易理论[J]. 中国商贸,(26): 241-242,256.
[
|
| [5] |
高菠阳, 李俊玮 . 2017. 全球电子信息产业贸易网络演化特征研究[J]. 世界地理研究, 26(1):1-11.
[
|
| [6] |
郝晓晴, 安海忠, 陈玉蓉 , 等. 2013. 基于复杂网络的国际铁矿石贸易演变规律研究[J]. 经济地理, 33(1):92-97.
[
|
| [7] |
康继军, 张梦珂, 黎静 . 2019. 孔子学院对中国出口贸易的促进效应: 基于“一带一路”沿线国家的实证分析[J]. 重庆大学学报(社会科学版), 25(5):1-17.
[
|
| [8] |
李坤望, 王永进 . 2010. 契约执行效率与地区出口绩效差异: 基于行业特征的经验分析[J]. 经济学(季刊), 9(3):1007-1028.
[
|
| [9] |
连大祥 . 2012. 孔子学院对中国出口贸易及对外直接投资的影响[J]. 中国人民大学学报, 26(1):88-98.
[
|
| [10] |
刘庆玉, 熊广勤 . 2011. 中间产品、工业化转型与中国经济增长[J]. 改革与战略, 27(9):29-32.
[
|
| [11] |
卢锋 . 2006. 中国国际收支双顺差现象研究: 对中国外汇储备突破万亿美元的理论思考[J]. 世界经济, 29(11):3-10.
[
|
| [12] |
马风涛, 李俊 . 2011. 国际中间产品贸易的发展及其政策含义[J]. 国际贸易, ( 9):12-17.
[
|
| [13] |
宋周莺, 车姝韵, 杨宇 . 2017. “一带一路”贸易网络与全球贸易网络的拓扑关系[J]. 地理科学进展, 36(11):1340-1348.
[
|
| [14] |
孙晓蕾, 杨玉英, 吴登生 . 2012. 全球原油贸易网络拓扑结构与演化特征识别[J]. 世界经济研究,(9): 11- 17, 87.
[
|
| [15] |
王爱虎, 钟雨晨 . 2006. 中国吸引跨国外包的经济环境和政策研究[J]. 经济研究, ( 8):81-92.
[
|
| [16] |
王倩倩, 杜德斌, 张杨 , 等. 2019. 全球手机贸易网络演化特征研究[J]. 世界地理研究, 28(2):170-178.
[
|
| [17] |
谢孟军 . 2017. 文化“走出去”的投资效应研究: 全球1326所孔子学院的数据[J]. 国际贸易问题, ( 1):39-49.
[
|
| [18] |
阳立高, 谢锐, 贺正楚 , 等. 2014. 劳动力成本上升对制造业结构升级的影响研究: 基于中国制造业细分行业数据的实证分析[J]. 中国软科学, ( 12):136-147.
[
|
| [19] |
姚秋蕙, 韩梦瑶, 刘卫东 . 2018. 全球服装贸易网络演化研究[J]. 经济地理, 38(4):26-36.
[
|
| [20] |
余淼杰, 李乐融 . 2016. 贸易自由化与进口中间品质量升级: 来自中国海关产品层面的证据[J]. 经济学(季刊), 15(3):1011-1028.
[
|
| [21] |
余淼杰, 张睿 . 2017. 中国制造业出口质量的准确衡量: 挑战与解决方法[J]. 经济学(季刊), 16(2):463-484.
[
|
| [22] |
张彬, 桑百川 . 2013. 中国中间产品出口与产业升级研究[J]. 亚太经济, ( 6):105-111.
[
|
| [23] |
郑蕾, 刘毅, 刘卫东 . 2016. 全球整车及其零部件贸易格局演化特征[J]. 地理科学, 36(5):662-670.
[
|
| [24] |
|
| [25] |
|
| [26] |
|
| [27] |
|
| [28] |
|
| [29] |
|
| [30] |
|
| [31] |
|
| [32] |
|
| [33] |
|
| [34] |
|
| [35] |
|
| [36] |
|
| [37] |
|
| [38] |
|
| [39] |
|
| [40] |
|
| [41] |
|
| [42] |
|
| [43] |
|
| [44] |
|
| [45] |
|
| [46] |
|
| [47] |
|
| [48] |
|
| [49] |
|
| [50] |
|
| [51] |
|
| [52] |
|
| [53] |
|
| [54] |
|
| [55] |
|
| [56] |
|
| [57] |
|
| [58] |
|
| [59] |
|
/
| 〈 |
|
〉 |