
中国出口贸易韧性空间差异性研究
|
贺灿飞(1972— ),男,江西永新人,教授,博士生导师,研究方向为经济地理、产业和区域经济。E-mail: hecanfei@urban.pku.edu.cn |
收稿日期: 2019-05-31
要求修回日期: 2019-07-16
网络出版日期: 2019-11-01
基金资助
国家自然科学基金重点项目(No. 41731278)
国家自然科学基金杰出青年基金项目(No. 41425001)
版权
Spatial difference and mechanisms of China’s export trade regional resilience
Received date: 2019-05-31
Request revised date: 2019-07-16
Online published: 2019-11-01
Supported by
Key Project of National Natural Science Foundation of China(No. 41731278)
National Science Fund for Distinguished Young Scholars(No. 41425001)
Copyright
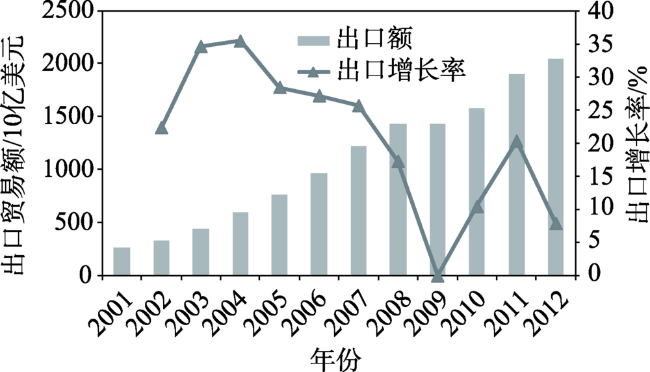
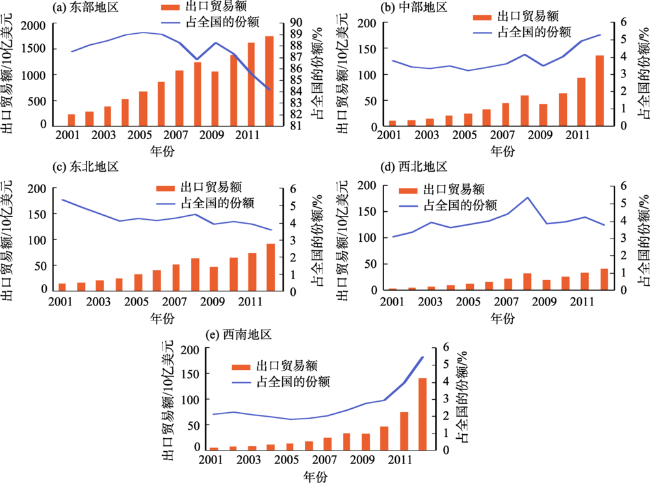
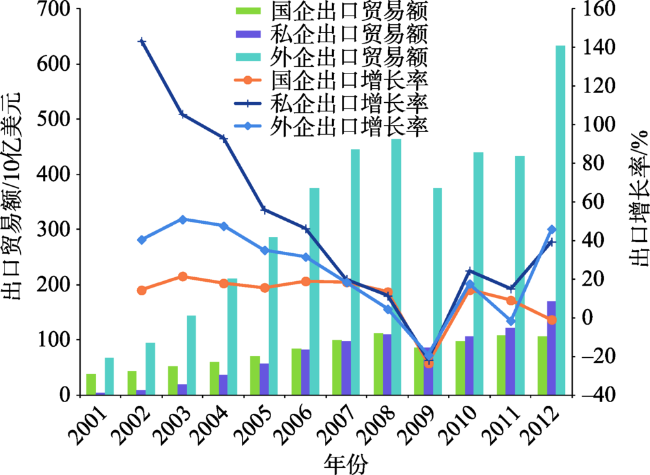
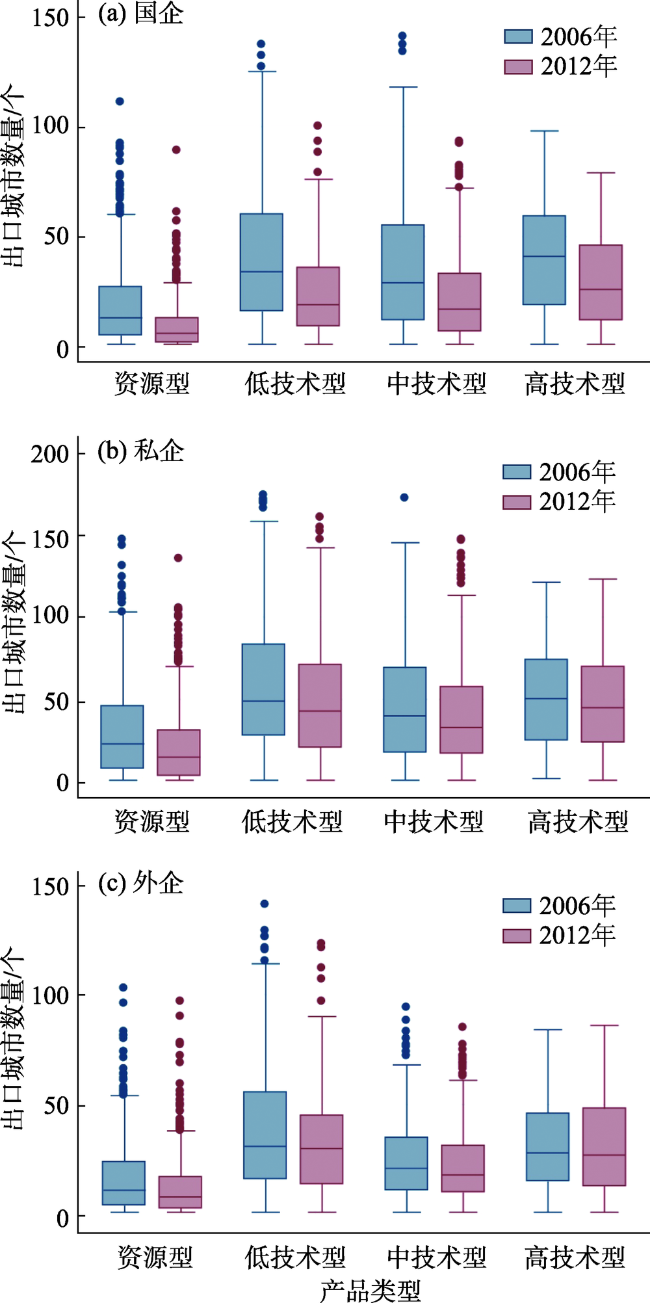
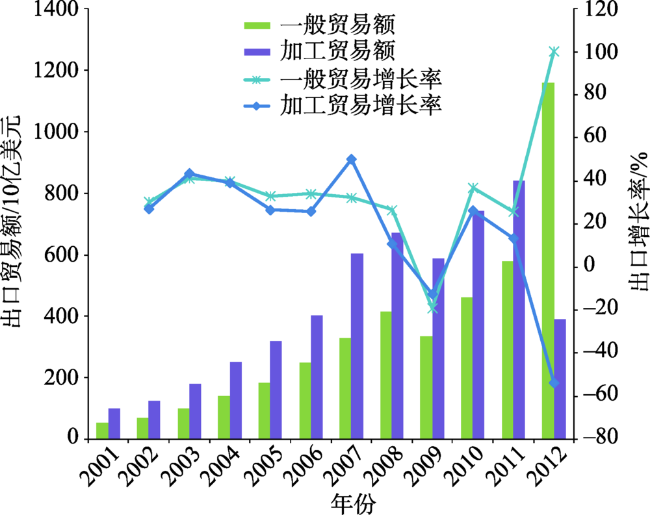
金融危机时期,中国区域出口韧性表现出危机第一阶段(2008—2009年)的抵抗力、危机第二阶段(2009—2011年)的恢复力、产品结构转换提升力。论文构建了区域-产品层面的区域出口贸易韧性指标,通过区域出口贸易额、产品结构等不同层面刻画了金融危机后各区域抵抗力、恢复力的空间差异。实证研究表明:相关多样化产业结构不仅在短期可以增强区域产品的抵抗力,在长期还可以提高区域产品的恢复力并且助推区域产品实现结构升级;应急型税收政策短期内一定程度上可以有效缓解危机冲击,但其影响范围及作用时间均是有限的;外企出口占比高的区域产品对区域产品结构升级影响不明显,但加工贸易方式推动了区域产品在危机中的结构升级。
贺灿飞 , 夏昕鸣 , 黎明 . 中国出口贸易韧性空间差异性研究[J]. 地理科学进展, 2019 , 38(10) : 1558 -1570 . DOI: 10.18306/dlkxjz.2019.10.011
After the global financial crisis, the resilience of China's regional exports is reflected in three stages: resistance in the first stage of the crisis (2008-2009), resilience in the second stage of the crisis (2009-2011), and promotion in product structure transformation after the crisis. This study constructed a regional export trade resilience index at the regional-product level, and described the spatial differences of regional resilience and resilience after the financial crisis with regard to regional export trade volume and product structure. The results of the regional-product level econometric model show that the diversification of related industrial structure not only can enhance the resistance of regional products in the short run, but also can improve the resilience of regional products in the long run, and further promote the upgrading of regional product structure. Emergency tax policy can effectively alleviate the impact of crisis in the short term, but its impact is limited and does not last; regional products with high export proportion of foreign enterprises have little effect on the upgrading of regional product structure, but processing trade promotes the upgrading of regional product structure in the crisis.
表1 优势产品抵抗力模型回归结果(2008—2009年)Tab.1 Dominant product resistance model regression results, 2008-2009 |
| 解释变量 | 全国 | 东部 | 东北 | 中部 | 西部 | |||||||||
|---|---|---|---|---|---|---|---|---|---|---|---|---|---|---|
| 模型1 | 模型2 | 模型3 | 模型4 | 模型5 | 模型6 | 模型7 | 模型8 | 模型9 | 模型10 | |||||
| 税收政策(危机前) | -4.10*** | -3.61*** | -7.47*** | -4.31*** | -2.44* | |||||||||
| 税收政策(危机后) | 3.94*** | 3.16** | -7.46*** | 2.77*** | -2.39 | |||||||||
| 产品加工贸易方式占比 | 4.92** | 3.17** | 0.64 | 0.36 | -7.60*** | -7.11*** | -3.67*** | -2.16*** | 14.06*** | 14.28*** | ||||
| 产品外企出口占比 | -2.47*** | -3.92*** | 1.46 | 0.86 | -4.66*** | -4.83*** | -9.40*** | -8.09*** | -6.08*** | -6.14*** | ||||
| 产品技术关联 | 6.46*** | 1.67 | 1.79*** | -0.88 | 6.46*** | 6.84*** | 1.42 | -0.70 | -7.29*** | -7.21*** | ||||
| 产品进口额 | -2.91 | -7.44 | -3.36 | -4.62 | 3.67 | 3.47 | 0.60 | -1.61 | -2.38 | -2.39 | ||||
| 产品出口目的国数量 | 20.26*** | 16.42*** | 17.04*** | 13.99*** | 6.26*** | 6.18*** | 14.08*** | 12.61*** | 11.11*** | 11.04*** | ||||
| 产品复杂度 | 9.67*** | 9.46*** | 9.07*** | 8.83*** | 0.70 | 0.66 | -2.86*** | -2.68*** | 6.38*** | 6.67* | ||||
| 区域变量 | 是 | 是 | 是 | 是 | 是 | 是 | 是 | 是 | 是 | 是 | ||||
| Pseudo R2 | 0.038 | 0.0396 | 0.0326 | 0.0412 | 0.034 | 0.0362 | 0.1244 | 0.1142 | 0.1218 | 0.1428 | ||||
注:***、**、*分别表示P<0.01、P<0.05、P<0.1。下同。 |
表2 优势衰退产品恢复力模型回归结果(2008—2011年)Tab.2 Resilience model regression results for dominant products that have declined, 2008-2011 |
| 解释变量 | 全国 | 东部 | 东北 | 中部 | 西部 |
|---|---|---|---|---|---|
| 模型1 | 模型2 | 模型3 | 模型4 | 模型5 | |
| 税收政策(危机后) | 0.8 | -4.87*** | -2.03* | -1.38 | 1.03 |
| 产品加工贸易方式占比 | -2.66** | -6.22*** | -2.69** | 0.41 | 4.92*** |
| 产品外企出口占比 | 11.66*** | 8.69*** | 11.28*** | 4.62*** | 2.18* |
| 产品技术关联 | 10.87*** | 8.26*** | 7.32*** | 7.66*** | 2.27* |
| 产品进口额 | 10.97*** | 13.17*** | 4.68*** | 3.12** | -1.22 |
| 产品出口目的国数量 | 1.87* | 0.62*** | 6.66*** | 7.64*** | 11.32*** |
| 产品复杂度 | -3.46** | 1.37 | 0.94 | -4.21*** | -9.03*** |
| 区域变量 | 是 | 是 | 是 | 是 | 是 |
| Pseudo R2 | 0.0214 | 0.0343 | 0.0386 | 0.0392 | 0.0362 |
表3 区域出口复杂度模型回归结果(2007—2011年)Tab.3 Regression results of regional export complexity model, 2007-2011 |
| 解释变量 | 税收政策 (危机后) | 区域加工 贸易方式占比 | 区域外企 出口占比 | 相关多样化 | 区域进口额 | 区域出口 目的国数量 | 区域平均 劳动力成本 | 区域创新投入 | 结构 变化 | |
|---|---|---|---|---|---|---|---|---|---|---|
| 回归系数 | -11.97*** | 13.16*** | 12.46 | 6.13*** | 10.97*** | 1.87** | -9.68 | 2.64*** | 1.26 |
| [1] |
白胜玲, 崔霞 . 2009. 出口退税对我国出口贸易的影响: 基于主要贸易国的实证分析[J]. 税务研究, ( 9):37-40.
[
|
| [2] |
陈梦远 . 2017. 国际区域经济韧性研究进展: 基于演化论的理论分析框架介绍[J]. 地理科学进展, 36(11):1435-1444.
[
|
| [3] |
郭琪, 贺灿飞 . 2018. 演化经济地理视角下的技术关联研究进展[J]. 地理科学进展, 37(2):229-238.
[
|
| [4] |
贺灿飞, 董瑶, 周沂 . 2016. 中国对外贸易产品空间路径演化[J]. 地理学报, 71(6):970-983.
[
|
| [5] |
蒋殿春, 夏良科 . 2005. 外商直接投资对中国高技术产业技术创新作用的经验分析[J]. 世界经济, ( 8):3-10.
[
|
| [6] |
李健 . 2008. 人民币加快升值对我国外贸发展的影响[J]. 国际贸易, ( 6):53-58.
[
|
| [7] |
李彤玥, 牛品一, 顾朝林 . 2014. 弹性城市研究框架综述[J]. 城市规划学刊, ( 5):23-31.
[
|
| [8] |
刘晴, 徐蕾 . 2013. 对加工贸易福利效应和转型升级的反思: 基于异质性企业贸易理论的视角[J]. 经济研究, ( 9):137-148.
[
|
| [9] |
骆东奇, 郭英, 李乐 等. 2009. 金融危机背景下我国经济增长的区域差异及原因[J]. 经济地理, 29(9):1448-1453.
[
|
| [10] |
马捷, 李飞 . 2008. 出口退税是一项稳健的贸易政策吗?[J]. 经济研究, ( 4):78-87.
[
|
| [11] |
漆晓宇, 庞洁 . 2004. 试论我国加工贸易现状及其发展[J]. 当代财经, ( 2):101-103.
[
|
| [12] |
齐俊妍, 刘静 . 2010. 金融危机背景下中国出口退税政策的调整及效果评价[J]. 对外经贸实务, ( 4):29-32.
[
|
| [13] |
唐东波 . 2012. 贸易政策与产业发展: 基于全球价值链视角的分析[J]. 管理世界, ( 12):13-22.
[
|
| [14] |
谢建国, 陈莉莉 . 2008. 出口退税与中国的工业制成品出口: 一个基于长期均衡的经验分析[J]. 世界经济, 31(5):3-12.
[
|
| [15] |
|
| [16] |
|
| [17] |
|
| [18] |
|
| [19] |
|
| [20] |
|
| [21] |
|
| [22] |
|
| [23] |
|
| [24] |
|
| [25] |
|
| [26] |
|
| [27] |
|
| [28] |
|
| [29] |
|
| [30] |
|
| [31] |
|
| [32] |
|
| [33] |
|
| [34] |
|
| [35] |
|
| [36] |
|
| [37] |
|
| [38] |
|
| [39] |
|
| [40] |
|
| [41] |
|
| [42] |
|
| [43] |
|
/
| 〈 |
|
〉 |