梁珊 , 邓羽
, 邓羽
LIANG Shan, DENG Yu
通讯作者:
收稿日期: 2018-05-4
修回日期: 2019-01-10
网络出版日期: 2019-03-28
版权声明: 2019 地理科学进展 《地理科学进展》杂志 版权所有
基金资助:
作者简介:
第一作者简介:梁珊(1993— ),女,陕西宝鸡人,硕士生,城市空间形态与污水系统关系研究。E-mail: caulsjy@163.com
展开
摘要
城市形态与污水设施的运行之间关系密切,探讨城市形态对城市内污水设施的影响对解决现有设施存在的水力失效及未来情景应对能力欠佳等问题具有重要价值。因此,论文测算了现阶段中国地级城市的城市形态,设置了城市形态情景和排水情景,使用Kruscal算法进行管网定线、SWMM软件模拟系统性能,构建自上而下的虚拟城市空间与污水系统耦合模型,探索了不同形态城市的污水系统生命周期成本、结构和性能的一般性规律,构建了系统经济性、有效性和适应性指标体系以综合评估城市污水系统。研究发现,在城市人口36.24万、面积35 km2的规模下,污水系统的生命周期成本约为6亿~7亿元。方形、长条形和星形的流速失效比分别为0.55、0.67、0.55,充满度失效比分别为0.35、0.42、0.36。在排水情景改变下,污水量变小时,系统流速失效情况均更为严重,而充满度失效情况均有所改善;当污水量变大时,流速失效情况均有所改善,而充满度失效情况更为严重。分析系统结构特性,发现越分散的污水系统连通性越好,长条形城市的污水系统相较于方形和星形城市更为集中。对指标作相关性分析,发现越分散的污水系统经济性和有效性更好,但适应性更差。从系统经济性和有效性角度出发,方形和星形城市更有利。从污水系统适应性角度出发,长条形城市优于方形和星形城市,结合2010—2015年的城市形态分析,长条→长条(变化前后城市形态均为长条形,以此类推)、星形→长条、方形→长条的86个城市的城市发展方向不够合理,各城市在未来扩建或新建规划中应在因地制宜基础上考虑内部污水设施,选择合理的城市形态。
关键词:
Abstract
Urban sewage systems in China have been developing rapidly in recent years, with problems of system hydraulic failure in peak period, challenge from change of drainage scenario caused by population change, climate change, and water saving behavior; and urban form is closely related to the operation of urban facilities. This study set up urban morphology scenarios and drainage scenarios, built a top-down virtual model of urban space and sewage system, used Kruscal algorithm for network routing and SWMM software for system simulation, and sampled a large number of sewage system solutions, to explore life cycle cost, structure, and operation of urban sewage systems, and assess urban sewage systems with regard to economic performance, effectiveness, and adaptability. The study found that life cycle cost is about 600-700 million yuan for the city. The velocity failure rate of square, rectangular, and star-shaped cities is 0.55, 0.67, and 0.55 respectively, and the capacity failure rate is 0.35, 0.42, and 0.36. Under the low discharge sewage scenario, velocity failure of the system turns more serious, and capacity failure of the system is improved. Under the high discharge sewage scenario, velocity failure is improved, but capacity failure is more serious. More dispersed sewage systems have better connectedness and the sewage system of rectangular city is more centralized than the square and star-shaped cities. Correlation analysis showed that the more dispersed sewage system is more economical and effective, but the adaptability is worse. Finally, from the perspective of system economy and effectiveness, square and star-shaped cities perform better. With regard to the adaptability of sewage system, rectangular city is superior to square and star-shaped cities. Based on the urban forms of the 86 Chinese urban areas examined in this study, the development trend is unreasonable. It is hoped that the conclusion can provide some reference for future urban planning and urban form management.
Keywords:
中国拥有世界最大规模的人口和第二大规模的污水系统设施(Batt et al, 2007),后者也是城市基础设施的重要组成和确保城市水系统安全的重要支撑。污水设施短期内难以重构的特性是污水设施需求优化的一大挑战,一方面,污水系统面临因城镇化(Astaraie-Imani et al, 2012;Deng et al, 2013)、气候变暖(Pingale et al, 2014;Foti et al, 2014)以及节水行为(Beal et al, 2011;Makki et al, 2015)等带来的污水量改变的问题,现有污水系统能否适应未来排水情景的改变,适应性能到底如何还需探明;另一方面,目前城市污水设施的运行还存在严重问题,由于污水排放在一天当中具有峰值,高峰期污水量过大易造成管网充满度过大损害管网寿命,低峰时段又因为管段内污水流速过低容易产生淤塞(白桦, 2016)等问题。能否从城市规划层面解决上述问题?城市形态与城市基础设施之间存在强相关性,据作者调查,中国2010年地级城市空间形态紧凑度与城市管网密度、污水处理率、设施规模密度和污水处理厂负荷率等的配置水平均存在显著相关性,城市越紧凑,污水设施系统规模越小。不同的城市人口时空分布会带来不同的城市污水时空分布,可能使污水系统在峰值期出现的水力问题得到改善。因此,在城市空间结构与形态层面研究污水系统设施的运行,具有一定现实意义。
城市形态直接影响城市内部各组成部分的总体布局,关系城市生产、生活质量、城市改造和城市合理发展方向等(崔功豪等, 1990;Kotharkar et al, 2012;李旋旗等, 2012;赵会兵等, 2016)。国外对于城市形态与交通的环境影响之间关系的研究较多(Giuliano et al, 2003; Borrego et al, 2006; Hong et al, 2014; Kashem et al, 2014),主要是模拟不同土地利用模式和道路结构下交通出行的碳排放和空气污染状况。其次是与公共健康暴露之间关系的研究(Schweitzer et al, 2010;Schindler et al, 2014;Mansfield et al, 2015),主要通过对面板数据进行多元回归分析和虚拟城市模拟等方法来探究不同城市形态对公共健康的影响。也有与住宅能耗间关系的研究。如Ewing等(2008)考虑电力传输和分配损失等因素分析城市形态对住宅能耗的影响,认为紧凑型可节省能耗。国内关于城市形态和城市环境要素间关系的研究主要集中在应对气候变化和空气污染(杨磊等, 2011; 崔胜辉等, 2015; 范晨璟等, 2017)等领域。方法上大多使用面板数据、以表征城市形态的指标与环境要素间的相关性分析为主(秦波等, 2013; 佘倩楠等, 2015; 陈珍启等, 2016),也出现了少量通过构建模型模拟环境响应的研究(龙瀛等, 2011)。卢思佳等(2010)研究了表征城市外轮廓的指标与城市投入要素之间定量化的相关性,发现城市越紧凑,人口密度越大,交通网络越均衡,人均城市要素占用量越少。郭腾云等(2009)也发现,随着城市紧凑度的提高,城市资源要素的配置和利用水平及城市效率均有一定提高。潘竟虎等(2015)认为,H形和星形形态对消除大气污染的效果最好。但尚缺乏使用建模方法从城市形态本身出发研究其对城市基础设施的规模、运行效率等方面影响的理论性研究。国外有一些关于城市空间形态与城市给水设施间关系的理论探讨:Filion(2008)使用虚拟城市和LCA(生命周期评价)的方法,研究几种典型城市形态下给水管网空间分布与能耗的关系,认为放射状多中心城市形态人均给水能耗最低;Farmani等(2014)结合虚拟城市和情景分析的方法,基于小城镇给水管网扩建构建不同城市形态,探究不同人口增长情景下的水量、水质、成本及设施效率,认为均匀扩展最具成本效益;Wong等(2015)基于北美真实街道形状概化而成的给水管网布局形态,以虚拟城市和自底向上建模的方法研究其空间分布与能耗的关系。因此使用虚拟城市探究城市形态和城市污水系统的结构以及运行性能间关系具有一定可行性。
基于以上研究背景,本文通过研究现阶段中国地级城市的城市形态特征,设计具有代表性城市形态特征的虚拟城市,以城市地块为基本单元,构建自上而下的城市空间与污水系统耦合模型,通过大规模采样的方法去探索不同形态城市的污水设施成本、结构和性能的一般性规律,并从污水系统的经济性、有效性以及适应性角度出发去评估城市污水系统,进而再以城市污水系统的综合评估结果反馈指导未来城市规划以及城市形态管理,从而辅助提升城市污水系统的未来排水情景应对能力并优化其利用现状。
城市形态、城市人口数量和城市面积具有相互对应且相互制约的关系,因此虚拟城市的人口数量和城市面积参数的选择非常重要,本文将真实城市的人口、面积和设施规模之间的对应关系特征应用到案例城市的参数选择上来,通过研究2015年中国各分类地级城市的城区人口规模、建成区面积、人口密度、污水处理厂座数和处理能力,得到一般性小城市的人口密度和污水处理设施一般规模,小城市平均建成区面积53 km2(含工业用地),人口33万。最终确定虚拟城市人口约为36.24万,城市面积约为35 km²。对城市打格子形成排水DU(排水地块),每个格子代表一个排水DU,规模为300 m×300 m,人口聚集在DU上,每个DU周围有4条道路。DU单元的基础属性包括编号、高程、坐标、排污总量以及日排污过程线。其中为避免高程差异影响,增加方案间可比性,设置统一高程,必要时按照水力计算要求加设泵站。使用MATLAB计算各DU间的邻接关系和路由关系,按照不同的情景设置将DU拼装成逻辑关系上的虚拟城市。
1.2.1 形态情景
为了获得虚拟城市形态的设置依据,本文截取了2010和2015年全国所有地级城市建成区的边界图,并据此计算了2个年份所有地级城市建成区边界的面积-长轴相对指数(SL),该指数是将标准正方形与研究形状比较得出一个相对指数;表示图形偏离标准正方形的程度,数值越大,越接近于正方形,可以有效刻画城市形态的外轮廓特征;对照其数值特征与城市建成区实际形状对中国地级城市进行分类,将SL指数在0~0.20范围的城市定义为长条形,0.20~0.32范围内的城市定义为星形,大于0.32的城市定义为方形城市,发现2015年中国地级城市外轮廓主要是不规则的星形,有141个,其次是长条形86个,最后是方形49个。
式中:S为建成区面积;L为建成区长轴。各城市的S和L数据均通过ArcGIS测量工具获得。SL数值越小,城市越不紧凑。
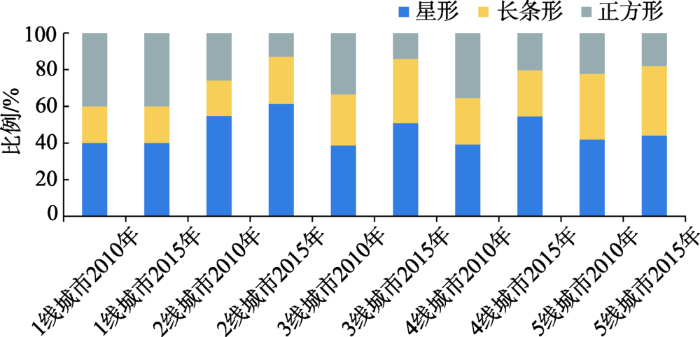
对全国地级城市分别按照东北、华北、华东、华中、华南、西南和西北7大区以及2017年最新出台的城市等级划分,得到各区域和各等级2010和2015年城市形态比例图,如图1所示。综合各地域比例看,除西南和华北地区,均为方形比例下降;除华南和西南地区,均为长条形比例上升。如图2所示,综合各等级比例来看,星形城市比例均上升,2线、3线城市的正方形比例下降较高。表1对各个地级城市2010—2015年的城市形态变化进行了归类,按城市数量多少依次为,星形→星形>长条→长条>方形→星形>方形→方形>星形→长条>长条→星形>星形→方形>方形→长条>长条→方形,整体来看,各区域城市建成区边界形态均在朝着非紧凑化发展。
图1 2010和2015年中国各区域地级城市形态分类
Fig.1 Regional classification of urban morphology of China, 2010 and 2015
图2 2010和2015年中国各等级地级城市形态分类
Fig.2 Hierarchical classification of urban morphology of China, 2010 and 2015
表1 2010—2015年中国各地级城市形态变化分类
Tab.1 Urban morphology change classification of prefecture-level cities of China, 2010-2015
| 形态变化 | 东北(33) | 华东(77) | 华南(34) | 华中(40) | 西北(27) | 西南(32) | 华北(30) |
|---|---|---|---|---|---|---|---|
| 方形→方形(30) | 鞍山、四平、绥化 | 丽水、枣庄、德州、福州、厦门、蚌埠、亳州 | 海口、梅州、汕头 | 娄底、信阳、漯河、商丘 | 克拉玛依、汉中、西安、吴忠、嘉峪关 | 资阳 | 天津、长治、巴彦淖尔、保定、邯郸、邢台、北京 |
| 方形→星形(42) | 阜新、辽阳、朝阳、沈阳、营口、长春、辽源 | 湖州、宁波、衢州、济宁、泰安、聊城、潍坊、菏泽、日照、赣州、泰州、扬州、淮安、龙岩、宿州、阜阳、安庆 | 北海、玉林、河源 | 周口、郑州、洛阳、安阳、开封、新乡、驻马店 | 渭南、固原、庆阳 | 玉溪、保山 | 乌兰察布、呼和浩特、沧州 |
| 方形→长条(10) | 抚顺 | 东营、盐城、宿迁、南通、马鞍山、池州 | — | — | 咸阳 | — | 忻州、石家庄 |
| 长条→长条(52) | 丹东、通化、佳木斯、七台河、鹤岗 | 舟山、温州、杭州、临沂、镇江、三明、南平、芜湖、淮南 | 防城港、广州、中山、汕尾、肇庆、江门、阳江、揭阳 | 张家界、黄石、宜昌、荆门、平顶山、鹤壁、焦作 | 西宁、铜川、宝鸡、延安、天水、平凉、兰州、金昌 | 重庆、昭通、宜宾、广元、攀枝花、雅安、南充、遂宁、拉萨、六盘水、贵阳 | 大同、阳泉、承德、张家口 |
| 长条→星形(23) | 本溪、白山 | 威海、南昌、景德镇、宜春、九江、吉安、上饶、常州 | 三亚、梧州、南宁、惠州、韶关、清远 | 永州、襄阳 | 乌鲁木齐、银川 | 巴中、铜仁 | 运城 |
| 长条→方形(2) | — | — | 东莞 | — | — | 眉山 | — |
| 星形→星形(74) | 锦州、铁岭、葫芦岛、松原、牡丹江、哈尔滨、黑河 | 绍兴、台州、金华、上海、淄博、青岛、莱芜、滨州、抚州、新余、萍乡、连云港、南京、苏州、无锡、宁德、合肥、铜陵、黄山、滁州、六安 | 河池、桂林、柳州、湛江、深圳、珠海、潮州、佛山、茂名 | 湘潭、邵阳、怀化、株洲、益阳、郴州、黄冈、孝感、咸宁、鄂州、武汉、十堰、许昌、南阳 | 榆林、安康、张掖、酒泉、白银 | 昆明、丽江、达州、乐山、绵阳、自贡、内江、成都、广安、德阳、安顺 | 太原、赤峰、通辽、鄂尔多斯、乌海、秦皇岛、鄂尔多斯 |
| 星形→长条(24) | 大连、白城、伊春、鸡西、大庆 | 嘉兴、烟台、济南、泉州、漳州、莆田、淮北 | 贵港、百色、云浮 | 岳阳、常德、长沙、三门峡 | 商洛、定西 | 曲靖、遵义 | 包头 |
| 星形→方形(16) | 盘锦、吉林、齐齐哈尔 | 鹰潭、徐州 | 钦州 | 衡阳、濮阳 | 武威 | 临沧、泸州 | 朔州、晋中、临汾、衡水、廊坊 |
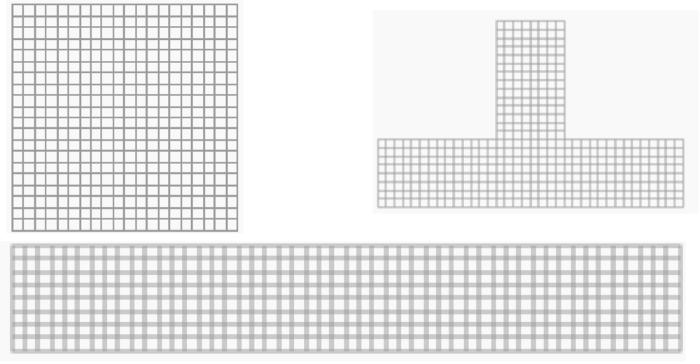
据此确定3种代表现阶段中国地级城市的城市形态,即正方形、长条形和星形,作为本文研究的形态情景。如图3所示,为了增加方案间可比性,三种形态情景中排污DU总数均为20×20=400,道路DU总数=800,总面积=35 km²,总人口=36.24万人,单位DU人口数=906人,单位DU排污流量=4.09 L/s。
1.2.2 排水情景
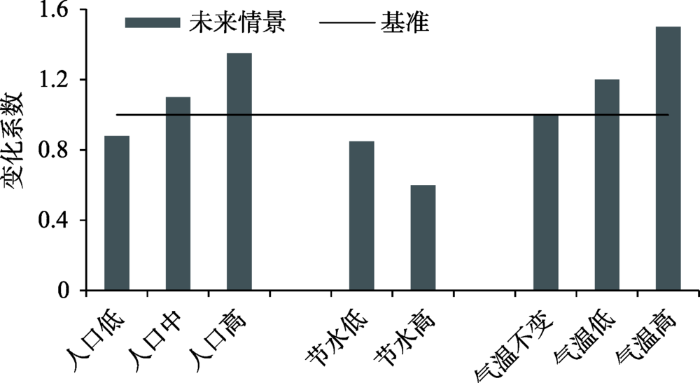
污水设施系统具有建成后长期使用的特点,因此在建造之初考虑系统对于未来排水情景改变的适应性尤其重要,因此本文设置了排水情景,参考白桦(2016)的研究成果,如图4,城市排水情景应该考虑人口变化、气温变化以及节水行为的因素,根据情景作用的强度又分为人口高、中、低增长情景;节水高、低情景;气温不变、低增长、高增长情景。因此在各形态原始排水情景排污量的基础上乘以图中变化系数即可得到本研究中的排水情景水量范围。
图4 各情景要素中城市排水系数变化
Fig.4 Variation of urban drainage coefficient in each drainage scenario
综合以上3类变化因素,分别取最大和最小的变化系数,即人口低增长情景、高节水情景和气温不变情景的乘积,即0.508作为最小变化系数;人口高增长情景、低节水情景和气温增加高增长情景的乘积,即2.025作为最大变化系数,在根据原有定额污水量水力计算得到的污水系统的基础上输入变化的污水量来探究系统的适应性。
1.2.3 污水输入
污水输入数据为DU污水排放量,参考白桦(2016)的研究成果,DU污水排放量按照DU人口定额计算,其核算需要人均生活用水量、人口数量、污水排放系数和总变化系数4个输入,即第i个DU的生活污水排放量可根据式(2)进行计算:
式中:WUper为人均生活用水排放量;Popi为DU人口数量;Kz为总变化系数,根据污水平均流量Q通过式(3)计算取值;Kd为污水排放系数(取值0.8);WWresi为生活污水排放量(L/s),全年排放,无季节性差异。查文献知污水管道一般设计流量为Q=100 L/s,人均生活污水量:300 L/(d·人)。
根据构建的虚拟城市污水系统,引用白桦(2016)的污水系统构建模型,使用图论以及Kruscal算法,通过遍历所有排污单元以管网总长最小为目标生成最小生成树以构成污水系统定线方案。然后进行水力计算,泵站设置为每种情景生成大量不同拓扑结构的污水系统方案集,测算出每个方案集的生命周期成本和拓扑结构,最后放入到SWMM模型中,为每个排污DU输入排水过程线,去模拟一天24 h内的管网运行性能,利用输出的生命周期成本、运行性能等指标来综合评估方案的经济性、有效性以及适应性。
为了表征污水系统的结构、生命周期成本和性能等方面特性,本文指标体系分为4部分,分别为系统结构、系统经济性、系统有效性和系统适应性。
1.4.1 系统结构
污水系统拓扑结构是在图论理论下,对于图形中点和边以及互相关系进行描述,使用边介数(Chopra et al, 2014)和全局效率进行表征:边介数指系统中任意两点通过指定边的最短路径总和,表示边在全局中的重要程度,数值越小,说明重要边数目越少,说明系统越分散;全局效率,在图论理论下代表系统的连通性,即全局效率越高,系统连通性越高,系统效率越高。
1.4.2 系统经济性
污水系统的成本包括管网、泵站和污水处理厂,其生命周期成本又包括建设成本和运行维护成本,按30 a计算。单位10³万元。计算公式如下:
式中:LIC为系统全生命周期成本;LICpipe为管网的全生命周期成本;npipe指所有管段;LICpump为泵站的全生命周期成本;LICwwtp为污水处理厂的全生命周期成本;CCpipe为管网的建造成本;OMCpipe为管网的运行维护成本;CCpump为泵站的建造成本;OMCpump为泵站的运行维护成本;
管网的建设成本计算公式(董颖等, 2008)为:
泵站的建设成本计算公式(董颖等, 2008)为:
污水处理厂的建设成本计算公式(刘杰等, 2010)为:
管网运行维护成本计算公式(董颖等, 2008)为:
泵站运行维护成本计算公式(董颖等, 2008)为:
污水处理厂的运行维护成本计算公式(刘杰等, 2010)为:
式(8)-(13)中:H为埋深;D为管径;L为管段长度,pump_H为提升高度;pump_Q为设计流量,WWTP_Q为污水处理厂设计流量。
1.4.3 系统有效性
污水系统的输水性能采用管道充满度失效比例和流速失效比例来表征,管段在24 h内充满度只要大于0.75或24 h内流速持续小于0.6 m/s的管段即为失效管段,分别计算每种方案中充满度失效比例和流速失效比例作为衡量系统有效性的指标,具体的计算公式如下:
式中:V_failure指系统流速失效比;max(Link_Velocity)管段24 h内最大流速;C_failure指系统充满度失效比;max(Link_Capacity)管段24 h内最大充满度;all_Link指所有管段。
1.4.4 系统适应性
污水系统的适应性是指污水系统在未来排水情景改变情况下的适应程度,本文使用排水情景改变前后管道充满度失效比和流速失效比的比值来衡量,比值大于1说明系统在排水情景改变后失效比变大,小于1则说明系统在排水情景改变后失效情况好转,即此数值越大,系统适应性越差。具体的计算公式如下:
式中:flexibility_L_V指系统低排水方案下流速失效适应性;low_V_failure指系统低排水方案下流速失效比;V_failure指系统原始排水方案下流速失效比;flexibility_H_V指系统高排水方案下流速失效适应性;high_V_failure指系统高排水方案下流速失效比;flexibility_L_C指系统低排水方案下充满度失效适应性;low_C_failure指系统低排水方案下充满度失效比;C_failure指系统原始排水方案下充满度失效比;flexibility_H_C指系统高排水方案下充满度失效适应性;high_C_failure指系统高排水方案下充满度失效比。
本文利用Kruscal算法为每种形态情景构建不同的污水系统定线方案,每种情景下采样1000次,形成1000套污水系统方案集,每种情景下所有指标均在1000次之内达到滑动平均值差异小于0.0001的收敛状态,说明了本文所构建的模型可靠。为了评估不同城市外轮廓下城市污水系统的差异性,首先对于3种形态情景下的系统生命周期成本、结构、有效性指标和适应性指标在SPSS软件中做了独立样本Kruscal-Wallis 检验,结果均在<0.001水平上拒绝原假设(指标在形态类别上相同),即不同城市形态的污水系统的结构、经济性、有效性和适应性是显著不同的,也说明城市形态会影响城市污水系统的特征。
2.1.1 不同情景下系统性能
本文对不同形态情景和排水情景下城市污水系统的24 h运行性能进行了模拟,结果如图5所示。在原始排水情景中,方形城市污水系统的流速失效比均值为0.55,充满度失效比均值为0.35;长条形城市污水系统的流速失效比均值为0.67,充满度失效比均值为0.42;星形城市的流速失效比均值为0.55,充满度失效比均值为0.36。在0.508变化系数作用下的低排水情景中,方形城市污水系统的流速失效比均值为0.70,充满度失效比均值为0.25;长条形城市污水系统的流速失效比均值为0.68,充满度失效比均值为0.27;星形城市的流速失效比均值为0.70,充满度失效比均值为0.27。在2.025变化系数作用下的高排水情景中,方形城市污水系统的流速失效比均值为0.47,充满度失效比均值为0.54;长条形城市污水系统的流速失效比均值为0.47,充满度失效比均值为0.53;星形城市的流速失效比均值为0.47,充满度失效比均值为0.54。
图5 各形态城市在不同排水情景下污水系统性能表现
Fig.5 Performance of sewage systems under different drainage scenarios
可以看出,当污水量变小时,流速失效情况变得更严重,而充满度失效情况均有所改善;当污水量变大时,流速失效情况有所改善,而充满度失效情况更加严重。因为污水量变小时,管道内污水流速动力减弱,进而流速变慢,24 h持续小于0.6 m/s的管道数量会增加,而由于水量减少,管道内污水的充满度自然会减小,充满度大于0.75的管道数量会减少,但如果管道内污水流速缓慢到一定程度,也会造成污水因为流不出去而带来管道充满度增大的状况,而本文研究并未出现此状况,原因可能是水量的减少还达不到让管道内污水淤塞的程度;当污水量变大时,管内污水流速动力加强,进而流速变快,流速失效状况改善,而由于管内水量增大,本文研究也出现了充满度失效更为严重的情况。
2.1.2 系统结构与性能间关系
为了探明污水系统的结构和性能间的关系,表征污水系统结构的指标选择尤其重要,而系统结构是系统形态变量的外在反映,其表征指标的合理性与准确性是后续研究的基础,为了检验这种合理性,本文对所选择的2个结构性指标边介数和全局效率作相关性分析,如图6所示,系统边介数和全局效率呈现显著负相关,在R²=0.867水平下可拟合出线性关系,即系统的边介数越小,系统越分散,系统连通性越好,效率越高,符合常理,因此本文所选择的代表系统结构的指标合理,可以准确刻画污水系统的结构。
图6 污水系统结构指标间关系
Fig.6 Relationship between structural indicators of sewage systems
在此基础上,本文对结构性指标与系统经济性、有效性和适应性指标作相关性分析,结果如表2所示,系统边介数与生命周期成本、流速失效比、充满度失效比均呈显著正相关,与高、低水量排水情景改变前后系统流速和充满度失效比值均呈负相关,全局效率与其他指标相关性和边介数正好相反,符合边介数与全局效率之间负相关性的特点。据此推论,污水系统越分散,生命周期成本越低,流速失效比和充满度失效比越低,即分散的污水系统经济性和有效性更好。而污水系统越分散,高、低排水情景改变下系统充满度和流速的失效比相较于原始比值越高,即分散的污水系统的适应性反而更差。
表2 系统结构、生命周期成本与性能指标间相关性
Tab.2 Correlation between system structure, life cycle cost, and performance indicators
| Pearson 相关性 | 生命周期成本 | V_failure | C_failure | flexibility_L_V | flexibility_H_V | flexibility_L_C | flexibility_H_C |
|---|---|---|---|---|---|---|---|
| 边介数 | 0.392** | 0.509** | 0.211** | -0.591** | -0.591** | -0.144** | -0.288** |
| 全局效率 | -0.406** | -0.439** | -0.179** | 0.516** | 0.521** | 0.129* | 0.250** |
2.2.1 系统结构和经济性评估
对不同形态情景中污水系统的生命周期成本、边介数和全局效率指标作条形图,如图7所示,在本文研究的城市规模下,污水系统的生命周期成本大致在6亿~7亿元区间内,其中长条形的城市污水系统生命周期成本最高,其次是星形城市,方形城市最低。长条形的系统边介数显著高于方形和星形城市,而方形和星形城市的污水系统边介数相差不大,即长条形城市的污水系统较为集中,方形和星形城市的污水系统更为分散。分析全局效率指标,方形和星形城市的全局效率相差不大,二者均高于长条形城市,即方形和星形城市较长条形城市流通效率更高。
图7 不同形态城市污水系统生命周期成本和结构指标结果条形图
Fig.7 Structure and life cycle cost of sewage systems under different urban morphology scenarios
分析城市污水系统的生命周期成本,包括管网、污水厂和泵站3个部分,在本文设置的统一高程的虚拟城市中,各情景中泵站差异很小,因此影响系统生命周期成本的决定性因素不是泵站,而污水厂的生命周期成本主要取决于进水量,本文中各情景下污水量保持一致,因此污水厂也不是影响系统生命周期成本的关键性因素,所以说本研究中城市污水系统生命周期成本的差异性主要来自于管网的影响,分析管网生命周期成本的计算公式,发现其主要受到管网长度和管径的影响。结合长条形城市污水系统更为集中而生命周期成本更高的特点,可以认为传输相同的污水量,集中的系统需要更粗的管径、更长的传输路径,而分散的系统可以通过将污水量分流来分散传输压力,从而节约管网资源。即拥有更紧凑型的城市外轮廓如方形和星形的城市,有着更为分散的设施系统,可以有效节约设施资源,因此从系统经济性方面评估,方形和星形的城市更有利。
2.2.2 有效性评估
为了对不同形态城市污水系统运行的性能有效性进行评估,本文对方形、长条形和星形城市的污水系统24 h流速失效比、充满度失效比结果作条形图,如图8所示,对流速失效比来说,长条形城市污水系统的失效情况显著高于方形和星形城市,而对于充满度失效比来说,3种外轮廓城市的结果差异较小,可以认为城市外轮廓对于城市污水系统的流速影响更大;但长条形城市污水系统的充满度的失效比仍然高于方形和星形城市,结合上述3种情景中污水系统的结构特点,系统更为集中的、连通性能更差的长条形的流速失效状况与充满度失效状况相较方形和星形城市均更为严重,因此从系统有效性方面进行评估,方形和星形城市更有利。
图8 不同形态城市污水系统有效性指标结果条形图
Fig.8 Effectiveness of sewage systems under different urban morphology scenarios
2.2.3 适应性评估
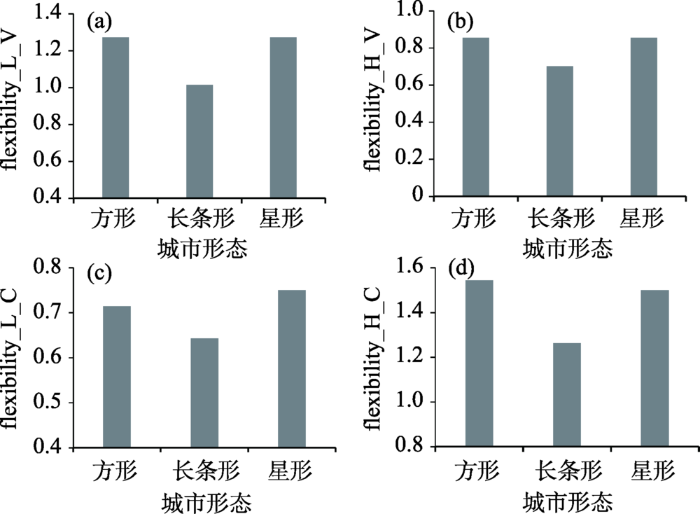
按照前述对污水系统适应性的定义,计算不同形态城市的污水系统排水情景改变前后流速和充满度失效比比值并作出条形图,如图9所示,低排水情景下,3种形态情景下污水系统的流速失效比相对原始比值均大于1,充满度失效比相对原始比值均小于1;而高排水情境下,3种形态情景下污水系统的流速失效比相对原始比值均小于1,充满度失效比相对原始比值均大于1,说明低排水情景下,污水系统的流速失效状况更严重,充满度失效状况有所改善,系统在充满度方面适应性更强;高排水情景下,污水系统的流速失效状况有所改善,而充满度失效状况更严重,系统在流速方面适应性更强。
图9 不同形态城市污水系统适应性指标结果条形图
Fig.9 Adaptability of sewage systems under different urban morphology scenarios
对比3种基准形态下的污水系统性能失效比在排水情景改变前后比值,发现长条形城市在高、低排水情景中flexibility_L_V和flexibility_H_V均显著小于方形和星形城市;在低排水情景中,3种形态情景中flexibility_L_C的数值差异较小,但长条形城市还是低于方形和星形城市,在高排水情景中,长条形城市的flexibility_H_C也低于方形和星形城市。因此从污水系统适应性方面评估,长条形城市优于方形和星形城市。
本文截取了2010年和2015年全国所有地级城市建成区的边界图,并据此计算了2个年份所有地级城市建成区边界形态,据此构建虚拟城市。基于城市形态和城市污水系统之间的关系,本文以虚拟城市地块为基本单元,构建自上而下的城市空间与污水系统耦合模型,设置形态情景与排水情景,通过大规模采样的方法探索了污水设施生命周期成本、结构和性能的一般性规律,并从污水系统的经济性、有效性以及适应性角度去评估城市污水系统,进而再以城市污水系统的综合评估结果反馈指导未来城市规划以及城市形态管理,从而辅助提升城市污水系统的未来排水情景应对能力并优化其利用现状,其主要研究结论与展望如下:
(1) 中国地级城市外轮廓可以划分为星形、长条形和方形3类,2015年分别有141、86和49个。2010—2015年,从地区看,除西南和华北地区外,方形城市比例均有所下降,除华南和西南地区外,长条形城市比例均有所上升;从城市等级看,所有等级城市星形比例都有所上升,而2线、3线城市的方形比例下降较大。对各地级城市2010—2015年的城市形态变化进行归类,按城市数量由多到少依次为:星形→星形、长条→长条、方形→星形、方形→方形、星形→长条、长条→星形、星形→方形、方形→长条和长条→方形。整体来看,各区域城市建成区边界形态均在朝着非紧凑化方向发展。
(2) 在人口36.24万、面积35 km²的城市规模下,污水系统的生命周期成本约为6亿~7亿元。方形、长条形和星形城市的流速失效比分别为0.55、0.67、0.55,充满度失效比分别为0.35、0.42、0.36。在排水情景改变下,污水量变小时,系统流速失效情况均变得更严重,而充满度失效情况均有所改善,当污水量变大时,流速失效情况均有所改善,而充满度失效情况更严重。
(3) 分析系统结构性能,发现系统边介数和全局效率呈现显著负相关,即越分散的污水系统连通性越好。对系统结构、生命周期成本、性能指标作相关性分析,边介数与生命周期成本、流速失效比、充满度失效比均呈显著正相关,与高、低排水量下系统流速和充满度失效比相较于原始比值呈负相关;全局效率与其他指标相关性和边介数正好相反,即污水系统越分散,越节约设施资源,系统有效性越好,但适应性越差。对不同城市形态进行综合评估,从系统经济性和有效性角度出发,认为方形和星形的城市更有利,但从污水系统适应性更长远的角度出发,长条形城市优于方形和星形城市。但考虑设施运行的实际情况,经济性和有效性应该是优于适应性考虑的。
(4) 结合2010—2015年各地级城市的形态变化趋势,从污水系统经济性和有效性角度判断,目前长条→长条、星形→长条、方形→长条的86个城市的城市发展方向不够合理。而中国快速城市化进程中各城市建成区可能在短时间内快速扩张,因此优化布局城市发展形态极其重要。从污水系统优化视角审视,建议有条件的城市在未来新建或扩建规划中应优先考虑方形和星形城市形态,对于具有相对稳定形态的城市可尽量使污水系统分散布局,让城市规划与内部设施形成有机统一,使更优的城市形态带动城市内部设施发挥最佳效能。
(5) 本文概化的3种城市形态能否准确刻画现阶段中国地级城市的特征、对各地级城市的形态归类是否合适还需进一步完善,关于各虚拟形态城市的污水系统运行效率的结论也需实证研究来支撑。另外来自数据获取、指标计算、形态概化过程中的系统误差也可能影响研究结论。希望下一步研究在克服以上不足的基础上做到以下几点:一是用更加系统化的方法分析和概化城市外轮廓形态特征;二是将城市形态与污水系统的耦合研究应用于具有典型形态特征的实际城市;三是将静态的城市形态差异扩展为动态的城市扩张,探究城市扩张方式对污水系统的影响;四是加强城市空间形态应对城市水系统变化的规划应用研究,借鉴“紧凑型城市”“海绵城市”等新兴城市规划理念,研究如何将理论成果应用于城市规划实践。
The authors have declared that no competing interests exist.
| [1] |
不确定条件下分流制城市排水系统优化设计方法研究 [D].Research on the optimization design method of separated urban drainage system under uncertainty . |
| [2] |
城市空间形态影响碳排放吗? 基于全国110个地级市数据的分析 [J].https://doi.org/10.3969/j.issn.1671-4407.2016.10.006 URL [本文引用: 1] 摘要
全球气候变化对城市节能减排和低碳发展提出新的要求和挑战,其中重塑城市空间形态及其内部联系成为降低碳排放的重要空间策略。目前城市形态与能源使用、碳排放之间关系的研究集中于交通及家庭能源消耗等维度,在城市综合尺度上的研究相对有限。因此,建立城市层面交通、土地利用等形态结构特征与碳排放之间的关系对理解城市碳排放的影响因素和制定低碳减排措施非常有意义。文章首先收集2009年全国110个地级以上非工业城市的能源消耗数据测算人均碳排放强度,进而引入城市空间格局、土地利用和城市交通结构变量综合表征城市形态,利用回归模型检验城市形态对碳排放的影响程度,最后提出"空间—土地—交通"综合系统的低碳发展框架,以降低城市碳排放水平。
Does urban spatial morphology affect carbon emission? A study based on 110 prefectural cities .https://doi.org/10.3969/j.issn.1671-4407.2016.10.006 URL [本文引用: 1] 摘要
全球气候变化对城市节能减排和低碳发展提出新的要求和挑战,其中重塑城市空间形态及其内部联系成为降低碳排放的重要空间策略。目前城市形态与能源使用、碳排放之间关系的研究集中于交通及家庭能源消耗等维度,在城市综合尺度上的研究相对有限。因此,建立城市层面交通、土地利用等形态结构特征与碳排放之间的关系对理解城市碳排放的影响因素和制定低碳减排措施非常有意义。文章首先收集2009年全国110个地级以上非工业城市的能源消耗数据测算人均碳排放强度,进而引入城市空间格局、土地利用和城市交通结构变量综合表征城市形态,利用回归模型检验城市形态对碳排放的影响程度,最后提出"空间—土地—交通"综合系统的低碳发展框架,以降低城市碳排放水平。
|
| [3] |
中国城市边缘区空间结构特征及其发展: 以南京等城市为例 [J].https://doi.org/10.11821/xb199004002 URL [本文引用: 1] 摘要
本文以南京和苏、锡、常等城市为例,探讨了我国城市边缘区发展当前存在的主要问题;分析了我国城市边缘区的发展过程和社会经济特征;揭示了影响边缘区发展变化的社会、经济、文化因素以及内在机制;并对南京等城市边缘区土地利用结构进行了分析,着重探讨了我国城市边缘区用地形态和空间结构的基本特征及其变化。
The spatial structure and development of Chinese urban fringe .https://doi.org/10.11821/xb199004002 URL [本文引用: 1] 摘要
本文以南京和苏、锡、常等城市为例,探讨了我国城市边缘区发展当前存在的主要问题;分析了我国城市边缘区的发展过程和社会经济特征;揭示了影响边缘区发展变化的社会、经济、文化因素以及内在机制;并对南京等城市边缘区土地利用结构进行了分析,着重探讨了我国城市边缘区用地形态和空间结构的基本特征及其变化。
|
| [4] |
城市空间形态应对气候变化研究进展及展望 [J].https://doi.org/10.18306/dlkxjz.2015.10.001 URL [本文引用: 1] 摘要
气候变化与城市化的叠加使城市成为温室气体减排和气候变化许多关 键风险集中的区域,如何应对气候变化已成为城市面临的重大挑战.以空间形态作为切入点,开展城市应对气候变化研究日益成为城市环境与气候变化领域的发展前 沿和热点问题.本文通过文献分析和归纳,综述了城市空间形态应对气候变化研究的主要影响及评估方法、城市空间形态与温室气体排放和气候变化主要风险之间的 关系、空间形态应对策略以及规划应用研究.在此基础上,展望了未来的研究重点和方向.
Progress and prospect of study on urban spatial patterns to cope with climate change .https://doi.org/10.18306/dlkxjz.2015.10.001 URL [本文引用: 1] 摘要
气候变化与城市化的叠加使城市成为温室气体减排和气候变化许多关 键风险集中的区域,如何应对气候变化已成为城市面临的重大挑战.以空间形态作为切入点,开展城市应对气候变化研究日益成为城市环境与气候变化领域的发展前 沿和热点问题.本文通过文献分析和归纳,综述了城市空间形态应对气候变化研究的主要影响及评估方法、城市空间形态与温室气体排放和气候变化主要风险之间的 关系、空间形态应对策略以及规划应用研究.在此基础上,展望了未来的研究重点和方向.
|
| [5] |
排水管道费用函数研究 [J].https://doi.org/10.3969/j.issn.1009-7767.2008.05.014 URL [本文引用: 4] 摘要
排水管道费用函数的选用将直接影响到排水管网系统设计计算的经济性与可靠性,以《给水排水工程概预算与经济评价手册》中的数据为依据,以SPSS为工具软件,对排水管道单价模型进行了回归分析。
Research of expenses function for drainage pipeline system .https://doi.org/10.3969/j.issn.1009-7767.2008.05.014 URL [本文引用: 4] 摘要
排水管道费用函数的选用将直接影响到排水管网系统设计计算的经济性与可靠性,以《给水排水工程概预算与经济评价手册》中的数据为依据,以SPSS为工具软件,对排水管道单价模型进行了回归分析。
|
| [6] |
城市形态对空气质量影响研究的国内外进展 [J].
我国近年来快速城市化过程中出现的空气质量恶化现象引起全社会广泛关注,探索城市扩张与空气环境协调发展的关系成为热点话题。通过梳理国内外空气质量与城市形态的相关文献,总结了城市发展对空气质量的影响机制,同时对与空气质量相关的探索性城市形态指标研究进行了梳理。现有文献表达了以下观点:(1)不同城市形态会产生不同的空气污染排放,工业、能源、居住污染排放可以通过规模类形态指标测度,交通污染排放可以通过密度类、形状类、功能结构类城市形态指标测度;(2)通过优化建筑形态、强度、布局,以及构建城市通风廊道有助于降低城市微气候带来的空气污染物堆积;(3)使城市形态更加紧凑,禁止低密度开发,能减轻热岛效应,减少交通排放带来的空气污染。最后对我国未来相关研究提出了展望。
Research progress of impacts of urban form on air quality .
我国近年来快速城市化过程中出现的空气质量恶化现象引起全社会广泛关注,探索城市扩张与空气环境协调发展的关系成为热点话题。通过梳理国内外空气质量与城市形态的相关文献,总结了城市发展对空气质量的影响机制,同时对与空气质量相关的探索性城市形态指标研究进行了梳理。现有文献表达了以下观点:(1)不同城市形态会产生不同的空气污染排放,工业、能源、居住污染排放可以通过规模类形态指标测度,交通污染排放可以通过密度类、形状类、功能结构类城市形态指标测度;(2)通过优化建筑形态、强度、布局,以及构建城市通风廊道有助于降低城市微气候带来的空气污染物堆积;(3)使城市形态更加紧凑,禁止低密度开发,能减轻热岛效应,减少交通排放带来的空气污染。最后对我国未来相关研究提出了展望。
|
| [7] |
基于GIS和DEA的特大城市空间紧凑度与城市效率分析 [J].https://doi.org/10.3969/j.issn.1560-8999.2009.04.011 URL Magsci [本文引用: 1] 摘要
利用GIS分析工具、数据包络分析方法及Malmquist模型方法,对我国特大城市空间紧凑度、城市效率及其变化,以及它们的相关关系进行深入研究发现:(1)特大城市空间形态呈现出紧凑变化趋势。(2)紧凑度提高的城市数明显多于紧凑度降低的城市数,极高紧凑度和极低紧凑度的特大城市数均呈一定的增加趋势。(3)特大城市效率水平一般,其中,只有少数城市效率达到了效率最优。(4)1990-2000年特大城市效率水平呈现一定的提高趋势,其中城市效率(纯技术和规模效率)呈现弱提高趋势,技术进步和全要素生产率则呈较明显的提高趋势。(5)特大城市的空间紧凑度与城市效率之间存在一定的互动关系:随着特大城市空间紧凑度的提高,城市要素资源的配置和利用水平得到了一定的改善,城市效率提高了;城市空间紧凑度变化率越高,城市效率提高的趋势也越明显,反之,则下降趋势也越明显;(6)城市空间紧凑度变化与城市技术变化不存在互动关系。
Study on the relationships between metropolitan spatial compact ratios and their efficiency in China in 1990 and 2000 .https://doi.org/10.3969/j.issn.1560-8999.2009.04.011 URL Magsci [本文引用: 1] 摘要
利用GIS分析工具、数据包络分析方法及Malmquist模型方法,对我国特大城市空间紧凑度、城市效率及其变化,以及它们的相关关系进行深入研究发现:(1)特大城市空间形态呈现出紧凑变化趋势。(2)紧凑度提高的城市数明显多于紧凑度降低的城市数,极高紧凑度和极低紧凑度的特大城市数均呈一定的增加趋势。(3)特大城市效率水平一般,其中,只有少数城市效率达到了效率最优。(4)1990-2000年特大城市效率水平呈现一定的提高趋势,其中城市效率(纯技术和规模效率)呈现弱提高趋势,技术进步和全要素生产率则呈较明显的提高趋势。(5)特大城市的空间紧凑度与城市效率之间存在一定的互动关系:随着特大城市空间紧凑度的提高,城市要素资源的配置和利用水平得到了一定的改善,城市效率提高了;城市空间紧凑度变化率越高,城市效率提高的趋势也越明显,反之,则下降趋势也越明显;(6)城市空间紧凑度变化与城市技术变化不存在互动关系。
|
| [8] |
基于系统动力学的城市住区形态变迁对城市代谢效率的影响 [J].https://doi.org/10.5846/stxb201104250542 URL Magsci [本文引用: 1] 摘要
改革开放以来我国的城市化率急速提高,城市住区形态变迁呈现出大规模、翻新频率快和多样化的特点。研究不同城市住区形态变迁前后的代谢效率变化,对我国的可持续人居环境构建有着重大的意义。运用功能分类法设计了城市代谢系统分类框架作为构建城市代谢系统动力学模型的基础,继而通过对住区与住区形态的文献调研与形态分析,将典型住区类型分为旧式住区、传统单位住区、普通商品房住区、新式商品房住区与半城市化住区。选择厦门市为研究区域,采用调查问卷进行了数据收集,并用能值分析法计算出不同住区类型的代谢效率,随后用Vensim软件构建了住区形态变迁对城市代谢效率影响的系统动力学模型。通过情景模拟后发现:住区形态的更迭过程基本上都会带来福利效率的提升,但在很多情况下会给城市整体物质代谢效率带来负面影响,交通效率与住房效率的下滑是最主要的原因。旧式住区向半城市化住区转变是仅有一个城市整体物质代谢效率提高的情景。半城市化住区和普通商品房住区向新式商品房住区转变的情景下,城市整体物质代谢效率的下降幅度与福利效率的增长幅度都较为适中。
Landscape aesthetic assessment based on experiential paradigm assessment technology .https://doi.org/10.5846/stxb201104250542 URL Magsci [本文引用: 1] 摘要
改革开放以来我国的城市化率急速提高,城市住区形态变迁呈现出大规模、翻新频率快和多样化的特点。研究不同城市住区形态变迁前后的代谢效率变化,对我国的可持续人居环境构建有着重大的意义。运用功能分类法设计了城市代谢系统分类框架作为构建城市代谢系统动力学模型的基础,继而通过对住区与住区形态的文献调研与形态分析,将典型住区类型分为旧式住区、传统单位住区、普通商品房住区、新式商品房住区与半城市化住区。选择厦门市为研究区域,采用调查问卷进行了数据收集,并用能值分析法计算出不同住区类型的代谢效率,随后用Vensim软件构建了住区形态变迁对城市代谢效率影响的系统动力学模型。通过情景模拟后发现:住区形态的更迭过程基本上都会带来福利效率的提升,但在很多情况下会给城市整体物质代谢效率带来负面影响,交通效率与住房效率的下滑是最主要的原因。旧式住区向半城市化住区转变是仅有一个城市整体物质代谢效率提高的情景。半城市化住区和普通商品房住区向新式商品房住区转变的情景下,城市整体物质代谢效率的下降幅度与福利效率的增长幅度都较为适中。
|
| [9] |
城镇污水处理厂用地、运行及建设费用研究 [J].
Lots of information on urban wastewater treatment plants(WWTP) in China were collected and summarized. The relationship between scale, area, operating and construction costs of WWTP was discussed and analyzed. References are provided for the further design and planning, crafts selection,construction costs analysis of WWTPs.The study shows that area and scale of WWTP can be expressed as a function which has a high correlation. Scale and crafts selected have a great impact on operating costs of WWTP. It respectively analyzes operating costs of different crafts of small, moderate and large WWTPs. The conclusions are that the crafts in large WWTPs have a small impact on operating costs, moderate WWTPs appropriately use oxidation ditch craft, small WWTPs use SBR craft. The relationship between construction costs and scale of WWTPs is close. Because of various factors on construction costs, a case in Jiangsu and Zhejiang region was used to specificly analyze the relationship between construction costs and scale of WWTPs.
Study on area, operating and construction costs of urban wastewater treatment plants .
Lots of information on urban wastewater treatment plants(WWTP) in China were collected and summarized. The relationship between scale, area, operating and construction costs of WWTP was discussed and analyzed. References are provided for the further design and planning, crafts selection,construction costs analysis of WWTPs.The study shows that area and scale of WWTP can be expressed as a function which has a high correlation. Scale and crafts selected have a great impact on operating costs of WWTP. It respectively analyzes operating costs of different crafts of small, moderate and large WWTPs. The conclusions are that the crafts in large WWTPs have a small impact on operating costs, moderate WWTPs appropriately use oxidation ditch craft, small WWTPs use SBR craft. The relationship between construction costs and scale of WWTPs is close. Because of various factors on construction costs, a case in Jiangsu and Zhejiang region was used to specificly analyze the relationship between construction costs and scale of WWTPs.
|
| [10] |
城市形态、交通能耗和环境影响集成的多智能体模型 [J].https://doi.org/10.11821/xb201108003 URL [本文引用: 1] 摘要
城市能耗占全球能耗的比重随着城市化率的不断提高而增大,交通能耗作为城市能耗的重要构成部分,已有较多研究证明城市形态对其具有显著影响,这些研究多属于城市间层次,而少有城市内的研究对城市形态与交通能耗、环境影响的关系进行定量识别。本文拟建立城市形态、交通能耗和环境的集成模型,对单一城市内的不同空间组织(即城市形态),如土地使用方式、开发密度、就业中心的数量和分布等,对潜在的通勤交通能耗和环境影响的关系进行定量识别。该模型采用多智能体(multi-agent)方法,一方面针对同一假想空间采用蒙特卡洛方法根据约束条件生成多个城市形态,并采用就业地斑块数目、平均斑块分形指数、香农多样性和平均近邻距离等14个指标表征城市形态。另一方面,固定数量的居民agent在所生成的每个城市形态内,选择居住区位和就业区位,根据通勤距离和社会经济特征选择交通方式,进而计算通勤交通能耗和环境影响,在城市层面统计通勤交通能耗和环境影响总和。最后分析城市形态与通勤交通能耗和环境影响的定量关系,主要得到以下结论,①对于不同的城市空间布局和密度分布,通勤交通能耗的弹性范围约为3倍;②城市形态评价指数中,就业中心斑块的数量是对通勤交通能耗影响最大的变量;③多种城市形态所对应的通勤交通能耗基本呈正态分布。此外,还对城市形状对通勤交通能耗的影响进行了识别,并针对假想空间的多个典型城市形态(如紧凑与分散、单中心与多中心、TOD政策、绿隔政策),进行了通勤交通总量的计算,进而对典型规划理念进行了定量对比。本模型不仅可以用于识别城市形态与通勤交通能耗和环境影响的定量关系,定量对比典型的规划理念,还可以用于空间规划方案的能耗和环境影响评价。
A multi-agent model for urban form, transportation energy consumption and environmental impact integrated simulation .https://doi.org/10.11821/xb201108003 URL [本文引用: 1] 摘要
城市能耗占全球能耗的比重随着城市化率的不断提高而增大,交通能耗作为城市能耗的重要构成部分,已有较多研究证明城市形态对其具有显著影响,这些研究多属于城市间层次,而少有城市内的研究对城市形态与交通能耗、环境影响的关系进行定量识别。本文拟建立城市形态、交通能耗和环境的集成模型,对单一城市内的不同空间组织(即城市形态),如土地使用方式、开发密度、就业中心的数量和分布等,对潜在的通勤交通能耗和环境影响的关系进行定量识别。该模型采用多智能体(multi-agent)方法,一方面针对同一假想空间采用蒙特卡洛方法根据约束条件生成多个城市形态,并采用就业地斑块数目、平均斑块分形指数、香农多样性和平均近邻距离等14个指标表征城市形态。另一方面,固定数量的居民agent在所生成的每个城市形态内,选择居住区位和就业区位,根据通勤距离和社会经济特征选择交通方式,进而计算通勤交通能耗和环境影响,在城市层面统计通勤交通能耗和环境影响总和。最后分析城市形态与通勤交通能耗和环境影响的定量关系,主要得到以下结论,①对于不同的城市空间布局和密度分布,通勤交通能耗的弹性范围约为3倍;②城市形态评价指数中,就业中心斑块的数量是对通勤交通能耗影响最大的变量;③多种城市形态所对应的通勤交通能耗基本呈正态分布。此外,还对城市形状对通勤交通能耗的影响进行了识别,并针对假想空间的多个典型城市形态(如紧凑与分散、单中心与多中心、TOD政策、绿隔政策),进行了通勤交通总量的计算,进而对典型规划理念进行了定量对比。本模型不仅可以用于识别城市形态与通勤交通能耗和环境影响的定量关系,定量对比典型的规划理念,还可以用于空间规划方案的能耗和环境影响评价。
|
| [11] |
1990年以来中国城市空间形态的变化特征及影响因素分析 [C]//China's urban space form variation characteristics and influence factors analysis since 1990 // |
| [12] |
1990—2010年中国主要城市空间形态变化特征 [J].https://doi.org/10.15957/j.cnki.jjdl.2015.01.007 URL [本文引用: 1] 摘要
构建了SVBI指数,以多时相、多波段的Landsat TM/ETM+遥感影像为数据源,提取1990—2010年中国62个主要城市的建成区,通过测算各城市的紧凑度、形状指数及分维数,分析城市空间扩展和形态演变趋势。结果发现,20年间我国主要城市的扩张速度与城市的级别成正比,呈现东部〉西部〉中部的特征;1990年和2010年两个年份城市空间形状趋于稳定,集中于正方形与矩形之间;城市的空间紧凑度总体提升,分维数呈下降趋势;城市扩张方向往往趋向于少数几个方向,"摊大饼"式的扩张不多见;39个城市用地规模扩展不合理;H形和星形形态对消除大气污染的效果最好。城市化推进、交通区位条件变化、城市新空间要素出现和政府调控力度加大是影响62个城市空间形态演变的主要因素。
Spatial-temporal characteristics in urban morphology of major cities in China during 1990-2010 .https://doi.org/10.15957/j.cnki.jjdl.2015.01.007 URL [本文引用: 1] 摘要
构建了SVBI指数,以多时相、多波段的Landsat TM/ETM+遥感影像为数据源,提取1990—2010年中国62个主要城市的建成区,通过测算各城市的紧凑度、形状指数及分维数,分析城市空间扩展和形态演变趋势。结果发现,20年间我国主要城市的扩张速度与城市的级别成正比,呈现东部〉西部〉中部的特征;1990年和2010年两个年份城市空间形状趋于稳定,集中于正方形与矩形之间;城市的空间紧凑度总体提升,分维数呈下降趋势;城市扩张方向往往趋向于少数几个方向,"摊大饼"式的扩张不多见;39个城市用地规模扩展不合理;H形和星形形态对消除大气污染的效果最好。城市化推进、交通区位条件变化、城市新空间要素出现和政府调控力度加大是影响62个城市空间形态演变的主要因素。
|
| [13] |
城市形态对家庭建筑碳排放的影响: 以北京为例 [J].
优化空间形态、减少碳排放已成为构建低碳城市的关键举措。国内外学者已经证实空间形态对交通碳排放的显著影响,但其对建筑碳排放影响方面的研究相对不足。本文通过对北京1188份家庭碳排放问卷进行统计分析,发现人均住房面积每增加1%,建筑碳排放增加0.48%;家庭每增加1人,建筑碳排放量增加27.54%;家庭人均收入对于建筑碳排放有阶段性影响,呈曲线关系;人口密度与家庭建筑碳排放存在负向关系。因此,北京可通过构建紧凑型城市、加强房地产市场住房面积调控以及提升中高收入人群低碳意识等政策,降低家庭建筑碳排放,构建低碳城市。
The impact of urban form on household building carbon emission: A case study of Beijing .
优化空间形态、减少碳排放已成为构建低碳城市的关键举措。国内外学者已经证实空间形态对交通碳排放的显著影响,但其对建筑碳排放影响方面的研究相对不足。本文通过对北京1188份家庭碳排放问卷进行统计分析,发现人均住房面积每增加1%,建筑碳排放增加0.48%;家庭每增加1人,建筑碳排放量增加27.54%;家庭人均收入对于建筑碳排放有阶段性影响,呈曲线关系;人口密度与家庭建筑碳排放存在负向关系。因此,北京可通过构建紧凑型城市、加强房地产市场住房面积调控以及提升中高收入人群低碳意识等政策,降低家庭建筑碳排放,构建低碳城市。
|
| [14] |
长三角地区城市形态对区域碳排放影响的时空分异研究 [J].https://doi.org/10.3969/j.issn.1002-2104.2015.11.006 URL [本文引用: 1] 摘要
以我国城市化快速发展和高强度人类扰动的长三角地区作为研究区域.以区域土地利用状况和碳排放量信息为关键数据源.利用景观格局指数定量分析长三角地区1990-2010年城市斑块大小、形状、规则性、破碎化程度、交通锅合度等城市形态特征对区域碳排放的影响。研究结果表明长三角地区碳排放存在明显的空间分异性.总体呈现中东南和西北部高、东北部次之、西南部最低的特征。1990-2010年区域碳排放量均呈快速增长趋势.其中1990-1995 ,1995-2000 ,2000-2005和2005-2010的平均增长率分别为40.55%,24. 47% ,70.71%和51.43%。研究时段内.道路密度(RD)、交通耦合度(CF)和最大斑块指数(LPI)对区域碳排放一直存在显著影响.表明长三角地区城市形态主要通过路网交通产生作用.进而影响碳排放。不同时间段.城市形态对碳排放的影响不尽一致.这可能与城市化的不同阶段经济发展水平存在差异有关。城市化初级阶段.区域碳排放量随着用地面积和道路密度的增加呈增加的趋势.而随着城市斑块数量、斑块聚合度和道路缓冲区的增加.碳排放量呈现减少的趋势。和1990,2000年相比.2010年增加了平均城市斑块最近邻距离(ENN MN )对碳排放的影响.并且呈负相关.说明增加城市斑块最近邻距离有利于减少碳排放。就当前来看.增加道路缓冲区面积和斑块临近距离.减少城市最大斑块面积是当前从城市形态角度减少碳排放的有效途径。研究结果可加深对城市形态与区域碳排放的客观认识.对于优化城市形态、控制区域碳排放具有实证案例和借鉴意义。
Spatial and temporal variation characteristics of urban forms' impact on regional carbon emissions in the Yangtze River Delta .https://doi.org/10.3969/j.issn.1002-2104.2015.11.006 URL [本文引用: 1] 摘要
以我国城市化快速发展和高强度人类扰动的长三角地区作为研究区域.以区域土地利用状况和碳排放量信息为关键数据源.利用景观格局指数定量分析长三角地区1990-2010年城市斑块大小、形状、规则性、破碎化程度、交通锅合度等城市形态特征对区域碳排放的影响。研究结果表明长三角地区碳排放存在明显的空间分异性.总体呈现中东南和西北部高、东北部次之、西南部最低的特征。1990-2010年区域碳排放量均呈快速增长趋势.其中1990-1995 ,1995-2000 ,2000-2005和2005-2010的平均增长率分别为40.55%,24. 47% ,70.71%和51.43%。研究时段内.道路密度(RD)、交通耦合度(CF)和最大斑块指数(LPI)对区域碳排放一直存在显著影响.表明长三角地区城市形态主要通过路网交通产生作用.进而影响碳排放。不同时间段.城市形态对碳排放的影响不尽一致.这可能与城市化的不同阶段经济发展水平存在差异有关。城市化初级阶段.区域碳排放量随着用地面积和道路密度的增加呈增加的趋势.而随着城市斑块数量、斑块聚合度和道路缓冲区的增加.碳排放量呈现减少的趋势。和1990,2000年相比.2010年增加了平均城市斑块最近邻距离(ENN MN )对碳排放的影响.并且呈负相关.说明增加城市斑块最近邻距离有利于减少碳排放。就当前来看.增加道路缓冲区面积和斑块临近距离.减少城市最大斑块面积是当前从城市形态角度减少碳排放的有效途径。研究结果可加深对城市形态与区域碳排放的客观认识.对于优化城市形态、控制区域碳排放具有实证案例和借鉴意义。
|
| [15] |
城市空间形态与碳排放关系研究进展与展望 [J].Progress and prospect on relationship research between urban form and carbon emission . |
| [16] |
城市形态对城市风环境品质影响的研究进展 [J].
随着中国逐步进入城市化的关键阶段,城市化过程中城市形态的无序化发育所引发的城市风环境问题日益突出,局地大风所带来的风环境安全隐患及城市核心区静风所带来的城市大气缓释能力下降表现尤为突出,同时由此也引发了舒适度下降,建筑能耗增加等城市问题。该文从城市风环境品质发育现状入手,概述了城市形态对城市风环境品质影响研究进展,主要包括了城市风环境的主要研究方法与评价指标体系,城市形态定量化研究与城市风环境品质影响机理的研究过程。最后提出目前城市形态对城市风环境品质影响研究的关键性问题及解决思路,这对实现城市风环境的可持续发展具有参考意义。
Research progress of the effects of urban form on urban wind environment quality .
随着中国逐步进入城市化的关键阶段,城市化过程中城市形态的无序化发育所引发的城市风环境问题日益突出,局地大风所带来的风环境安全隐患及城市核心区静风所带来的城市大气缓释能力下降表现尤为突出,同时由此也引发了舒适度下降,建筑能耗增加等城市问题。该文从城市风环境品质发育现状入手,概述了城市形态对城市风环境品质影响研究进展,主要包括了城市风环境的主要研究方法与评价指标体系,城市形态定量化研究与城市风环境品质影响机理的研究过程。最后提出目前城市形态对城市风环境品质影响研究的关键性问题及解决思路,这对实现城市风环境的可持续发展具有参考意义。
|
| [17] |
Assessing the combined effects of urbanisation and climate change on the river water quality in an integrated urban wastewater system in the UK [J].https://doi.org/10.1016/j.jenvman.2012.06.039 URL PMID: 22854785 [本文引用: 1] 摘要
Climate change and urbanisation are key factors affecting the future of water quality and quantity in urbanised catchments and are associated with significant uncertainty. The work reported in this paper is an evaluation of the combined and relative impacts of climate change and urbanisation on the receiving water quality in the context of an Integrated Urban Wastewater System (IUWS) in the UK. The impacts of intervening system operational control parameters are also investigated. Impact is determined by a detailed modelling study using both local and global sensitivity analysis methods together with correlation analysis. The results obtained from the case-study analysed clearly demonstrate that climate change combined with increasing urbanisation is likely to lead to worsening river water quality in terms of both frequency and magnitude of breaching threshold dissolved oxygen and ammonium concentrations. The results obtained also reveal the key climate change and urbanisation parameters that have the largest negative impact as well as the most responsive IUWS operational control parameters including major dependencies between all these parameters. This information can be further utilised to adapt future IUWS operation and/or design which, in turn, should make these systems more resilient to future climate and urbanisation changes.
|
| [18] |
Comparison of the occurrence of antibiotics in four full-scale wastewater treatment plants with varying designs and operations [J].https://doi.org/10.1016/j.chemosphere.2007.01.008 URL PMID: 17316751 [本文引用: 1] 摘要
The occurrence of ciprofloxacin, sulfamethoxazole, tetracycline, and trimethoprim antibiotics in four full-scale wastewater treatment plants (WWTPs) that differ in design and operating conditions was determined. The WWTPs chosen utilized a variety of secondary removal processes, such as a two stage activated sludge process with a nitrification tank, extended aeration, rotating biological contactors, and pure oxygen activated sludge. Several of the WWTPs also employed an advanced treatment process, such as chlorination and UV radiation disinfection. The detected concentrations ( g/l) ranged from 0.20 to 1.4 for ciprofloxacin, 0.21 to 2.8 for sulfamethoxazole, 0.061 to 1.1 for tetracycline, and 0.21 to 7.9 for trimethoprim. The overall percent difference in the concentrations of the antibiotics in the effluent and influent of these antibiotics differed between plants and ranged from 33% to 97%. Based on these four full-scale WWTPs evaluated, the apparent removal of organic micropollutants in wastewater is dependent on a combination of biological and physico-chemical treatment processes and operating conditions of the treatment system.
|
| [19] |
Using smart meters to identify social and technological impacts on residential water consumption [J].https://doi.org/10.2166/ws.2011.088 URL [本文引用: 1] |
| [20] |
How urban structure can affect city sustainability from an air quality perspective [J].https://doi.org/10.1016/j.envsoft.2004.07.009 URL [本文引用: 1] 摘要
Despite the progress made in controlling local air pollution, urban areas show increasing signs of environmental stress and air quality is one of the major concerns. The findings of several studies provide evidence that the shape of a city and the land use distribution determine the location of emission sources and the pattern of urban traffic, affecting urban air quality. This work focuses on the potential impacts of different land use patterns on urban air quality. Three imaginary cities were created, based on alternative urban planning strategies, considering different land use patterns: from the scenario of urban sprawl to the opposite scenario of a compact city with mixed land use. The mesoscale photochemical system MEMO/MARS was applied to evaluate the urban air quality in each of the idealized city structures. Simulation results indicate that more compact cities with mixed land use provide better urban air quality compared to disperse and network cities.
|
| [21] |
Understanding resilience in industrial symbiosis networks: Insights from network analysis [J].https://doi.org/10.1016/j.jenvman.2013.12.038 URL PMID: 24768838 [本文引用: 1] 摘要
61Network analysis reveals industries with the highest vulnerabilities.61Vulnerable industries are identified using hypothetical disruptive scenarios.61Time series data provides insights for the network structure evolution.61Industries with more synergetic exchanges incur greater profitability from IS.61Resilience building strategies for IS networks are proposed.
|
| [22] |
Valuing flexibilities in the design of urban water management systems [J].https://doi.org/10.1016/j.watres.2013.09.064 URL PMID: 24268059 [本文引用: 1] 摘要
61We explicitly consider uncertainty and flexibility in design and evaluation of urban water management systems.61Incorporating flexibility and uncertainty can provide a more accurate picture of system performance and improve economic life cycle performance compared to standard approaches.61Performance improvement resulting from considerations of flexibility is not guaranteed, and therefore motivates case-by-case quantitative analysis.61The methodology can be applied to a wide range of urban water management systems.
|
| [23] |
The impact of urban form on U.S. residential energy use [J].https://doi.org/10.1080/10511482.2008.9521624 URL [本文引用: 1] |
| [24] |
Implications of urban form on water distribution systems performance [J].https://doi.org/10.1007/s11269-013-0472-3 URL [本文引用: 1] 摘要
This paper presents the results of an investigation into the relationship between urban form and the performance of a water distribution system. The effect of new development or redevelopment on the...
|
| [25] |
Impact of urban form on energy use in water distribution systems [J].https://doi.org/10.1061/(ASCE)1076-0342(2008)14:4(337) URL [本文引用: 1] |
| [26] |
A probabilistic framework for assessing vulnerability to climate variability and change: The case of the US water supply system [J].https://doi.org/10.1007/s10584-014-1111-6 URL [本文引用: 1] 摘要
We introduce a probabilistic framework for vulnerability analysis and use it to quantify current and future vulnerability of the US water supply system. We also determine the contributions of hydro-climatic and socio-economic drivers to the changes in projected vulnerability. For all scenarios and global climate models examined, the US Southwest including California and the southern Great Plains was consistently found to be the most vulnerable. For most of the US, the largest contributions to changes in vulnerability come from changes in supply. However, for some areas of the West changes in vulnerability are caused mainly by changes in demand. These changes in supply and demand result mainly from changes in evapotranspiration rather than from changes in precipitation. Importantly, changes in vulnerability from projected changes in the standard deviations of precipitation and evapotranspiration are of about the same magnitude or larger than those from changes in the corresponding means over most of the US, except in large areas of the Great Plains, in central California and southern and central Texas.
|
| [27] |
Another look at travel patterns and urban form: The US and Great Britain [J].https://doi.org/10.1080/0042098032000123303 URL [本文引用: 1] |
| [28] |
How do built-environment factors affect travel behavior? A spatial analysis at different geographic scales [J].https://doi.org/10.1007/s11116-013-9462-9 URL [本文引用: 1] 摘要
Much of the literature shows that a compact city with well-mixed land use tends to produce lower vehicle miles traveled (VMT), and consequently lower energy consumption and less emissions. However, a significant portion of the literature indicates that the built environment only generates some minor f any nfluence on travel behavior. Through the literature review, we identify four major methodological problems that may have resulted in these conflicting conclusions: self-selection, spatial autocorrelation, inter-trip dependency, and geographic scale. Various approaches have been developed to resolve each of these issues separately, but few efforts have been made to reexamine the built environment-travel behavior relationship by considering these methodological issues simultaneously. The objective of this paper is twofold: (1) to better understand the existing methodological gaps, and (2) to reexamine the effects of built-environment factors on transportation by employing a framework that incorporates recently developed methodological approaches. Using the Seattle metropolitan region as our study area, the 2006 Household Activity Survey and the 2005 parcel and building data are used in our analysis. The research employs Bayesian hierarchical models with built-environment factors measured at different geographic scales. Spatial random effects based on a conditional autoregressive specification are incorporated in the hierarchical model framework to account for spatial contiguity among Traffic Analysis Zones. Our findings indicate that land use factors have highly significant effects on VMT even after controlling for travel attitude and spatial autocorrelation. In addition, our analyses suggest that some of these effects may translate into different empirical results depending on geographic scales and tour types.
|
| [29] |
Evaluating the dynamic impacts of urban form on transportation and environmental outcomes in US cities [J].https://doi.org/10.1007/s13762-014-0630-z URL [本文引用: 1] 摘要
Previous urban sprawl studies have typically taken a cross-sectional approach without examining how sprawling urban areas are performing over time. Longitudinal studies of individual or household travel behavior and built-environment preference have made some progress in this direction, but very few studies have explored the longitudinal interaction of urban form with transportation and environmental outcomes. This study begins to fill this gap by evaluating the transportation and environmental impact dynamics of several key dimensions of urban sprawl: density, land use mix, centrality, and street connectivity. The central hypothesis is that while the built environment is durable and development patterns change slowly, the impacts of urban sprawl are dynamic rather than static and are accelerated in more sprawling cities relative to less sprawling cities. To test this hypothesis, a panel dataset of 7 years (2000 2007) was developed for 60 Metropolitan Statistical Areas of the US and a hybrid modeling framework that incorporates fixed and random effects is applied to evaluate different transportation and environmental outcomes over time. We found that the influence of urban centrality or the strength of urban sub-centers on the travel pattern of commuters and transit users is dynamic. This suggests that people living in cities with stronger centers drive less and use public transportation more over time. For environmental outcomes, we found that cities with higher density have experienced a significant decrease in ambient ozone and PM 2.5 concentrations after controlling city-specific variables.
|
| [30] |
Compact city concept: Its relevance and applicability for planning of Indian cities [C]// |
| [31] |
Novel bottom-up urban water demand forecasting model: Revealing the determinants, drivers and predictors of residential indoor end-use consumption [J].https://doi.org/10.1016/j.resconrec.2014.11.009 URL [本文引用: 1] 摘要
The purpose of this comprehensive study was to explore the principal determinants of six residential indoor water end-use consumption categories at the household scale (i.e. namely clothes washer, shower, toilet, tap, dishwasher, and bath), and to find an overarching research design and approach for building a residential indoor water end-use demand forecasting model. A mixed method research design was followed to collect both quantitative and qualitative data from 210 households with a total of 557 occupants located in SEQ, Australia, utilising high resolution smart water metering technology, questionnaire surveys, diaries, and household water stock inventory audits. The principal determinants, main drivers, and predictors of residential indoor water consumption for each end-use category were revealed, and forecasting models were developed this study. This was achieved utilising an array of statistical techniques for each of the six end-use consumption categories. Cluster analysis and dummy coding were used to prepare the data for analysis and modelling. Subsequently, independent t-test and independent one-way ANOVA extended into a series of bootstrapped regression models were used to explore the principal determinants of consumption. Successively, a series of Pearson's Chi-Square tests was used to reveal the main drivers of higher water consumption and to determine alternative sets of consumption predictors. Lastly, independent factorial ANOVA extended into a series of bootstrapped multiple regression models was used for the development of alternative forecasting models. Key findings showed that the usage physical characteristics and the demographic and household makeup characteristics are the most significant determinants of all six end-use consumption categories. Further, the appliances/fixtures physical characteristics are significant determinants of all end-use consumption categories except the bath end-use category. Moreover, the socio-demographic characteristics are significant determinants of all end-use consumption categories except the tap and toilet end-use categories. Results also demonstrated that the main drivers of higher end-use water consumption were households with higher frequency and/or longer end-use events which are most likely to be those larger family households with teenagers and children, with higher income, predominantly working occupants, and/or higher educational level. Moreover, a total of 14 forecasting model alternatives for all six end-use consumption categories, as well as three total indoor bottom-up forecasting model alternatives were developed in this study. All of the developed forecasting model alternatives demonstrated strong statistical power, significance of fit, met the generalisation statistical criteria, and were cross-validated utilising an independent validation data set. The paper concludes with a discussion on the most significant determinants, drivers and predictors of water end-use consumption, and outlines the key implications of the research to enhanced urban water planning and policy design.
|
| [32] |
The effects of urban form on ambient air pollution and public health risk: A case study in Raleigh, North Carolina [J].https://doi.org/10.1111/risa.12317 URL PMID: 4461560 [本文引用: 1] 摘要
Abstract Since motor vehicles are a major air pollution source, urban designs that decrease private automobile use could improve air quality and decrease air pollution health risks. Yet, the relationships among urban form, air quality, and health are complex and not fully understood. To explore these relationships, we model the effects of three alternative development scenarios on annual average fine particulate matter (PM2.5 ) concentrations in ambient air and associated health risks from PM2.5 exposure in North Carolina's Raleigh-Durham-Chapel Hill area. We integrate transportation demand, land-use regression, and health risk assessment models to predict air quality and health impacts for three development scenarios: current conditions, compact development, and sprawling development. Compact development slightly decreases (-0.2%) point estimates of regional annual average PM2.5 concentrations, while sprawling development slightly increases (+1%) concentrations. However, point estimates of health impacts are in opposite directions: compact development increases (+39%) and sprawling development decreases (-33%) PM2.5-attributable mortality. Furthermore, compactness increases local variation in PM2.5 concentrations and increases the severity of local air pollution hotspots. Hence, this research suggests that while compact development may improve air quality from a regional perspective, it may also increase the concentration of PM2.5 in local hotspots and increase population exposure to PM2.5 . Health effects may be magnified if compact neighborhoods and PM2.5 hotspots are spatially co-located. We conclude that compactness alone is an insufficient means of reducing the public health impacts of transportation emissions in automobile-dependent regions. Rather, additional measures are needed to decrease automobile dependence and the health risks of transportation emissions. 2014 Society for Risk Analysis.
|
| [33] |
Integrated urban water management modelling under climate change scenarios [J].https://doi.org/10.1016/j.resconrec.2013.10.006 URL [本文引用: 1] 摘要
The concept of integrated water management is uncommon in urban areas, unless there is a shortage of supply and severe conflicts among the users competing for limited water resources. Further, problem of water management in urban areas will aggravate due to uncertain climatic events. Therefore, an Integrated Urban Water Management Model considering Climate Change (IUWMCC) has been presented which is suitable for optimum allocation of water from multiple sources to satisfy the demands of different users under different climate change scenarios. Effect of climate change has been incorporated in non-linear mathematical model of resource allocation in term of climate change factors. These factors have been developed using runoff responses corresponding to base and future scenario of climate. Future scenarios have been simulated using stochastic weather generator (LARS-WG) for different IPCC climate change scenarios i.e. A1B, A2 and B1. Further, application of model has been demonstrated for a realistic water supply system of Ajmer urban fringe (India). Developed model is capable in developing adaptation strategies for optimum water resources planning and utilization in urban areas under different climate change scenarios.
|
| [34] |
Urban compactness and the trade-off between air pollution emission and exposure: Lessons from a spatially explicit theoretical model [J].https://doi.org/10.1016/j.compenvurbsys.2014.01.004 URL [本文引用: 1] 摘要
Air pollution is a major concern in urban areas worldwide. The interplay between urban structure and air pollution from an environmental, health and social perspective is the focus of our work: we model how urban structure impacts traffic-induced pollutant emissions and the exposure of residents to those pollutants. We present a chain of models applied to theoretical monocentric space: a residential choice model with endogenous open-space and road network, a commuting traffic generation and road assignment model and a pollutant emissions, dispersion and exposure model. The theoretical study approach decouples results from location specific characteristics and enables us to analyse how the preference of households for green amenities, a transport tax, the provision of public transport alternatives and local neighbourhood design impact the environment (total emissions) as well as residents health (population exposure) and utility. We emphasise that environmental strategies in the form of urban compaction have a strong impact on the exposure of households to pollutants, especially close to the centre, in addition to their reduction of welfare. Our results suggest that more beneficial policy outcomes can be obtained from strategies which preserve green spaces close to the centre or which intend a greater shift from car to public transport. Further, we find indication that different local designs of neighbourhoods have much stronger impacts on the exposure mission tension than city-wide land use or transport options.
|
| [35] |
Neighborhood air quality, respiratory health, and vulnerable populations in compact and sprawled regions [J].https://doi.org/10.1080/01944363.2010.486623 URL [本文引用: 1] |
| [36] |
Impact of urban form on energy use in water distribution systems at the neighbourhood level [J].https://doi.org/10.1016/j.proeng.2015.08.932 URL [本文引用: 1] |

/
| 〈 |
|
〉 |


