陈颖彪 , 郑子豪, 吴志峰
CHEN Yingbiao, ZHENG Zihao, WU Zhifeng
通讯作者:
收稿日期: 2018-04-8
修回日期: 2018-09-20
网络出版日期: 2019-02-28
版权声明: 2019 地理科学进展 《地理科学进展》杂志 版权所有
基金资助:
作者简介:
第一作者简介:陈颖彪(1969— ),男,吉林长春人,博士,教授,主要研究方向为GIS与RS的应用技术。E-mail: gzhuchenyb@126.com
展开
摘要
在遥感应用研究中,夜间灯光遥感作为发展活跃的一个重要分支,近年来受到越来越多来自自然科学领域和社会经济领域的关注。与传统的光学遥感卫星获取地物辐射信息不同,夜间灯光遥感是获取夜间无云条件下地表发射的可见光-近红外电磁波信息。相比于普通的遥感卫星影像,夜间灯光遥感所使用的夜间灯光影像记录的地表灯光强度信息更直接反映人类活动差异,因而被广泛应用于城市化进程研究、不透水面提取、社会经济指标空间化估算、重大事件评估、生态环境评估等领域。目前,虽然基于夜间灯光数据的应用研究成果正在不断积累,但对成果的系统性总结、整理的研究目前存在着覆盖面不全、时效性不强等不足。基于此,论文通过对近几十年来有关夜间灯光数据的研究成果的详细梳理,从数据处理与技术方法、应用研究等方面进行归纳总结。最后,文章从多源数据融合、应用领域拓展和短周期地表灯光监测3个方面指出了未来的研究热点。
关键词:
Abstract
In remote sensing research, night light remote sensing as an important branch of active development has attracted increasingly more attention from the fields of natural and social science research in recent decades. Different from traditional daytime optical satellite remote sensing that obtains ground object radiation information, nighttime light remote sensing is the acquisition of visible-near-infrared electromagnetic information transmitted from the Earth's surface under cloud-free conditions at night. Compared to the ordinary satellite remote sensing images, ground light intensity information recorded by the night light images directly reflects the difference of human activity. Therefore, it is widely used in urbanization research, extraction of impervious surfaces, estimation of socioeconomic indicators, major events assessment, ecological environment assessment, and other fields. At present, although research results based on nighttime light data are continuously accumulating, there is a general lack of systematic review of these results and the current reviews suffer from incomplete coverage and poor timeliness. Therefore, this article summarizes the research results of nighttime light data in recent decades and examines them from the aspects of data processing and technical approaches, urbanization application research, and parameterization. Finally, we identify the following three research hotspots: multi-source data fusion, application expansion, and short-period surface light monitoring.
Keywords:
1834年第一台电动机的诞生正式拉开了电力革命的序幕。电力的广泛应用推动了社会经济的发展,也改变了人类“日出而作,日落而息”的生活习惯。电力革命推动着人类社会的电器化进程,加快了夜间照明设备的普及,使人类活动不再被夜晚黑暗所限制。人造光源在满足人类夜间生产、生活照明需求的同时,也改变了夜间地球表面亮度分布。为了详细掌握人类夜间活动所引起的地球表面亮度分布状况,20世纪70年代美国启动了国防气象卫星计划(Defense Meteorological Satellite Program, DMSP)。该计划的部分卫星搭载了线性扫描业务系统(Operational Linescan System, OLS),用于捕获夜间地表微弱的灯光辐射,并生产出一系列年度无云的夜间灯光影像(李德仁等, 2015)。正是得益于夜间灯光遥感影像在大尺度、长时间序列对地观测的能力,其开放性的数据成果能够有效支撑地表人类活动及城市化进程研究。可以说DMSP/OLS夜间灯光数据的产生并投入应用研究,揭开了夜间灯光遥感的新篇章。
近年来随着灯光遥感数据产品的不断丰富,特别是新一代夜间灯光数据NPP/VIIRS(National Polar-Orbiting Partnership's Visible Infrared Imaging Radiometer Suite)的出现有效地弥补了DMSP/OLS夜间灯光数据在空间分辨率、时间分辨率和辐射分辨率等方面的短板,极大地拓展了夜间灯光数据的研究方向和应用领域。国内外学者从灯光数据处理、不透水面提取、城市建成区提取、人口分布空间化、经济参数空间化等方面展开了广泛的研究,取得了一系列丰硕的成果。1965—2018年,在“Web of Science数据库”中以“Nighttime Light Data”为关键词的论文数量和被引频次均保持 了较快的增长,尤其是近10年间增速显著(图1)。随着研究成果的不断积累,针对夜间灯光数据研究领域的总结归纳文献的重要性不断凸显。现有关于夜间灯光数据研究的综述性论文存在着时效性不强、覆盖面不广等不足(杨眉等, 2011; 王鹤饶等, 2012; 赵敏等, 2015)。基于此,本文重新梳理了国内外夜间灯光的研究文献,从夜间灯光遥感数据处理、数据应用等方面进行归纳总结,对研究热点展开探索展望,以期为将来的夜间灯光研究提供参考。
图1 1965—2018年夜间灯光数据研究论文数及被引频次分布
Fig.1 The number of published articles on nighttime light data and citation frequency, 1965-2018
在利用DMSP/OLS夜间灯光数据进行应用研究中,应用最广泛的数据就是其中的稳定灯光数据(Stable Lights)。该数据包含来自城市、城镇和其他具有持续照明的场所的灯光(包括气体照明弹),而短暂的灯光事件,例如火灾、太阳眩光、极光等已经被排除,背景噪声以零值替代,像元的数据值(Digital Number, DN)为1~63 (https://ngdc.noaa.gov/eog/gcv4_readme.txt [2018-04-05])。而随着城市的快速发展,导致城市中心区的实际夜间灯光强度已经远远超过了DMSP/OLS上搭载的光电倍增管(Photo Multiplier Tube, PMT)所能记录的上限值,并进而引发了DMSP/OLS影像的饱和问题。目前,针对DMSP/OLS灯光数据的饱和问题,国内外学者们相继提出了一系列非辐射定标的方法,本文将按照去饱和方法提出的时间顺序对几种典型的去饱和方法进行梳理。
(1) 基于灯光像元DN值频率分布的去饱和方法
作为最早提出的用于缓解夜间灯光DMSP/OLS饱和问题的方法,基于灯光像元的DN值频率分布去饱和模型由Hara等(2010)提出。该方法通过假设饱和区的夜间灯光DN值与非饱和区的灯光DN值的变化规律、分布趋势具有一致性。通过统计任意区域内灯光DN值的分布,绘制“像元数量—DN值”二维曲线图,利用“Deltaic Model”实现对饱和像元的校正(图2a)。紧接着,Letu等(2010)在“Deltaic Model”的基础上,通过对非饱和区灯光DN值与像元数量分布的拟合,采用三次回归方程构建全域的灯光DN值的频率分布以校正灯光影像的饱和问题(图2b)。基于灯光影像DN值频率分布去饱和模型利用区域灯光的总体分布特征来替代饱和灯光分布是区域尺度上的去饱和方法。
图2 灯光DN值的频率分布的模型
Fig.2 Frequency distribution of the digital number (DN) value of the nighttime light (NTL) data
(2) 基于不变目标的去饱和方法
基于不变目标的去饱和方法假设(寻找)某一区域内的灯光强度在某一段时间内能够保持相对稳定,通过不变目标区的灯光DN值与辐射定标(Radiance Calibrated Nighttime Lights, RCNTL)影像DN值之间的对应关系实现对夜间灯光影像的饱和修正。Letu等(2012)假设研究区内1996—1999年间灯光强度并未发生显著变化,通过构建1999年未饱和区的灯光DN值与1996—1997年辐射定标影像DN值之间的函数关系来解算1999年饱和区实际灯光DN值。Wu等(2013)选取了全球分布的若干个不变目标区,利用2006年辐射定标灯光影像构建幂数方程实现对饱和灯光影像的校正。曹子阳等(2015)选定鹤岗市市辖区作为不变目标区,以2006年辐射定标灯光影像为参考建立幂数方程,校正了时间序列的DMSP/OLS灯光数据。
(3) 基于辅助参数的去饱和方法
① 植被指数
城市化进程的发展和人类活动的增强,使得原本的自然景观逐渐被不透水面所替代,水泥地面、高大建筑等成为了城市的代表性景观。针对城市不透水面和植被覆盖范围的相关研究就明确指出植被覆盖程度和不透水面有较强的负相关性,即不透水面覆盖度越高的地区其植被覆盖度越低(Small, 2001; Weng et al, 2004; Pozzi et al, 2005; Weng et al, 2006)。
最先尝试利用植被指数来消除DMSP/OLS夜间灯光饱和问题的是Lu等(2008)在利用多源遥感数据提取中国东南部的人类集聚区时,将DMSP/OLS夜间灯光数据和Terra MODIS 的归一化植被指数(Normalized Difference Vegetation Index, NDVI)数据整合,并在此基础上提出了人类居住指数HSI(Human Settlement Index):
式中:
该指数通过归一化处理夜间灯光数据并与归一化差异植被指数NDVI相匹配,利用NDVI在饱和区的分异差异来消除该地区的夜间灯光饱和问题。但由于该指数提出的前提是假设夜间灯光强度和NDVI遵循着显著的负相关,Zhang等(2013)指出在灯光饱和的地区,由于OLSnor将处于最大值1,而此时NDVI将接近0,这将导致HSI呈指数级增长,进而引发该地区的过度校正问题。因此,Zhang等(2013)在总结HSI的成果的基础上,基于建立一个简单、有效的光谱指数的出发点提出了基于NDVI修正的城市夜间灯光指数VANUI(Vegetation Adjusted NTL Urban Index):
式中:NTL(Nighttime Light)为DMSP/OLS的获取的夜间灯光影像;NDVI为研究区年均合成的归一化植被指数。VANUI采用年度平均NDVI来降低NTL的饱和度并增加NTL夜间亮度城市间的变异性,在城市开发较早、发展速度平稳的发达国家的城市可以有效凸显城市核心区的灯光强度差异。但是,近年来随着发展中国家,特别是东亚地区的中国和印度,快速的城市化进程导致VANUI在该地区应用过程中无法有效凸显饱和地区的夜间灯光强度差异。考虑到增强型植被指数(Enhanced Vegetation Index, EVI)相较于归一化植被指数NDVI在抑制土壤背景干扰及克服自身饱和方面的优势(Li et al, 2010),卓莉等(2015)利用EVI与夜间灯光的空间分异性特征,将EVI作为修正的参数,纳入修正饱和模型中,在不增加模型复杂度的前提下提出了基于EVI修正的灯光指数 EANTLI(EVI Adjusted NTL Index):
式中:NTL和NTLnorm分别是原始和归一化处理的DMSP/OLS夜间灯光影像;EVI则代表的是年均处理后的增强型植被指数。利用年均EVI以修正饱和的EANTLI相较HSI与VANUI能够降低土壤背景的干扰,克服NDVI本身易饱和的问题,在饱和问题突出的城市中心区能较好地增强灯光强度差异,消除原始NTL的饱和现象。
② 地表温度及植被指数
由于上述单一的植被指数作为修正参数仅仅考虑了植被这一自然因子的空间分布差异而忽略了人为因素对城市内部结构演化的影响,导致植被覆盖程度与灯光强度之间负相关的绝对稳定性将会对修正饱和效果产生影响(Ma, 2014)。陆地表面温度(Land Surface Temperature, LST)是地球表面能量平衡和温室效应的一个指标,它是区域和全球尺度地球物理过程中的一个关键因子,可以反映“土壤-植被-大气”系统的能量流动与物质交换,在气候、水文、生态和生物地球化学等许多领域的研究中非常必要(何月等, 2009)。搭载在美国对地观测系统(Earth Observation System, EOG)系列卫星上的中分辨率成像光谱仪(Moderate-resolution Imaging Spectroradiometer, MODIS)传感器有36个离散光谱波段,能够有效监测地球表面的辐射能量变化,进而反演出陆地表面温度数据产品。由于LST在反演城市热岛、城市结构、人类活动等方面的优势,Liu等(2017)将MOD11A2中8 d合成的1 km分辨率LST数据与MOD13A3中月度合成的1 km分辨率EVI数据相结合,共同引入NTL的去饱和模型中,并提出了LST联合EVI修正城市夜间灯光指数LERNCI(LST and EVI Regulated NTL City Index):
式中:
③ GDP格网数据
HSI、VANUI、EANTLI和LERNCI等指数均是通过引入自然因子作为辅助参数对城市中心区的饱和夜间灯光进行校正。国内生产总值GDP(Gross Domestic Product)指一个国家(或地区)所有常住单位在一定时期内生产的全部最终产品和服务价值的总和,作为国民经济核算的核心指标,能够有效衡量国家(或地区)的经济发展状况。由于GDP在反映城市发展活力方面的特性,景欣等(2017)构建了对应时间的GDP格网数据与未饱和区灯光DN值之间的线性函数关系,并利用该函数方程反算饱和区的灯光DN值以消除该区域的饱和现象。
④ 矢量数据
地理空间大数据的爆发式增长,使矢量数据作为辅助参数参与DMSP/OLS夜间灯光数据去饱和过程成为了可能。郑子豪等(2018)利用多源路网数据创建可变尺度的单元路网长度网格,使用地理探测器验证了单元路网长度在解释灯光强度分异的优越性,并通过划分饱和区和潜在饱和区构建了分段式的饱和修正模型。基于矢量数据的去饱和方法充分利用矢量数据在空间分辨率方面的独特优势,能够在城市中心区突破分辨率的限制(DMSP/OLS的分辨率一般重采样为1 km),获取更优分辨率的修正饱和灯光数据产品。
DMSP/OLS夜间灯光影像在广泛应用过程中另外一个值得关注的问题就是时间序列下的灯光强度连续性问题。由美国国家地球物理数据中心(National Geophysical Data Center, NGDC)在线发布的“Version 4 DMSP/OLS Nighttime Lights Time Series”提供了1992—2013年间的稳定灯光数据集。这些稳定灯光数据集分别由6个传感器所提供,包括:F10(1992—1994年)、F12(1994—1999年)、F14(1997—2003年)、F15(2000—2007年)、F16(2004—2009年)和F18(2010—2013年)。由于传感器在获取夜间地表灯光辐射过程中会受到多种因素的影响,导致在使用长时间序列的DMSP/OLS稳定灯光数据集时会出现不同传感器获取的不同时间段的灯光影像不连续(图3)和同一年份不同传感器获取的灯光影像存在差异的问题(曹子阳等, 2015)。
图3 1992—2008年间中国地区稳定灯光数据平均DN值
注: 来自Liu et al, 2012
Fig.3 Average digital number (DN) values of nighttime light (NTL) data for China, 1992-2008
20世纪90年代,有学者在连续多时相遥感影像的研究中发现,在某些地表特征基本保持不变的地区,其像元值之间存在的对应关系可以被用于多时相遥感影像的校正(Hall et al, 1991; Lenney et al, 1996)。为削弱DMSP/OLS时间序列的稳定灯光数据彼此间的不连续性,Elvidge等(2009)在参考上述思路的基础上提出了一种基于不变目标区域的DMSP/OLS稳定夜间灯光的连续性校正方法。该方法的核心思想是通过寻找整个时间序列中灯光强度变化最不显著的地区作为不变目标区域,并选定该区域内某一时间点的稳定灯光影像作为标准参考。以不变目标区在整个时间序列内的灯光数据DN值不发生变化为假设,构建待校正影像与参考标准影像的校正方程实现连续性校正。后续学者提出的连续性校正方法大多基于不变目标区域这一原理。Pandey等(2017)分别采用系统最小误差和社会经济指标关联度对当下几种基于不变目标区域提出的连续性校正方法(表1)进行了全面评估。
表1 主要的连续性校正方法对比
Tab.1 Differences in the methodological details of existing calibration methods
| 校正方法 | 应用范围 | 不变目标区 | 参考标准影像 | 校正方程 |
|---|---|---|---|---|
| Elvidge et al, 2009 | 全球 | 西西里(意大利) | F12 1999 | 二阶多项式 |
| Wu et al, 2013 | 全球 | 波多黎各、毛里求斯和冲绳 | RCNTL 2006 | 幂函数 |
| Zhang et al, 2016 | 全球 | 无(使用全局一致的偏差) | F15 2000 | 二阶多项式 |
| Hsu et al, 2015 | 全球 | 洛杉矶 | RCNTL 2006 | 线性函数 |
| Li, Chen, et al, 2013 | 北京 | 无(使用全局一致的偏差) | F15 2001 | 线性函数 |
| Bennie et al, 2014 | 欧洲 | 英格兰西南部 | F12/F14 2004 | 六阶多项式 |
| Pandey et al, 2013 | 印度 | 勒克瑙地区 | F16 2007 | 二阶多项式 |
| Liu et al, 2012 | 中国 | 鸡西市 | F16 2007 | 二阶多项式 |
新一代夜间灯光数据NPP/VIIRS的上线给城市化研究提供了另外一种强有力的数据支撑。NPP/VIIRS夜间灯光数据相较于DMSP/OLS夜间灯光数据无论是在灯光捕获敏感度、灯光记录值域还是空间分辨率上都有了显著的提高。其中DNB(Day Night Band)数据产品由于未进行去光处理,导致VIIRS夜间灯光影像中存在背景噪声,一定程度上限制了该数据的应用。目前针对NPP/VIIRS噪声的方法主要有2类(表2):一类是借助DMSP/OLS夜间灯光影像不存在背景噪声和不稳定光源的特征,使用DMSP/OLS夜间灯光影像对VIIRS夜间灯光影像进行噪声剔除(Li X, Xu H M et al, 2013; 柴子为等, 2015);另一类是通过先验知识选定特殊区域的像元进行统计,在此基础上确定研究区的最大(CBD)和最小灯光阈值(内陆大面积水域),并用该阈值剔除背景噪声(李峰等, 2016; 唐梁博等, 2017)。
2.1.1 不透水面的提取
不透水面(Impervious Surface Area, ISA)又称非渗透性表面,是指由各种不透水建筑材料(如水泥、沥青、瓷砖等)所覆盖的表面(Arnold et al, 1996)。随着城市化进程的加剧,城市地表中渗透性表面(如植被、土壤等)越来越多地被不透水面所替代,并引发了一系列生态、环境问题(Moscrip et al, 1997; Brabec et al, 2002; Gillies et al, 2003; Yuan et al, 2007)。由于不透水面在区域水热循环方面的重要影响,如何准确、快速地提取不透水面引起了诸多学者的思考(王浩等, 2013)。夜间灯光数据所反映的地表灯光强度的分布特征跟不透水面覆盖密切相关,近年来也逐渐被用于不透水面提取。美国国家海洋和大气管理局(National Oceanic and Atmospheric Administration, NOAA)下属的NGDC基于DMSP/OLS灯光数据于2007年首次发布了全球1 km分辨率的地表不透水面数据,并指出中国虽然具有最大的不透水面面积,但人均ISA远低于美国(Elvidge et al, 2007)。Lu等(2008)则利用上文提及的HSI指数结合MODIS NDVI数据和DMSP/OLS数据对中国华南地区的不透水面进行了有效提取。为了获取小尺域的高精度不透水面信息,匡文慧等(2011)将NGDC提出的不透水面指数嵌入高精度人工解译的LUCC(Land-Use and Land-Cover Change)以实现动态更新的城乡建设用地信息提取,提取的不透水面比例误差幅度在15%以内。为了实现大尺度、高精度的不透水面分布制图,郭伟(2015)利用高分辨率的NDVI分别与DMSP/OLS、NPP/VIIRS灯光影像创建融合变量,并提出了归一化不透水面指数NISI和大尺度不透水面指数LISI。该方法克服了以往与阈值法提取不透水面过程中无法保留小面积不透水面的缺陷,具有较大的潜力。随着遥感技术的发展,多源遥感数据的综合利用自动提取不透水面的方法逐渐完善。程熙等(2017)集成了夜间灯光遥感和多光谱遥感数据(Landsat TM影像),通过图像分区的方式在像元级别实现了ISA的自动提取。
2.1.2 城镇建设用地的提取
不同于Landsat系列、SPOT系列等传感器对地表太阳辐射的探测,DMSP/OLS及NPP/VIIRS为代表的传感器能够捕获城市、居民地、渔船等在夜间发出的微弱灯光信号并与黑暗的乡村、山林地区区分开来,进而实现城市边界、城镇建筑用地的信息提取(He et al, 2006)。Croft(1978)首次阐述了利用DMSP/OLS提取城市建成区的可行性后,国内外学者针对夜间灯光数据提取建成区、城市范围、提取算法等方向展开深入的研究。总体来说,目前国内外学者在利用夜间灯光数据提取城市区的研究从提取方法上大致可以分为以下几类:
(1) 阈值分割法。该方法是最常见的一种图像分割方法之一,由于其提取算法相对简单、效率较高,在图像分割的研究中被广泛运用。作为一种灰度图像,夜间灯光影像在阈值分割算法下的目标区域提取同样受到了诸多学者的关注。根据划定阈值的方法、动机的不同,阈值分割法又可以细分为经验阈值、突变检测及参考比较法3个系列。经验阈值通过有关先验知识人为设定特定的阈值进行城市区的提取(Sutton, 1997; Sutton et al, 2001)。由于该方法设定的阈值过程中受个人主观因素影响,其结果缺乏足够的科学依据及稳定性,Zhou等(2014)在此基础上提出了一种基于聚类分割的最优阈值分割算法,并有效地运用于不同发展水平的国家及地区。突变检测法是由Imhoff等(1997)在利用DMSP/OLS提取美国建成区的研究中所提出,该方法假设城市建成区由完整的斑块组成,随着阈值的调整,建成区斑块开始缩小,而斑块出现破碎时的阈值则为提取城市区的最优阈值(黄璐等, 2018)。相较于经验阈值法和突变检测,参考比较法可以根据研究区的不同选择不同的辅助参考数据,因而在提取精度及科学性上有较大的优势。根据辅助参考数据的类型,该方法又可划分为统计数据参考提取和遥感影像参考提取2种。统计数据参考提取的核心要点是以政府发布的各地市的建成区面积统计数据为参考,通过设定初始阈值来初步分割城市与非城市,并对比城市区面积与统计数据之间的差值,不断迭代阈值直到提取的城区面积与统计数据相一致(Milesi et al, 2003; He et al, 2006; Shi, Huang et al, 2014; 董晨炜等, 2017; 杨任飞等, 2017)。遥感影像参考提取则利用高分辨率的多光谱遥感数据或者土地利用数据作为辅助数据实现城市建成区信息提取(Henderson et al, 2003; Liu et al, 2012; 杨洋, 黄庆旭等, 2015; 杨洋, 马学广等, 2015; 唐梁博等, 2017)。
(2) 多时相图像融合法。DMSP/OLS夜间灯光影像之所以被国内外学者广泛地运用于城市化的研究,其中最重要的一个原因在于DMSP/OLS夜间灯光具有较长的时间序列(DMPS/OLS:1992—2013年;NPP/VIIRS:2012年至今),能够提供一个独特的“空中”视角窥探全球、地区的城市化进程。在利用时间序列的夜间灯光影像进行城市化进程的研究中,Small等(2005)率先将不同时间序列经过处理的灯光观测频率影像进行了RGB合成,通过图像颜色的变化实现城市扩张及城市发展方向、趋势的探测。Zhang等(2011)则通过采用迭代的非监督分类方法对多时相融合的NTL组合影像(Multi-temporal DMSP/OLS Data)进行了城市化分析。
(3) 支持向量机法。支持向量机(Support Vector Machine, SVM)是一种基于统计学习理论的无参数图像识别、分类方法(Vapnik, 2000)。SVM作为一种监督学习模型其最大的优势是可以通过较少的训练样本达到较优的分类效果(Mantero et al, 2005)。为了避免经验阈值法在灯光影像城市区提取中可能出现的主观性干扰,Cao等(2009)在传统SVM的基础上提出了支持向量机区域增长算法,半自动地实现城市区的提取。Xiao等(2014)、高亚红等(2017)在多尺度、多时相的城市区提取中进一步拓展了该方法的应用场景。
国内外学者在提取方法领域的深入探讨,也激发部分学者开展了基于夜间灯光影像的城区提取精度的评价研究(舒松等, 2011; 唐敏, 2017)。研究通过选定特定研究区域,运用多种基于灯光影像的城区提取方法实现城市区范围提取,并参照标准数据进行精度评价。
2.1.3 城市发展模式及空间结构分析
城市作为一个由多种要素组合的复杂有机体,在城市化进程中其发展模式和空间结构也处于动态的演变之中。随着夜间灯光数据在不透水面提取、城市建成区提取等方面的广泛应用,不少国内外学者开始不满足于单纯的斑块提取并尝试开展城市发展模式及城市空间结构的相关研究。廖兵等(2012)和范俊甫等(2013)将景观生态学中的景观指数分析方法引入城市灯光斑块的研究中,探索城市发展空间格局变化特征。还有部分学者根据像元层级的灯光辐射亮度与亮度梯度之间的关系,将城市灯光进行多级划分,动态地研究不同类别之间的占比及变化特征以揭示城市发展的规律(Wu et al, 2014; Ma et al, 2015)。Yu等(2014)则开创性地利用改进型无穷距离扩展算法定量地表示城市间的空间邻近性以进行城市聚类分析,识别出城市群。考虑到夜间灯光数据跟地形数据(尤其是数字高程模型DEM)的相似性,也有学者将地形分析中的“波峰”“坡度”等概念思想推广到夜间灯光影像的分析之中,综合利用多种地形分析模型来研究城市的空间结构、扩张轨迹(Yi et al, 2014; 赵敏等, 2015; 张志刚等, 2016; 陈佐旗, 2017)。
2.2.1 人口的空间化及估算
城市人口数据是研究城市发展、制定相应政策的重要支撑数据。传统的人口数据多基于行政单元统计,单元区内人口分布状况被忽略,单元间的人口数据产生突变,无法满足精细尺度的城市发展研究需求。精确掌握人口的数量和分布特征,实现人口数据空间化将有助于信息化城市、智慧城市的建设,为区域可持续发展研究提供数据支持。20世纪70年代,就有资料显示灯光城区面积与人口点分布之间存在显著关系。1997年,Sutton(1997)和Sutton等(1997)就以美国为例,使用DMSP/OLS夜间灯光数据与人口密度数据进行相关性分析,定量地明确了DMSP/OLS夜间灯光数据在分析、估算人口分布领域的潜力。随后,国内学者Lo(2001)以多年份中国地区DMSP/OLS夜间灯光数据为基础,采用灯光面积、灯光体积、像素平均值和灯光密度为独立变量,建立人口估算模型,在多级行政单元尺度上估算了中国的平均人口密度。卓莉等(2005)和Zhuo等(2009)通过对行政单元内灯光斑块面积与居住面积的占比将行政单元进行归类,分类建立灯光强度与人口之间的回归模型以实现大尺度的人口密度快速估算。曹丽琴等(2009)利用多时相灯光遥感数据和社会统计数据建立线性模型估算地级市和直辖市人口,并利用BP神经网络估算县级市、城镇人口。
近年来,随着多遥感数据的丰富,学者们一方面开始将土地利用信息与DMSP/OLS夜间灯光数据相结合进行更精准的人口空间化研究(梁友嘉等, 2012; 陈晴等, 2014; 陈晴等, 2015; 黄杰等, 2015; 马钰琪等, 2015; 王珂靖等, 2015; 高倩等, 2017)。另一方面,由于NPP/VIIRS夜间灯光数据产品的面世,利用NPP/VIIRS夜间灯光数据进行不同尺度的人口空间化研究(黄益修, 2016; 李翔等, 2017)以及DMSP/OLS与NPP/VIIRS夜间灯光数据人口空间化精准度对比的研究也越来越多(高义等, 2013; 胡云锋等, 2018)。此外,张志杰(2016)将夜间灯光估算人口的研究进一步延伸到灾后评估,利用人口统计数据与灯光强度之间的定量关系模型,对汶川地震的灾区面积及受灾区域人口进行估算分析,有力支援了地震灾害的应急决策。
2.2.2 GDP参数的空间化及估算
长期以来,GDP指标的核算都是建立在各种统计资料、统计报表之上,并以行政单元为基础,缺乏有效、准确的空间位置信息。如何快速有效地将传统GDP统计数据跟地理坐标关联,实现GDP指标的空间化以更好地开展更加精细的区域发展研究成为了值得关注的问题。由于夜间灯光在刻画地表人类活动及城市夜间活力方面的特性,使利用夜间灯光数据进行GDP参数的空间化估算成为了可能。早在1997年,Elvidge等(1997)就以美国等21个国家为研究区,利用DMSP/OLS夜间灯光数据分析了区域灯光灰度值与GDP、耗电量等指标的相关性,并在随后的研究中进一步拓展了研究区范围,通过建模明确了灯光数据在GDP空间化估算方面的实际意义(Elvidge, Imhoff et al, 2001)。Sutton等(2002)认为某一国家的GDP与该国的发射灯光能量(Light Energy, LE)有关,并首次绘制了全球1 km分辨率的经济活动地图。基于灯光辐射亮度值与GDP及GRP(Gross Regional Product)的高相关性,Doll等(2006)绘制了欧洲11个国家及地区5 km分辨率的GDP格网地图。在地区尺度上,近年来国内学者也逐步开展了基于DMSP/OLS夜间灯光数据的GDP空间格网化研究(Chen et al, 2011; 王琪等, 2013; Yue et al, 2014; Cao et al, 2016)。随着夜间灯光遥感数据在GDP空间化领域应用日渐成熟,韩向娣等(2012)、梁友嘉等(2013)和李宗光等(2016)开始分产业定量的探讨夜间灯光数据与统计型社会经济数据的空间关系。随着新一代的夜间灯光数据的上线,基于NPP/VIIRS夜间灯光数据的GDP空间化研究也逐步展开并取得了一系列成果(郭永德等, 2016; 李峰, 米晓楠等, 2016; 李峰, 卫爱霞等, 2016)。为了对比DMSP/OLS夜间灯光数据与NPP/VIIRS夜间灯光数据在参与GDP空间化及估算过程中的精度差异,部分学者选取了多个灯光指标与GDP进行相关性分析,结果表明NPP/VIIRS夜间灯光数据在GDP空间化过程中具有更高的准确性(Shi, Yu et al, 2014; 柴子为等, 2015; 曹子阳, 2016)。
2.2.3 电力消耗量、碳排放量的估算
城市化进程的加剧、国民经济的快速增长,推动了居民生活水平的快速提升,加剧了城市电力能源消耗量与碳排放量。电力消耗量能直观地反映地区的电力消费状况、衡量地区社会发展水平。由于目前的电力消耗量和碳排放量的统计单元还处于行政单元级别,缺乏空间分异信息,无法揭示地区电力消耗与碳排放的地区差异,限制了统计数据的有效应用。连续高分辨率夜间灯光数据可以清楚探测到人类足迹,引起诸多学者开展电力消耗量、碳排放量的估算研究。
利用夜间灯光数据进行能源消耗量估算的研究起源于20世纪80年代(Welch, 1980; Foster, 1983)。Welch(1980)率先选取美国东部的城市为研究区,结合夜间灯光影像建立起电力消耗量和灯光亮度之间的回归模型,验证了夜间灯光数据进行电力消耗量估算的可行性。Elvidge等(1997)和Elvidge、Imhoff等(2001)先后在国家尺度利用DMSP/OLS夜间灯光数据的区域灯光灰度值与地区电力能源消耗量之间的相关性构建了对数模型。Amaral等(2005)以亚马逊河流域为研究区,在区域尺度量化了DMSP/OLS夜间灯光数据和电力能量消耗间的相关性。Letu等(2009)对亚洲十几个国家的电力消费与夜间灯光强度之间的相关性分析也进一步验证了夜间灯光影像在估算电力消耗量的可行性。Chand等(2009)基于DMSP/OLS夜间灯光数据对印度开展了长时间序列的电力消耗量时空变化特征研究。Min等(2013)则聚焦非洲的农村地区,通过相关性分析验证了使用夜间灯光监测电力普及率的合理性。2010年来,国内学者在电力消耗量估算方面则侧重于利用时间序列的夜间灯光影像来构建精确的电力消耗量反演模型进行能源消费时空动态分析(李通等, 2011; Zhao et al, 2012; He et al, 2014; 吴健生等, 2014; 曹子阳等, 2015; 李俊峰, 2015; 朱林富, 2015; 潘竟虎等, 2016)。Shi等(2018)最新的研究将研究区视角聚焦到“一带一路”国家,基于DMSP/OLS夜间灯光数据从多个角度研究“一带一路”国家中EPC(Electric Power Consumption)的时空模式。
根据有关统计资料显示,2000年以来中国CO2排放量增长迅速,截至2008年年度碳排放量已经超过美国成为了世界第一碳排放国(刘占成等, 2010)。面对着前所未有的节能减排国际压力,如何能够准确、有效、及时地掌握不同尺度的碳排放时空特征显得尤为迫切。目前,国内的碳排放数据多为国家统计局及下属部门发布的统计数据,缺乏有效的空间信息,且不同层级的部门之间也存在着统计口径不一致问题。
近年来,随着夜间灯光数据在人类社会活动、城市化进程方面的研究深入和拓展,国内外学者们开始将夜间灯光数据参与碳排放的空间化分析过程。国外学者在利用夜间灯光数据进行碳排放研究起步较早,Doll等(2000)选取了全球不同发展阶段的多个国家,分析了DMSP/OLS灯光面积和CO2排放量的相关性,并成功绘制了1995年的全球1°格网的CO2分布图。Raupach等(2010)选择了美国、中国、日本等国家,按照经济发展水平分为多个区域进行单位灯光面积与碳排放量之间的相关性分析。Ghosh等(2010)则综合利用DMSP/OLS夜间灯光数据和人口分布数据,分别对CO2排放量进行模拟,并将模拟的结果相结合生存了全球1 km分辨率的CO2排放量空间分布图。发展中国家CO2排放量快速增长,却缺乏能源数据,国内学者Meng等(2014)基于夜间灯光数据提出了一种自上而下的方法来估算城市规模的 CO2排放量。苏泳娴等(2013)、Su等(2014)和苏泳娴(2015)针对目前各地区碳排放统计口径不一致、数据严重缺失的现状,基于DMSP/OLS夜间灯光数据,构建了一套快速准确监测地级市能源碳排放的定量测算方法。
2.2.4 空气污染物评估
近年来,频繁出现的雾霾天气严重影响了城市居民的身心健康和生存质量。2014年1月4日,国家减灾办、民政部首次将危害健康的雾霾天气纳入2013年自然灾情进行通报。雾霾天气是一种大气污染状态,雾霾是对大气中各种悬浮颗粒物含量超标的笼统表述,尤其是PM2.5(空气动力学当量直径小于等于2.5 μm的颗粒物)被认为是造成雾霾天气的“元凶”。随着雾霾问题逐渐被公众关注和了解,如何持续有效地监测雾霾状况成为了研究热点之一。特别是NPP/VIIRS的发射成功实现了全球夜间灯光的连续性监测,从而也促使了学者开展利用夜间灯光数据进行空气污染物的监测研究。李伟等(2015)收集了北京市VIIRS夜间灯光数据和部分地面空气质量监测站点PM2.5浓度数据,并基于GIS空间插值分析提出一种新的持续监测城市雾霾天气的方法。李润亚(2015)则基于日均NTL数据建立了BP神经网络模型用于反演地表PM2.5浓度。Wang等(2016)选取VIIRS的DNB数据集对比分析了美国亚特兰大地区夜间灯光辐射强度和PM2.5浓度之间的关系,结果表明DNB图像能够反映城市规模的空气质量变化,并能够表征PM2.5的变化特征。赵笑然等(2017)以北京市作为研究区,基于DNB微光辐射数据和PM2.5监测站点数据及支持向量机方法,建立了夜间城市PM2.5质量浓度反演模型。尽管目前基于DMSP/OLS(曹子阳, 2016)和NPP/VIIRS夜间灯光影像的PM2.5反演及相关性研究取得了一定的成果,但在研究过程中依然存在着研究区过于限定、其他环境变量被忽略、缺乏理论分析认证等不足。如何进一步丰富夜间灯光影像与空气污染物分布间的理论关联,定量反演更大尺度、时间序列的污染物分布是未来研究的重点。
除了上述的城市化研究和参数空间化应用外,夜间灯光数据还在灾害评估、重大事件评估、渔业研究等方面也起到了重要的数据支撑作用。在灾害评估方面,学者们将夜间灯光数据分别应用于地震灾害评估(Hayashi et al, 2000; Kohiyama et al, 2004;刘双庆, 2012; 张宝军, 2018)、台风灾害评估(李钢, 2014)、森林草原火灾(Elvidge, Hobson et al, 2001; Chand et al, 2007; 乌云德吉, 2014)等并取得了一系列成果。针对重大事件评估的研究则主要涉及能源(De Souza Filho et al,2001;Cao et al, 2013)、经济(Li, Ge et al, 2013)、战争(Agnew et al, 2008; Witmer et al, 2011; Li, Chen, et al, 2015; Li et al, 2014)等方面。利用夜间灯光数据的渔业研究开始于20世纪90年代(Cho et al,1999),并逐渐延伸到渔船定位(Kiyofuji et al, 2004; Waluda et al, 2004; 郭刚刚等, 2017)、渔业强度(Waluda et al, 2008; 张思宇, 2017)、海洋环境评估(Aubrecht et al, 2008; Cho et al, 2010)、油气平台识别(成王玉, 2015; 李强等, 2017)等方面。
通过对以上夜间灯光遥感数据的应用研究进行梳理(表3),不难发现,当下给予夜间灯光遥感数据的应用研究正在从传统的人口、GDP、能源消耗等领域开始不断拓展,朝着更多、更广的交叉领域延伸,并取得了诸多富有意义的成果。同时,随着中国首颗夜间灯光遥感卫星“珞珈一号”的成功发射与运作,夜间灯光遥感的研究也将迎来新的契机。
表3 夜间灯光遥感数据的应用研究总结
Tab.3 A summary of application research of nighttime light data
| 应用领域 | 主要方法 | 代表研究 | |
|---|---|---|---|
| 城市化研究 | 不透水面提取 | 融合HSI和NDVI | Lu等(2008)基于HIS、NDVI和DMSP/OLS数据对中国华南地区的不透水面进行了有效提取 |
| 融合LUCC | 匡文慧等(2011)将人工解译的LUCC融入不透水面指数提取中,实现动态更新的城乡建设用地信息提取 | ||
| 融合Landsat TM | 程熙等(2017)集成了夜间灯光遥感和Landsat TM影像,实现了ISA的自动提取 | ||
| 建设用地提取 | 阈值分割法 | Zhou等(2014)在提出了一种基于聚类分割的最优阈值分割算法,并有效地运用于不同发展水平的国家及地区 | |
| 多时相图像融合法 | Small等(2005)将不同时间序列的经过处理的灯光观测频率影像进行了RGB合成,通过图像颜色的变化实现城市扩张及城市发展方向、趋势的探测 | ||
| 支持向量机法 | Cao等(2009)在传统SVM的基础上提出了支持向量机区域增长算法,半自动地实现城市区的提取 | ||
| 城市发展模式识别 | 景观指数分析法 | 廖兵等(2012)和范俊甫等(2013)将景观生态学中的景观指数分析方法引入城市灯光斑块的研究中,探索城市发展空间格局变化特征 | |
| 多级划分法 | Wu等(2014)根据像元层级的灯光辐射亮度与亮度梯度之间的关系,将城市灯光进行多级划分,动态的研究不同类别之间的占比及变化特征以揭示城市发展的规律 | ||
| 改进型无穷距离扩展算法 | Yu等(2014)开创性地利用改进型无穷距离扩展算法定量表示城市间的空间邻近性以进行城市聚类分析,识别出城市群 | ||
| 地形分析法 | 张志刚等(2016)构建灯光亮度和灯光亮度起伏度特征组合值模型,分析灯光亮度和灯光亮度起伏度组合特征,并对城 乡结合部进行空间识别 | ||
| 参数空间化 | 人口 | 多元灯光指标估算模型 | Lo(2001)以多年份中国地区DMSP/OLS夜间灯光数据为基础,采用灯光面积、灯光体积、像素平均值和灯光密度为独立变量,建立人口估算模型,在多级行政单元尺度上估算了中国的平均人口密度 |
| 结合社会统计数据的估算模型 | 曹丽琴等(2009)利用多时相灯光遥感数据和社会统计数据建立线性模型估算地级市和直辖市人口 | ||
| 结合LUCC数据的估算模型 | 梁友嘉等(2012)基于夜间灯光辐射数据和LUCC在像元栅格水平上构建张掖市甘州区人口空间分布 | ||
| GDP | 全球尺度GDP估算模型 | Sutton等(2002)首次绘制了全球1 km分辨率的经济活动地图 | |
| 区域尺度GDP总体估算模型 | Doll等(2006)绘制了欧洲11个国家及地区5 km分辨率的GDP格网地图 | ||
| 分产业GDP估算模型 | 韩向娣等(2012)分产业定量地探讨夜间灯光数据与统计型的社会经济数据的空间关系,并绘制出了全国GDP密度图 | ||
| 电力能源消耗 | 单时相电力能源消耗估算模型 | Amaral等(2005)以亚马逊河流域为研究区,在区域尺度量化了DMSP/OLS夜间灯光数据和电力能量消耗间的相关性 | |
| 时间序列电力消耗估算模型 | Chand等(2009)基于DMSP/OLS夜间灯光数据对印度开展了长时间序列的电力消耗量时空变化特征研究 | ||
| 空气污染物 | 空间插值法 | 李伟等(2015)基于GIS空间插值分析提出一种新的持续监测城市雾霾天气的方法,并对北京市的PM2.5浓度进行了反演 | |
| BP神经网络模型 | 李润亚(2015)则基于日均NTL数据建立了BP神经网络模型用于反演地表PM2.5浓度 | ||
| 支持向量机方法 | 赵笑然等(2017)以北京市作为研究区,基于支持向量机方法建立了夜间城市PM2.5质量浓度反演模型 | ||
| 灾害评估 | 相关性分析 | 张宝军(2018)基于夜间灯光遥感数据, 分析汶川地震极重灾区夜间灯光分布范围和强度的年际变化特点, 探索分析夜间灯光变化与灾害损失的相关关系 | |
| 渔业研究 | 渔船定位识别 | 阈值分割峰值检测算法 | 郭刚刚等(2017)基于最大熵法阈值分割以及局部峰值检测法,对西北太平洋公海灯光围网渔场船只进行了识别 |
自美国国家地球物理中心NGDC下属的对比观测小组EOG向大众发布夜间灯光影像数据开始,围绕夜间灯光数据的图像处理、信息提取、数据挖掘等研究如雨后春笋般接踵而至,夜间灯光数据的出现为研究人类活动及城市化进程提供了一种独特的视角和稳定便捷的途径。目前基于夜间灯光数据的研究主要是DMSP/OLS和NPP/VIIRS两种夜间灯光影像。研究的热点主要集中在城市扩张、建成区提取、人口社会经济指标的空间化和电力消耗估算等领域。
虽然,近年来基于夜间灯光的研究和应用无论从深度还是广度而言均取得了诸多成果,但还存在一定不足,包括:① 数据本身的缺陷极大地阻碍和削弱了夜间灯光数据在定量分析中的准确性。具体而言,DMSP/OLS夜间灯光数据虽然具有较长的时间跨度,但是却存在着辐射饱和、空间分辨率较低和多传感器数据不连续等缺陷。此外,由于区域间社会经济水平、发展程度差异导致在运用DMSP/OLS灯光数据时需要分区进行参数设计(具有黑箱性、非机理性),在一定程度上限制了灯光数据的精细化应用。而NPP/VIIRS夜间灯光数据在辐射饱和、空间分辨率问题上有了显著的提升,但是却存在背景噪声、数据时间跨度较短等不足。学者们针对这些问题也积极开展了多方面的努力,在一定程度弥补了数据质量缺陷带来的干扰,但还是不可避免地会削弱定量分析的准确性和结论可靠性。② 基于夜间灯光数据的城市化研究大部分还停留在城区范围识别、区域经济、人口相关性分析等区域尺度,而在城市内部尺度的灯光概率分布、城市内部发展特征的研究相对不足。③ 目前利用夜间灯光数据开展的社会经济研究中,夜间灯光影像充当的是一种辅助数据,研究中缺乏对区域灯光差异的地表真实情况的对比分析。
通过对现有研究成果和存在的不足进行总结,本文认为夜间灯光数据的应用研究还将会持续深入拓展,今后的研究热点将会从以下几个方向开展:① 多源数据的融合。目前已经有部分学者开始开展了多光谱遥感数据和夜间灯光数据的融合,相较于单一的灯光数据,融合后的数据可以发挥多源遥感数据各自的优势,拓展数据的应用场景。值得关注的是,多源数据不仅仅包括栅格影像数据,还包括矢量数据。当下是大数据的时代,矢量数据(POI、路网数据等)作为大数据的重要组成部分也应当被纳入多源数据融合的范畴中,充分发挥矢量数据在空间分辨率方面的优势。② 夜间灯光数据应用领域的拓展。一方面,当下的夜间灯光数据的研究领域多集中在城市发展、社会经济等方面,基于自然变化、环境保护等方面的研究薄弱,亟需开拓新的研究领域,加强知识发现;另一方面,基于夜间灯光的研究目前还局限于全球、地区、城市尺度,城市内部小尺度研究应用,特别是针对工程实施和局地尺度的管理尚处于空缺阶段,迫切需要开创新的发掘新型夜间灯光遥感数据的潜力以拓展新尺度的应用实践。③ 短周期的灯光监测研究。NPP/VIIRS夜间灯光数据提供了自2012年2月以来的逐月灯光影像,如何有效利用月度的VIIRS夜间灯光影像进行短周期的地表灯光变化监测将是地理国情监测的一个新尝试。
The authors have declared that no competing interests exist.
| [1] |
基于DMSP/OLS夜间灯光数据的城市人口估算: 以湖北省各县市为例 [J].https://doi.org/10.3969/j.issn.1000-3177.2009.01.016 URL [本文引用: 1] 摘要
城市人口数据是了解城市发展的重要因素,对研究城市环境等方面也有重要意义。随着GIS和遥感技术的发展,利用大面积、多时相的遥感数据研究城市人口的技术也日渐成熟。本文借助遥感数据和GIS手段分析2000年湖北省各县市DMSP/OLS卫星的夜间灯光数据亮度值与各县市城镇人口之间的关系,建立相应的模型模拟湖北省2002年76个县市城区人口,其结果预测吻合度为98.94%,平均相对误差为10.95%,说明利用夜间灯光数据对城镇人口做短期的预测可以达到很好的效果。
Urban population estimation based on the DMSP/OLS nighttime satellite data: A case of Hubei Province .https://doi.org/10.3969/j.issn.1000-3177.2009.01.016 URL [本文引用: 1] 摘要
城市人口数据是了解城市发展的重要因素,对研究城市环境等方面也有重要意义。随着GIS和遥感技术的发展,利用大面积、多时相的遥感数据研究城市人口的技术也日渐成熟。本文借助遥感数据和GIS手段分析2000年湖北省各县市DMSP/OLS卫星的夜间灯光数据亮度值与各县市城镇人口之间的关系,建立相应的模型模拟湖北省2002年76个县市城区人口,其结果预测吻合度为98.94%,平均相对误差为10.95%,说明利用夜间灯光数据对城镇人口做短期的预测可以达到很好的效果。
|
| [2] |
基于夜间灯光影像的GDP空间分布模拟研究及其与PM2.5浓度的相关分析 [D].Estimating the spatial distribution of GDP based on nighttime light image and analysis of correlation between it and PM2.5concentration . |
| [3] |
DMSP/OLS夜间灯光影像中国区域的校正及应用 [J].https://doi.org/10.3724/SP.J.1047.2015.01092 URL Magsci [本文引用: 3] 摘要
美国国防气象卫星搭载的业务型线扫描传感器(DMSP/OLS)获取的夜间灯光影像,可客观地反映人类开发建设活动强度,其广泛应用于城市遥感的多个领域。但该数据缺少星上的辐射校正,下载的原始影像数据集不能直接用于研究,需进行区域校正。长时间序列的DMSP/OLS夜间灯光影像数据集主要存在2个问题需在校正过程中解决:(1)原始影像数据集中的影像是非连续性的;(2)数据集中的每一期影像都存在着像元DN值饱和的现象。针对这2个问题,本文提出了一种不变目标区域法的影像校正方法,对提取出来的每一期中国区域的夜间灯光影像进行了校正,该校正方法包括相互校正、饱和校正和影像间的连续性校正。最后,为了检验校正方法的合理性与可靠性,本文将校正前后中国夜间灯光影像与GDP和电力消耗值,分别进行回归分析评价表明,校正后的影像更客观合理地反映区域经济发展的差异。
Correction of DMSP/OLS night-time light images and its application in China. Journal of Geo-information https://doi.org/10.3724/SP.J.1047.2015.01092 URL Magsci [本文引用: 3] 摘要
美国国防气象卫星搭载的业务型线扫描传感器(DMSP/OLS)获取的夜间灯光影像,可客观地反映人类开发建设活动强度,其广泛应用于城市遥感的多个领域。但该数据缺少星上的辐射校正,下载的原始影像数据集不能直接用于研究,需进行区域校正。长时间序列的DMSP/OLS夜间灯光影像数据集主要存在2个问题需在校正过程中解决:(1)原始影像数据集中的影像是非连续性的;(2)数据集中的每一期影像都存在着像元DN值饱和的现象。针对这2个问题,本文提出了一种不变目标区域法的影像校正方法,对提取出来的每一期中国区域的夜间灯光影像进行了校正,该校正方法包括相互校正、饱和校正和影像间的连续性校正。最后,为了检验校正方法的合理性与可靠性,本文将校正前后中国夜间灯光影像与GDP和电力消耗值,分别进行回归分析评价表明,校正后的影像更客观合理地反映区域经济发展的差异。
|
| [4] |
基于夜间灯光数据的珠三角地区镇级GDP估算 [J].
<p>高精度地表GDP分布数据是开展小尺度区域发展相关研究的关键数据,但通常难以获得完整数据序列。文章比较了DMSP-OLS和NPP-VIRS两种夜间灯光数据在小尺度单元GDP估算工作上的适应性,证实NPP-VIIRS数据在镇级GDP估算中有更好的性能。利用修正后的NPP-VIIRS夜间灯光数据建立珠三角地区镇级GDP估算模型,并通过地区差异系数对估计结果进行校正。对2013年镇级GDP估算的实验结果总体精度达到85%。估算结果能够用于填补珠三角地区部分镇级GDP统计数据缺失,为相关研究获取、对比GDP数据提供技术手段。</p>
Township GDP estimation of the Pearl River Delta based on the NPP/VIIRS night-time satellite data .
<p>高精度地表GDP分布数据是开展小尺度区域发展相关研究的关键数据,但通常难以获得完整数据序列。文章比较了DMSP-OLS和NPP-VIRS两种夜间灯光数据在小尺度单元GDP估算工作上的适应性,证实NPP-VIIRS数据在镇级GDP估算中有更好的性能。利用修正后的NPP-VIIRS夜间灯光数据建立珠三角地区镇级GDP估算模型,并通过地区差异系数对估计结果进行校正。对2013年镇级GDP估算的实验结果总体精度达到85%。估算结果能够用于填补珠三角地区部分镇级GDP统计数据缺失,为相关研究获取、对比GDP数据提供技术手段。</p>
|
| [5] |
集成土地利用数据和夜间灯光数据优化人口空间化模型 [J].https://doi.org/10.3724/SP.J.1047.2015.01370 URL Magsci [本文引用: 1] 摘要
<p>人口统计数据空间化是解决统计数据与自然要素数据融合分析的有效途径。随着RS和GIS技术的发展,人口统计数据空间化方法推陈出新,其中,土地利用数据、夜间灯光数据是人口空间化研究中普遍利用的数据源,但各有优、缺点:土地利用数据中的城镇用地、农村居民点能准确表示人口分布的空间范围,却不能反映其内部的人口密度差异特征;夜间灯光数据的强度信息能体现人口分布的疏密程度,但其像元溢出问题显著夸大人口分布范围,像元过饱和现象也影响着人口数据空间化结果的精度。本研究以中国大陆沿海区域为例,尝试集成土地利用数据和夜间灯光数据优化人口空间化方法,设计了基于精度阈值和动态样本的渐进回归与分区建模的方法,获得了中国沿海2000、2005、2010年1 km分辨率人口空间化数据。结果表明,优化模型显著提高了研究区整体的精度,尤其适用于人口空间结构内部差异较为显著的区域。</p>
An improved population spatialization model by combining land use data and DMSP/OLS data. Journal of Geo-information https://doi.org/10.3724/SP.J.1047.2015.01370 URL Magsci [本文引用: 1] 摘要
<p>人口统计数据空间化是解决统计数据与自然要素数据融合分析的有效途径。随着RS和GIS技术的发展,人口统计数据空间化方法推陈出新,其中,土地利用数据、夜间灯光数据是人口空间化研究中普遍利用的数据源,但各有优、缺点:土地利用数据中的城镇用地、农村居民点能准确表示人口分布的空间范围,却不能反映其内部的人口密度差异特征;夜间灯光数据的强度信息能体现人口分布的疏密程度,但其像元溢出问题显著夸大人口分布范围,像元过饱和现象也影响着人口数据空间化结果的精度。本研究以中国大陆沿海区域为例,尝试集成土地利用数据和夜间灯光数据优化人口空间化方法,设计了基于精度阈值和动态样本的渐进回归与分区建模的方法,获得了中国沿海2000、2005、2010年1 km分辨率人口空间化数据。结果表明,优化模型显著提高了研究区整体的精度,尤其适用于人口空间结构内部差异较为显著的区域。</p>
|
| [6] |
基于土地利用数据和夜间灯光数据的人口空间化模型对比分析: 以黄河三角洲高效生态经济区为例 [J].
人口统计数据空间化是解决统计数据与自然要素数据融合分析的有效途径。随着RS和GIS技术的发展,人口空间化方法推陈出新,但不同的方法各有优缺点,方法选择和精度保证是两个重要的问题。本文以黄河三角洲高效生态经济区2010年县(市、区)单元人口统计信息为案例,分别基于土地利用数据和夜间灯光数据建立1km栅格的人口空间化模型,再分别以县(市、区)和乡(镇、街道办)为验证单元,比较两种方法模拟人口分布的优缺点。结果表明,基于土地利用数据的人口空间化模型整体优于基于夜间灯光数据的人口空间化模型,且前者更适合于模拟人口总数居中的县(市、区),后者在人口密度梯度较大的城镇边缘有更好的模拟效果,在人口较少的地区二者的模拟效果均不太理想。本研究能够为获取高精度的区域人口空间化模型提供参考。
Comparing of population spatialization models based on land use data and DMSP/OLS data respectively: A case study in the efficient ecological economic zone of the Yellow River Delta .
人口统计数据空间化是解决统计数据与自然要素数据融合分析的有效途径。随着RS和GIS技术的发展,人口空间化方法推陈出新,但不同的方法各有优缺点,方法选择和精度保证是两个重要的问题。本文以黄河三角洲高效生态经济区2010年县(市、区)单元人口统计信息为案例,分别基于土地利用数据和夜间灯光数据建立1km栅格的人口空间化模型,再分别以县(市、区)和乡(镇、街道办)为验证单元,比较两种方法模拟人口分布的优缺点。结果表明,基于土地利用数据的人口空间化模型整体优于基于夜间灯光数据的人口空间化模型,且前者更适合于模拟人口总数居中的县(市、区),后者在人口密度梯度较大的城镇边缘有更好的模拟效果,在人口较少的地区二者的模拟效果均不太理想。本研究能够为获取高精度的区域人口空间化模型提供参考。
|
| [7] |
基于多源夜间灯光遥感影像的多尺度城市空间形态结构分析 [D].A multiscale analysis on urban area and spatial structure based on nighttime light data . |
| [8] |
南海油气钻井平台遥感提取研究 [D].Research on extraction of oil and gas drilling platforms with remote sensing in the South China Sea . |
| [9] |
集成夜间灯光数据与Landsat-TM影像的不透水面自动提取方法研究 [J].
利用多源遥感数据提取不透水面信息是一个重要的研究方向。针对以往研究中多需要人工选取不透水面样本进行模型训练的问题,本文通过整合夜间灯光遥感与Landsat TM影像中的空间和光谱信息实现了不透水面覆盖范围(Impervious Surface Area,ISA)的自动提取。首先根据夜间灯光的分布来定位ISA聚集的城市区域的位置,分别在城市区域内部和外部自动提取可靠性高的ISA及非ISA样本,然后通过迭代分类提取城市区域的ISA,再以此为样本对城市区域外部进行分类,最后将分类结果整合完成整幅影像的ISA提取流程。应用本方法对美国雪城地区的DMSP/OLS夜间灯光影像上提取了84个城市区域,提取精度大于95%。从中分别选择高ISA密度和低ISA密度的2个城市区域作为ISA提取的测试区,本文方法在城市区域内的ISA提取总体精度与kappa系数分别为88.23%和0.63;在城市区域外部为78.6%和0.54,均优于人工样本选取方法的提取精度,表明该方法能够实现精度稳定且高效的ISA自动提取。
Automatic extraction method for impervious surface area by integrating nighttime light data and Landsat TM images. Journal of Geo-information
利用多源遥感数据提取不透水面信息是一个重要的研究方向。针对以往研究中多需要人工选取不透水面样本进行模型训练的问题,本文通过整合夜间灯光遥感与Landsat TM影像中的空间和光谱信息实现了不透水面覆盖范围(Impervious Surface Area,ISA)的自动提取。首先根据夜间灯光的分布来定位ISA聚集的城市区域的位置,分别在城市区域内部和外部自动提取可靠性高的ISA及非ISA样本,然后通过迭代分类提取城市区域的ISA,再以此为样本对城市区域外部进行分类,最后将分类结果整合完成整幅影像的ISA提取流程。应用本方法对美国雪城地区的DMSP/OLS夜间灯光影像上提取了84个城市区域,提取精度大于95%。从中分别选择高ISA密度和低ISA密度的2个城市区域作为ISA提取的测试区,本文方法在城市区域内的ISA提取总体精度与kappa系数分别为88.23%和0.63;在城市区域外部为78.6%和0.54,均优于人工样本选取方法的提取精度,表明该方法能够实现精度稳定且高效的ISA自动提取。
|
| [10] |
基于夜间灯光数据的环杭州湾城市扩张及植被变化 [J].
综合运用遥感与GIS技术,基于2000、2007和2013年的DMSP/OLS夜间灯光数据和MODIS NDVI数据,利用灯光阈值提取法、植被指数分析等方法,研究环杭州湾地区城市扩张和建成区植被变化特征.结果表明:采用最佳阈值方法,能够实现对城市地区用地信息的有效提取;环杭州湾地区城市用地整体围绕杭州湾呈“V”型模式扩展,并表现出面状、线状和点状3种扩张模式;从城市扩张速度、动态度和形态紧凑度来看,各地级市表现出较大的时空差异,但整个研究区的城市扩张速度和动态度普遍呈现降低趋势,平均城市形态紧凑度则经历了先下降后上升的过程.各城市建成区的植被状况也存在显著差异,2000—2007年,除嘉兴市建成区植被状况变差外,其余各地级市建成区植被状况均变好;2007—2013年,所有城市建成区植被状况变差;2000—2013年,城市扩张对建成区植被均产生了不利影响.
Urban expansion and vegetation changes in Hangzhou Bay area using Night-light data .
综合运用遥感与GIS技术,基于2000、2007和2013年的DMSP/OLS夜间灯光数据和MODIS NDVI数据,利用灯光阈值提取法、植被指数分析等方法,研究环杭州湾地区城市扩张和建成区植被变化特征.结果表明:采用最佳阈值方法,能够实现对城市地区用地信息的有效提取;环杭州湾地区城市用地整体围绕杭州湾呈“V”型模式扩展,并表现出面状、线状和点状3种扩张模式;从城市扩张速度、动态度和形态紧凑度来看,各地级市表现出较大的时空差异,但整个研究区的城市扩张速度和动态度普遍呈现降低趋势,平均城市形态紧凑度则经历了先下降后上升的过程.各城市建成区的植被状况也存在显著差异,2000—2007年,除嘉兴市建成区植被状况变差外,其余各地级市建成区植被状况均变好;2007—2013年,所有城市建成区植被状况变差;2000—2013年,城市扩张对建成区植被均产生了不利影响.
|
| [11] |
1992-2010年基于DMSP-OLS图像的环渤海城市群空间格局变化分析 [J].https://doi.org/10.3724/SP.J.1047.2013.00280 URL Magsci [本文引用: 1] 摘要
从DMSP-OLS数据提取城市区域的经验阈值法存在固有的缺陷, 经验阈值对不同的空间区域不具备通用性, 不适用的经验阈值, 将导致城区面积提取具有较大误差, 可采用统计数据对经验阈值进行修正以降低误差。本文在大时空尺度条件下以少量样本城市的统计数据对经验阈值方法进行了修正;另采用Elvidge二次多项式模型对DMSP-OLS时间序列数据进行了校正。在此基础上选取总斑块数量、景观总面积、平均斑块大小、最大斑块面积比、斑块密度、景观形状指数、总边界长度、平均边界密度和斑块平均回旋半径共9个景观生态学指标, 采用FRAGSTATS 3.3软件计算分析了1992-2010年环渤海区域城市发展的空间格局变化特征。结果表明:1992-2010年间, 环渤海区域城市化进程持续较快发展, 城市建成区总面积增加了2.14倍, 平均城市建成区面积增加了76%, 提取到的城市斑块平均回旋半径增加了约26.5%, 并且城市景观斑块的复杂度明显上升, 可检测到的城镇总个数增加了82%。但是, 每100km2内孤立的城市景观斑块数却降低了约76%;大城市持续扩张的相对速度慢于中小城市, 城市区域边界密度和整体城市分布景观格局破碎度逐渐降低, 核心城市与周围卫星城市的景观斑块的联通性逐步增加。
Changes in spatial patterns of urban landscape in Bohai Rim from 1992 to 2010 using DMSP/OLS data .https://doi.org/10.3724/SP.J.1047.2013.00280 URL Magsci [本文引用: 1] 摘要
从DMSP-OLS数据提取城市区域的经验阈值法存在固有的缺陷, 经验阈值对不同的空间区域不具备通用性, 不适用的经验阈值, 将导致城区面积提取具有较大误差, 可采用统计数据对经验阈值进行修正以降低误差。本文在大时空尺度条件下以少量样本城市的统计数据对经验阈值方法进行了修正;另采用Elvidge二次多项式模型对DMSP-OLS时间序列数据进行了校正。在此基础上选取总斑块数量、景观总面积、平均斑块大小、最大斑块面积比、斑块密度、景观形状指数、总边界长度、平均边界密度和斑块平均回旋半径共9个景观生态学指标, 采用FRAGSTATS 3.3软件计算分析了1992-2010年环渤海区域城市发展的空间格局变化特征。结果表明:1992-2010年间, 环渤海区域城市化进程持续较快发展, 城市建成区总面积增加了2.14倍, 平均城市建成区面积增加了76%, 提取到的城市斑块平均回旋半径增加了约26.5%, 并且城市景观斑块的复杂度明显上升, 可检测到的城镇总个数增加了82%。但是, 每100km2内孤立的城市景观斑块数却降低了约76%;大城市持续扩张的相对速度慢于中小城市, 城市区域边界密度和整体城市分布景观格局破碎度逐渐降低, 核心城市与周围卫星城市的景观斑块的联通性逐步增加。
|
| [12] |
基于DMSP/OLS夜间灯光数据的天山北坡城市群人口分布空间模拟 [J].
针对城市群中小尺度资源环境研究领域对空间型人口分布数据的需求,以DMSP/OLS夜间灯光卫星数据为依据,借助土地利用/覆盖矢量数据集提取居住用地信息,采用GIS与SPSS相结合的方法,分析夜间灯光像元DN值与人口统计数据的相关性,构建天山北坡城市群2002和2012年份人口分布的空间化模型,并制作1km格网尺度的人口密度专题图。采用重心模型和偏移-分享模型识别人口分布的时空变化格局及内部差异。结果表明:1.基于DMSP/OLS最佳阈值分割法提取的居住区用地,与同期NLCD数据匹配精度达93.94%、94.90%,匹配度较高;2.灯光像元DN值与人口数量存在明显的线性回归关系,根据该模型得到的人口空间化数据,经校验能较贴合反映实际分布情况;3.2002~2012年,天山北坡城市群人口分布重心呈向乌鲁木齐市靠近的变动态势,迁移直线距离约8.15km,乌鲁木齐人口增长相对快速、呈集聚趋势,其他9市/县人口增长缓慢、呈扩散趋势。分析认为,空间化模拟的人口密度能够较为贴切地反映天山北坡城市群人口分布现状,可为今后区域人地关系研究和社会发展政策制定提供一定的依据。
Modeling the population spatial distribution of Tianshan north-slope urban agglomeration based on DMSP/OLS night lighting data .
针对城市群中小尺度资源环境研究领域对空间型人口分布数据的需求,以DMSP/OLS夜间灯光卫星数据为依据,借助土地利用/覆盖矢量数据集提取居住用地信息,采用GIS与SPSS相结合的方法,分析夜间灯光像元DN值与人口统计数据的相关性,构建天山北坡城市群2002和2012年份人口分布的空间化模型,并制作1km格网尺度的人口密度专题图。采用重心模型和偏移-分享模型识别人口分布的时空变化格局及内部差异。结果表明:1.基于DMSP/OLS最佳阈值分割法提取的居住区用地,与同期NLCD数据匹配精度达93.94%、94.90%,匹配度较高;2.灯光像元DN值与人口数量存在明显的线性回归关系,根据该模型得到的人口空间化数据,经校验能较贴合反映实际分布情况;3.2002~2012年,天山北坡城市群人口分布重心呈向乌鲁木齐市靠近的变动态势,迁移直线距离约8.15km,乌鲁木齐人口增长相对快速、呈集聚趋势,其他9市/县人口增长缓慢、呈扩散趋势。分析认为,空间化模拟的人口密度能够较为贴切地反映天山北坡城市群人口分布现状,可为今后区域人地关系研究和社会发展政策制定提供一定的依据。
|
| [13] |
基于夜间灯光数据的南京城镇用地提取 [J].https://doi.org/10.16251/j.cnki.1009-2307.2017.06.017 URL [本文引用: 1] 摘要
针对多时相夜间灯光影像无法直接对比的问题,该文提出了一种基于不变目标进行不同年份不同卫星夜间灯光数据的校正方法。在系统校正多时相夜间灯光数据的基础上,应用支持向量机分类算法提取城镇用地信息,并分析1992—2013年南京城镇扩张动态变化规律。结果表明:该数据校正方法可以有效减少年际夜间灯光影像之间的异常差异,提高不同年份数据间的连续性和可比较性;支持向量机分类算法提取的4个样区城镇用地信息总体精度和Kappa系数平均值分别为88.35%和0.56,能够准确反映区域城镇发展的实际情况;1992—2013年南京城镇经历先缓慢后快速的扩张过程,主城区在1992年城镇基础上往四周扩张,并沿长江及南北交通走廊发展。
Study on extracting urban area in Nanjing based on DMSP/OLS nighttime light data .https://doi.org/10.16251/j.cnki.1009-2307.2017.06.017 URL [本文引用: 1] 摘要
针对多时相夜间灯光影像无法直接对比的问题,该文提出了一种基于不变目标进行不同年份不同卫星夜间灯光数据的校正方法。在系统校正多时相夜间灯光数据的基础上,应用支持向量机分类算法提取城镇用地信息,并分析1992—2013年南京城镇扩张动态变化规律。结果表明:该数据校正方法可以有效减少年际夜间灯光影像之间的异常差异,提高不同年份数据间的连续性和可比较性;支持向量机分类算法提取的4个样区城镇用地信息总体精度和Kappa系数平均值分别为88.35%和0.56,能够准确反映区域城镇发展的实际情况;1992—2013年南京城镇经历先缓慢后快速的扩张过程,主城区在1992年城镇基础上往四周扩张,并沿长江及南北交通走廊发展。
|
| [14] |
基于人口普查与多源夜间灯光数据的海岸带人口空间化分析 [J].
我国海岸带区域是台风、风暴潮、地震海啸和海岸侵蚀等海洋灾害的重灾区,精细空间分辨率的人口数据,能够有效服务海岸带灾害风险管理.本文基于我国第六次人口普查资料、OLS/DMSP和NPP/VIIRS DNB两种夜间灯光数据及Landsat卫星遥感影像,综合利用遥感与地理信息系统理论与技术,进行了我国海岸带人口空间化方法与应用研究.利用建筑物与裸地增强指数法(EBBI)基于Landsat卫星遥感影像提取了我国沿海区县建成区数据,作为人口分布的空间控制因素,以普查人口数与夜间灯光数据回归函数关系为依据,对人口进行空间化处理.反演得到了我国海岸带区县1km×1km和0.5km×0.5km两个空间尺度的人口格网数据.并利用福建省沿海乡镇人口数据对人口空间化结果进行了精度评价.研究结果表明NPP/VIIRS DNB夜间灯光数据适用于人口空间化研究,且其反演精度整体优于基于DMSP/OLS传统夜间灯光数据反演的人口格网模型.通过本文实践,可以发现NPP/VIIRS DNB夜间灯光数据具有实现人口和社会经济数据空间化的巨大潜力.
Population spatial processing for Chinese coastal zones based on census and multiple night light data .
我国海岸带区域是台风、风暴潮、地震海啸和海岸侵蚀等海洋灾害的重灾区,精细空间分辨率的人口数据,能够有效服务海岸带灾害风险管理.本文基于我国第六次人口普查资料、OLS/DMSP和NPP/VIIRS DNB两种夜间灯光数据及Landsat卫星遥感影像,综合利用遥感与地理信息系统理论与技术,进行了我国海岸带人口空间化方法与应用研究.利用建筑物与裸地增强指数法(EBBI)基于Landsat卫星遥感影像提取了我国沿海区县建成区数据,作为人口分布的空间控制因素,以普查人口数与夜间灯光数据回归函数关系为依据,对人口进行空间化处理.反演得到了我国海岸带区县1km×1km和0.5km×0.5km两个空间尺度的人口格网数据.并利用福建省沿海乡镇人口数据对人口空间化结果进行了精度评价.研究结果表明NPP/VIIRS DNB夜间灯光数据适用于人口空间化研究,且其反演精度整体优于基于DMSP/OLS传统夜间灯光数据反演的人口格网模型.通过本文实践,可以发现NPP/VIIRS DNB夜间灯光数据具有实现人口和社会经济数据空间化的巨大潜力.
|
| [15] |
基于NPP/VIIIRS夜光遥感影像的作业灯光围网渔船识别 [J].https://doi.org/10.11975/j.issn.1002-6819.2017.10.032 URL [本文引用: 1] 摘要
为对远洋灯光渔船作业信息进行实时动态监测,该研究基于可见光红外辐射仪(visible infrared imaging radiometer suite,VIIRS)夜光遥感影像,根据远洋灯光渔船作业时其集鱼灯灯光在VIIRS白天/夜晚波段(day/night band,DNB)影像上的辐射特征,采用峰值中值指数(spike median index,SMI)对灯光渔船与背景像元间的辐射差异进行拉伸,在此基础上设计了基于最大熵法(maximum entropy method,Max Ent)阈值分割以及局部峰值检测(local spike detection,LSD)的作业远洋灯光渔船识别算法,并采用2015年西北太平洋公海灯光围网渔场内作业渔船船位监控系统(vessel monitoring system,VMS)数据对该算法的识别精度进行检验。验证结果显示,该文提出的作业远洋灯光渔船自动识别算法对实际作业灯光渔船的识别精度在92%以上,可以满足远洋灯光渔船日常监测的需求,可为进一步评估远洋光诱渔业捕捞努力量、推进远洋光诱渔业信息化管理以及打击非法、未申报和无管制的(illegal,unregulated,unreported,IUU)捕捞活动提供技术支持。
Identification for operating pelagic light-fishing vessels based on NPP/VIIRS low light imaging data .https://doi.org/10.11975/j.issn.1002-6819.2017.10.032 URL [本文引用: 1] 摘要
为对远洋灯光渔船作业信息进行实时动态监测,该研究基于可见光红外辐射仪(visible infrared imaging radiometer suite,VIIRS)夜光遥感影像,根据远洋灯光渔船作业时其集鱼灯灯光在VIIRS白天/夜晚波段(day/night band,DNB)影像上的辐射特征,采用峰值中值指数(spike median index,SMI)对灯光渔船与背景像元间的辐射差异进行拉伸,在此基础上设计了基于最大熵法(maximum entropy method,Max Ent)阈值分割以及局部峰值检测(local spike detection,LSD)的作业远洋灯光渔船识别算法,并采用2015年西北太平洋公海灯光围网渔场内作业渔船船位监控系统(vessel monitoring system,VMS)数据对该算法的识别精度进行检验。验证结果显示,该文提出的作业远洋灯光渔船自动识别算法对实际作业灯光渔船的识别精度在92%以上,可以满足远洋灯光渔船日常监测的需求,可为进一步评估远洋光诱渔业捕捞努力量、推进远洋光诱渔业信息化管理以及打击非法、未申报和无管制的(illegal,unregulated,unreported,IUU)捕捞活动提供技术支持。
|
| [16] |
夜间灯光数椐和MODIS数据用于大尺度不透水面制图研究 [D].Using nighttime light data and MODIS data for large-scale impervious surface mapping research . |
| [17] |
Suomi-NPP夜间灯光数据与GDP的空间关系分析 [J].
夜间灯光的遥感图像可去除大部分的自然干扰,使人类活动获得有效的反映,为社会经济空间化研究提供技术支持。该文用Suomi-NPP卫星获取的夜间灯光数据与GDP数据建立多种空间关系模型,以探索两者的空间分布规律,并对其中的影响因素进行分析。文中先对中国内地各省级行政区进行灯光信息统计,并计算各灯光指标,从而选取最佳灯光指标。实验结果表明,灯光区域的归一化总辐射指数与统计GDP的相关性更强。再以其作为灯光指标与统计GDP建立线性与非线性空间模型,最后选出较好的模型对GDP进行预测,其中线性、幂指数和Logistic曲线模型的拟合优度均达0.8以上。采用幂指数模型对2014年各行政单元的GDP进行预测,其平均相对误差为26.0%。
Spatial correlation analysis of Suomi-NPP nighttime light data and GDP data .
夜间灯光的遥感图像可去除大部分的自然干扰,使人类活动获得有效的反映,为社会经济空间化研究提供技术支持。该文用Suomi-NPP卫星获取的夜间灯光数据与GDP数据建立多种空间关系模型,以探索两者的空间分布规律,并对其中的影响因素进行分析。文中先对中国内地各省级行政区进行灯光信息统计,并计算各灯光指标,从而选取最佳灯光指标。实验结果表明,灯光区域的归一化总辐射指数与统计GDP的相关性更强。再以其作为灯光指标与统计GDP建立线性与非线性空间模型,最后选出较好的模型对GDP进行预测,其中线性、幂指数和Logistic曲线模型的拟合优度均达0.8以上。采用幂指数模型对2014年各行政单元的GDP进行预测,其平均相对误差为26.0%。
|
| [18] |
夜间灯光遥感数据的GDP空间化处理方法 [J].https://doi.org/10.3724/SP.J.1047.2012.00128 URL Magsci [本文引用: 1] 摘要
随着夜间灯光遥感数据的应用日渐成熟和资源环境研究领域,对空间型社会经济数据的需求增加,利用相关分析和回归分析的方法,首次定量探讨夜间灯光数据与统计型的社会经济数据的空间关系。为提高模型精度,按照我国省级行政边界分区建模,分析全国县级的地区生产总值、第一产业、第二产业、第三产业分别与夜间灯光指数的空间相关关系,最终建立全国的1km GDP密度图。结果表明,全国范围的夜间灯光数据与第一产业的相关性不明显,相关系数0.554,模型拟合效果差,R<sup>2</sup>为0.306;夜间灯光数据与地区生产总值、第二产业、第三产业均有明显的对数线性关系,尤其是与第二产业和第三产业之和,相关系数为0.824,R<sup>2</sup>为0.679。利用分区模型估算,生成的GDP密度图能较完整地反映全国社会经济分布详况,以及宏观分布特征。
GDP spatialization in China based on nighttime imagery .https://doi.org/10.3724/SP.J.1047.2012.00128 URL Magsci [本文引用: 1] 摘要
随着夜间灯光遥感数据的应用日渐成熟和资源环境研究领域,对空间型社会经济数据的需求增加,利用相关分析和回归分析的方法,首次定量探讨夜间灯光数据与统计型的社会经济数据的空间关系。为提高模型精度,按照我国省级行政边界分区建模,分析全国县级的地区生产总值、第一产业、第二产业、第三产业分别与夜间灯光指数的空间相关关系,最终建立全国的1km GDP密度图。结果表明,全国范围的夜间灯光数据与第一产业的相关性不明显,相关系数0.554,模型拟合效果差,R<sup>2</sup>为0.306;夜间灯光数据与地区生产总值、第二产业、第三产业均有明显的对数线性关系,尤其是与第二产业和第三产业之和,相关系数为0.824,R<sup>2</sup>为0.679。利用分区模型估算,生成的GDP密度图能较完整地反映全国社会经济分布详况,以及宏观分布特征。
|
| [19] |
基于MODIS数据的浙江省地表温度空间分布研究 [C]//Spatial distribution of land surface temperature in Zhejiang Province based on MODIS // |
| [20] |
基于夜间灯光与LUC数据的川渝地区人口空间化研究 [J].https://doi.org/10.12082/dqxxkx.2018.170224 URL [本文引用: 1] 摘要
高精度的人口空间分布数据是开展小尺度人口活动变化规律研究的关键数据.夜间遥感影像对于反映人类社会活动具有独特的能力,因而被广泛的应用于社会经济领域的空间数据挖掘.本研究以DMSP/OLS夜间灯光数据、NPP/VIIRS夜间灯光数据、常住人口统计数据、土地利用数据为数据源,在县级尺度上建立逐步回归模型,构建川渝地区人口空间分布数据;并随机抽取研究区内500个乡镇,以常住人口统计数据为真实数据,对人口空间化结果进行精度检验.结果表明:①2种夜间灯光数据与人口均有较高的相关性,相关系数均在0.76以上,NPP/VIIRS夜间灯光数据与人口的相关性要高于DMSP/OLS,且受拟合模型的影响不大.②与人口相关性较高的土地利用类型有多种,耕地、林地对人口空间分布也有影响,在建模时不应只考虑建成区.③在2种夜间灯光数据分别与土地利用与土地覆被数据(Land Use/Land Cover,LUC)结合时,使用DMSP/OLS夜间灯光数据和NPP/VIIRS夜间灯光数据得到的逐步回归模型的复相关系数R2分别为0.796、0.817,模型拟合率较高,而基于NPP/VIIRS夜间灯光数据得到的人口空间化结果分辨率(500 m)相比DMSP/OLS提高了一倍(1 km),中心城区与周边城区人口密度变化更加自然,更符合实际人口分布情况.④与LUC数据结合时,使用NPP/VIIRS夜间灯光数据得到的人口空间化结果精度要高于DMSP/OLS夜间灯光数据,表明NPP/VIIRS夜间灯光数据相比DMSP/OLS更适用于人口数据空间化研究.
Spatial distribution of population data based on nighttime light and LUC data in the Sichuan Chongqing Region .https://doi.org/10.12082/dqxxkx.2018.170224 URL [本文引用: 1] 摘要
高精度的人口空间分布数据是开展小尺度人口活动变化规律研究的关键数据.夜间遥感影像对于反映人类社会活动具有独特的能力,因而被广泛的应用于社会经济领域的空间数据挖掘.本研究以DMSP/OLS夜间灯光数据、NPP/VIIRS夜间灯光数据、常住人口统计数据、土地利用数据为数据源,在县级尺度上建立逐步回归模型,构建川渝地区人口空间分布数据;并随机抽取研究区内500个乡镇,以常住人口统计数据为真实数据,对人口空间化结果进行精度检验.结果表明:①2种夜间灯光数据与人口均有较高的相关性,相关系数均在0.76以上,NPP/VIIRS夜间灯光数据与人口的相关性要高于DMSP/OLS,且受拟合模型的影响不大.②与人口相关性较高的土地利用类型有多种,耕地、林地对人口空间分布也有影响,在建模时不应只考虑建成区.③在2种夜间灯光数据分别与土地利用与土地覆被数据(Land Use/Land Cover,LUC)结合时,使用DMSP/OLS夜间灯光数据和NPP/VIIRS夜间灯光数据得到的逐步回归模型的复相关系数R2分别为0.796、0.817,模型拟合率较高,而基于NPP/VIIRS夜间灯光数据得到的人口空间化结果分辨率(500 m)相比DMSP/OLS提高了一倍(1 km),中心城区与周边城区人口密度变化更加自然,更符合实际人口分布情况.④与LUC数据结合时,使用NPP/VIIRS夜间灯光数据得到的人口空间化结果精度要高于DMSP/OLS夜间灯光数据,表明NPP/VIIRS夜间灯光数据相比DMSP/OLS更适用于人口数据空间化研究.
|
| [21] |
基于DMSP/OLS数据的南京市建成区扩展研究 [J].https://doi.org/10.3969/j.issn.1672-4623.2018.01.028 URL [本文引用: 1] 摘要
以南京市为研究区,先利用一元二次回归模型对2000-2010年的灯光数据影像进行预处理,利用突变检测法计算各年份提取城市建成区的阈值,并基于该阈值分割南京市2000-2010年的城市建成区;然后运用最大似然法分类2000年、2005年和2010年的TM影像得到南京市建成区,并勾绘出城市建成区的范围;再对2000-2005年和2005-2010年提取的城市建成区扩展结果进行空间对比,以验证突变检测法的准确性;最后将南京市2000-2010年的城市建成区进行叠加,并结合实际分析了城市内部建成区的扩展情况。
Expansion research on the build up area in Nanjing City based on DMSP/OLS data .https://doi.org/10.3969/j.issn.1672-4623.2018.01.028 URL [本文引用: 1] 摘要
以南京市为研究区,先利用一元二次回归模型对2000-2010年的灯光数据影像进行预处理,利用突变检测法计算各年份提取城市建成区的阈值,并基于该阈值分割南京市2000-2010年的城市建成区;然后运用最大似然法分类2000年、2005年和2010年的TM影像得到南京市建成区,并勾绘出城市建成区的范围;再对2000-2005年和2005-2010年提取的城市建成区扩展结果进行空间对比,以验证突变检测法的准确性;最后将南京市2000-2010年的城市建成区进行叠加,并结合实际分析了城市内部建成区的扩展情况。
|
| [22] |
基于DMSP/OLS与土地利用的江苏省人口数据空间化研究 [J].https://doi.org/10.11870/cjlyzyyhj201505004 URL Magsci [本文引用: 1] 摘要
准确、高分辨率的人口分布信息是人地关系研究的重要前提。人口数据空间化可实现人口统计数据与空间信息集成, 重构人口空间分布特征, 为区域可持续发展研究提供数据支持。基于DMSP/OLS夜间灯光数据与土地利用数据, 以遥感与地理信息系统理论与方法为基础, 采用空间滞后回归模型模拟了江苏省2010年人口空间分布状况, 并得到1 km×1 km的人口密度网格图。通过从县级、乡镇级两种空间尺度对人口数据空间化结果进行检验, 结果表明基于DMSP/OLS与土地利用的人口数据空间化能够正确地表达人口空间分布规律, 尤其对于人口较为密集地区, 具有很高的数据重现精度;但是对于人口密度畸高或畸低的地区, 由于人口空间分布异质性较大, 数据重现的准确性下降。
Modeling the population density of Jiangsu Province based on DMSP/OLS satellite imagery and land use data .https://doi.org/10.11870/cjlyzyyhj201505004 URL Magsci [本文引用: 1] 摘要
准确、高分辨率的人口分布信息是人地关系研究的重要前提。人口数据空间化可实现人口统计数据与空间信息集成, 重构人口空间分布特征, 为区域可持续发展研究提供数据支持。基于DMSP/OLS夜间灯光数据与土地利用数据, 以遥感与地理信息系统理论与方法为基础, 采用空间滞后回归模型模拟了江苏省2010年人口空间分布状况, 并得到1 km×1 km的人口密度网格图。通过从县级、乡镇级两种空间尺度对人口数据空间化结果进行检验, 结果表明基于DMSP/OLS与土地利用的人口数据空间化能够正确地表达人口空间分布规律, 尤其对于人口较为密集地区, 具有很高的数据重现精度;但是对于人口密度畸高或畸低的地区, 由于人口空间分布异质性较大, 数据重现的准确性下降。
|
| [23] |
基于夜间灯光遥感影像和社会感知数据的人口空间化研究 [D].Spatialization of population using nighttime light remote sensing images and social sensing data . |
| [24] |
基于GDP格网的中国大陆城市DMSP/OLS稳定灯光数据饱和标定方法 [J].https://doi.org/10.3969/j.issn.1672-0504.2017.01.007 URL [本文引用: 1] 摘要
DMSP稳定灯光数据产品因其灰度级较低(6bit),通常导致数据在城市中心区域达到饱和,限制了其对城市化进程(如建成区面积)、社会经济发展(如能耗)等关键指标的宏观统计与高精度应用。该文提出一种GDP格网数据辅助去饱和方法,以2010年中国大陆地区DMSP/OLS稳定灯光数据饱和最为严重的36个城市为研究对象,基于该年的GDP格网数据对稳定灯光数据产品进行饱和标定,标定后各城市灯光总和均得到合理提升。为了验证方法的有效性,对标定前后的城市灯光总和与城市建成区面积和能源消耗量两个社会经济指标进行了相关分析,结果表明,标定后的相关系数分别从0.63和0.57提高到0.67和0.61,说明基于GDP格网数据标定方法能够提高稳定灯光数据的应用精度。
A novel method for saturation effect calibration of DMSP/OLS stable light product based on GDP grid data in China mainland at city level .https://doi.org/10.3969/j.issn.1672-0504.2017.01.007 URL [本文引用: 1] 摘要
DMSP稳定灯光数据产品因其灰度级较低(6bit),通常导致数据在城市中心区域达到饱和,限制了其对城市化进程(如建成区面积)、社会经济发展(如能耗)等关键指标的宏观统计与高精度应用。该文提出一种GDP格网数据辅助去饱和方法,以2010年中国大陆地区DMSP/OLS稳定灯光数据饱和最为严重的36个城市为研究对象,基于该年的GDP格网数据对稳定灯光数据产品进行饱和标定,标定后各城市灯光总和均得到合理提升。为了验证方法的有效性,对标定前后的城市灯光总和与城市建成区面积和能源消耗量两个社会经济指标进行了相关分析,结果表明,标定后的相关系数分别从0.63和0.57提高到0.67和0.61,说明基于GDP格网数据标定方法能够提高稳定灯光数据的应用精度。
|
| [25] |
京津唐城市群不透水地表增长格局以及水环境效应 [J].https://doi.org/10.11821/xb201111005 URL [本文引用: 1] 摘要
不透水地表(Impervious Surface Area,ISA)时空格局是城市化与全球环境变化交互影响下的土地利用/覆盖变化—生态系统过程—区域气候变化相互作用机理以及导致的环境效应研究的重要内容。如何快速准确地实现区域尺度不透水地表遥感信息的获取是上述研究面临的重要瓶颈问题。本研究嵌入中国LUCC信息改进了基于MODISNDVI与夜间灯光指数(DMSP-OLS)提取不透水地表信息的方法,反演了2000年与2008年京津唐城市群2期250m不透水地表信息,进而分析其变化的时空格局,结合子流域单元与河流污染物监测数据评价其对海河流域地表水环境的影响。结论表明:受环渤海经济区,天津滨海新区开发等政策的影响,京津唐城市群在21世纪初8年不透水地表沿着城—乡梯度带、城市交通廊道及海岸带高速增长。城乡建设用地不透水地表增长呈现显著的时空差异特征,由于北京市受人口-资源-环境的压力,产业发展不断向周边地区转移,天津与河北唐山、廊坊、秦皇岛三市具有更快的不透水地表增长速度。京津唐城市群城市高密度的不透水地表分布对于海河流域地表水环境产生严重影响,不透水地表的增长加剧了流域河流水质的污染程度。同时也发现,子流域不透水地表面积比例与COD、NH3-N浓度均值呈现显著的线性关系。
Pattern of impervious surface change and its effect on water environment in the Beijing-Tianjin-Tangshan metropolitan area .https://doi.org/10.11821/xb201111005 URL [本文引用: 1] 摘要
不透水地表(Impervious Surface Area,ISA)时空格局是城市化与全球环境变化交互影响下的土地利用/覆盖变化—生态系统过程—区域气候变化相互作用机理以及导致的环境效应研究的重要内容。如何快速准确地实现区域尺度不透水地表遥感信息的获取是上述研究面临的重要瓶颈问题。本研究嵌入中国LUCC信息改进了基于MODISNDVI与夜间灯光指数(DMSP-OLS)提取不透水地表信息的方法,反演了2000年与2008年京津唐城市群2期250m不透水地表信息,进而分析其变化的时空格局,结合子流域单元与河流污染物监测数据评价其对海河流域地表水环境的影响。结论表明:受环渤海经济区,天津滨海新区开发等政策的影响,京津唐城市群在21世纪初8年不透水地表沿着城—乡梯度带、城市交通廊道及海岸带高速增长。城乡建设用地不透水地表增长呈现显著的时空差异特征,由于北京市受人口-资源-环境的压力,产业发展不断向周边地区转移,天津与河北唐山、廊坊、秦皇岛三市具有更快的不透水地表增长速度。京津唐城市群城市高密度的不透水地表分布对于海河流域地表水环境产生严重影响,不透水地表的增长加剧了流域河流水质的污染程度。同时也发现,子流域不透水地表面积比例与COD、NH3-N浓度均值呈现显著的线性关系。
|
| [26] |
论夜光遥感数据挖掘 [J].https://doi.org/10.11947/j.AGCS.2015.20150149 URL Magsci [本文引用: 1] 摘要
<p>如果从地球上空观测夜间的地球,可以发现人类聚居区和经济带发出夺目的光芒。当夜间的天空无云时,遥感卫星能够捕捉到城镇灯光、渔船灯光、火点等可见光辐射源,这些夜间无云条件下获取的地球可见光的影像即夜光遥感影像。与日间遥感不同,夜光遥感对于反映人类社会活动具有独特的能力,因此被广泛应用于社会经济领域的空间数据挖掘。本文首先介绍能够观测夜间灯光的卫星遥感观测平台和传感器, 然后从社会经济参数估算、城市化监测与评估、重大事件评估、环境及健康效应研究、渔业信息提取、流行病研究、油气田监测等方面总结了夜光遥感数据挖掘的现状和特点。最后,文章从新型数据源、知识发现、地面观测和地理国情—世情监测4个方面提出了夜光遥感及其数据挖掘的未来发展趋势。</p>
An overview on data mining of nighttime light remote sensing .https://doi.org/10.11947/j.AGCS.2015.20150149 URL Magsci [本文引用: 1] 摘要
<p>如果从地球上空观测夜间的地球,可以发现人类聚居区和经济带发出夺目的光芒。当夜间的天空无云时,遥感卫星能够捕捉到城镇灯光、渔船灯光、火点等可见光辐射源,这些夜间无云条件下获取的地球可见光的影像即夜光遥感影像。与日间遥感不同,夜光遥感对于反映人类社会活动具有独特的能力,因此被广泛应用于社会经济领域的空间数据挖掘。本文首先介绍能够观测夜间灯光的卫星遥感观测平台和传感器, 然后从社会经济参数估算、城市化监测与评估、重大事件评估、环境及健康效应研究、渔业信息提取、流行病研究、油气田监测等方面总结了夜光遥感数据挖掘的现状和特点。最后,文章从新型数据源、知识发现、地面观测和地理国情—世情监测4个方面提出了夜光遥感及其数据挖掘的未来发展趋势。</p>
|
| [27] |
基于 NPP-VIIRS 夜间灯光数据的北京市GDP 空间化方法 [J].https://doi.org/10.6046/gtzyyg.2016.03.04 URL Magsci [本文引用: 2] 摘要
<p>为了分析像素级社会经济活动的空间分布状况,以Landsat8和NPP-VIIRS夜间灯光影像为数据源,分别对北京市第一产业和第二、三产业GDP进行空间化操作。利用分类回归树(classification and regression tree,CART)算法,通过Landsat8影像生成北京市的土地利用图,在分析第一产业GDP与土地利用类型面积相关性的基础上,构建了第一产业GDP与耕地面积的线性回归模型。建立了5种灯光指标与第二、三产业GDP的数学关系,通过相关性和回归分析确定第二、三产业GDP与综合灯光指数呈明显的幂函数关系。根据以上2种模型分别生成对应2类产业的像素级GDP密度图,再分别对其进行线性纠正并求和后制作出北京市500 m格网尺寸的GDP密度图。误差分析发现,第一产业GDP、第二、三产业GDP和GDP总量与实际统计值的平均相对误差分别为0.86%,0.61%和1.37%。结果表明,结合土地利用数据的NPP-VIIRS夜间灯光GDP空间化方法可以精确估算北京市GDP产值,反映北京市经济空间分布特征。</p>
Spatialization of GDP in Beijing using NPP/VIIRS data .https://doi.org/10.6046/gtzyyg.2016.03.04 URL Magsci [本文引用: 2] 摘要
<p>为了分析像素级社会经济活动的空间分布状况,以Landsat8和NPP-VIIRS夜间灯光影像为数据源,分别对北京市第一产业和第二、三产业GDP进行空间化操作。利用分类回归树(classification and regression tree,CART)算法,通过Landsat8影像生成北京市的土地利用图,在分析第一产业GDP与土地利用类型面积相关性的基础上,构建了第一产业GDP与耕地面积的线性回归模型。建立了5种灯光指标与第二、三产业GDP的数学关系,通过相关性和回归分析确定第二、三产业GDP与综合灯光指数呈明显的幂函数关系。根据以上2种模型分别生成对应2类产业的像素级GDP密度图,再分别对其进行线性纠正并求和后制作出北京市500 m格网尺寸的GDP密度图。误差分析发现,第一产业GDP、第二、三产业GDP和GDP总量与实际统计值的平均相对误差分别为0.86%,0.61%和1.37%。结果表明,结合土地利用数据的NPP-VIIRS夜间灯光GDP空间化方法可以精确估算北京市GDP产值,反映北京市经济空间分布特征。</p>
|
| [28] |
基于NPP-VIIRS夜间灯光数据的河北省GDP空间化方法 [J].https://doi.org/10.3969/j.issn.1003-0972.2016.01.036 URL [本文引用: 1] 摘要
为了研究省域尺度上像素级GDP空间化的方法,基于NPP-VIIRS夜间灯光数据,首先去除孤立极亮像元和背景噪声,将夜间灯光总强度、线性加权灯光指数和综合灯光指数分别与河北省11地市内的各区县GDP进行相关性分析,得知夜间灯光总强度与地市内各区县GDP相关性最显著,根据每个地市中最高相关系数对应的回归模型计算每个像素对应的GDP,经过线性纠正后,生成河北省GDP密度图.结果表明,全省172个区县的平均GDP相对误差为0.10%.该方法精度较高,生成的GDP密度图可以反映河北省经济发展的现状.
An approach of GDP spatialization in Hebei Province using NPP/VIIRS nighttime light data .https://doi.org/10.3969/j.issn.1003-0972.2016.01.036 URL [本文引用: 1] 摘要
为了研究省域尺度上像素级GDP空间化的方法,基于NPP-VIIRS夜间灯光数据,首先去除孤立极亮像元和背景噪声,将夜间灯光总强度、线性加权灯光指数和综合灯光指数分别与河北省11地市内的各区县GDP进行相关性分析,得知夜间灯光总强度与地市内各区县GDP相关性最显著,根据每个地市中最高相关系数对应的回归模型计算每个像素对应的GDP,经过线性纠正后,生成河北省GDP密度图.结果表明,全省172个区县的平均GDP相对误差为0.10%.该方法精度较高,生成的GDP密度图可以反映河北省经济发展的现状.
|
| [29] |
GIS支持下的浙江省台风灾害直接经济损失评估 [D].GIS assisted on assessment of direct economic losses from typhoon in Zhejiang Province . |
| [30] |
基于DMSP/OLS数据的中国电力消耗量估算及时空动态研究 [D].Estimate and spatiotemporal dynamics of electricity consumption in China based on DMSP/OLS . |
| [31] |
基于VIIRS数据的油气平台提取技术研究 [J].https://doi.org/10.3724/SP.J.1047.2017.00398 URL [本文引用: 1] 摘要
油气平台作为海上油气资源勘探开发的主要设备之一,其数量与空间分布反映了一个区域油气资源的开发状况。普通光学影像易受天气状况影响,而雷达数据成本较高,这给油气平台的检测带来了一定的困难。由于油气平台作业过程中,需要灯光照明,同时伴气的燃烧也产生很强的灯光,因此可以通过检测灯光来实现油气平台的提取。针对VIIRS数据具有强夜间光探测能力,本文提出了一种卷积运算临界值法对海上油气平台进行提取。首先对2期不同时相的VIIRS数据进行卷积运算,对亮像元进行了增强处理,对背景像元进行弱化处理,从而明确区分疑似目标与背景,然后以0值为分界点,对疑似目标进行提取,最后利用油气平台相对静止的特性,通过邻域分析,实现油气平台的提取。结果表明,本文提出的卷积运算临界值法可以有效地提取油气平台,提取准确率约为85.4%,同时可以有效地减少由于经验阈值对提取结果造成的误差。
Research on oil and gas platform extraction technology based on VIIRS data .https://doi.org/10.3724/SP.J.1047.2017.00398 URL [本文引用: 1] 摘要
油气平台作为海上油气资源勘探开发的主要设备之一,其数量与空间分布反映了一个区域油气资源的开发状况。普通光学影像易受天气状况影响,而雷达数据成本较高,这给油气平台的检测带来了一定的困难。由于油气平台作业过程中,需要灯光照明,同时伴气的燃烧也产生很强的灯光,因此可以通过检测灯光来实现油气平台的提取。针对VIIRS数据具有强夜间光探测能力,本文提出了一种卷积运算临界值法对海上油气平台进行提取。首先对2期不同时相的VIIRS数据进行卷积运算,对亮像元进行了增强处理,对背景像元进行弱化处理,从而明确区分疑似目标与背景,然后以0值为分界点,对疑似目标进行提取,最后利用油气平台相对静止的特性,通过邻域分析,实现油气平台的提取。结果表明,本文提出的卷积运算临界值法可以有效地提取油气平台,提取准确率约为85.4%,同时可以有效地减少由于经验阈值对提取结果造成的误差。
|
| [32] |
夜间灯光数据反演大气细颗粒物浓度方法研究 [D]. 北京:Study on the methodology of using nighttime light data to retrieve atmospheric fine particle's concentration . |
| [33] |
1995-2008年中国大陆电力消费量时空动态 [J].https://doi.org/10.3724/SP.J.1011.2011.00415 URL [本文引用: 1] 摘要
电力消费量是定量衡量电力消费状况的一个基本指标。及时、准确地获取电力消费量的时空动态信息,对于合理配置中国电力资源具有重要的理论和现实意义。利用DMSP/OLS稳定夜间灯光时间序列数据,在县级尺度上模拟重建了中国大陆1995-2008年电力消费的空间格能够局比,较揭可示靠了地中反国映大中陆国同大期陆电力19消95费-20量08的年时电空力动消态费过量程的。时结空果动表态明,:精①度利达用到D70M%S左P/O右L,S数具据有显一定,的占可全行国性总。面②积1中0.国69大%陆的京19津95唐-20、08沪年宁电杭力、消珠费三量角以、中山低东消半费岛级、别辽为中主南,地但区空、间四分川布盆差地异等明大六陆大城19市95群-20地08区年是电中力国消电费力量消表费现最出为比集较中明的显区的域增,长共趋消势耗,了电中力国消3费9.2量3%呈的明电显力增资长源趋。势③的中区国域面积占全国总面积的64.00%。
Understanding electricity consumption changes in Chinese mainland from 1995 to 2008 by using DMSP/OLS stable nighttime light time series data .https://doi.org/10.3724/SP.J.1011.2011.00415 URL [本文引用: 1] 摘要
电力消费量是定量衡量电力消费状况的一个基本指标。及时、准确地获取电力消费量的时空动态信息,对于合理配置中国电力资源具有重要的理论和现实意义。利用DMSP/OLS稳定夜间灯光时间序列数据,在县级尺度上模拟重建了中国大陆1995-2008年电力消费的空间格能够局比,较揭可示靠了地中反国映大中陆国同大期陆电力19消95费-20量08的年时电空力动消态费过量程的。时结空果动表态明,:精①度利达用到D70M%S左P/O右L,S数具据有显一定,的占可全行国性总。面②积1中0.国69大%陆的京19津95唐-20、08沪年宁电杭力、消珠费三量角以、中山低东消半费岛级、别辽为中主南,地但区空、间四分川布盆差地异等明大六陆大城19市95群-20地08区年是电中力国消电费力量消表费现最出为比集较中明的显区的域增,长共趋消势耗,了电中力国消3费9.2量3%呈的明电显力增资长源趋。势③的中区国域面积占全国总面积的64.00%。
|
| [34] |
结合VIIRS和监测数据插值的北京雾霾监测方法 [J].https://doi.org/10.11947/j.AGCS.2015.F022 URL [本文引用: 1] 摘要
本文使用2014-03-20至2014-03-26的北京市VIIRS夜间灯光影像数据和地面监测站PM2.5质量浓度数据,通过遥感图像处理和GIS空间分析相结合,对雾霾强度变化及PM2.5质量浓度空间分布进行分析,提出一种监测雾霾的新方法。结果表明,VIIRS夜间灯光影像成像特征与雾霾浓度变化密切相关,结合同时期地面监测站PM2.5监测数据,能定性反映北京市雾霾强度变化及定量反映PM2.5质量浓度的空间分布。该方法不仅弥补了MODIS等数据在夏季的雾霾监测效果优于冬季的不足,同时也填补了传统光学遥感卫星难以在夜间监测雾霾的空白。
A haze monitoring method combined VIIRS images with real-time observation data interpolation in Beijing .https://doi.org/10.11947/j.AGCS.2015.F022 URL [本文引用: 1] 摘要
本文使用2014-03-20至2014-03-26的北京市VIIRS夜间灯光影像数据和地面监测站PM2.5质量浓度数据,通过遥感图像处理和GIS空间分析相结合,对雾霾强度变化及PM2.5质量浓度空间分布进行分析,提出一种监测雾霾的新方法。结果表明,VIIRS夜间灯光影像成像特征与雾霾浓度变化密切相关,结合同时期地面监测站PM2.5监测数据,能定性反映北京市雾霾强度变化及定量反映PM2.5质量浓度的空间分布。该方法不仅弥补了MODIS等数据在夏季的雾霾监测效果优于冬季的不足,同时也填补了传统光学遥感卫星难以在夜间监测雾霾的空白。
|
| [35] |
数据和空间回归模型的城市常住人口格网化方法研究 [J].https://doi.org/10.3724/SP.J.1047.2017.01298 URL [本文引用: 2] 摘要
精确掌握常住人口的数量和分布特征有助于明确社会发展情况、提高人口管理能力。目前人口数据主要以行政区为单元统计,难以表现城市内部的人口分布特征。然而,在城市中,受道路、公共服务设施、城市亮化灯光的影响,利用夜间灯光数据对人口回归,精度降低。如何提高城市常住人口回归结果的精度,值得深入研究。上海是中国的国家中心城市之一,在快速城镇化进程中上海面临巨大人口压力。因此,本文以上海市为研究区,以NPP-VIIRS(National Polar-orbiting Partnership Visible Infrared Imaging Radiometer Suite)夜间灯光数据、乡镇级常住人口统计数据为基础,提取商业和居住区的灯光数据来缓解交通、城市亮化区的影响,提高灯光累计值与常住人口数的相关性(相关系数从0.7032提高至0.8026)。然后,本文用空间回归模型对上海市2013年常住人口进行回归,相对误差为10.57%,并对回归结果进行分乡(镇、街道)修正。实验结果表明,使用空间回归模型对常住人口回归可以取得较高的精度,且格网化结果能够弥补传统统计数据空间分辨率低的缺点,更加详细地刻画常住人口的圈层特征与真实分布情况。
Gridding methods of city permanent population based on night light data and spatial regression models .https://doi.org/10.3724/SP.J.1047.2017.01298 URL [本文引用: 2] 摘要
精确掌握常住人口的数量和分布特征有助于明确社会发展情况、提高人口管理能力。目前人口数据主要以行政区为单元统计,难以表现城市内部的人口分布特征。然而,在城市中,受道路、公共服务设施、城市亮化灯光的影响,利用夜间灯光数据对人口回归,精度降低。如何提高城市常住人口回归结果的精度,值得深入研究。上海是中国的国家中心城市之一,在快速城镇化进程中上海面临巨大人口压力。因此,本文以上海市为研究区,以NPP-VIIRS(National Polar-orbiting Partnership Visible Infrared Imaging Radiometer Suite)夜间灯光数据、乡镇级常住人口统计数据为基础,提取商业和居住区的灯光数据来缓解交通、城市亮化区的影响,提高灯光累计值与常住人口数的相关性(相关系数从0.7032提高至0.8026)。然后,本文用空间回归模型对上海市2013年常住人口进行回归,相对误差为10.57%,并对回归结果进行分乡(镇、街道)修正。实验结果表明,使用空间回归模型对常住人口回归可以取得较高的精度,且格网化结果能够弥补传统统计数据空间分辨率低的缺点,更加详细地刻画常住人口的圈层特征与真实分布情况。
|
| [36] |
基于夜间灯光数据的连片特困区GDP估算及其空间化 [J].https://doi.org/10.6046/gtzyyg.2016.02.26 URL Magsci [本文引用: 1] 摘要
<p>国内生产总值(gross domestic product,GDP)能反映一个国家或地区的经济发展状况,构建高精度的特困区GDP空间数据库对扶贫工作的开展具有重要意义。首先通过建立DMSP/OLS夜间灯光数据与连片特困区GDP的回归模型,实现利用夜间灯光数据估算特困区GDP; 然后分别对第一和第二、三产业GDP进行空间化建模: 第一产业GDP与土地利用数据相结合建模,第二、三产业GDP与夜间灯光数据相结合建模。研究结果表明,大部分特困区GDP的估算结果较为准确,县级尺度的估算精度达到87.38%; 连片特困区多为GDP低密度区,GDP基本处于50万元/km<sup>2</sup>以下,西北地区甚至出现大片低于5万元/km<sup>2</sup>。因此,高精度的连片特困区GDP密度分布图能够准确地反映特困区经济分布状况,为扶贫工作的开展提供数据支持。</p>
Simulation and spatialization of GDP in poverty areas based on night light imagery .https://doi.org/10.6046/gtzyyg.2016.02.26 URL Magsci [本文引用: 1] 摘要
<p>国内生产总值(gross domestic product,GDP)能反映一个国家或地区的经济发展状况,构建高精度的特困区GDP空间数据库对扶贫工作的开展具有重要意义。首先通过建立DMSP/OLS夜间灯光数据与连片特困区GDP的回归模型,实现利用夜间灯光数据估算特困区GDP; 然后分别对第一和第二、三产业GDP进行空间化建模: 第一产业GDP与土地利用数据相结合建模,第二、三产业GDP与夜间灯光数据相结合建模。研究结果表明,大部分特困区GDP的估算结果较为准确,县级尺度的估算精度达到87.38%; 连片特困区多为GDP低密度区,GDP基本处于50万元/km<sup>2</sup>以下,西北地区甚至出现大片低于5万元/km<sup>2</sup>。因此,高精度的连片特困区GDP密度分布图能够准确地反映特困区经济分布状况,为扶贫工作的开展提供数据支持。</p>
|
| [37] |
基于LUCC和夜间灯光辐射数据的张掖市甘州区人口空间分布建模 [J].
尽管近年来统计数据的生成技术有了很大提高, 但可用的详细人口数据始终难以得到满足.在一些自然-人文要素耦合的建模研究中, 如生态经济集成建模、 环境和健康分析等都需要基于区域尺度的栅格人口分布建模方法.随着GIS和RS技术的发展, 上述建模方法已有较大进步.利用GIS技术, 基于夜间灯光辐射数据和LUCC在象元栅格水平上构建张掖市甘州区人口空间分布. 首先对DMSP夜间灯光辐射数据进行重采样, 通过普通克里金插值获得灯光数据; 然后与LUCC叠加分析, 利用回归分析的方法获取研究区土地利用、 灯光辐射指标和人口统计数据之间的定量关系, 完成空间化.并在乡镇尺度上进行模型检验, 模型总体的调整<i>R</i><sup>2</sup>为0.88, 标准误差为400, 为下一步开展时空变化分析提供支持.
Modeling the spatial distribution of population based on night light radiation and LUCC: A case study in Ganzhou District, Zhangye Municipality .
尽管近年来统计数据的生成技术有了很大提高, 但可用的详细人口数据始终难以得到满足.在一些自然-人文要素耦合的建模研究中, 如生态经济集成建模、 环境和健康分析等都需要基于区域尺度的栅格人口分布建模方法.随着GIS和RS技术的发展, 上述建模方法已有较大进步.利用GIS技术, 基于夜间灯光辐射数据和LUCC在象元栅格水平上构建张掖市甘州区人口空间分布. 首先对DMSP夜间灯光辐射数据进行重采样, 通过普通克里金插值获得灯光数据; 然后与LUCC叠加分析, 利用回归分析的方法获取研究区土地利用、 灯光辐射指标和人口统计数据之间的定量关系, 完成空间化.并在乡镇尺度上进行模型检验, 模型总体的调整<i>R</i><sup>2</sup>为0.88, 标准误差为400, 为下一步开展时空变化分析提供支持.
|
| [38] |
基于夜间灯光辐射数据的张掖市甘州区GDP空间分布建模 [J].https://doi.org/10.7522/j.issn.1000-0240.2013.0030 URL Magsci [本文引用: 1] 摘要
<p>尽管近年来统计数据的生成技术有了很大提高, 但可用的详细GDP空间分布数据始终难以得到满足. 以夜间灯光辐射数据、 官方统计数据和已有空间化人口分布数据构建了一种GDP空间化建模方法, 得到张掖市甘州区2000年的GDP空间分布. 首先, 分析基于乡镇单元的GDP与对应的夜间灯光辐射数据DN值之间的关系, 得到GDP模拟模型; 然后结合人口空间分布数据和三次产业的比例, 得到基于500 m×500 m栅格的GDP空间分布图. 各乡镇的GDP平均值为372×10<sup>4</sup>元, 标准差为34×10<sup>4</sup>元.</p>
Modeling the spatial distribution of GDP based on night light radiation: A case study in Ganzhou, Zhangye Municipality .https://doi.org/10.7522/j.issn.1000-0240.2013.0030 URL Magsci [本文引用: 1] 摘要
<p>尽管近年来统计数据的生成技术有了很大提高, 但可用的详细GDP空间分布数据始终难以得到满足. 以夜间灯光辐射数据、 官方统计数据和已有空间化人口分布数据构建了一种GDP空间化建模方法, 得到张掖市甘州区2000年的GDP空间分布. 首先, 分析基于乡镇单元的GDP与对应的夜间灯光辐射数据DN值之间的关系, 得到GDP模拟模型; 然后结合人口空间分布数据和三次产业的比例, 得到基于500 m×500 m栅格的GDP空间分布图. 各乡镇的GDP平均值为372×10<sup>4</sup>元, 标准差为34×10<sup>4</sup>元.</p>
|
| [39] |
DMSP/OLS夜间灯光数据在城镇体系空间格局研究中的应用与评价: 以近16年江西省间城镇空间格局为例 [J].
<p>通过分析1994~2009年16 a逐年DMSP/OLS的静态平均灯光数据的DN值分布情况,考虑实际空间格局分布数据需求和数据质量,选择1994、2000、2005、2009年4个年度为代表,进行江西省城镇空间格局分布应用研究,并对数据质量进行评价。结果表明:1994~2009年度江西省城镇建设用地总量数值尽管与统计数据之间存在一定的波动,但总体扩展趋势基本一致;在城镇化增长速度上,2000~2005年比1994~2000年大29.53%,2005~2009年比1994~2000年大4357%,说明江西省城镇化发展正逐步提速,并有加快发展的趋势;景观指数分析表明江西省城镇化扩张过程中,面积越来越大,城镇间聚集度越来越高,相互影响也越来越大;城镇化形状越来越复杂;城镇间联系越来越紧密,破碎度逐步减小,城镇斑块形状变化逐步加大,发展无序程度加重。最后,针对江西省城镇空间格局发展现状,研究提出了积极发展中型城市、集约化发展特大城市、稳步扩大小城镇发展规模的建议</p>
Assessment and application of DMSP/OLS nighttime light data in the spatial structure of urban system: A case of Jiangxi Province in nearly 16 years .
<p>通过分析1994~2009年16 a逐年DMSP/OLS的静态平均灯光数据的DN值分布情况,考虑实际空间格局分布数据需求和数据质量,选择1994、2000、2005、2009年4个年度为代表,进行江西省城镇空间格局分布应用研究,并对数据质量进行评价。结果表明:1994~2009年度江西省城镇建设用地总量数值尽管与统计数据之间存在一定的波动,但总体扩展趋势基本一致;在城镇化增长速度上,2000~2005年比1994~2000年大29.53%,2005~2009年比1994~2000年大4357%,说明江西省城镇化发展正逐步提速,并有加快发展的趋势;景观指数分析表明江西省城镇化扩张过程中,面积越来越大,城镇间聚集度越来越高,相互影响也越来越大;城镇化形状越来越复杂;城镇间联系越来越紧密,破碎度逐步减小,城镇斑块形状变化逐步加大,发展无序程度加重。最后,针对江西省城镇空间格局发展现状,研究提出了积极发展中型城市、集约化发展特大城市、稳步扩大小城镇发展规模的建议</p>
|
| [40] |
引入一种新型震害快速评估基础数据的尝试: DMSP/OLS卫星夜光数据的使用 [J].https://doi.org/10.3969/j.issn.1673-8047.2012.03.014 URL [本文引用: 2] 摘要
本文尝试性使用美国军事气象DMSP卫星20年来的夜光数据,并利用前人在夜光数据与中国人口统计分布的关系模型以及基于人员死亡率表示的地震生命易损性模型,分析国内外1990年来有影响的4次7级以上强地震的人员死亡情况.通过对正式公布的烈度图矢量化与通过DMSP/OLS夜光数据换算出的人口密度分布的空间相互覆盖情况,计算得出4次强地震理论计算的结果和实际人员死亡统计结果在一个数量级的误差范围内具有可信度。其中土耳其IZMIT市地震、中国台湾集集地震的计算结果比较吻合,而汶川地震与海地地震理论计算的结果比实际的偏小,这可能与汶川地震高烈度区地震地质灾害异常严重以及海地太子港地区缺乏抗震设防,房屋抗震性能薄弱有关。
A try to import a new basic data for fast evaluation of earthquake hazards: Utilizing the DMSP/OLS satellite nighttime light data .https://doi.org/10.3969/j.issn.1673-8047.2012.03.014 URL [本文引用: 2] 摘要
本文尝试性使用美国军事气象DMSP卫星20年来的夜光数据,并利用前人在夜光数据与中国人口统计分布的关系模型以及基于人员死亡率表示的地震生命易损性模型,分析国内外1990年来有影响的4次7级以上强地震的人员死亡情况.通过对正式公布的烈度图矢量化与通过DMSP/OLS夜光数据换算出的人口密度分布的空间相互覆盖情况,计算得出4次强地震理论计算的结果和实际人员死亡统计结果在一个数量级的误差范围内具有可信度。其中土耳其IZMIT市地震、中国台湾集集地震的计算结果比较吻合,而汶川地震与海地地震理论计算的结果比实际的偏小,这可能与汶川地震高烈度区地震地质灾害异常严重以及海地太子港地区缺乏抗震设防,房屋抗震性能薄弱有关。
|
| [41] |
中国区域碳排放研究 [J].https://doi.org/10.3975/cagsb.2010.05.17 URL [本文引用: 1] 摘要
通过比较不同机构和学者对中国区域碳排放的测算结果,指出现有测算结果间存在巨大差异的具体原因,按照更加科学准确的方法重新测算了中国各省及中部、东部、西部等主要区域的能源和水泥的碳排放量,以此为基础,通过对比分析,对1990至2008年间不同区域碳排放总量、人均排放量、碳排放强度等重要指标的差异进行了系统分析。研究表明:中国的区域碳排放格局是东部地区排放总量和累计排放量最大,但西部地区排放总量及占全国的份额有逐步增加的趋势;着重指出西部地区作为中国下一轮经济发展最重要的增长点,其目前的人均碳排放量和碳排放强度均高于相同发展阶段的其他地区,如不尽快转变其发展模式,则会使未来的节能减排形势异常严峻,中国的低碳经济之路仍旧任重而道远。
Research on regional carbon emissions in China .https://doi.org/10.3975/cagsb.2010.05.17 URL [本文引用: 1] 摘要
通过比较不同机构和学者对中国区域碳排放的测算结果,指出现有测算结果间存在巨大差异的具体原因,按照更加科学准确的方法重新测算了中国各省及中部、东部、西部等主要区域的能源和水泥的碳排放量,以此为基础,通过对比分析,对1990至2008年间不同区域碳排放总量、人均排放量、碳排放强度等重要指标的差异进行了系统分析。研究表明:中国的区域碳排放格局是东部地区排放总量和累计排放量最大,但西部地区排放总量及占全国的份额有逐步增加的趋势;着重指出西部地区作为中国下一轮经济发展最重要的增长点,其目前的人均碳排放量和碳排放强度均高于相同发展阶段的其他地区,如不尽快转变其发展模式,则会使未来的节能减排形势异常严峻,中国的低碳经济之路仍旧任重而道远。
|
| [42] |
基于夜间灯光数据和多地理因子数据的人口空间化方法: 以辽宁省为例 [J].https://doi.org/10.16360/j.cnki.jbnuns.2015.s1.009 URL [本文引用: 2] 摘要
人口空间分布数据是开展灾害风险管理的基础数据,而科学、准确的人口空间化方法是实现人口空间分配的重要途径.鉴于城镇与乡村居住地在灯光数据和自然条件影响程度上的差异,本文提出一种综合利用夜间灯光数据和多地理因子数据的人口空间化方法,并以辽宁省2010年人口数据空间化为例进行方法验证.研究表明:1)夜间灯光数据在灯光值较高的城镇地区与人口密度关系显著,而地理因子加权的方法则更适用于受自然条件约束多的乡村区域;2)辽宁省人口密度在065 572人·km-2之间,在空间上,中部平原地区人口密度较高,而两侧山地地区人口密度相对较低,与实际情况相符;3)辽宁省抽样乡镇人口平均误差为15.3%,精度验证结果表明,本文提出的人口空间化方法能够在乡镇尺度上具有较高的精度.
A population spatialization method based on DMSP/OLS nighttime light data and weight multi-geographic factors: The example of Liaoning Province .https://doi.org/10.16360/j.cnki.jbnuns.2015.s1.009 URL [本文引用: 2] 摘要
人口空间分布数据是开展灾害风险管理的基础数据,而科学、准确的人口空间化方法是实现人口空间分配的重要途径.鉴于城镇与乡村居住地在灯光数据和自然条件影响程度上的差异,本文提出一种综合利用夜间灯光数据和多地理因子数据的人口空间化方法,并以辽宁省2010年人口数据空间化为例进行方法验证.研究表明:1)夜间灯光数据在灯光值较高的城镇地区与人口密度关系显著,而地理因子加权的方法则更适用于受自然条件约束多的乡村区域;2)辽宁省人口密度在065 572人·km-2之间,在空间上,中部平原地区人口密度较高,而两侧山地地区人口密度相对较低,与实际情况相符;3)辽宁省抽样乡镇人口平均误差为15.3%,精度验证结果表明,本文提出的人口空间化方法能够在乡镇尺度上具有较高的精度.
|
| [43] |
基于夜间灯光影像的中国电力消耗量估算及时空动态 [J].https://doi.org/10.11821/dlyj201604003 URL [本文引用: 1] 摘要
提出夜间灯光降饱和指数模型,以中国大陆为研究对象,基于DMSP/OLS夜间灯光数据、MODIS NDVI产品、基础地理信息数据及社会经济统计数据,构建电力消耗估算模型,定量估算了2000-2012年电力消耗量,并采用空间统计分析方法,从不同时间、空间角度对省级、地级和县级单元的电力消耗量变化趋势和空间集聚程度进行分析.结果表明:夜间灯光降饱和指数模型能较好地降低夜间灯光的数据饱和和溢出,其中MDNVI模型的效果最好.从县级尺度电力消耗变化趋势的显著性来看,无明显变化区域主要出现在青藏高原,迅猛增长型多数分布在京津冀、长三角、珠三角和中东部省会城市.
Estimate and spatio-temporal dynamics of electricity consumption in China based on DMSP/OLS images .https://doi.org/10.11821/dlyj201604003 URL [本文引用: 1] 摘要
提出夜间灯光降饱和指数模型,以中国大陆为研究对象,基于DMSP/OLS夜间灯光数据、MODIS NDVI产品、基础地理信息数据及社会经济统计数据,构建电力消耗估算模型,定量估算了2000-2012年电力消耗量,并采用空间统计分析方法,从不同时间、空间角度对省级、地级和县级单元的电力消耗量变化趋势和空间集聚程度进行分析.结果表明:夜间灯光降饱和指数模型能较好地降低夜间灯光的数据饱和和溢出,其中MDNVI模型的效果最好.从县级尺度电力消耗变化趋势的显著性来看,无明显变化区域主要出现在青藏高原,迅猛增长型多数分布在京津冀、长三角、珠三角和中东部省会城市.
|
| [44] |
基于夜间灯光数据的城市建成区提取方法评价与应用 [J].
<p>DMSP/OLS夜间灯光数据已被广泛应用于城市建成区的提取。目前主要存在4类提取方法:经验阈值法、突变检测法、统计数据法和较高分辨率影像数据空间比较法。以上海为例,在2000年、2003年、2006年夜间灯光数据的基础上,利用4种方法完成了城市建成区的提取。通过对不同年份数据提取结果的比较,证明了相同的灰度分割阈值对不同年份的夜间灯光数据中不存在通用性;在对2003年夜间灯光数据的提取中,4类方法所得结果精确度从高到低依次为统计数据法、突变检测法、经验阈值法和较高分辨率影像数据空间比较法,相对误差分别为1.3%、2.1%、5.1%和11.2%,在对4种方法的便捷性和可实现性进行分析与评价后,使用突变检测法完成了上海市2000~2006年城市建成区的提取。</p>
Method for deriving urban built-up area using night-light data: Assessment and application .
<p>DMSP/OLS夜间灯光数据已被广泛应用于城市建成区的提取。目前主要存在4类提取方法:经验阈值法、突变检测法、统计数据法和较高分辨率影像数据空间比较法。以上海为例,在2000年、2003年、2006年夜间灯光数据的基础上,利用4种方法完成了城市建成区的提取。通过对不同年份数据提取结果的比较,证明了相同的灰度分割阈值对不同年份的夜间灯光数据中不存在通用性;在对2003年夜间灯光数据的提取中,4类方法所得结果精确度从高到低依次为统计数据法、突变检测法、经验阈值法和较高分辨率影像数据空间比较法,相对误差分别为1.3%、2.1%、5.1%和11.2%,在对4种方法的便捷性和可实现性进行分析与评价后,使用突变检测法完成了上海市2000~2006年城市建成区的提取。</p>
|
| [45] |
基于DMSP/OLS夜间灯光数据的中国能源消费碳排放研究 [D].Study on the carbon emissions from energy consumption in China using DMSP/OLS night light imageries . |
| [46] |
基于夜间灯光数据的中国能源消费碳排放特征及机理 [J].https://doi.org/10.11821/dlxb201311007 URL [本文引用: 2] 摘要
本研究基于DMSP/OLS夜间灯光影像实现了1992-2010年以市级为基础单元的我国碳排放估算,弥补了统计数据不全、统计口径不一的缺点。从全国、4个经济区和6大城市群3个层面的碳排放分析结果显示,我国CO2排放总量持续增长,各地区、省市增速各不相同,空间聚集程度越来越明显,基本形成了"东部沿海城市高高集聚,西部欠发达城市低低集聚"的格局。人均碳排放强度基本呈现为"东部东北部西部中部",单位GDP碳排放强度则呈现为"东北部和西部较高"、"东部和中部较低"。GDP增长是决定CO2排放总量增长的主导因素,而能源结构、能源利用效率、产业结构是影响碳排放强度的主要原因。对于西部和东北部等以能源和重工业为主导产业的城市,其减排策略应着重能源结构优化和能源利用效率的提高。对于东部和中部等以技术、劳动密集型和轻工业为主导产业的城市,其减排策略应侧重于产业结构调整和转型升级。
The characteristics and mechanisms of carbon emissions from energy consumption in China using DMSP/OLS night light imageries .https://doi.org/10.11821/dlxb201311007 URL [本文引用: 2] 摘要
本研究基于DMSP/OLS夜间灯光影像实现了1992-2010年以市级为基础单元的我国碳排放估算,弥补了统计数据不全、统计口径不一的缺点。从全国、4个经济区和6大城市群3个层面的碳排放分析结果显示,我国CO2排放总量持续增长,各地区、省市增速各不相同,空间聚集程度越来越明显,基本形成了"东部沿海城市高高集聚,西部欠发达城市低低集聚"的格局。人均碳排放强度基本呈现为"东部东北部西部中部",单位GDP碳排放强度则呈现为"东北部和西部较高"、"东部和中部较低"。GDP增长是决定CO2排放总量增长的主导因素,而能源结构、能源利用效率、产业结构是影响碳排放强度的主要原因。对于西部和东北部等以能源和重工业为主导产业的城市,其减排策略应着重能源结构优化和能源利用效率的提高。对于东部和中部等以技术、劳动密集型和轻工业为主导产业的城市,其减排策略应侧重于产业结构调整和转型升级。
|
| [47] |
基于NPP-VIIRS夜间灯光数据和Landsat-8数据的城镇建筑用地提取方法改进:以广州市为例 [J].https://doi.org/10.3969/j.issn.1672-5867.2017.09.016 URL [本文引用: 2] 摘要
以广州市为例,将Landsat-8-OLS数据与NPP-VIIRS夜间灯光数据相结合提取城镇建筑用地,在常规的NDBI指数、ULI指数方法的基础上进行改进,以获得更加精确的城镇建筑用地信息.首先,利用NPP-VIIRS夜间灯光数据得到城镇建筑用地的大致分布范围,基于Landsat-8-OLS数据提取NDBI、NDVI指数;然后通过分析夜间灯光建筑用地范围、NDVI指数,NDBI指数三者的特性,分别对三者图像进行二值化、求交运算来提取城镇建筑用地;最后将提取结果与传统的NDBI指数、ULI指数方法的提取结果进行对比,利用Google Earth高空间分辨率影像数据进行精度验证.结果表明,结合NPP-VIIRS数据和Landsat-8-OLS数据的多指数提取相交运算,可有效剔除提取结果中包含的裸土信息,与NDBI等指数方法相比,能得到更高的精度.
Improvement of urban construction land extraction method based on NPP/VIIRS nighttime light data and Landsat-8 data: A case study of Guangzhou City .https://doi.org/10.3969/j.issn.1672-5867.2017.09.016 URL [本文引用: 2] 摘要
以广州市为例,将Landsat-8-OLS数据与NPP-VIIRS夜间灯光数据相结合提取城镇建筑用地,在常规的NDBI指数、ULI指数方法的基础上进行改进,以获得更加精确的城镇建筑用地信息.首先,利用NPP-VIIRS夜间灯光数据得到城镇建筑用地的大致分布范围,基于Landsat-8-OLS数据提取NDBI、NDVI指数;然后通过分析夜间灯光建筑用地范围、NDVI指数,NDBI指数三者的特性,分别对三者图像进行二值化、求交运算来提取城镇建筑用地;最后将提取结果与传统的NDBI指数、ULI指数方法的提取结果进行对比,利用Google Earth高空间分辨率影像数据进行精度验证.结果表明,结合NPP-VIIRS数据和Landsat-8-OLS数据的多指数提取相交运算,可有效剔除提取结果中包含的裸土信息,与NDBI等指数方法相比,能得到更高的精度.
|
| [48] |
基于对数变换的NPP-VIIRS夜间灯光遥感影像在城市建成区提取中的应用 [D].Urban built-up area extraction from logarithm transformed NPP/VIIRS nighttime light composite data . |
| [49] |
不透水面遥感提取及应用研究进展 [J].https://doi.org/10.11867/j.issn.1001-8166.2013.03.0327 URL Magsci [本文引用: 1] 摘要
<p>不透水面信息的提取方法与应用是近年来城市规划、热岛效应分析、水环境监测和水资源管理等诸多领域的研究热点。遥感技术的发展使不透水面快速准确提取成为可能。从影像特征(光谱、空间几何、时间)选择、分类器(参数、非参数)选择和空间尺度(像元、亚像元尺度)选择3个方面归纳和总结了各种不透水面遥感提取方法原理、应用现状和存在问题,回顾了不透水面在城市化监测、人口估计、水环境监测、热岛效应分析、水文气候建模分析等领域的应用,指出了不透水面遥感提取和应用的发展方向。</p>
Advances in remote sensing of impervious surfaces extraction and its application .https://doi.org/10.11867/j.issn.1001-8166.2013.03.0327 URL Magsci [本文引用: 1] 摘要
<p>不透水面信息的提取方法与应用是近年来城市规划、热岛效应分析、水环境监测和水资源管理等诸多领域的研究热点。遥感技术的发展使不透水面快速准确提取成为可能。从影像特征(光谱、空间几何、时间)选择、分类器(参数、非参数)选择和空间尺度(像元、亚像元尺度)选择3个方面归纳和总结了各种不透水面遥感提取方法原理、应用现状和存在问题,回顾了不透水面在城市化监测、人口估计、水环境监测、热岛效应分析、水文气候建模分析等领域的应用,指出了不透水面遥感提取和应用的发展方向。</p>
|
| [50] |
DMSP/OLS数据应用研究综述 [J].https://doi.org/10.11820/dlkxjz.2012.01.002 URL [本文引用: 1] 摘要
The stable lighttime data, the radiance-calibrated nighttime light intensity data and the non radiance- calibrated nighttime light intensity data are the three major products that have emerged in the field of the DMSP/OLS nighttime light data. It has several advantages, namely, easy acquisition of data, detection of low-intensity lights, unaffected by shadows, convenient provision of conditions for urbanization strength and its spatial- temporal difference analysis, and so on. At present, there are many research results on DMSP/OLS data, which mainly focus on city development, human activity and effect, eco-environment impact, but there are few studies on systematic results. This paper analyzed the existing researches on DMSP/OLS data, summarized and drew some conclusions based on the existing research results, the technical methods and the advantages and disadvantages of the methods, as well as explored the application prospect of DMSP/OLS nighttime light average intensity data. It predicted the future research trends of the data: (1) an in-depth study on processing methods of the data; (2) further expansion of data application; (3) the integrated study on DMSP/OLS data and other data models need to be deepened; (4) combine the existing research results, make further research on mechanism issues of geography phenomenon.
Overview of researches based on DMSP/OLS nighttime light data .https://doi.org/10.11820/dlkxjz.2012.01.002 URL [本文引用: 1] 摘要
The stable lighttime data, the radiance-calibrated nighttime light intensity data and the non radiance- calibrated nighttime light intensity data are the three major products that have emerged in the field of the DMSP/OLS nighttime light data. It has several advantages, namely, easy acquisition of data, detection of low-intensity lights, unaffected by shadows, convenient provision of conditions for urbanization strength and its spatial- temporal difference analysis, and so on. At present, there are many research results on DMSP/OLS data, which mainly focus on city development, human activity and effect, eco-environment impact, but there are few studies on systematic results. This paper analyzed the existing researches on DMSP/OLS data, summarized and drew some conclusions based on the existing research results, the technical methods and the advantages and disadvantages of the methods, as well as explored the application prospect of DMSP/OLS nighttime light average intensity data. It predicted the future research trends of the data: (1) an in-depth study on processing methods of the data; (2) further expansion of data application; (3) the integrated study on DMSP/OLS data and other data models need to be deepened; (4) combine the existing research results, make further research on mechanism issues of geography phenomenon.
|
| [51] |
基于城镇居民用地再分类的人口数据空间化方法研究: 以长江中游4省为例 [J].https://doi.org/10.11873/j.issn.1004-0323.2015.5.0987 URL Magsci [本文引用: 1] 摘要
<p>基于土地利用数据的人口统计数据空间化方法,在处理过程中会出现同一土地利用类型下人口难以细分的情况,从而影响人口空间数据精度。引入夜间灯光信息并提出了一种基于夜间灯光强度对城镇居民地再分类的人口空间化方法,以改善人口空间数据精度。基于DMSP/OLS夜间灯光及土地利用数据,以长江中游4省为研究区进行方法试验。研究结果显示:利用夜间灯光数据对城镇居民地再分类后,各分区模型的调整R<sup>2</sup>都提高到了0.8以上,人口空间数据总体平均相对误差较重分类前降低了12.32%。说明该方法在提高传统人口数据空间化模型精度的基础上能够细化城镇居民地人口空间分布。</p>
Spatialization method for census data based on reclassifying residential land use in urban areas: A case study in the middle reaches of the Yangtze River Watershed .https://doi.org/10.11873/j.issn.1004-0323.2015.5.0987 URL Magsci [本文引用: 1] 摘要
<p>基于土地利用数据的人口统计数据空间化方法,在处理过程中会出现同一土地利用类型下人口难以细分的情况,从而影响人口空间数据精度。引入夜间灯光信息并提出了一种基于夜间灯光强度对城镇居民地再分类的人口空间化方法,以改善人口空间数据精度。基于DMSP/OLS夜间灯光及土地利用数据,以长江中游4省为研究区进行方法试验。研究结果显示:利用夜间灯光数据对城镇居民地再分类后,各分区模型的调整R<sup>2</sup>都提高到了0.8以上,人口空间数据总体平均相对误差较重分类前降低了12.32%。说明该方法在提高传统人口数据空间化模型精度的基础上能够细化城镇居民地人口空间分布。</p>
|
| [52] |
基于夜间灯光数据的中国省域GDP总量分析 [J].https://doi.org/10.3969/j.issn.1006-3862.2013.07.007 URL [本文引用: 1] 摘要
国内生产总值(GDP)通常以各种统计资料、统计报表为基础进行核算,费时耗财。本文提出了一种基于DMSP/OLS夜间灯光数据测算GDP的新方法。在分析夜间灯光强度与GDP关系基础上,采用回归分析的方法建立了GDP空间化模型,在GIS平台中实现了省级GDP空间化模拟。结果显示,建立的回归模型拟合精度达到0.964,显著性水平低于0.05,通过夜间灯光数据计量省级GDP总量的效率和精度都令人满意,将灯光数据应用于经济分析具有可行性。进一步修正完善模型,将为区域经济研究提供一种新研究方法。
GDP gross analysis at province-level in China based on night-time lightsatellite imagery .https://doi.org/10.3969/j.issn.1006-3862.2013.07.007 URL [本文引用: 1] 摘要
国内生产总值(GDP)通常以各种统计资料、统计报表为基础进行核算,费时耗财。本文提出了一种基于DMSP/OLS夜间灯光数据测算GDP的新方法。在分析夜间灯光强度与GDP关系基础上,采用回归分析的方法建立了GDP空间化模型,在GIS平台中实现了省级GDP空间化模拟。结果显示,建立的回归模型拟合精度达到0.964,显著性水平低于0.05,通过夜间灯光数据计量省级GDP总量的效率和精度都令人满意,将灯光数据应用于经济分析具有可行性。进一步修正完善模型,将为区域经济研究提供一种新研究方法。
|
| [53] |
基于DMSP/OLS夜间灯光数据的1995-2009年中国地级市能源消费动态 [J].https://doi.org/10.11821/dlyj201404003 URL [本文引用: 2] 摘要
能源是国民经济发展的重要支撑,便捷准确地获取能源消费时空动态信息,对于合理制定能源政策具有重要意义.基于DMSP/OLS夜间灯光数据和能源统计数据之间的定量关联,在地级市尺度上模拟了中国1995-2009年能源消费的空间格局,并采用空间自相关分析探讨其时空动态特征.研究表明:基于DMSP/OLS夜间灯光数据模拟中国各地市能源消费具有一定的可行性,该数据能够比较可靠地反映能源消费的时空动态;1995-2009年中国大多数地市的能源消费量较低,中低强度能源消费区土地面积占全国72.66%,高能源消费强度区集中分布在中国东部地区;中国能源消费量存在显著的空间集聚性(历年Moran'sI指数都大于0.4),全国地级市能源消费“高—高”聚集和“低—低”聚集现象明显.
Research on energy consumption dynamic among prefecture-level cities in China based on DMSP/OLS nighttime light .https://doi.org/10.11821/dlyj201404003 URL [本文引用: 2] 摘要
能源是国民经济发展的重要支撑,便捷准确地获取能源消费时空动态信息,对于合理制定能源政策具有重要意义.基于DMSP/OLS夜间灯光数据和能源统计数据之间的定量关联,在地级市尺度上模拟了中国1995-2009年能源消费的空间格局,并采用空间自相关分析探讨其时空动态特征.研究表明:基于DMSP/OLS夜间灯光数据模拟中国各地市能源消费具有一定的可行性,该数据能够比较可靠地反映能源消费的时空动态;1995-2009年中国大多数地市的能源消费量较低,中低强度能源消费区土地面积占全国72.66%,高能源消费强度区集中分布在中国东部地区;中国能源消费量存在显著的空间集聚性(历年Moran'sI指数都大于0.4),全国地级市能源消费“高—高”聚集和“低—低”聚集现象明显.
|
| [54] |
基于GIS的草原火遥感监测与火险评估 [D].Remote sensing monitoring of grassland fire and fire risk assessment based on GIS . |
| [55] |
DMSP/OLS夜间灯光数据应用研究综述 [J].
<p>DMSP/OLS以其独特的光电放大特性与对夜间灯光的获取能力,成为人类活动监测的良好数据源。回顾了DMSP/OLS夜间灯光数据在城镇信息提取、社会经济因子估计及光污染、火灾、渔火、天然气燃烧监测等方面的应用,其中重点介绍了利用灯光数据估算城市化水平和人口的方法和步骤,并总结了DMSP/OLS夜间灯光数据在应用中的优越性与局限性,最后对其未来应用方向进行了展望。<br /></p>
Review on applications of DMSP/OLS night-time emissions data .
<p>DMSP/OLS以其独特的光电放大特性与对夜间灯光的获取能力,成为人类活动监测的良好数据源。回顾了DMSP/OLS夜间灯光数据在城镇信息提取、社会经济因子估计及光污染、火灾、渔火、天然气燃烧监测等方面的应用,其中重点介绍了利用灯光数据估算城市化水平和人口的方法和步骤,并总结了DMSP/OLS夜间灯光数据在应用中的优越性与局限性,最后对其未来应用方向进行了展望。<br /></p>
|
| [56] |
夜间灯光数据驱动的成渝城市群空间形成过程重建及分析 [J].
2016年4月发布的《成渝城市群发展规划》首次正式确定了成渝城市群的内涵和具体边界,重建成渝城市群的形成过程,有利于把握未来发展趋势,并合理优化与调整其发展过程。在重建技术方面,对DMSP/OLS夜间灯光数据传统的不变目标区域校正法加以改进,将成渝城市群2013年城市市区范围内的全部像元加入校正模型的拟合中,设计了统计数据的校正规则,再通过二分比较法较好地恢复了成渝城市群内各城市建成区的时序空间信息。提取面积与统计面积总体平均相对误差为-0.38%,利用高分辨率Google Earth图像验证的建成区提取准确率达到98.29%,相比其他研究结果,经方法改进后的提取结果精度高且稳定。在结果分析方面,基于提取结果展开对城市群建成区重心转移过程与城市聚合过程的深层次研究,剖析了城市群的内部格局与时空变化特征。分析表明,成渝城市群的聚合情况与《成渝城市群发展规划》高度吻合,城市群已进入快速发育阶段,随着区域差异的持续扩大,成都、重庆都市圈的核心地位逐渐形成,而重庆的发展态势稍好。
Restoring and analyzing the space forming process of Chengdu-Chongqing urban agglomeration by using DMSP/OLS night-time light data .
2016年4月发布的《成渝城市群发展规划》首次正式确定了成渝城市群的内涵和具体边界,重建成渝城市群的形成过程,有利于把握未来发展趋势,并合理优化与调整其发展过程。在重建技术方面,对DMSP/OLS夜间灯光数据传统的不变目标区域校正法加以改进,将成渝城市群2013年城市市区范围内的全部像元加入校正模型的拟合中,设计了统计数据的校正规则,再通过二分比较法较好地恢复了成渝城市群内各城市建成区的时序空间信息。提取面积与统计面积总体平均相对误差为-0.38%,利用高分辨率Google Earth图像验证的建成区提取准确率达到98.29%,相比其他研究结果,经方法改进后的提取结果精度高且稳定。在结果分析方面,基于提取结果展开对城市群建成区重心转移过程与城市聚合过程的深层次研究,剖析了城市群的内部格局与时空变化特征。分析表明,成渝城市群的聚合情况与《成渝城市群发展规划》高度吻合,城市群已进入快速发育阶段,随着区域差异的持续扩大,成都、重庆都市圈的核心地位逐渐形成,而重庆的发展态势稍好。
|
| [57] |
基于DMSP/OLS夜间灯光数据的土地城镇化水平时空测度研究: 以环渤海地区为例 [J].https://doi.org/10.15957/j.cnki.jjdl.2015.02.020 URL [本文引用: 1] 摘要
在遥感和GIS技术支持下,发展出一种基于长时间序列DMSP/OLS夜间灯光数据的土地城镇化水平测度方法,并以环渤海地区为例进行1992—2010逐年土地城镇化水平时空测度研究。结果表明,在1992—2010年间:1基于DMSP/OLS夜间灯光数据提取的城镇用地信息总体精度和Kappa系数平均值分别达到了88.11%和0.61,能较好地反映区域城镇发展的实际情况,具有一定的可信度;2从总体上看,环渤海地区土地城镇化水平增长迅速,由1992年的0.82%增至2010年的3.20%,年均增长率指数为7.80%;3从区域差异上看,环渤海地区三大城市群之间、滨海城市与非滨海城市之间、距海岸线不同距离的区域之间土地城镇化水平差异显著并呈进一步扩大趋势;4从空间特征上看,土地城镇化水平高值区呈现出一定的向海性。本研究可为快速有效地测度分析区域土地城镇化水平,进而调整和优化区域城镇化格局,推进区域新型城镇化建设提供决策参考。
The spatial-temporal measurement on the land urbanization level using DMSP/OLS nighttime light data: A case study of Bohai Rim .https://doi.org/10.15957/j.cnki.jjdl.2015.02.020 URL [本文引用: 1] 摘要
在遥感和GIS技术支持下,发展出一种基于长时间序列DMSP/OLS夜间灯光数据的土地城镇化水平测度方法,并以环渤海地区为例进行1992—2010逐年土地城镇化水平时空测度研究。结果表明,在1992—2010年间:1基于DMSP/OLS夜间灯光数据提取的城镇用地信息总体精度和Kappa系数平均值分别达到了88.11%和0.61,能较好地反映区域城镇发展的实际情况,具有一定的可信度;2从总体上看,环渤海地区土地城镇化水平增长迅速,由1992年的0.82%增至2010年的3.20%,年均增长率指数为7.80%;3从区域差异上看,环渤海地区三大城市群之间、滨海城市与非滨海城市之间、距海岸线不同距离的区域之间土地城镇化水平差异显著并呈进一步扩大趋势;4从空间特征上看,土地城镇化水平高值区呈现出一定的向海性。本研究可为快速有效地测度分析区域土地城镇化水平,进而调整和优化区域城镇化格局,推进区域新型城镇化建设提供决策参考。
|
| [58] |
基于夜间灯光数据的中国土地城镇化水平时空动态 [J].
基于长时间序列夜间灯光遥感数据,本研究从国家、八大经济区、省、地等四个尺度综合分析了中国1992—2010年土地城镇化水平时空动态特征。结果表明,在1992—2010年间:中国土地城镇化水平增长迅速,年均增长率为8.34%,明显高于同时期人口城镇化水平增长速度;土地城镇化水平区域差异十分显著,东部沿海经济区在八大经济区中土地城镇化水平最高且增长速度最快,香港、澳门特别行政区土地城镇化水平远高于其它省区;土地城镇化的热点区域主要集中分布于长三角、山东半岛、海峡西岸等11个城市群地区。
The spatial-temporal dynamics of the land urbanization level in China based on nighttime light data .
基于长时间序列夜间灯光遥感数据,本研究从国家、八大经济区、省、地等四个尺度综合分析了中国1992—2010年土地城镇化水平时空动态特征。结果表明,在1992—2010年间:中国土地城镇化水平增长迅速,年均增长率为8.34%,明显高于同时期人口城镇化水平增长速度;土地城镇化水平区域差异十分显著,东部沿海经济区在八大经济区中土地城镇化水平最高且增长速度最快,香港、澳门特别行政区土地城镇化水平远高于其它省区;土地城镇化的热点区域主要集中分布于长三角、山东半岛、海峡西岸等11个城市群地区。
|
| [59] |
2003-2013年汶川地震极重灾区夜间灯光年际变化分析 [J].https://doi.org/10.3969/j.issn.1000-811X.2018.01.003 URL [本文引用: 1] 摘要
自然灾害往往造成灾区光源载体的破坏,同时伴随着恢复重建过程光源载体又得到修复或新建,因此夜间灯光变化在一定程度上能够反映重大自然灾害对灾区社会经济的影响.基于DMSP-OLS夜间灯光遥感数据,分析汶川地震极重灾区夜间灯光分布范围和强度的年际变化特点,并与地区生产总值和全社会固定资产投资年际变化进行对比分析,探索分析夜间灯光变化与灾害损失的相关关系.研究结果表明,2003-2013年汶川地震极重灾区的夜间灯光分布强度年际变化与地区生产总值和全社会固定资产投资年际变化存在相关关系,基本呈现出灾害当年的夜间灯光遥感影像亮值像元个数和亮值像元数值少于前1年,灾后第1年继续减少,灾后第2年急剧增加并达到峰值;同时,灾后夜间灯光遥感影像亮值像元个数和亮值像元数值的减少与因灾死亡和失踪人口、万人死亡失踪率和万人倒塌房屋率等灾情指标存在较显著的相关关系.
Analysis of the inter-annual variation of nighttime lights in the most affected area of Wenchuan earthquake from 2003 to 2013 .https://doi.org/10.3969/j.issn.1000-811X.2018.01.003 URL [本文引用: 1] 摘要
自然灾害往往造成灾区光源载体的破坏,同时伴随着恢复重建过程光源载体又得到修复或新建,因此夜间灯光变化在一定程度上能够反映重大自然灾害对灾区社会经济的影响.基于DMSP-OLS夜间灯光遥感数据,分析汶川地震极重灾区夜间灯光分布范围和强度的年际变化特点,并与地区生产总值和全社会固定资产投资年际变化进行对比分析,探索分析夜间灯光变化与灾害损失的相关关系.研究结果表明,2003-2013年汶川地震极重灾区的夜间灯光分布强度年际变化与地区生产总值和全社会固定资产投资年际变化存在相关关系,基本呈现出灾害当年的夜间灯光遥感影像亮值像元个数和亮值像元数值少于前1年,灾后第1年继续减少,灾后第2年急剧增加并达到峰值;同时,灾后夜间灯光遥感影像亮值像元个数和亮值像元数值的减少与因灾死亡和失踪人口、万人死亡失踪率和万人倒塌房屋率等灾情指标存在较显著的相关关系.
|
| [60] |
基于夜间灯光数据的南海渔业捕捞动态变化研究 [D].Research on fishing dynamic changes in the South China Sea using nighttime light data . |
| [61] |
基于DMSP/OLS夜间灯光数据的城乡结合部空间识别研究: 以重庆市主城区为例 [J].https://doi.org/10.3969/j.issn.1672-0504.2016.06.007 URL [本文引用: 1] 摘要
为解决经济、人口等城乡结合部空间识别指示要素不能反映行政区内部差异的问题,该文提出了一种基于DMSP/OLS夜间灯光数据的城乡结合部空间识别技术方法.首先构建灯光亮度和灯光亮度起伏度特征组合值模型,分析灯光亮度和灯光亮度起伏度组合特征;其次通过断点法分类,对城乡结合部进行空间识别;最后以重庆市主城区为例进行了实证研究.结果显示:1)城市呈现/ 高灯光亮度、低灯光亮度起伏度”特征组合;城乡结合部呈现/ 中灯光亮度、高灯光亮度起伏度’特征组合;乡村呈现1低灯光亮度、低灯光亮度起伏度”特征组合.2)城乡结合部面积占重庆市主城区总面积的5907 % ,主要分布在以江北区观音桥街道中部为圆心,以17 km为内半径和37 km为外半径构成的环带内.基于DMSP/OLS夜间灯光数据为城乡结合部空间识别提供了一种简便可行的方法.
Spatial recognition of the urban-rural fringe based on DMSP/OLS nighttime light data: A case study of the main urban areas of Chongqing. Geography and Geo-information https://doi.org/10.3969/j.issn.1672-0504.2016.06.007 URL [本文引用: 1] 摘要
为解决经济、人口等城乡结合部空间识别指示要素不能反映行政区内部差异的问题,该文提出了一种基于DMSP/OLS夜间灯光数据的城乡结合部空间识别技术方法.首先构建灯光亮度和灯光亮度起伏度特征组合值模型,分析灯光亮度和灯光亮度起伏度组合特征;其次通过断点法分类,对城乡结合部进行空间识别;最后以重庆市主城区为例进行了实证研究.结果显示:1)城市呈现/ 高灯光亮度、低灯光亮度起伏度”特征组合;城乡结合部呈现/ 中灯光亮度、高灯光亮度起伏度’特征组合;乡村呈现1低灯光亮度、低灯光亮度起伏度”特征组合.2)城乡结合部面积占重庆市主城区总面积的5907 % ,主要分布在以江北区观音桥街道中部为圆心,以17 km为内半径和37 km为外半径构成的环带内.基于DMSP/OLS夜间灯光数据为城乡结合部空间识别提供了一种简便可行的方法.
|
| [62] |
基于夜间灯光影像的地震受灾区域和人口评估研究 [D].Assessment of damaged areas and affected population in earthquake disasters based on nighttime imageries . |
| [63] |
基于DMSP/OLS夜间灯光数据的城市空间扩展研究综述 [J].https://doi.org/10.3969/j.issn.1672-5867.2015.03.021 URL [本文引用: 2] 摘要
不同于传统的遥感探测器,DMSP/OLS可获取居民地、车流、渔船等夜间灯光信号,被广泛地应用于城市空间扩展研究中。目前,基于灯光数据的城市扩展研究很多,但缺乏对该领域研究进展的系统性分析与总结。基于此,分析比较现有研究实例,从阈值设定法提取城区和灯光数据城市监测两方面展开讨论,分析目前研究欠缺之处并探讨解决方案。同时,构建新型城市重心模型,进行实例分析,最后展望夜间灯光数据在城市空间扩展方面的研究趋势:1加强对数据本身处理方法的研究;2充分利用灯光强度信息;3构建新型指标反映城市扩展。
Overview of researches based on urban expansion via DMSP/OLS nighttime light data .https://doi.org/10.3969/j.issn.1672-5867.2015.03.021 URL [本文引用: 2] 摘要
不同于传统的遥感探测器,DMSP/OLS可获取居民地、车流、渔船等夜间灯光信号,被广泛地应用于城市空间扩展研究中。目前,基于灯光数据的城市扩展研究很多,但缺乏对该领域研究进展的系统性分析与总结。基于此,分析比较现有研究实例,从阈值设定法提取城区和灯光数据城市监测两方面展开讨论,分析目前研究欠缺之处并探讨解决方案。同时,构建新型城市重心模型,进行实例分析,最后展望夜间灯光数据在城市空间扩展方面的研究趋势:1加强对数据本身处理方法的研究;2充分利用灯光强度信息;3构建新型指标反映城市扩展。
|
| [64] |
NPP卫星VIIRS微光资料反演夜间PM2.5质量浓度 [J].
为研究城市夜间PM_(2.5)质量浓度,利用NPP卫星上可见光红外成像辐射套件(VIIRS)DNB通道的微光辐射数据,以辐射传输理论为基础,建立了夜间城市灯光辐射强度与地面表层PM_(2.5)质量浓度的关系,并基于支持向量机方法建立了夜间城市PM_(2.5)质量浓度反演模型。以北京市作为研究对象,选取2015-03—2015-05期间无月、无云且晴朗夜空条件下4个PM_(2.5)监测站点的微光辐射数据与时空匹配的PM_(2.5)质量浓度数据对模型进行验证。研究结果表明:夜间城市灯光辐射强度与地面表层PM_(2.5)质量浓度呈现负相关性,相关系数最高的定陵站点达到–0.83。基于支持向量机方法建立的PM_(2.5)反演模型获得的PM_(2.5)质量浓度与实际PM_(2.5)质量浓度的相关系数达到0.95,反演结果较优,为进一步大范围监测PM_(2.5)质量浓度空间分布以及改善城市夜间空气质量状况评估方法提供了可行性参考。
Inversion algorithm of PM2.5 air quality based on nighttime light data from NPP/VIIRS .
为研究城市夜间PM_(2.5)质量浓度,利用NPP卫星上可见光红外成像辐射套件(VIIRS)DNB通道的微光辐射数据,以辐射传输理论为基础,建立了夜间城市灯光辐射强度与地面表层PM_(2.5)质量浓度的关系,并基于支持向量机方法建立了夜间城市PM_(2.5)质量浓度反演模型。以北京市作为研究对象,选取2015-03—2015-05期间无月、无云且晴朗夜空条件下4个PM_(2.5)监测站点的微光辐射数据与时空匹配的PM_(2.5)质量浓度数据对模型进行验证。研究结果表明:夜间城市灯光辐射强度与地面表层PM_(2.5)质量浓度呈现负相关性,相关系数最高的定陵站点达到–0.83。基于支持向量机方法建立的PM_(2.5)反演模型获得的PM_(2.5)质量浓度与实际PM_(2.5)质量浓度的相关系数达到0.95,反演结果较优,为进一步大范围监测PM_(2.5)质量浓度空间分布以及改善城市夜间空气质量状况评估方法提供了可行性参考。
|
| [65] |
单元路网长度的DMSP/OLS夜间灯光数据去饱和方法 [J].https://doi.org/10.11834/jrs.20186478 URL [本文引用: 1] 摘要
近年来DMSP/OLS夜间灯光数据被广泛应用到人类活动强度及城市化进程的研究中,但由于OLS传感器的限制导致,在夜间灯光强度过高的城市中心区,NTL数据存在较为明显的饱和现象。这种饱和现象直接掩盖了城市中心区内部的灯光差异、细节,限制了DMSP/OLS数据在城市中心区的应用。目前缓解灯光数据饱和的方法主要分为:辐射定标法和非辐射定标法。其中辐射定标法虽精度较高,但定标算法复杂,干扰因素多,目前只有部分定标产品;非辐射定标法利用辅助数据(包括自然因素指标、社会经济指标)构建函数模型,对饱和区稳定灯光数据进行去饱和处理,具有较好修正效果。本文在总结VANUI(基于NDVI所构建)、EANTLI(基于EVI所构建)等去饱和指数的基础上,利用地理探测器对NDVI、EVI和UNL(单元路网长度)进行因子探测,量化对稳定灯光数据的解释力,提出了UNLI指数。为了验证UNLI、EANTLI及NTL数据之间的差异,通过“饱和区灯光强度细节刻画程度”、“UNLI、EANTLI与辐射定标数据RCNTL相关性分析”、“耗电量及GDP等经济指标回归拟合优度”3个方面进行比对分析,可以看出:(1)UNLI、EANTLI在修正过饱和灯光数据上均有较好的效果,但UNLI对饱和区灯光强度差异的刻画更加准确;(2)UNLI较之VANUI、EANTLI,可以突破空间分辨率的限制,增加灯光强度细节差异;(3)在灯光强度最高的饱和区,UNLI在与RCNTL的相关性最高,但随着灯光强度的减弱,UNLI、EANTLI与RCNTL的线性回归判断系数R^2逐渐接近,UNLI与RCNTL相关性优势正逐渐丧失;(4)在对耗电量、GDP的拟合分析中,引入UNLI指数的“EANTLI&UNLI”的分段式修正模型,充分发挥EVI、UNL各自的优势,具有最优的拟合效果(RAdj^2=0.873)。实验结果表明,本文引入的修正夜间灯光饱和方法,能够17
Method to reduce saturation of DMSP/OLS nighttime light data based on UNL .https://doi.org/10.11834/jrs.20186478 URL [本文引用: 1] 摘要
近年来DMSP/OLS夜间灯光数据被广泛应用到人类活动强度及城市化进程的研究中,但由于OLS传感器的限制导致,在夜间灯光强度过高的城市中心区,NTL数据存在较为明显的饱和现象。这种饱和现象直接掩盖了城市中心区内部的灯光差异、细节,限制了DMSP/OLS数据在城市中心区的应用。目前缓解灯光数据饱和的方法主要分为:辐射定标法和非辐射定标法。其中辐射定标法虽精度较高,但定标算法复杂,干扰因素多,目前只有部分定标产品;非辐射定标法利用辅助数据(包括自然因素指标、社会经济指标)构建函数模型,对饱和区稳定灯光数据进行去饱和处理,具有较好修正效果。本文在总结VANUI(基于NDVI所构建)、EANTLI(基于EVI所构建)等去饱和指数的基础上,利用地理探测器对NDVI、EVI和UNL(单元路网长度)进行因子探测,量化对稳定灯光数据的解释力,提出了UNLI指数。为了验证UNLI、EANTLI及NTL数据之间的差异,通过“饱和区灯光强度细节刻画程度”、“UNLI、EANTLI与辐射定标数据RCNTL相关性分析”、“耗电量及GDP等经济指标回归拟合优度”3个方面进行比对分析,可以看出:(1)UNLI、EANTLI在修正过饱和灯光数据上均有较好的效果,但UNLI对饱和区灯光强度差异的刻画更加准确;(2)UNLI较之VANUI、EANTLI,可以突破空间分辨率的限制,增加灯光强度细节差异;(3)在灯光强度最高的饱和区,UNLI在与RCNTL的相关性最高,但随着灯光强度的减弱,UNLI、EANTLI与RCNTL的线性回归判断系数R^2逐渐接近,UNLI与RCNTL相关性优势正逐渐丧失;(4)在对耗电量、GDP的拟合分析中,引入UNLI指数的“EANTLI&UNLI”的分段式修正模型,充分发挥EVI、UNL各自的优势,具有最优的拟合效果(RAdj^2=0.873)。实验结果表明,本文引入的修正夜间灯光饱和方法,能够17
|
| [66] |
基于夜间灯光数据的重庆电力消费时空动态与影响因素分析 [D].Studying the electricity consumption changes in Chongqing by using DMSP/OLS stable nighttime light data . |
| [67] |
基于夜间灯光数据的中国人口密度模拟 [J].https://doi.org/10.3321/j.issn:0375-5444.2005.02.010 URL [本文引用: 1] 摘要
人口密度网格化比人口密度行政单元化更接近人口的实际分布,而且是实现人口数据与其他社会经济统计数据、资源数据、环境数据复合,提高人口、资源、环境综合管理能力的重要途径之一.选用专门针对亚洲地区开发的DMSP/OLS非辐射定标夜间灯光平均强度遥感数据模拟了中国的人口密度:基于灯光强度信息模拟了灯光区内部的人口密度,基于人口-距离衰减规律和电场叠加理论模拟了灯光区外部的人口密度,是应用DMSP/OLS夜间灯光数据模拟人口密度研究的拓展和深入,研究结果与其他研究基本一致,但所需数据量较少,更适合于大尺度人口密度的快速估算,为决策提供参考依据.结果表明,DMSP/OLS夜间灯光强度数据具有实现人口以及其他社会经济数据空间网格化的巨大潜力.
Modeling population density of China in 1998 based on DMSP/OLS nighttime light image .https://doi.org/10.3321/j.issn:0375-5444.2005.02.010 URL [本文引用: 1] 摘要
人口密度网格化比人口密度行政单元化更接近人口的实际分布,而且是实现人口数据与其他社会经济统计数据、资源数据、环境数据复合,提高人口、资源、环境综合管理能力的重要途径之一.选用专门针对亚洲地区开发的DMSP/OLS非辐射定标夜间灯光平均强度遥感数据模拟了中国的人口密度:基于灯光强度信息模拟了灯光区内部的人口密度,基于人口-距离衰减规律和电场叠加理论模拟了灯光区外部的人口密度,是应用DMSP/OLS夜间灯光数据模拟人口密度研究的拓展和深入,研究结果与其他研究基本一致,但所需数据量较少,更适合于大尺度人口密度的快速估算,为决策提供参考依据.结果表明,DMSP/OLS夜间灯光强度数据具有实现人口以及其他社会经济数据空间网格化的巨大潜力.
|
| [68] |
基于EVI指数的DMSP/OLS夜间灯光数据去饱和方法 [J].https://doi.org/10.11821/dlxb201508012 URL [本文引用: 1] 摘要
DMSP/OLS nighttime light (NTL) data has been widely applied to many studies on anthropogenic activities and their effects on the environment. Due to the limitations of the OLS sensor, NTL data suffers from saturation problem in the core of urban areas, which further influences researches based on nocturnal lights. The radiance calibrated nighttime light (RCNTL) products developed by the National Geophysical Data Center (NGDC) at NOAA partially solved the problem. However, they are only available for a very limited number of years. Recently, a vegetation adjusted NTL urban index (VANUI) has been developed based on the stylized fact that vegetation and urban surfaces are inversely correlated. Despite its simplicity of implementing and effectiveness in increasing variation to NTL data, VANUI does not perform well in some fast growing cities. In this paper, we proposed a new urban index, i.e., the Enhanced Vegetation Index (EVI) adjusted nighttime light index (EANTLI), which combined MODIS EVI with NTL to alleviate the saturation problem of NTL data. In order to evaluate the proposed EANTLI's capability in reducing NTL saturation, we first compared its spatial distributions in potential saturated areas (PSAs) of three metropolitan areas in China with that of the original NTL and VANUI, respectively. Then we randomly selected 30 latitudinal transects across these urban areas to verify EANTLI's similarity to the RCNTL. Finally, we tested EANTLI's effectiveness in assessing electric power consumption of 168 prefecture-level cities in China. Results from these experiments showed that EANTLI significantly increases spatial heterogeneity in the PSAs and effectively alleviates the NTL saturation problem. EANTLI's similarity to RCNTL is consistently higher than that of VANUI in the comparison of latitudinal transects. EANTLI also yields better results in the estimation of electric power consumption. In conclusion, the EANTLI can effectively reduce NTL saturation in urban centers and thus has great potential of wide range applications in the future.
An EVI-based method to reduce saturation of DMSP/OLS nighttime light data .https://doi.org/10.11821/dlxb201508012 URL [本文引用: 1] 摘要
DMSP/OLS nighttime light (NTL) data has been widely applied to many studies on anthropogenic activities and their effects on the environment. Due to the limitations of the OLS sensor, NTL data suffers from saturation problem in the core of urban areas, which further influences researches based on nocturnal lights. The radiance calibrated nighttime light (RCNTL) products developed by the National Geophysical Data Center (NGDC) at NOAA partially solved the problem. However, they are only available for a very limited number of years. Recently, a vegetation adjusted NTL urban index (VANUI) has been developed based on the stylized fact that vegetation and urban surfaces are inversely correlated. Despite its simplicity of implementing and effectiveness in increasing variation to NTL data, VANUI does not perform well in some fast growing cities. In this paper, we proposed a new urban index, i.e., the Enhanced Vegetation Index (EVI) adjusted nighttime light index (EANTLI), which combined MODIS EVI with NTL to alleviate the saturation problem of NTL data. In order to evaluate the proposed EANTLI's capability in reducing NTL saturation, we first compared its spatial distributions in potential saturated areas (PSAs) of three metropolitan areas in China with that of the original NTL and VANUI, respectively. Then we randomly selected 30 latitudinal transects across these urban areas to verify EANTLI's similarity to the RCNTL. Finally, we tested EANTLI's effectiveness in assessing electric power consumption of 168 prefecture-level cities in China. Results from these experiments showed that EANTLI significantly increases spatial heterogeneity in the PSAs and effectively alleviates the NTL saturation problem. EANTLI's similarity to RCNTL is consistently higher than that of VANUI in the comparison of latitudinal transects. EANTLI also yields better results in the estimation of electric power consumption. In conclusion, the EANTLI can effectively reduce NTL saturation in urban centers and thus has great potential of wide range applications in the future.
|
| [69] |
Baghdad nights: Evaluating the US military "Surge" using nighttime light signatures [J]. |
| [70] |
Estimating population and energy consumption in Brazilian Amazonia using DMSP night-time satellite data [J].https://doi.org/10.1016/j.compenvurbsys.2003.09.004 URL [本文引用: 1] 摘要
This paper describes a methodology to assess the evidence of human presence and human activities in the Brazilian Amazonia region using DMSP/OLS night-time satellite sensor imagery. It consists on exploring the potential of the sensor data for regional studies analysing the correlation between DMSP night-time light foci and population, and the correlation between DMSP night-time light foci and electrical power consumption. In the mosaic of DMSP/OLS night-time light imagery from September 1999, 248 towns were detected from a total of 749 munic pios in Amazonia. It was found that the night-time light foci were related to human presence in the region, including urban settlements, mining, industries, and civil construction, observed in ancillary Landsat TM and JERS imagery data. The analysis considering only the state of Par revealed a linear relation ( R 2=0.79) between urban population from the 1996 census data and DMSP night-time light foci. Similarly, electrical power consumption for 1999 was linearly correlated with DMSP night-time light foci. Thus the DMSP/OLS imagery can be used as an indicator of human presence in the analysis of spatial emporal patterns in the Amazonia region. These results are very useful considering the continental dimension of Amazonia, the absence of demographic information between the official population census (every 10 years), and the dynamics and complexity of human activities in the region. Therefore DMSP night-time light foci are a valuable data source for global studies, modelling, and planning activities when the human dimension must be considered throughout Amazonia.
|
| [71] |
Impervious surface coverage: The emergence of a key environmental indicator [J].https://doi.org/10.1080/01944369608975688 URL [本文引用: 1] 摘要
Planners concerned with water resource protection in urbanizing areas must deal with the adverse impacts of polluted runoff. Impervious surface coverage is a quantifiable land-use indicator that correlates closely with these impacts. Once the role and distribution of impervious coverage are understood, a wide range of strategies to reduce impervious surfaces and their impacts on water resources can be applied to community planning, site-level planning and design, and land use regulation. These strategies complement many current trends in planning, zoning, and landscape design that go beyond water pollution concerns to address the quality of life in a community.
|
| [72] |
A global inventory of coral reef stressors based on satellite observed nighttime lights [J].https://doi.org/10.1080/10106040802185940 URL [本文引用: 1] 摘要
In this article, we present a satellite-based approach to gather information about the threat to coral reefs worldwide. Three chosen reef stressors 090009 development, gas flaring and heavily lit fishing boat activity 090009 are analysed using nighttime lights data derived from the Defense Meteorological Satellite Program (DMSP) produced at the National Oceanic & Atmospheric Administration, National Geophysical Data Center (NOAA/NGDC). Nighttime lights represent a direct threat to coral reef ecosystems and are an excellent proxy measure for associated human-caused stressors. A lights proximity index (LPI) is calculated, measuring the distance of coral reef sites to each of the stressors and incorporating the stressor''s intensity. Colourized maps visualize the results on a global scale. Area rankings clarify the effects of artificial night lighting on coral reefs on a regional scale. The results should be very useful for reef managers and for state administrations to implement coral reef conservation projects and for the scientific world to conduct further research.
|
| [73] |
Contrasting trends in light pollution across Europe based on satellite observed night time lights [J].https://doi.org/10.1038/srep03789 URL PMID: 24445659 摘要
Abstract Since the 1970s nighttime satellite images of the Earth from space have provided a striking illustration of the extent of artificial light. Meanwhile, growing awareness of adverse impacts of artificial light at night on scientific astronomy, human health, ecological processes and aesthetic enjoyment of the night sky has led to recognition of light pollution as a significant global environmental issue. Links between economic activity, population growth and artificial light are well documented in rapidly developing regions. Applying a novel method to analysis of satellite images of European nighttime lights over 15 years, we show that while the continental trend is towards increasing brightness, some economically developed regions show more complex patterns with large areas decreasing in observed brightness over this period. This highlights that opportunities exist to constrain and even reduce the environmental impact of artificial light pollution while delivering cost and energy-saving benefits.
|
| [74] |
Impervious surfaces and water quality: A review of current literature and its implications for watershed planning [J].https://doi.org/10.1177/088541202400903563 URL [本文引用: 1] |
| [75] |
Detecting light outages after severe storms using the S-NPP/VIIRS Day/Night Band radiances [J].https://doi.org/10.1109/LGRS.2013.2262258 URL [本文引用: 1] 摘要
Power outages after a major storm affect the lives of millions of people and cause massive light outages. The launch of the Suomi National Polar-orbiting Partnership satellite with the Visible Infrared Imaging Radiometer Suite (VIIRS) significantly enhances our capability to monitor and detect light outages with the well-calibrated day/night band (DNB) and to use light loss signatures as indication of regional power outages. This study explores the use of the DNB in quantifying light outages due to the derecho storm in the Washington DC metropolitan area in June 2012 and Hurricane Sandy at the end of October 2012 on the East Coast of U.S. The results show that the DNB data are very useful in detecting power outages by quantifying light loss, but it also has some challenges due to clouds, lunar illumination, and straylight effect. Comparison of light outage and recovery trend determined from DNB data with power company survey shows reasonable agreement, demonstrating the usefulness of DNB in independently verifying and complementing the statistics from power companies.
|
| [76] |
A SVM-based method to extract urban areas from DMSP/OLS and SPOT VGT data [J].https://doi.org/10.1016/j.rse.2009.06.001 URL [本文引用: 1] 摘要
Mapping urban areas at regional and global scales has become an urgent task because of the increasing pressures from rapid urbanization and associated environmental problems. Satellite imaging of stable anthropogenic lights from DMSP-OLS provides an accurate, economical, and straightforward way to map the global distribution of urban areas. To address problems in the thresholding methods that use empirical strategies or manual trial-and-error procedures, we proposed a support vector machine (SVM)-based region-growing algorithm to semi-automatically extract urban areas from DMSP-OLS and SPOT NDVI data. Several simple criteria were used to select SVM training sets of urban and non-urban pixels, and an iterative classification and training procedure was adopted to identify the urban pixels through region growing. The new method was validated using the extents of 25 Chinese cities, as classified by Landsat ETM+ images, and then compared with two common thresholding methods. The results showed that the SVM-based algorithm could not only achieve comparable results to the local-optimized threshold method, but also avoid its tedious trial-and-error procedure, suggesting that the new method is an easy and simple alternative for extracting urban extent from DMSP-OLS and SPOT NDVI data.
|
| [77] |
Coupling an intercalibration of radiance-calibrated nighttime light images and land use/cover data for modeling and analyzing the distribution of GDP in Guangdong, China [J].https://doi.org/10.3390/su8020108 URL |
| [78] |
Spatial characterization of electrical power consumption patterns over India using temporal DMSP-OLS night-time satellite data [J].https://doi.org/10.1080/01431160802345685 URL [本文引用: 1] 摘要
Changes in electric power consumption patterns of a country over a period of time reflect on its socio‐economic development and energy utilization processes. In the present study, we characterized spatial and temporal changes in electric power consumption patterns over India during 1993 to 2002, using ‘night‐time lights’ data given by the Defense Meteorological Satellite Program–Operational Line Scan System (DMSP‐OLS) over the Indian region. The OLS operates in two bands: visible (0.5–0.90208m) and thermal (10.5–12.50208m) and has a unique capability of picking up faint sources of visible–near infrared emissions (lights) at night on the Earth's surface including cities, towns and villages with a DN value ranging from 1 to 63. Night‐time light images for cloud‐free dates given by the DMSP‐OLS from 1993 to 2002 were segregated into respective years and were integrated to generate one ‘Stable light image’ per year. Changes in light scenarios over the Indian region in the decadal time frame were studied using stable lights datasets from 1993 to 2002. Information on changes in the light scenarios was integrated with demographic data to characterize developments in major cities and states of India. Results of the study suggested an increase in population by 17002million and power consumption from 4496202million02kWh to 30635502million02kWh over the country during 1993–2002, which was associated with an overall increase in number of night‐time lights of up to 26% in all states, indicating development in electric power consumption patterns. Correlation analysis between increase in population to the increase in night‐time lights and electric power consumption showed a coefficient of determination, R 2, of 0.59 and 0.56 respectively. Increase in light intensities along the peripheries of major Indian cities was observed, which indicated increased stress on the cities and corresponding development in power consumption patterns during the decadal time frame. Certain states, however, showed a decrease in night‐time lights in some areas, which are primarily attributed to the decreased economic growth trend and poverty and accounted to the scatter observed in the correlation analysis. Results are discussed in the paper.
|
| [79] |
Active forest fire monitoring in Uttaranchal State, India using multi-temporal DMSP-OLS and MODIS data [J].https://doi.org/10.1080/01431160600810609 URL [本文引用: 1] 摘要
This paper gives an account of day–night active forest fire monitoring conducted over the sub‐tropical and moist temperate forests of the Uttaranchal State, India, during 2005 using the Defence Meteorological Satellite Program – Operational Line Scan system (DMSP‐OLS) and Moderate Resolution Imaging Spectroradiometer (MODIS) satellite data. The state experienced heavy fire episodes during May–June 2005 and daily datasets of DMSP‐OLS (night‐time) and selected cloud‐free MODIS (daytime) datasets were used in mapping active fire locations. DMSP‐OLS collects data in visible (0.5 to 0.90208m) and thermal (10.5 to 12.50208m) bands and detects dim sources of lighting on the earth's surface, including fires. The enhanced fire algorithm for active fire detection (version 4) was used in deriving fire products from MODIS datasets. Fire locations derived from DMSP‐OLS and MODIS data were validated with limited ground data from forest department and media reports. Results of the study indicated that the state experienced heavy fire episodes, most of them occurring during night‐time rather than daytime. Validation of satellite‐derived fires with ground data showed a high degree of spatial correlation.
|
| [80] |
Using luminosity data as a proxy for economic statistics [J].https://doi.org/10.1073/pnas.1017031108 URL [本文引用: 1] |
| [81] |
Technical note and cover fishing fleet lights and sea surface temperature distribution observed by DMSP/OLS sensor [J].https://doi.org/10.1080/014311699213569 URL [本文引用: 1] 摘要
A night-time OLS (Operational Linescan System) visible-near-infrared (VNIR) channel image of the DMSP (Defense Meteorological Satellite Program) was overlaid on the simultaneously corrected OLS thermal infrared (TIR) channel image for the area around Japan. The OLS composite image showed a clear relationship between the location of fishing fleet lights detected by the VNIR channel and the sea surface temperature (SST) distribution observed by the TIR channel. Many fishing fleets were located at the cold side of the boundary area between warm currents and cold currents. Since some types of fish are likely to gather in certain sea temperature zones, the OLS composite image may provide useful information for the monitoring of fishing fleets as well as for marine resources management.
|
| [82] |
Fishing fleet lights and sea surface temperature distribution observed by DMSP/OLS sensor [J]. |
| [83] |
Nighttime images of the earth from space [J].https://doi.org/10.1038/scientificamerican0778-86 URL [本文引用: 1] 摘要
Not Available
|
| [84] |
Brazil's 2001 energy crisis monitored from space [J].https://doi.org/10.1080/01431160410001662220 URL [本文引用: 1] |
| [85] |
Night-time imagery as a tool for global mapping of socioeconomic parameters and greenhouse gas emissions [J].https://doi.org/10.1639/0044-7447(2000)029[0157:NTIAAT]2.0.CO;2 URL [本文引用: 1] 摘要
Night-time satellite imagery acquired between October 1994 and March 1995 is here exploited to derive economic and energy-related global maps. By considering the lit area of a city, and combining this with ancillary statistical information, an analysis was performed designed to investigate the potential of night-time imagery for quantitative estimation of global socioeconomic parameters. An attempt to estimate global urban population using correlations of lit area and urban populations to derive country-level relationships accounted for over 90% of the quoted total. Furthermore, the total lit area of a country has a statistically significant high correlation value with other parameters, specifically Gross Domestic Product (GDP) and total carbon dioxide ( CO2) emission. The new technique is limited by the spatial resolution of the sensor and the poorer correlation using night-time lights for centrally-planned economies. These findings offer great potential for synoptic global mapping of such parameters in the future.
|
| [86] |
Mapping regional economic activity from night-time light satellite imagery [J].https://doi.org/10.1016/j.ecolecon.2005.03.007 URL [本文引用: 1] 摘要
The recognition that the elements of the nthropocene play a critical role in global change processes means that datasets describing elements of the socio-economic environment are becoming increasingly more desirable. The ability to present these data in a gridded format as opposed to the traditionally reported administrative units is advantageous for incorporation with other environmental datasets. Night-time light remote sensing data has been shown to correlate with national-level figures of Gross Domestic Product (GDP). Night-time radiance data is analysed here along with regional economic productivity data for 11 European Union countries along with the United States at a number of sub-national levels. Night-time light imagery was found to correlate with Gross Regional Product (GRP) across a range of spatial scales. Maps of economic activity at 5 km resolution were produced based on the derived relationships. To produce these maps, certain areas had to be excluded due to their anomalously high levels of economic activity for the amount of total radiance present. These areas were treated separately from other areas in the map. These results provide the first detailed examination of night-time light characteristics with respect to local economic activity and highlight issues, which should be considered when undertaking such analysis.
|
| [87] |
Relation between satellite observed visible-near infrared emissions, population, economic activity and electric power consumption [J].https://doi.org/10.1080/014311697218485 URL [本文引用: 2] 摘要
The area lit by anthropogenic visible-near infrared emissions (i.e., lights) has been estimated for 21 countries using night-time data from the Defense Meteorological Satellite Program (DMSP) Operational Linescan System (OLS). The area lit is highly correlated to gross domestic product and electric power consumption. Significant outliers exist in the relation between area lit and population. The results indicate that the local level of economic development must be factored into the apportionment of population across the land surface based on DMSP-OLS observed lights.
|
| [88] |
DMSP/OLS estimation of tropical forest area impacted by surface fires in Roraima, Brazil: 1995 versus 1998 [J].https://doi.org/10.1080/01431160120888 URL [本文引用: 1] 摘要
A procedure has been developed to locate and estimate the area of heavy forest burning based on the frequency of DMSP-OLS (US Air Force Defense Meteorological Satellite Program Operational Linescan System) fire detection from time series of observations across the fire season. A calibration was developed for Roraima, Brazil, using Landsat Thematic Mapper (TM) data acquired near the end of the 1998 burn season and analysed to identify unburnt, partially burnt and heavily burnt forest areas. A fire detection frequency threshold of five nights was used to map heavily burnt forest using the 3 months of DMSP-OLS observations. The threshold of five fire detections, which could occur anytime during the 3-month time period, was selected to constrain errors of commission involving unburnt forest to 10% of the total area for unburnt forest in the calibration area. At this threshold setting the DMSP-OLS estimate of heavily burnt forest area covered 79% of the Landsat measured area. It was found that 77% of the 1998 heavily burnt forest area was outside of the state''s protected areas (national parks, reserves, indigenous areas). Two of the protected areas sustained a substantial increase in heavily burnt forest in 1998 relative to 1995 (Reserva Biologica Mucaja and Parque Ind gena Yanomami). The 1998 forest burning in these two areas was concentrated in their eastern-most sections. The core of the Yanomami area did not sustain extensive burning in 1998. Protected areas in the north-eastern section of the state, where forests are mixed with cerrado, had moderate increases in heavily burnt forest in 1998. Other protected areas were largely free of the heavy forest burning, which was concentrated to the west of the state''s primary cerrado zone.
|
| [89] |
Night-time lights of the world: 1994-1995 [J].https://doi.org/10.1016/S0924-2716(01)00040-5 URL [本文引用: 2] 摘要
The Defense Meteorological Satellite Program (DMSP) Operational Linescan System (OLS) has a unique low-light imaging capability developed for the detection of clouds using moonlight. In addition to moonlit clouds, the OLS also detects lights from human settlements, fires, gas flares, heavily lit fishing boats, lightning and the aurora. By analysing the location, frequency, and appearance of lights observed in an image time series, it is possible to distinguish four primary types of lights present at the earth's surface: human settlements, gas flares, fires, and fishing boats. We have produced a global map of the four types of light sources as observed during a 6-month time period in 1994 1995. We review a number of environmental applications that have been developed or proposed based on the night-time light data. We examine the relationship between area of lighting, population, economic activity, electric power consumption, and energy related carbon emissions for 200 nations, representing 99% of the world's population.
|
| [90] |
Global distribution and density of constructed impervious surfaces [J].https://doi.org/10.3390/s7091962 URL PMID: 3841857 [本文引用: 1] 摘要
We present the first global inventory of the spatial distribution and density ofconstructed impervious surface area (ISA). Examples of ISA include roads, parking lots,buildings, driveways, sidewalks and other manmade surfaces. While high spatialresolution is required to observe these features, the new product reports the estimateddensity of ISA on a one-km2 grid based on two coarse resolution indicators of ISA 01040000“ thebrightness of satellite observed nighttime lights and population count. The model wascalibrated using 30-meter resolution ISA of the USA from the U.S. Geological Survey.Nominally the product is for the years 2000-01 since both the nighttime lights andreference data are from those two years. We found that 1.05% of the United States landarea is impervious surface (83,337 km2) and 0.43 % of the world0104000064s land surface (579,703km2) is constructed impervious surface. China has more ISA than any other country(87,182 km2), but has only 67 m2 of ISA per person, compared to 297 m2 per person in theUSA. The distribution of ISA in the world0104000064s primary drainage basins indicates that watersheds damaged by ISA are primarily concentrated in the USA, Europe, Japan, China and India. The authors believe the next step for improving the product is to include reference ISA data from many more areas around the world.
|
| [91] |
A fifteen year record of global natural gas flaring derived from satellite data [J].https://doi.org/10.3390/en20300595 URL [本文引用: 1] |
| [92] |
Observations of the earth using nighttime visible imagery [J].https://doi.org/10.1117/12.935885 URL [本文引用: 1] 摘要
ABSTRACT The earth as viewed from space in visible light at night reveals some features not easily discernible during the day such as aurora, forest fires, city lights and gas flares. In addition, those features having a high albedo such as snow and ice can be identified on many moonlit nights nearly as well as they can in sunlight. The Air Force DMSP satellites have been operating in the visible wavelengths at night since the mid 1960s. Most all other satellites having optical sensors are incapable of imaging at night. Imaging systems having improved light sensitivity in the visible portion of the spectrum should be considered when planning future earth resources satellite missions in order to utilize nighttime as well as daytime visual observations.
|
| [93] |
Creating a global grid of distributed fossil fuel CO2 emissions from nighttime satellite imagery [J].https://doi.org/10.3390/en3121895 URL [本文引用: 1] |
| [94] |
Effects of urbanization on the aquatic fauna of the Line Creek Watershed, Atlanta: A satellite perspective [J].https://doi.org/10.1016/S0034-4257(03)00082-8 URL [本文引用: 1] 摘要
Impervious surface area (ISA) was derived for a period from 1979 to 1997 from Landsat MSS and TM data for the Line Creek watershed that lies to the south of the city of Atlanta, GA. The change in ISA is presented as an ecological indicator to examine the cumulative water resource impacts on mussel population in three sub-watersheds of Line Creek—namely, Line, Flat, and Whitewater creeks. The satellite analysis shows that ISA expansion occurred substantially from 1987 to 1997 and is predominantly in industrial, commercial, and shopping center (ICS) complexes but also in smaller lot-size residential development. Evidence of mussel habitat degradation is indicated and loss of species (in the region of 50 to 70%) is present in areas where ISA expansion is observed—specifically in ICS complex development in and around Peachtree City that drains directly into the Line and Flat creeks. This is in marked contrast to Whitewater Creek where overall development of ISA is less and no major loss of mussel species is observed.
|
| [95] |
Radiometric rectification: Toward a common radiometric response among multidate, multi-sensor images [J].https://doi.org/10.1016/0034-4257(91)90062-B URL [本文引用: 1] 摘要
A common radiometric response is required for quantitative analysis of multiple satellite images of a scene acquired on different dates with different sensors. We describe a technique to “radiometrically rectify” multiple Landsat images of a scene to a reference image, and evaluate it using a pair of Landsat 5 images acquired 2 years apart. All rectified images should appear as if they were acquired with the same sensor, while observing through the atmospheric and illumination conditions of the reference image. If atmospheric optical depth and sensor calibration date are available for the reference image, then an atmospheric correction algorithm may be used to correct all the rectified images to absolute surface reflectance. The “radiometric rectification” algorithm identifies “radiometric control sets,” i.e., sets of scene landscape elements with a mean reflectance which is expected to change little with time. The average digital count values of these radiometric control sets are used to calculate linear transforms relating digital count values between images. We evaluate the technique empirically with a pair of Landsat 5 TM images of a scene for which surface reflectance and atmospheric optical depth data are available. We also examine its performance under a wide range of atmospheric conditions using simulations based on atmospheric models. We find that the radiometric rectification algorithm performed well for the visible and near infrared bands, adjusting surface reflectance for the effects of relative atmospheric differences to within 1%. The performance is not as good for the midinfrared bands on TM. There are several possible causes for this; we could not determine which was the most important. We conclude from these studies that for scenes containing reflectance stable elements, radiometric rectification should be a useful alternative to atmospheric radiative transfer codes and sensor calibration approaches when reliable atmospheric optical depth data or calibration coefficients are not available. When atmospheric optical data and sensor calibration information are available for one of a sequence of radiometrically rectified images, an atmospheric radiative transfer code may be used to correct each image in the sequence to absolute surface reflectance.
|
| [96] |
Progress for stable artificial lights distribution extraction accuracy and estimation of electric power consumption by means of DMSP/OLS nighttime imagery [J]. |
| [97] |
International collaboration for the early damaged area estimation system using DMSP/OLS nighttime images [C]// |
| [98] |
Modeling the spatiotemporal dynamics of electric power consumption in Mainland China using saturation-corrected DMSP/OLS nighttime stable light data [J].https://doi.org/10.1080/17538947.2013.822026 URL [本文引用: 1] 摘要
Obtaining timely and accurate data on the spatiotemporal dynamics of electric power consumption (EPC) is crucial for the effective utilization of electric power in China. The Defense Meteorological Satellite Program's Operational Linescan System (DMSP/OLS) nighttime stable light (NSL) data have good potential for estimating EPC effectively at large scales. However, saturated lighted pixels contained within the NSL data limit the accuracy of EPC estimation. We developed a new method to correct the saturated lighted pixels, using the SPOT VEGETATION (SPOT/VGT) 10-day synthesis product (S10) normalized difference vegetation index (NDVI) data and then modeled the spatiotemporal dynamics of EPC in Mainland China from 2000 to 2008. The results demonstrated the reliability of our approach with an average R value of 0.93 (P<0.001) and an average relative error of 28.92%. EPC in Mainland China showed an average annual growth rate of 13.46% during the study period from 1198.23 billion kWh in 2000 to 3290.51 billion kWh in 2008. EPC in Mainland China also showed clear regional variation. Northern coastal China and eastern coastal China consumed 37.61% of the total EPC in Mainland China, with only 25.96% of the population and 6.11% of the area.
|
| [99] |
Restoring urbanization process in China in the 1990s by using non-radiance-calibrated DMSP/OLS nighttime light imagery and statistical data [J].https://doi.org/10.1007/s11434-006-2006-3 URL [本文引用: 2] 摘要
后来当前的行政基于单位的城市的陆地区域在足够的中国缺乏的统计数据空间信息,全体的都市化过程研究规模不能有效地被支持。在中国把统计数据基于当前的行政基于单位的城市的陆地区域,的一条新途径快速并且便宜地从 thenon-radiance-calibrated 防卫气象学的卫星 Program/ 运作的 Linescan 系统(DMSP/OLS ) 夜间光形象导出城市的陆地信息在这篇论文被介绍。与新途径,在在 1992, 1996 和 1998 的中国的城市的模式信息在中国与都市化过程被导出,在使用 non-radiance-calibrated DMSP/OLS 夜间形象恢复的 1990 年代。 Theaccuracy 评价基于统计数据证明在在国家规模的导出的全部的城市的陆地区域和统计数据之间的相对错误在 1996 和 1998 在 1992 ,和不到1%是不到2%,并且在省规模的最大的相对错误不与大多数省超过10%不到3%。另外,从高分辨率的 Landsat TM 形象导出的城市的模式与从 DMSP/ OLSdata 的那些相比。结果证明从 DMSP/OLS 导出的城市的模式特征与从有大约 80% 的全部的精确性的 TM 形象的那些是基本上重合的。因此,我们在在由使用非发光 DMSP/OLSnighttime 形象的 1990 年代的中国的恢复都市化过程能总体上在那时间在中国被相信并且能代表实际城市的发展,这能被看见。
|
| [100] |
Validation of urban boundaries derived from global night-time satellite imagery [J].https://doi.org/10.1080/01431160304982 URL [本文引用: 1] 摘要
Night-time imagery from the Defense Meteorological Satellite Program (DMSP) Operational Linescan System (OLS) has been proposed as a useful tool for monitoring urban expansion around the world, but determining appropriate light thresholds for delineating cities remains a challenge. In this paper we present a new approach. We used DMSP stable lights and radiance-calibrated images to delimit urban boundaries for San Francisco, Beijing and Lhasa, cities with different levels of urbanization and economic development, and compared the results against boundaries derived from high-resolution Landsat Thematic Mapper (TM) imagery. Unthresholded DMSP images exaggerate and shift the extent of these urban areas. We then calculated light thresholds that minimized the discrepancies between the DMSP- and TM-derived urban boundaries for each city. Our comparison highlights the difficulty of using DMSP data across areas with disparate urban characteristics, but suggests the possibility of calibrating this data source for monitoring growth of cities at comparable levels of development.
|
| [101] |
DMSP/OLS radiance calibrated nighttime lights time series with intercalibration [J].https://doi.org/10.3390/rs70201855 URL 摘要
The Defense Meteorological Satellite Program-Operational Linescan System (DMSP-OLS) stable lights products are made using operational OLS data collected at high gain settings, resulting in sensor saturation on brightly lit areas, such as city centers. This has been a paramount shortcoming of the DMSP-OLS stable lights time series. This study outlines a methodology that greatly expands the dynamic range of the OLS data using observations made at different fixed-gain settings, and by incorporating the areas not affected by saturation from the stable lights product. The radiances for the fixed-gain data are computed based on each OLS sensor pre-flight calibration. The result is a product known as the OLS radiance calibrated nighttime lights. A total of eight global datasets have been produced, representing years from 1996 to 2010. To further facilitate the usefulness of these data for time-series analyses, corrections have been made to counter the sensitivity differences of the sensors, and coefficients are provided to adjust the datasets to allow inter-comparison.
|
| [102] |
Using nighttime DMSP/OLS images of city lights to estimate the impact of urban land use on soil resources in the United States [J].https://doi.org/10.1016/S0034-4257(96)00110-1 URL [本文引用: 1] 摘要
Abstract Nightime “city light” footprints derived from DMSP/OLS satellite images were merged with census data and a digital soils map in a continental-scale test of a remote sensing and geographic information system methodology for approximating the extent of built-up land and its potential impact on soil resources in the United States. Using image processing techniques and census data, we generated maps where the “city lights” class represented mean population densities of 947 persons km612 and 392 housing units km612, areas clearly not available to agriculture. By our analysis, such “city lights” representing urban areas accounted for 2.7% of the surface area in the United States, an area approximately equal to the State of Minnesota or one half the size of California. Using the UN/FAO Fertility Capability Classification System to rank soils, results for the United States show that development appears to be following soil resources, with the better agricultural soils being the most urbanized. Some unique soil types appear to be on the verge of being entirely coopted by “urban sprawl.” Urban area figures derived from the DMSP/OLS imagery compare well to those derived from statistical sources. Further testing and refinement of the methodology remain but the technique shows promise for possible extension to global evaluations of urbanization, population and even global productivity.
|
| [103] |
Use of nighttime visible images to detect Japanese common squid todarodes Pacificus fishing areas and potential migration routes in the Sea of Japan [J].https://doi.org/10.3354/meps276173 URL [本文引用: 1] |
| [104] |
Early damaged area estimation system using DMSP/OLS night-time imagery [J].https://doi.org/10.1080/01431160310001595033 URL [本文引用: 1] 摘要
The disaster information system, the Early Damaged Area Estimation System (EDES), was developed to estimate damaged areas of natural disaster using the night-time imagery of the Defense Meteorological Satellite Program Operational Linescan System (DMSP-OLS). The system employs two estimation methods to detect the city lights loss or reduction as possible impacted areas; one is the bi-temporal images (BTI) method and the other is the time-series images (TSI) method. Both methods are based on significance tests assuming that brightness of city lights fluctuates as normal random variables, and the BTI method is simplified by introducing the assumption that the standard deviation of city lights fluctuation is constant. The validity of the estimation method is discussed based on the result of the application to the 2001 Western India earthquake disaster. The estimation results identify the damaged areas distant from the epicentre fairly well, especially when using the TSI method. The system is designed to estimate the global urban damage and to provide geographic information through the Internet within 24 after a severe disaster event. The information is expected to support the disaster response and relief activities of governments and non-governmental organizations.
|
| [105] |
The status of agricultural lands in Egypt: The use of multitemporal NDVI features derived from Landsat TM [J].https://doi.org/10.1016/0034-4257(95)00152-2 URL [本文引用: 1] |
| [106] |
A saturated light correction method for DMSP/OLS nighttime satellite imagery [J].https://doi.org/10.1109/TGRS.2011.2178031 URL [本文引用: 1] 摘要
Several studies have clarified that electric power consumption can be estimated from the Defense Meteorological Satellite Program/Operational Linescan System (DMSP/OLS) stable light imagery. As digital numbers (DNs) of stable light images are often saturated in the center of city areas, we developed a saturated light correction method for the DMSP/OLS stable light image using the nighttime radiance calibration image of the DMSP/OLS. The comparison between the nonsaturated part of the stable light image for 1999 and the radiance calibration image for 1996-1997 in major areas of Japan showed a strong linear correlation (R2 = 92.73) between the DNs of both images. Saturated DNs of the stable light image could therefore be corrected based on the correlation equation between the two images. To evaluate the new saturated light correction method, a regression analysis is performed between statistic data of electric power consumption from lighting and the cumulative DNs of the stable light image before and after correcting for the saturation effects by the new method, in comparison to the conventional method, which is, the cubic regression equation method. The results show a stronger improvement in the determination coefficient with the new saturated light correction method (R2 = 0.91, P = 1.7 10-6 <; 0.05) than with the conventional method (R2 = 0.81, P = 2.6 10-6 <; 0.05) from the initial correlation with the uncorrected data (R2 = 0.70, P = 4.5 10-6 <; 0.05). The new method proves therefore to be very efficient for saturated light correction.
|
| [107] |
Estimating the energy consumption with nighttime city light from the DMSP/OLS imagery [C]// |
| [108] |
Estimating energy consumption from night-time DMPS/OLS imagery after correcting for saturation effects [J].https://doi.org/10.1080/01431160903277464 URL [本文引用: 1] 摘要
A methodology is presented to accurately estimate electric power consumption from saturated night-time Defense Meteorological Satellite Program (DMSP) Operational Linescan System (OLS) imagery using a stable light correction. An area correction for the stable light image of DMSP/OLS for the year 1999 was performed and the build-up area rate data were used to clarify the intensity distribution characteristics of the stable light. Based on the spatial distribution characteristics of the stable light, the saturation light of the electric power supply area of Japan was corrected using a cubic regression equation. The regression between the correction calculations by the cubic regression equation and the statistical electric power consumption data was applied in Japan and also in China, India and 10 other Asian countries. The correction method was then evaluated. This study confirms that electric power consumption can be estimated with high precision from the stable light.
|
| [109] |
Comparison and analysis of MODIS NDVI and MODIS EVI [J]. |
| [110] |
Satellite-Observed nighttime light variation as evidence for global armed conflicts [J].https://doi.org/10.1109/JSTARS.2013.2241021 URL [本文引用: 1] 摘要
The objective of this research is to investigate the potential of nighttime light images, acquired with Defense Meteorological Satellite Program Operational Linescan System (DMSP-OLS), in evaluating global armed conflicts. To achieve this purpose, we assessed the relationship between armed conflicts and the satellite-observed nighttime light variation over 159 countries through annual composites of the nighttime light images. Firstly, a light ratio index was developed to reduce the data inconsistency of annual nighttime light images during 1992-2010. Then 12 countries were selected as examples for a primary investigation, and we found the outbreak of a war can reduce the light and the ceasefire can increase the light from the remote sensing images, which indicates armed conflict events always have significant impact on the nighttime light. Based on this assertion, a nighttime light variation index (NLVI) was developed to quantify the variation of the time series nighttime light. Then using conditional probability analysis, the probability of a country suffering from armed conflicts increases with increase of NLVI. Particularly, when the NLVI value is in a very high level as defined, 80% of the countries have experienced armed conflicts. Furthermore, using correlation analysis, the number of global armed conflicts is highly correlated with the global NLVI in temporal dimension, with a correlation coefficient larger than 0.77. In summary, the potential of nighttime light images in armed conflict evaluation is extended from a regional scale to a global scale by this study.
|
| [111] |
Automatic intercalibration of night-time light imagery using robust regression [J].https://doi.org/10.1080/2150704X.2012.687471 URL 摘要
In remote-sensing community, radiometric calibration of night-time light images has long been a problem, hindering change detection of images in different dates. Currently, an intercalibration model is regarded as the unique solution for the problem, but prior knowledge is needed to extract reference pixels with stable lights, which are hard to obtain in most of the applications. This study proposed an automatic algorithm to extract the reference pixels for convenient use of the intercalibration model, with an assumption that there are sufficient pixels with stable night-time lights in the multi-temporal images. To automatically extract the stable pixels from images in two dates, all pixels in the two dates were entered into a linear regression model, and the outliers viewed as suspected changed pixels were discarded iteratively. Consequently, some stable pixels were extracted and the intercalibration model was implemented. Annual night-time light composites in Beijing, China, from 1992 to 2010 were taken as the study material, and the results show that the multi-temporal calibrated night-time light data have higher correlation with gross domestic production (GDP) (R 265=650.8734) and urban population (UP) (R 265=650.9269) than those of the uncalibrated images (with the R 2 values 0.7963 and 0.8575, respectively). Furthermore, the data inconsistency from different night-time light satellites in the same year was reduced with the proposed algorithm. The results demonstrate that the proposed algorithm is effective in intercalibrating the Defense Meteorological Satellite Program's Operational Linescan System (DMSP-OLS) images automatically.
|
| [112] |
Detecting Zimbabwe's decadal economic decline using nighttime light imagery [J].https://doi.org/10.3390/rs5094551 URL |
| [113] |
Can night-time light images play a role in evaluating the Syrian Crisis? [J].https://doi.org/10.1080/01431161.2014.971469 URL 摘要
This study investigates whether night-time light images acquired from the Defense Meteorological Satellite Program Operational Linescan System provide spatial and temporal insight with regard to the humanitarian aspects of the Syrian crisis. Evaluating the ongoing crisis in Syria is challenging since reliable witness reports are hard to gather in a war zone. Therefore satellite images, as one of the few sources of objective information, are potentially of great importance. We used 38 monthly Defense Meteorological Satellite Program Operational Linescan System composites covering the period between January 2008 and February 2014. The results indicate that night-time light and lit area in Syria declined by about 74% and 73%, respectively, between March 2011 and February 2014. In 12 of 14 provinces, night-time light declined by >60%. Damascus and Quneitra are the exceptions, with night-time light having declined only by about 35%. Notably, the number of internally displaced persons (IDPs) of each province shows a linear correlation with night-time light loss, with an R2 value of 0.52. Through clustering the time series images, we found that the international border of Syria represents a distinct boundary between regions of differing night-time light spatiotemporal patterns. The contrast across the border increases as the region studied encompasses a wider zone on either side of the border. These findings lend support to the hypothesis that night-time light can be a useful source for monitoring humanitarian crises such as that unfolding in Syria.
|
| [114] |
Potential of NPP/VIIRS nighttime light imagery for modeling the regional economy of China [J].https://doi.org/10.3390/rs5063057 URL |
| [115] |
A new urban index for expressing inner-city patterns based on MODIS LST and EVI regulated DMSP/OLS NTL [J].
With the rapid pace of urban expansion, comprehensively understanding urban spatial patterns, built environments, green-spaces distributions, demographic distributions, and economic activities becomes more meaningful. Night Time Lights (NTL) images acquired through the Operational Linescan System of the US Defense Meteorological Satellite Program (DMSP/OLS NTL) have long been utilized to monitor urban areas and their expansion characteristics since this system detects variation in NTL emissions. However, the pixel saturation phenomenon leads to a serious limitation in mapping luminance variations in urban zones with nighttime illumination levels that approach or exceed the pixel saturation limits of OLS sensors. Consequently, we propose an NTL-based city index that utilizes the Moderate-resolution Imaging Spectroradiometer (MODIS) Land Surface Temperature (LST) and Enhanced Vegetation Index (EVI) images to regulate and compensate for desaturation on NTL images acquired from corresponding urban areas. The regulated results achieve good performance in differentiating central business districts (CBDs), airports, and urban green spaces. Consequently, these derived imageries could effectively convey the structural details of urban cores. In addition, compared with the Vegetation Adjusted NTL Urban Index (VANUI), LST-and-EVI-regulated-NTL-city index (LERNCI) reveals superior capability in delineating the spatial structures of selected metropolis areas across the world, especially in the large cities of developing countries. The currently available results indicate that LERNCI corresponds better to city spatial patterns. Moreover, LERNCI displays a remarkably better oodness-of-fit correspondence with both the Version 1 Nighttime Visible Infrared Imaging Radiometer Suite Day/Night Band Composite (NPP/VIIRS DNB) data and the WorldPop population-density data compared with the VANUI imageries. Thus, LERNCI can act as a helpful indicator for differentiating and classifying regional economic activities, population aggregations, and energy-consumption and city-expansion patterns. LERNCI can also serve as a valuable auxiliary reference for decision-making processes that concern subjects such as urban planning and easing the central functions of metropolis.
|
| [116] |
Extracting the dynamics of urban expansion in China using DMSP/OLS nighttime light data from 1992 to 2008 [J].https://doi.org/10.1016/j.landurbplan.2012.02.013 URL 摘要
Timely and accurate information about the dynamics of urban expansion is vital to reveal the relationships between urban expansion and the ecosystem, to optimize land use patterns, and to promote the effective development of cities in China. Nighttime stable light data from the Defense Meteorological Satellite Program's Operational Line-scan System (DMSP-OLS) Nighttime Lights Time Series dataset provide a new source of information that can quickly reveal the dynamics of urban expansion. However, the DMSP-OLS sensor has no on-board calibration, which makes it difficult to directly compare time series data from multiple satellites. This study developed a new method for systematically correcting multi-year multi-satellite nighttime stable lights data and rapidly extracting the dynamics of urban expansion based on this corrected data for China from 1992 to 2008. The results revealed that the proposed method effectively reduced abnormal discrepancy within the nighttime stable light data and improved continuity and comparability. The dynamics of urban expansion in China from 1992 to 2008 were extracted with an average overall accuracy of 82.74% and an average Kappa of 0.40.
|
| [117] |
Modeling the population of China using DMSP operational linescan system nighttime data [J]. |
| [118] |
Regional mapping of human settlements in Southeastern China with multi-sensor remotely sensed data [J].https://doi.org/10.1016/j.rse.2008.05.009 URL [本文引用: 2] 摘要
Mapping human settlements from remotely sensed data at regional and global scales has attracted increasingly attention but remains a challenge. The thresholding technique is a common approach for settlement mapping based on the DMSP-OLS data. However, this approach often omits the areas with small proportional settlements such as towns and villages and overestimates urban extents, resulting in information loss of spatial patterns. This paper explored an integrated approach based on a combined use of multiple remotely sensed data to map settlements in southeastern China. Human settlements for selected sites were mapped from Landsat ETM+ images with a hybrid approach and they were used as reference data. The DMSP-OLS and Terra MODIS NDVI data were combined to develop a settlement index image. This index image was used to map a pixel-based settlement image with expert rules. A regression model was established to estimate fractional settlements at the regional scale, which the DMSP-OLS and MODIS NDVI data were used as independent variables and the settlement data derived from ETM+ images were used as a dependent variable. This research indicated that a combination of DMSP-OLS and NDVI variables provided a better estimation performance than single DMSP-OLS or NDVI variable, and the integrated approach for settlement mapping at the regional scale was promising. Compared to the results from the traditional thresholding technique, the estimated fractional settlement image in this paper greatly improved the spatial patterns of settlement distribution and accuracy of settlement areas. This paper provided a rapid and accurate approach to estimate fractional settlements from coarse spatial resolution images at the regional scale by combining a limited number of medium spatial resolution images. This research is especially valuable for timely updating settlement databases at regional and global scales with limited time, labor, and cost.
|
| [119] |
Evaluating saturation correction methods for DMSP/OLS nighttime light data: A case study from China's cities [J].https://doi.org/10.3390/rs6109853 URL [本文引用: 1] 摘要
Remotely sensed nighttime lights (NTL) datasets derived from the Defense Meteorological Satellite Program Operational Linescan System (DMSP/OLS) have been identified as a good indicator of the urbanization process and have been widely used to study such demographic and economic variables as population distribution and density, electricity consumption, and carbon emission. However, one issue must be considered in the application of NTL data, i.e., saturation in the bright cores of urban centers. In this study, we evaluate four correction methods in China cities: the linear regression model and the cubic regression model at the regional level, and the Human Settlement Index (HSI) and the Vegetation Adjusted NTL Urban Index (VANUI) at a pixel level. The results suggest that both correction methods at the regional level improve the correlation between NTL data and socioeconomic variables. However, since the methods can only be used on saturated pixels, the correction effects are limited, as the saturated area in Chinese cities is rather small. HSI and VANUI increase the inter-urban variability within certain cities, especially when their vegetation health and abundance is negatively correlated with NTL. However, the indices may induce bias when applied in a large region with a diverse natural environment and vegetation, and the application of HSI with a relatively high sensitivity of HSI to NDVI may be limited as NTL approaches maximum. Proper methods for reducing saturation effects should thus vary with different study areas and research purposes.
|
| [120] |
Night-time light derived estimation of spatio-temporal characteristics of urbanization dynamics using DMSP/OLS satellite data [J].https://doi.org/10.1016/j.rse.2014.11.022 URL 摘要
61Quadratic curve is used for partitioning DMSP/OLS images at a local urban scale.61Different types of night light show diverse trends in multi-scale urban processes.61Type transitions in night light imagery show geographically explicit features.
|
| [121] |
Partially supervised classification of remote sensing images through SVM-based probability density estimation [J].https://doi.org/10.1109/TGRS.2004.842022 URL [本文引用: 1] 摘要
A general problem of supervised remotely sensed image classification assumes prior knowledge to be available for all the thematic classes that are present in the considered dataset. However, the ground-truth map representing that prior knowledge usually does not really describe all the land-cover typologies in the image, and the generation of a complete training set often represents a time-consuming, difficult and expensive task. This problem affects the performances of supervised classifiers, which erroneously assign each sample drawn from an unknown class to one of the known classes. In the present paper, a classification strategy is described that allows the identification of samples drawn from unknown classes through the application of a suitable Bayesian decision rule. The proposed approach is based on support vector machines (SVMs) for the estimation of probability density functions and on a recursive procedure to generate prior probability estimates for known and unknown classes. In the experiments, both a synthetic dataset and two real datasets were used.
|
| [122] |
Estimating CO2, (carbon dioxide) emissions at urban scales by DMSP/OLS (Defense Meteorological Satellite Program's Operational Linescan System) nighttime light imagery: Methodological challenges and a case study for China [J].https://doi.org/10.1016/j.energy.2014.04.103 URL [本文引用: 1] 摘要
61We develop a top-down method to estimate the CO2 emissions at an urban scale.61The proposed method is particularly significant for the developing counties.61This method has limited value in urban areas with rare population.61Both the share of urban CO2 emissions and per capita emissions in China have increased.
|
| [123] |
Assessing the impact of urban land development on net primary productivity in the southeastern United States [J].https://doi.org/10.1016/S0034-4257(03)00081-6 URL [本文引用: 1] 摘要
The southeastern United States (SE-US) has undergone one of the highest rates of landscape changes in the country due to changing demographics and land use practices over the last few decades. Increasing evidence indicates that these changes have impacted mesoscale weather patterns, biodiversity and water resources. Since the Southeast has one of the highest rates of land productivity in the nation, it is important to monitor the effects of such changes regularly. Here, we propose a remote sensing based methodology to estimate regional impacts of urban land development on ecosystem structure and function. As an indicator of ecosystem functioning, we chose net primary productivity (NPP), which is now routinely estimated from the MODerate resolution Imaging Spectroradiometer (MODIS) data. We used the MODIS data, a 1992 Landsat-based land cover map and nighttime data derived from the Defense Meteorological Satellite Program's Operational Linescan System (DMSP/OLS) for the years 1992/1993 and 2000 to estimate the extent of urban development and its impact on NPP. The analysis based on the nighttime data indicated that in 1992/1993, urban areas amounted to 4.5% of the total land surface of the region. In the year 2000, the nighttime data showed an increase in urban development for the southeastern United States of 1.9%. Estimates derived from the MODIS data indicated that land cover changes due to urban development that took place during the 1992 2000 period reduced annual NPP of the southeastern United States by 0.4%. Despite the uncertainties in sensor fusion and the coarse resolution of the data used in this study, results show that the combination of MODIS products such as NPP with nighttime data could provide rapid assessment of urban land cover changes and their impacts on regional ecosystem resources.
|
| [124] |
Detection of rural electrification in Africa using DMSP-OLS night lights imagery [J].https://doi.org/10.1080/01431161.2013.833358 URL [本文引用: 1] 摘要
We report on the first systematic ground-based validation of the US Air Force Defense Meteorological Satellite Program Operational Linescan System (DMSP-OLS) night lights imagery to detect rural electrification in the developing world. Drawing upon a unique survey of villages in Senegal and Mali, this study compares night-time light output from the DMSP-OLS against ground-based survey data on electricity use in 232 electrified villages and additional administrative data on 899 unelectrified villages. The analysis reveals that electrified villages are consistently brighter than unelectrified villages across annual composites, monthly composites, and a time series of nightly imagery. Electrified villages appear brighter because of the presence of streetlights, and brighter villages tend to have more streetlights. By contrast, the correlation of light output with household electricity use and access is low. We further demonstrate that a detection algorithm using data on night-time light output and the geographic location of settlements can accurately classify electrified villages. This research highlights the potential to use night lights imagery for the planning and monitoring of ongoing efforts to connect the 1.4 billion people who lack electricity around the world.
|
| [125] |
Urbanization, flood frequency, and salmon abundance in Puget lowland streams [J].https://doi.org/10.1111/j.1752-1688.1997.tb03553.x URL [本文引用: 1] 摘要
ABSTRACT: Urbanization history and flood frequencies were determined in six low-order streams in the Puget Lowlands, Washington, for the period between the 1940150s and the 1980190s. Using discharge records from USGS gauging stations, each basin was separated into periods prior to and after urban expansion. Four of the study basins exhibited significant changes in urbanized area, whereas two of the study basins exhibited only limited change in urbanized area and effectively serve as control basins. Each of the basins that experienced a significant increase in urbanized area exhibited increased flood frequency; pre-urbanization 10-year recurrence interval discharges correspond to 1 to 4-year recurrence interval events in post-urbanization records. In contrast, no discernible shift in flood frequency was observed in either of the control basins. Spawner survey data available for three of the study basins reveal systematic declines in salmon abundance in two urbanizing basins and no evidence for decreases in a control basin. These data imply a link between ongoing salmon population declines and either increased flood frequency or associated changes in habitat structure.
|
| [126] |
Monitoring urbanization dynamics in India using DMSP/OLS night time lights and SPOT-VGT data [J].https://doi.org/10.1016/j.jag.2012.11.005 URL 摘要
India is a rapidly urbanizing country and has experienced profound changes in the spatial structure of urban areas. This study endeavours to illuminate the process of urbanization in India using Defence Meteorological Satellites Program - Operational Linescan System (DMSP-OLS) night time lights (NTLs) and SPOT vegetation (VGT) dataset for the period 1998-2008. Satellite imagery of NTLs provides an efficient way to map urban areas at global and national scales. DMSP/OLS dataset however lacks continuity and comparability; hence the dataset was first intercalibrated using second order polynomial regression equation. The intercalibrated dataset along with SPOT-VGT dataset for the year 1998 and 2008 were subjected to a support vector machine (SVM) method to extract urban areas. SVM is semi-automated technique that overcomes the problems associated with the thresholding methods for NTLs data and hence enables for regional and national scale assessment of urbanization. The extracted urban areas were validated with Google Earth images and global urban extent maps. Spatial metrics were calculated and analyzed state-wise to understand the dynamism of urban areas in India. Significant changes in urban proportion were observed in Tamil Nadu, Punjab and Kerala while other states also showed a high degree of changes in area wise urban proportion.
|
| [127] |
Comparative evaluation of relative calibration methods for DMSP/OLS nighttime lights [J].https://doi.org/10.1016/j.rse.2017.04.011 URL [本文引用: 1] 摘要
With over two decades of historical observations, DMSP/OLS nighttime lights (NTL) are an invaluable asset for monitoring, characterizing, and understanding human activity. Due to the lack of on-board calibration, there are systematic biases in NTL data. Consequently, a key deterrent to the use of the entire NTL archive is the difficulty in generating a consistent NTL time series. Currently, there are a number of methods to calibrate NTL data in order to generate a consistent time series. However, there is no systematic evaluation of the performances of these calibration efforts. The purpose of this paper is to compare and evaluate existing calibration methods and to provide guidance to NTL end users on their relative strengths and weaknesses. We apply two widely adopted criteria to assess the performance of the methods: a) systematic bias minimization, and b) relation with ancillary socio-economic data on economic activity and electricity consumption. Our results show that global-scale calibration methods outperform regionally-based calibration methods. Furthermore, inconsistencies, in the form of differences in pixel values from two satellites of the same region and year, continue to exist in NTL data even after the calibration methods are applied, both across regions and across scales. We find that dimly lit regions are more difficult to calibrate compared to brightly lit regions and that inconsistencies persist in higher northern and lower southern latitudes. We conclude that significant improvements in calibration results will require a shift either towards absolute correction methods using in-situ data or relative calibration methods using NTL from VIIRS.
|
| [128] |
Analysis of urban land cover and population density in the united states [J]. |
| [129] |
Regional variations in spatial structure of nightlights, population density and fossil-fuel CO2 emissions [J].https://doi.org/10.1016/j.enpol.2009.08.021 URL [本文引用: 1] 摘要
We evaluate the joint use of satellite-observed intensity of urban nightlights and census-based population density data as constraints on the spatial structure of CO 2 emissions from fossil fuels. Findings are: (1) the probability that population density exceeds a given value follows a power-law distribution over two orders of magnitude of population density, encompassing the 40% of the global population at the highest densities. (2) The corresponding probability distribution for nightlights intensity also follows a power-law, departing near instrumental saturation. (3) Assuming that the true nightlights intensity distribution follows the power-law above instrumental saturation, we obtain a correction for saturation errors in the nightlights data. The amplification of nightlights intensity required to correct for saturation errors is estimated to be a factor of 1.15-1.23 globally and much greater in regions with high nightlights intensities. (4) Correcting for saturation, we observe clear empirical relationships between nightlights intensity and areal densities of energy consumption, fossil-fuel emissions and economic activity, holding throughout the development spectrum. (5) We indicate how these relationships underpin a fossil-fuel data assimilation system (FFDAS) for estimating fossil-fuel CO 2 emissions. [All rights reserved Elsevier].
|
| [130] |
Evaluation of NPP/VIIRS night-time light composite data for extracting built-up urban areas [J].https://doi.org/10.1080/2150704X.2014.905728 URL [本文引用: 1] 摘要
Observation of nighttime light is the representative method for monitoring human activities using satellite remote sensing. The Visible Infrared Imaging Radiometer Suite (VIIRS) sensor on the Suomi National Polar-orbiting Partnership (NPP) Satellite observes nighttime light at higher spatial resolution and with higher radiometric accuracy than the Defense Meteorological Satellite Program's... [Show full abstract]
|
| [131] |
Exploring spatiotemporal patterns of electric power consumption in countries along the Belt and Road [J].https://doi.org/10.1016/j.energy.2018.03.020 URL [本文引用: 1] |
| [132] |
Evaluating the ability of NPP/VIIRS nighttime light data to estimate the gross domestic product and the electric power consumption of China at multiple scales: A comparison with DMSP/OLS data [J].https://doi.org/10.3390/rs6021705 URL [本文引用: 1] |
| [133] |
Estimation of urban vegetation abundance by spectral mixture analysis [J].https://doi.org/10.1080/01431160151144369 URL [本文引用: 1] 摘要
The spatio-temporal distribution of vegetation is a fundamental component of the urban environment that can be quantified using multispectral imagery. However, spectral heterogeneity at scales comparable to sensor resolution limits the utility of conventional hard classification methods with multispectral reflectance data in urban areas. Spectral mixture models may provide a physically based solution to the problem of spectral heterogeneity. The objective of this study is to examine the applicability of linear spectral mixture models to the estimation of urban vegetation abundance using Landsat Thematic Mapper (TM) data. The inherent dimensionality of TM imagery of the New York City area suggests that urban reflectance measurements may be described by linear mixing between high albedo, low albedo and vegetative endmembers. A three-component linear mixing model provides stable, consistent estimates of vegetation fraction for both constrained and unconstrained inversions of three different endmember ensembles. Quantitative validation using vegetation abundance measurements derived from high-resolution (2 m) aerial photography shows agreement to within fractional abundances of 0.1 for vegetation fractions greater than 0.2. In contrast to the Normalised Difference Vegetation Index (NDVI), vegetation fraction estimates provide a physically based measure of areal vegetation abundance that may be more easily translated to constraints on physical quantities such as vegetative biomass and evapotranspiration.
|
| [134] |
Spatial analysis of global urban extent from DMSP/OLS night lights [J].https://doi.org/10.1016/j.rse.2005.02.002 URL [本文引用: 1] 摘要
Previous studies of DMSP-OLS stable night lights have shown encouraging agreement between temporally stable lighted areas and various definitions of urban extent. However, these studies have also highlighted an inconsistent relationship between the actual lighted area and the boundaries of the urban areas considered. Applying detection frequency thresholds can reduce the spatial overextent of lighted area ( looming ) but thresholding also attenuates large numbers of smaller lights and significantly reduces the information content of the night lights datasets. Spatial analysis of the widely used 1994/1995 stable lights data and the newly released 1992/1993 and 2000 stable lights datasets quantifies the tradeoff between blooming and attenuation of smaller lights. For the 1992/1993 and 2000 datasets, a 14% detection threshold significantly reduces blooming around large settlements without attenuating many individual small settlements. The corresponding threshold for the 1994/1995 dataset is 10%. The size requency distributions of each dataset retain consistent shapes for increasing thresholds while the size rea distributions suggest a quasi-uniform distribution of lighted area with individual settlement size between 10 and 1000 km equivalent diameter. Conurbations larger than 80 km diameter account for < 1% of all settlements observed but account for about half the total lighted area worldwide. Area/perimeter distributions indicate that conurbations become increasingly dendritic as they grow larger. Comparison of lighted area with built area estimates from Landsat imagery of 17 cities shows that lighted areas are consistently larger than even maximum estimates of built areas for almost all cities in every light dataset. Thresholds > 90% can often reconcile lighted area with built area in the 1994/1995 dataset but there is not one threshold that works for a majority of the 17 cities considered. Even 100% thresholds significantly overestimate built area for the 1992/1993 and 2000 datasets. Comparison of lighted area with blooming extent for 10 lighted islands suggests a linear proportionality of 1.25 of lighted to built diameter and an additive bias of 2.7 km. While more extensive analyses are needed, a linear relationship would be consistent with a physical model for atmospheric scattering combined with a random geolocation error. A Gaussian detection probability model is consistent with an observed sigmoid decrease of detection frequency for settlements < 10 km diameter. Taken together, these observations could provide the basis for a scale-dependent blooming correction procedure that simultaneously reduces geolocation error and scattering induced blooming.
|
| [135] |
China's 19-year city-level carbon emissions of energy consumptions, driving forces and regionalized mitigation guidelines [J].https://doi.org/10.1016/j.rser.2014.04.015 URL 摘要
Due to the lack of city-level energy consumption statistics and the inconsistency between national, provincial and city-level data, we developed a normalized approach for assessing China07s city-level CO2 emissions of energy consumptions using DMSP/OLS nighttime light imageries and explored major driving forces for proposing feasible mitigation policies. China07s CO2 emission process was always consistent with its economic development and was classified into two rapid periods (1999–2002 and 2007–2010) and two slow periods (1992–1999 and 2002–2007). Most cities in Western, Central and Northern China belonged to the slow growth type, while most cities in Eastern China belonged to the rapid growth type. Cities with huge CO2 emissions mainly congregated in southern and eastern coastal areas. Contrarily, cities with small amount of CO2 emissions were mainly located in southwestern inlands. The CO2 emission per capita (PCCE) in Northeastern and Eastern China was higher than that of Western and Central China. While the CO2 emission per GDP (PGCE) of Northeastern and Western China was higher than that of Eastern and Central China. GDP increment was the major factor determining the carbon-emission growth rate, while industry structures and energy efficiencies were the major factors influencing regional CO2 emission intensities. Therefore, in order to decrease the growth rate of China07s CO2 emissions but not hinder its economic development, major efforts should be focused on optimizing the industrial structures in Eastern and Central China where industries mainly belonged to technology-intensive, labor-intensive and light industry types, and guiding companies to increase the energy efficiencies in Northeastern and Western China, where industries mainly belonged to heavy and energy-related types. In particular, more attention should be paid to prevent the CO2 emissions per energy consumption (PECE) of underdeveloped cities or provinces from increasing rapidly rather than only focusing on reducing the PECE of developed regions.
|
| [136] |
Modeling population density with night-time satellite imagery and GIS [J].https://doi.org/10.1016/S0198-9715(97)01005-3 URL [本文引用: 3] 摘要
Night-time satellite imagery, as provided by the Defense Meteorological Satellite Program's Operational Linescan System (DMSP OLS), shows promise as a proxy measurement of urban extent. Earlier efforts have shown that the areas of contiguous saturated DMSP OLS images show strong correlations with the total population living in those areas. This paper describes efforts at modeling the population density within the urban areas identified within the continental United States. These efforts build upon the previous efforts of Clark, Berry, Nordbeck, Tobler and others to describe the variation of population density within cities. The method described herein differs from the aforementioned theories because it operates from the edges of the urban areas rather than attempting to identify a center of the urban cluster. By measuring distance from the edge rather than the distance from the center this method allows for the multiple nuclei of urban clustering that have clearly manifested as a result of the conurbation of urban centers within the U.S.A. This paper describes the methods used to allocate population to one, two, three, five, and ten square kilometer pixels for the continental U.S.A. Several urban population decay functions are applied and evaluated. In addition, an empirical urban population density decay function is derived for all the urban clusters defined by the DMSP imagery.
|
| [137] |
A Comparison of Nighttime Satellite Imagery and Population Density for the Continental United States [J].
|
| [138] |
Census from heaven: An estimate of the global human population using night-time satellite imagery [J].https://doi.org/10.1080/01431160010007015 URL [本文引用: 1] 摘要
Night-time satellite imagery provided by the Defense Meteorological Satellite Program''s Operational Linescan System (DMSP OLS) is evaluated as a means of estimating the population of all the cities of the world based on their areal extent in the image. A global night-time image product was registered to a dataset of 2000 known city locations with known populations. A relationship between areal extent and city population discovered by Tobler and Nordbeck is identified on a nation by nation basis to estimate the population of the 22 920 urban clusters that exist in the night-time satellite image. The relationship between city population and city areal extent was derived from 1597 city point locations with known population that landed in a ''lit'' area of the image. Due to conurbation, these 1597 cities resulted in only 1383 points of analysis for performing regression. When several cities fell into one ''lit'' area their populations were summed. The results of this analysis allow for an estimate of the urban population of every nation of the world. By using the known percent of population in urban areas for every nation a total national population was also estimated. The sum of these estimates is a total estimate of the global human population, which in this case was 6.3 billion. This is fairly close to the generally accepted contemporaneous (1997) estimate of the global population which stood at approximately 5.9 billion.
|
| [139] |
Global estimates of market and non-market values derived from nighttime satellite imagery, land cover, and ecosystem service valuation [J].https://doi.org/10.1016/S0921-8009(02)00097-6 URL [本文引用: 1] 摘要
We estimated global marketed and non-marketed economic value from two classified satellite images with global coverage at 1 km 2 resolution. GDP (a measure of marketed economic output) is correlated with the amount of light energy (LE) emitted by that nation as measured by nighttime satellite images. LE emitted is more spatially explicit than whole country GDP, may (for some nations or regions) be a more accurate indicator of economic activity than GDP itself, can be directly observed, and can be easily updated on an annual basis. As far as we know, this is the first global map of estimated economic activity produced at this high spatial resolution (1 km 2). Ecosystem services product (ESP) is an important type of non-marketed value. ESP at 1 km 2 resolution was estimated using the IGBP land-cover dataset and unit ecosystem service values estimated by Costanza et al. [Valuing Ecosystem Services with Efficiency, Fairness and Sustainability as Goals. Nature's Services, Island Press, Washington DC, pp. 49 70]. The sum of these two (GDP+ESP)=SEP is a measure of the subtotal ecological conomic product (marketed plus a significant portion of the non-marketed). The ratio: (ESP/SEP) 100=%ESP is a measure of proportion of the SEP from ecosystem services. Both SEP and %ESP were calculated and mapped for each 1 km 2 pixel on the earth's surface, and aggregated by country. Results show the detailed spatial patterns of GDP, ESP, and SEP (also available at: http://www.du.edu/ sutton/esiindexisee/EcolEconESI.htm). Globally, while GDP is concentrated in the northern industrialized countries, ESP is concentrated in tropical regions and in wetlands and other coastal systems. %ESP ranges from 1% for Belgium and Luxembourg to 3% for the Netherlands, 18% for India, 22% for the United States, 49% for Costa Rica, 57% for Chile, 73% for Brazil, and 92% for Russia. While GDP per capita has the usual northern industrialized countries at the top of the list, SEP per capita shows a quite different picture, with a mixture of countries with either high GDP/capita, high ESP/capita, or a combination near the top of the list. Finally, we compare our results with two other indices: (1) The 2001 Environmental Sustainability Index (ESI) derived as an initiative of the Global Leaders of Tomorrow Environment Task Force, World Economic Forum, and (2) Ecological Footprints of Nations: How much Nature do they use? How much Nature do they have? developed by Mathis Wackernagel and others. While both of these indices purport to measure sustainability, the ESI is actually mainly a measure of economic activity (and is correlated with GDP), while the Eco-Footprint index is a measure of environmental impact. The related eco-deficit (national ecological capacity minus national footprint) correlates well with %ESP.
|
| [140] |
The nature of statistical learning theory [M]. |
| [141] |
Remotely sensed spatial dynamics of the illex argentinus fishery, Southwest Atlantic [J].https://doi.org/10.1016/j.fishres.2007.11.027 URL [本文引用: 1] 摘要
Illex argentinus, the Argentine short-finned squid, is an important species within the Patagonian shelf ecosystem, where it supports a major multi-national fishery. The fishing fleet operating in this region is comprised of jigging vessels which attract squid using powerful incandescent lights. These fishing lights are detectable in remotely sensed satellite imagery which makes the fishery unusually amenable to a large-scale analysis of its spatial dynamics. In this paper, long-term inter-annual variability in fleet distribution and extent is examined using imagery from the Defence Meteorological Satellite Program-Operational Linescan System (DMSP-OLS) for the period 1993–2005. The fishery was found to occupy a wide area across the shelf and slope, with regions of consistent fishing activity observed on the high seas (45–47°S) and to the north of the Falkland Islands (Malvinas). Distribution of the fishery over the 13-year study period was variable, with 28% of the fished area occupied in 1–2 years, and 7% of the area occupied in 12–13 years. Annual catch levels were positively associated with the extent of the area occupied by the fleet. Higher catches corresponded to the fishery occupying a wide latitudinal range, whereas lower catches were observed during 2004 and 2005 corresponding to a contraction of the fishery away from the south of its range. In years of very high catches, fishing took place along almost the entire latitudinal range of the species. Due to the intensity of fishing, changes in the distribution of the fleet can reflect shifts in the distribution of I. argentinus; this has potential for the long-term monitoring of this highly variable squid fishery.
|
| [142] |
Quantifying light-fishing for dosidicus gigas in the eastern Pacific using satellite remote sensing [J].https://doi.org/10.1016/j.rse.2004.02.006 URL [本文引用: 1] 摘要
The distribution and abundance of the fleet targeting Jumbo flying squid ( Dosidicus gigas) in the Eastern Pacific is examined during the 1999 fishery season. The commercial fishery consists of a multinational jigging fleet, which fish at night using powerful lights to attract squid. The emission of light from these vessels can be observed using satellite-derived imagery obtained by the United States Defence Meteorological Satellite Program-Operational Linescan System (DMSP-OLS). In order to quantify fishing effort using lights, data on the distribution and abundance of vessels were obtained via satellite tracking using the ARGOS system. The distribution of the fishery as derived from light signatures was found to closely resemble that derived from ship location data. By using ARGOS data to calibrate DMSP-OLS images, we are able to estimate fishing effort in terms of the ‘area illuminated’ by the fishing fleet. Light signatures derived from DMSP-OLS were successfully used to quantify fishing effort, estimating the number of vessels fishing to within ±2 in 85 out of 103 satellite images (83%). High seas fishing was also quantified, with light signatures corresponding to a single fishing vessel observed in 11 out of 103 satellite passes during the fishery season (July–December 1999). This study examines how much light (in terms of area) is emitted by a single squid fishing vessel, and may prove to be a valuable tool in assessing and policing fisheries using satellite remote sensing.
|
| [143] |
Potential application of VIIRS Day/Night Band for monitoring nighttime surface PM2.5 air quality from space [J].https://doi.org/10.1016/j.atmosenv.2015.11.013 URL [本文引用: 1] 摘要
A pilot study is conducted to illustrate the potential of using radiance data collected by the Day/Night Band (DNB) of the Visible Infrared Imaging Radiometer Suite (VIIRS) aboard the Suomi National Polar-orbiting Partnership (S-NPP) satellite for particulate matter (PM) air quality monitoring at night. The study focuses on the moonless and cloudless nights in Atlanta, Georgia during August–October 2012. We show with radiative transfer calculations that DNB at night is sensitive to the change of aerosols and much less sensitive to the change of water vapor in the atmosphere illuminated by common outdoor light bulbs at the surface. We further show both qualitatively that the contrast of DNB images can indicate the change of air quality at the urban scale, and quantitatively that change of light intensity during the night (as characterized by VIIRS DNB) reflects the change of surface PM 2.5 . Compared to four meteorological variables ( u and v components of surface wind speed, surface pressure, and columnar water vapor amount) that can be obtained from surface measurements, the DNB light intensity is the only variable that shows either the largest or second largest correlation with surface PM 2.5 measured at 5 different sites. A simple multivariate regression model with consideration of the change of DNB light intensity can yield improved estimate of surface PM 2.5 as compared to the model with consideration of meteorological variables only. Cross validation of this DNB-based regression model shows that the estimated surface PM 2.5 concentration has nearly no bias and a linear correlation coefficient (R) of 0.67 with respect to the corresponding hourly observed surface PM 2.5 concentration. Furthermore, ground-based observations support that surface PM 2.5 concentration at the VIIRS night overpass (651:00 am local) time is representative of daily-mean PM 2.5 air quality (R=0.82 and mean bias of610.1μgm 613 ). While the potential appears promising, mapping surface PM 2.5 from space with visible light at night still face various challenges and the strategies to address some of these challenges are elaborated for future studies.
|
| [144] |
Monitoring urban population and energy utilization patterns from satellite data [J].https://doi.org/10.1016/0034-4257(80)90043-7 URL [本文引用: 2] 摘要
To test the validity of this equation the populations of the 124 cities were plotted on doubly logarithmic paper against area measurements (of the same cities) ob- tained from 1:250,000 scale U.S. Army Map Service sheets prepared in 1951- 1956. Despite the evident problem that the built-up urban areas depicted on the maps may not correspond to the administrative boundaries of the cities, and that city shape and size may exhibit regional variations, the data points gener- ally fit the prescribed straight-line pattern (Fig. 3). The regression equation for these data points, as determined by the methods of least-squares, is
|
| [145] |
Urban surface biophysical descriptors and land surface temperature variations [J]. |
| [146] |
Estimation of land surface temperature-vegetation abundance relationship for urban heat island studies [J].https://doi.org/10.1016/j.rse.2003.11.005 URL [本文引用: 1] 摘要
Remote sensing of urban heat islands (UHIs) has traditionally used the Normalized Difference Vegetation Index (NDVI) as the indicator of vegetation abundance to estimate the land surface temperature (LST) egetation relationship. This study investigates the applicability of vegetation fraction derived from a spectral mixture model as an alternative indicator of vegetation abundance. This is based on examination of a Landsat Enhanced Thematic Mapper Plus (ETM+) image of Indianapolis City, IN, USA, acquired on June 22, 2002. The transformed ETM+ image was unmixed into three fraction images (green vegetation, dry soil, and shade) with a constrained least-square solution. These fraction images were then used for land cover classification based on a hybrid classification procedure that combined maximum likelihood and decision tree algorithms. Results demonstrate that LST possessed a slightly stronger negative correlation with the unmixed vegetation fraction than with NDVI for all land cover types across the spatial resolution (30 to 960 m). Correlations reached their strongest at the 120-m resolution, which is believed to be the operational scale of LST, NDVI, and vegetation fraction images. Fractal analysis of image texture shows that the complexity of these images increased initially with pixel aggregation and peaked around 120 m, but decreased with further aggregation. The spatial variability of texture in LST was positively correlated with those in NDVI and in vegetation fraction. The interplay between thermal and vegetation dynamics in the context of different land cover types leads to the variations in spectral radiance and texture in LST. These variations are also present in the other imagery, and are responsible for the spatial patterns of urban heat islands. It is suggested that the areal measure of vegetation abundance by unmixed vegetation fraction has a more direct correspondence with the radiative, thermal, and moisture properties of the Earth's surface that determine LST.
|
| [147] |
Detecting the effects of wars in the Caucasus regions of Russia and Georgia using radiometrically normalized DMSP/OLS nighttime lights imagery [J].https://doi.org/10.2747/1548-1603.48.4.478 URL [本文引用: 1] 摘要
Satellite data can provide a remote view of developments in often dangerous conflict zones. Nighttime lights imagery from the Defense Meteorological Satellite Program (DMSP) Operational Linescan System (DMSP-OLS) satellite was used to detect the effects of war in the Caucasus region of Russia and Georgia. To assess changes over time, the data were radiometrically normalized using cities with a relatively stable nighttime lights signature over the course of the study period, 1992-2009. Buffers were created around these stable cities to select the pixels that were then used to normalize cities and towns whose nighttime lighting fluctuated over time. The results show that conflict-related events such as large fires that burn for weeks and large refugee movements are possible to detect, even given the relatively coarse spatial resolution (2.7 km) of the DMSP-OLS imagery.
|
| [148] |
Intercalibration of DMSP/OLS night-time light data by the invariant region method [J].https://doi.org/10.1080/01431161.2013.820365 URL [本文引用: 1] 摘要
DMSP-OLS (Defense Meteorological Satellite Program Operational Linescan System) night-time light data can accurately reflect the scope and intensity of human activities. However, the raw data cannot be used directly for temporal analyses due to the lack of inflight calibration. There are three problems that should be addressed in intercalibration. First, because of differences between sensors, the data are not identical even when obtained in the same year. Second, different acquisition times may lead to random or systematic fluctuations in the data obtained by satellites in different orbits. Third, a pixel saturation phenomenon also exists in the urban centres of the image. Therefore, an invariant region method was used in this article, and the relative radiometric calibration and saturation correction achieved the desired results. In the meantime, intercalibration models for each satellite year of DMSP-OLS night-time light data were produced. Finally, intercalibration accuracy was evaluated, and the intercalibration results were tested with the corresponding gross domestic product (GDP) data.
|
| [149] |
Dynamics of urban density in China: Estimations based on DMSP/OLS nighttime light data [J].https://doi.org/10.1109/JSTARS.2014.2367131 URL 摘要
In China, rapid urbanization has increased the demand for urban land and intensified the conflict between limited land resources and urban development. In response, high urban density has been proposed to realize sustainable urban development. Achieving this goal requires an examination of the dynamics of urban density in China. Nighttime light (NTL) data from the Defense Meteorological Satellite Program/Operational Linescan System (DMSP/OLS) are a good indicator of human activity. We applied NTL data to measure urban density in 70 major cities in China during 1992-2010. Based on temporal changes in NTL, we identified seven classes of urban density and clustered the distributions of urban density in 70 cities into six types. The dynamics of urban density were then obtained from the GDP density as an index of city development. The curves of urban density distribution gradually changed from a concave increase to W-shaped and S-shaped to a concave decrease, indicating that the current urban land use in China is unsustainable and that the shortage of land resources must be addressed. An examination of the distribution of urban density in Hong Kong revealed a different pattern and a potential solution for cities in mainland China.
|
| [150] |
Detecting China's urban expansion over the past three decades using nighttime light data [J].https://doi.org/10.1109/JSTARS.2014.2302855 URL [本文引用: 1] 摘要
China has experienced a rapid urban expansion over the past three decades because of its accelerated economic growth. In this study, we detected and analyzed the urban expansion of China during this period using multi-temporal Defense Meteorological Satellite Program Operational Linescan System (DMSP-OLS) nighttime light data and multi-source Normalized Difference Vegetation Index (NDVI) data. First, an intercalibration was performed to improve the continuity and comparability of the nighttime light data from 1992 to 2010. The nighttime light and NDVI data were then subjected to a local support vector machine (SVM) based region-growing method to extract the urban areas from 1992 to 2010. The urban areas from 1981 to 1991 were identified using the areas in 1992 and NDVI data, based on the hypothesis that China's urban expansion continued during this period. Finally, the extracted time-series urban maps were validated with Landsat images. The proposed local SVM-based region-growing method performed better than a local thresholding method and a global SVM-based region-growing method according to visual and quantitative comparisons of the urban boundaries and areas. We also analyzed the expansion rates to understand the dynamics of the urban areas in China and in its seven economic regions. In particular, the urban expansion patterns were investigated in three typical urban agglomerations, i.e., Beijing-Tianjin-Hebei, Yangtze River Delta, and Pearl River Delta. The proposed urban expansion direction, urban expansion intensity, and relative ratio of urban expansion demonstrated the regional variation among the three urban agglomerations.
|
| [151] |
Mapping and evaluating the urbanization process in Northeast China using DMSP/OLS nighttime light data [J].https://doi.org/10.3390/s140203207 URL PMID: 3958282 [本文引用: 1] 摘要
In this paper, an Urban Light Index (ULI) is constructed to facilitate analysis and quantitative evaluation of the process of urbanization and expansion rate by using DMSP/OLS Nighttime Light Data during the years from 1992 to 2010. A unit circle urbanization evaluation model is established to perform a comprehensive analysis of the urbanization process of 34 prefecture-level cities in Northeast China. Furthermore, the concept of urban light space is put forward. In this study, urban light space is divided into four types: the core urban area, the transition zone between urban and suburban areas, suburban area and fluorescent space. Proceeding from the temporal and spatial variation of the four types of light space, the pattern of morphologic change and space-time evolution of the four principal cities in Northeast China (Harbin, Changchun, Shenyang, Dalian) is analyzed and given particular attention. Through a correlation analysis between ULI and the traditional urbanization indexes (urban population, proportion of the secondary and tertiary industries in the regional GDP and the built-up area), the advantages and disadvantages as well as the feasibility of using the ULI in the study of urbanization are evaluated. The research results show that ULI has a strong correlation with urban built-up area (R2 0.8277). The morphologic change and history of the evolving urban light space can truly reflect the characteristics of urban sprawl. The results also indicate that DMSP/OLS Nighttime Light Data is applicable for extracting urban space information and has strong potential to urbanization research.
|
| [152] |
Object-based spatial cluster analysis of urban landscape pattern using nighttime light satellite images: A case study of China [J].https://doi.org/10.1080/13658816.2014.922186 URL [本文引用: 1] 摘要
Previous studies have demonstrated urban built-up areas can be derived from nighttime light satellite (DMSP-OLS) images at the national or continent scale. This paper presents a novel object-based method for detecting and characterizing urban spatial clusters from nighttime light satellite images automatically. First, urban built-up areas, derived from the regionally adaptive thresholding of DMSP-OLS nighttime light data, are represented as discrete urban objects. These urban objects are treated as basic spatial units and quantified in terms of geometric and shape attributes and their spatial relationships. Next, a spatial cluster analysis is applied to these basic urban objects to form a higher level of spatial units urban spatial clusters. The Minimum Spanning Tree (MST) is used to represent spatial proximity relationships among urban objects. An algorithm based on competing propagation of objects is proposed to construct the MST of urban objects. Unlike previous studies, the distance between urban objects (i.e., the boundaries of urban built-up areas) is adopted to quantify the edge weight in MST. A Gestalt Theory-based method is employed to partition the MST of urban objects into urban spatial clusters. The derived urban spatial clusters are geographically delineated through mathematical morphology operation and construction of minimum convex hull. A series of landscape ecologic and statistical attributes are defined and calculated to characterize these clusters. Our method has been successfully applied to the analysis of urban landscape of China at the national level, and a series of urban clusters have been delimited and quantified.
|
| [153] |
Comparison of impervious surface area and normalized difference vegetation index as indicators of surface urban heat island effects in Landsat imagery [J].https://doi.org/10.1016/j.rse.2006.09.003 URL [本文引用: 1] 摘要
This paper compares the normalized difference vegetation index (NDVI) and percent impervious surface as indicators of surface urban heat island effects in Landsat imagery by investigating the relationships between the land surface temperature (LST), percent impervious surface area (%ISA), and the NDVI. Landsat Thematic Mapper (TM) and Enhanced Thematic Mapper Plus (ETM+) data were used to estimate the LST from four different seasons for the Twin Cities, Minnesota, metropolitan area. A map of percent impervious surface with a standard error of 7.95% was generated using a normalized spectral mixture analysis of July 2002 Landsat TM imagery. Our analysis indicates there is a strong linear relationship between LST and percent impervious surface for all seasons, whereas the relationship between LST and NDVI is much less strong and varies by season. This result suggests percent impervious surface provides a complementary metric to the traditionally applied NDVI for analyzing LST quantitatively over the seasons for surface urban heat island studies using thermal infrared remote sensing in an urbanized environment.
|
| [154] |
Estimation of gross domestic product using multi-sensor remote sensing data: A case study in Zhejiang Province, East China [J].https://doi.org/10.3390/rs6087260 URL [本文引用: 1] 摘要
There exists a spatial mismatch between socioeconomic data, such as Gross Domestic Product (GDP), and physical and environmental datasets. This study provides a dasymetric approach for GDP estimation at a fine scale by combining the Defense Meteorological Satellite Program Operational Linescan System (DMSP/OLS) nighttime imagery, enhanced vegetation index (EVI), and land cover data. Despite the advantages of DMSP/OLS nighttime imagery in estimating human activities, its drawbacks, including coarse resolution, overglow, and saturation effects, limit its application. Hence, high-resolution EVI data were integrated with DMSP/OLS in this study to create a Human Settlement Index (HSI) for estimating the GDP of secondary and tertiary industries. The GDP of the primary industry was then estimated on the basis of land cover data, and the area with the GDP of the primary industry was classified by a threshold technique (DN 8). The regression model for GDP distribution estimation was implemented in Zhejiang Province in southeast China, and a GDP density map was generated at a resolution of 250 m 250 m. Compared with the outcome of taking DMSP/OLS as a unique parameter, estimation errors obviously decreased. This study offers a low-cost and accurate approach for rapidly estimating high-resolution GDP distribution to construct an important database for the government when formulating developmental strategies.
|
| [155] |
A robust method to generate a consistent time series from DMSP/OLS nighttime light data [J].https://doi.org/10.1109/TGRS.2016.2572724 URL 摘要
The long time series of nighttime light (NTL) data collected by DMSP/OLS sensors provides a unique and valuable resource to study changes in human activities. However, its full time series potential has not been fully explored, mainly due to inconsistencies in the temporal signal. Previous studies have tried to resolve this issue in order to generate a consistent NTL time series. However, due to geographic limitations with the algorithms, these approaches cannot generate a coherent NTL time series globally. The purpose of this study is to develop a methodology to create a consistent NTL time series that can be applied globally. Our method is based on a novel sampling strategy to identify pseudoinvariant features. We select data points along a ridgeline-the densest part of a density plot generated between the reference image and the target image-and then use those data points to derive calibration models to minimize inconsistencies in the NTL time series. Results show that the algorithm successfully calibrates DMSP/OLS annual composites and generates a consistent NTL time series. Evaluation of the results shows that the calibrated NTL time series significantly reduces the differences between two images within the same year and increases the correlations between the NTL time series and gross domestic product as well as with energy consumption, and outperforms the Elvidge et al. (2014) method. The methodology is simple, robust, and easy to implement. The quality-enhanced NTL time series can be used in a myriad of applications that require a consistent data set over time.
|
| [156] |
The vegetation adjusted NTL urban index: A new approach to reduce saturation and increase variation in nighttime luminosity [J].https://doi.org/10.1016/j.rse.2012.10.022 URL [本文引用: 2] 摘要
78 We develop a spectral index to reduce DMSP/OLS NTL saturation in core urban areas. 78 This index, VANUI, increases inter-urban variability in NTL values. 78 VANUI is based on underlying biophysical and urban characteristics. 78 VANUI is simple to calculate and intuitive to interpret. 78 VANUI may be useful for studies on urban energy use and urban structure.
|
| [157] |
Mapping urbanization dynamics at regional and global scales using multi-temporal DMSP/OLS nighttime light data [J].https://doi.org/10.1016/j.rse.2011.04.032 URL [本文引用: 1] 摘要
78 We map urbanization dynamics at regional and global scales with nighttime light data. 78 Differences in urbanization trajectories can be identified using temporal signatures. 78 We use an iterative clustering method to distinguish stable urban from urban growth. 78 From 1992 through 2000 India experienced higher rates of urbanization than China. 78 From 2000 through 2008 China experienced higher rates of urbanization than India.
|
| [158] |
Mapping spatio-temporal changes of Chinese electric power consumption using night-time imagery [J].https://doi.org/10.1080/01431161.2012.684076 URL [本文引用: 1] 摘要
China's rapid economic development in the last 20 years has resulted in increased demand for electricity and ensuing shortages in electric power supply. It is necessary to derive accurate and timely information regarding changing spatio-temporal patterns and trends of electric power consumption to inform future electricity allocation. Night-time annual image composites for 1995-2005 were obtained from the Defense Meteorological Satellite Program's Operational Linescan System and were inter-calibrated. The inter-calibrated night-time image composites were used in conjunction with the LandScan 2008 population data to estimate the amounts of electric power consumption in 1995, 2000 and 2005 for China at the province level. The estimated amounts of electric power consumption were then disaggregated to the pixel level. A pixel-based map was produced to show the spatio-temporal changes of electric power consumption from 1995 to 2005, in which 11 regional agglomerations with large increases of electric power consumption had emerged. During the process of producing this spatio-temporal change map, some errors were generated because of the use of single-year LandScan population data, imperfect reference regions for inter-calibration and a single threshold value for delimiting urban areas. However, we believe these errors are limited and acceptable, so we present this method of estimation and disaggregation to show the increases in electric consumption.
|
| [159] |
A cluster-based method to map urban area from DMSP/OLS nightlights [J].https://doi.org/10.1016/j.rse.2014.03.004 URL [本文引用: 1] 摘要
61We develop a cluster-based method to map urban extents from nightlight data.61The method performs well in mapping urban extents over large areas.61The method can potentially be used to map global urban areas and temporal dynamics.
|
| [160] |
Modelling the population density of China at the pixel level based on DMSP/OLS non-radiance-calibrated night-time light images [J].https://doi.org/10.1080/01431160802430693 URL [本文引用: 1] 摘要
The spatial distribution of population density is crucial for analysing the relationships among economic growth, environmental protection and resource use. In this study we simulated China's population density in 1998 at 102km×102km resolution by integrating DMSP/OLS non‐radiance‐calibrated night‐time images, SPOT/VGT 10‐day maximum NDVI composite, population census data and vector county boundaries. Population density, both inside and outside of light patches, was estimated for four types of counties, which were classified according to their light characteristics. The model for estimating population density inside the light patches was developed based on a significant correlation between light intensity and population, while the model for estimating population density outside of light patches was constructed by combining Coulomb's law with electric field superposition principle. Our method was simpler and less expensive than existing methods for spatializing population density. The results were consistent with other estimates but exhibited more spatial heterogeneity and richer information.
|

/
| 〈 |
|
〉 |
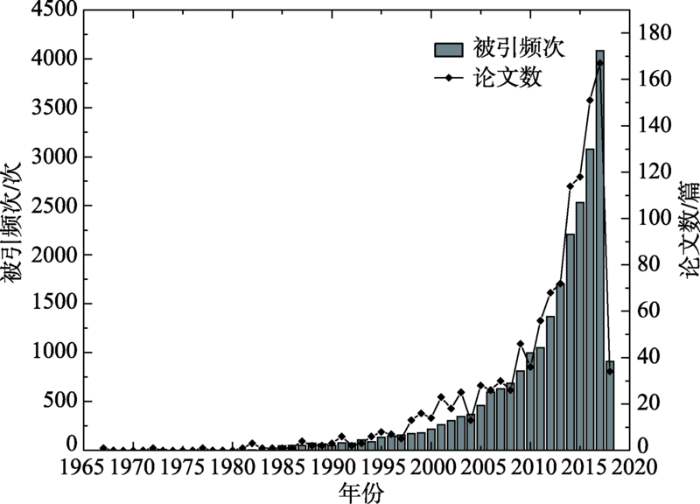
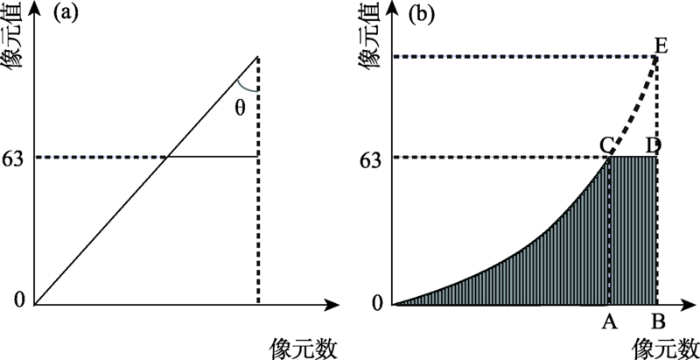

