刘希林
LIU Xilin
收稿日期: 2017-08-22
修回日期: 2017-12-21
网络出版日期: 2018-03-28
版权声明: 2018 地理科学进展 《地理科学进展》杂志 版权所有
基金资助:
作者简介:
作者简介:刘希林(1963-),男,湖南新邵人,博士,教授,博士生导师,主要从事地貌灾害过程及评估和预测研究,E-mail: liuxilin@mail.sysu.edu.cn。
展开
摘要
典型的崩岗具有“圆形露天剧场”般的沟头,发育在深厚的红色花岗岩风化壳上,通常包括集水坡面、崩壁、崩积体、沟道、洪积扇5个地貌组成部分;崩壁自上而下可分为表土层、风化红粘土层(红土层)、风化砂质红粘土层(砂土层)、风化粗碎屑层(碎屑层)。中国的崩岗与马达加斯加的lavaka属于同类地貌,两者具有地貌学上的可比性。崩岗群是劣地的表现形式之一,但与欧洲的badland有不同的侵蚀过程,也不同于意大利和巴西的两种沟谷侵蚀地貌calanchi和vocoroca。崩岗主要发育在华南和东南热带和亚热带湿润季风气候区中等偏缓的丘陵坡地上,由沟谷侵蚀发展而成,是沟谷侵蚀的高级阶段。崩岗沟道侵蚀产沙量占崩岗沟谷流域侵蚀产沙量的一半以上,其中沟道沟壁崩塌侵蚀产沙量与沟床下切侵蚀产沙量又各占崩岗沟道侵蚀产沙量的一半左右。野外人工模拟降雨试验是研究崩岗流域侵蚀、产流和产沙过程的有效手段。崩岗流域侵蚀产沙量可以通过崩岗沟谷和洪积扇地形测量加以估算。
关键词:
Abstract
The typical benggang has an amphitheater-like gully-head, mainly occurs in the deeply weathered granite area in southern and southeastern China. It usually consists of five parts: water-collection slope, headwall, colluvium, channel, and debris fan. From top to bottom, benggang headwall may be divided into four soil layers: topsoil, red soil, sandy soil, and clastic soil. Benggang in China and lavaka in Madagascar belong to the same type of landform with comparable geomorphologic characteristics. Benggang may be considered as one of the badland landscapes, but it has different erosion process. It is also different from the other two gully erosion landforms in Italy and Brazil: calanchi and vocoroca. Benggang is mainly distributed in moderate hilly region and subtropical maritime climate zone of southern and southeastern China. Usually benggang is also considered to develop from gully erosion, and it is treated as the advanced stage of gully evolution. The sediment yield of benggang channel erosion accounts for more than half of the sediment amount of the whole benggang gully catchment, and likewise the sediment yield of channel-bed accounts for about half of the sediment amount of the whole gully catchment. Simulated rainfall is a powerful tool to study the effects of rainfall on surface processes and erosion. The in situ artificial simulated rainfall is an effective method to study benggang erosion, slope runoff, and sediment transportation in benggang gully catchment. Benggang erosion is a geomorphic critical phenomenon. This critical phenomenon occurs only when the rainfall, topography, soil, and runoff exceed their critical thresholds. Field artificial rainfall experiments based on simulated rainfall-slope runoff-erosion process-sediment production observations may greatly improve the understanding of benggang erosion in southern and southeastern China. The sediment yield of benggang catchment may be estimated by the morphometric analyses on the topographies of benggang gully and debris fan
Keywords:
地表侵蚀以其各种形式毁坏耕地,造成土地退化、肥力下降。据估计,全世界每年约有10万 km2的土地由于侵蚀作用而丧失(Luffman et al, 2015)。沟谷侵蚀是地表侵蚀的主要表现。崩岗侵蚀并列为中国最为严重的4大类侵蚀沟(黄土高原的沟壑、黑土区的大沟、西南地区的泥石流沟、南方红壤区的崩岗沟)。根据南方7省(区)的普查资料统计,该区共有大、中、小型崩岗23.91万处(冯明汉等, 2009)。因此,崩岗侵蚀已成为华南地表侵蚀泥沙的主要来源,也是中国最为严重的地貌灾害之一。
崩岗沟谷流域是一个完整的地貌系统且具有复杂的地貌响应。然而目前对崩岗沟谷流域地貌系统侵蚀过程的理解仍然十分有限。因此,不断增进对崩岗侵蚀过程的了解,认知其发生和发展机理,是华南水土流失防治和生态环境改善的重要课题。
崩岗是中国特色的地貌学名词,由我国著名地貌学家曾昭璇于1960年命名(吴志峰等, 1997)。Benggang这一中国特色的英文名词,最早由中国地貌学家许炯心在国际学术期刊Catena上发表(Xu, 1996),他以广东五华县崩岗为例,首次向世界展示了中国崩岗侵蚀的发育特征及其影响因素,并将崩岗归属于小型侵蚀地貌,认为是水力和重力共同侵蚀的结果。时隔22年后,中国学者再次以Benggang为标题词,在重要国际学术期刊Journal of Soils and Sediments发表了野外模拟降雨条件下广东五华县莲塘岗崩岗崩积体坡面径流与土壤水分含量的最新试验研究成果(Liu et al, 2018)。
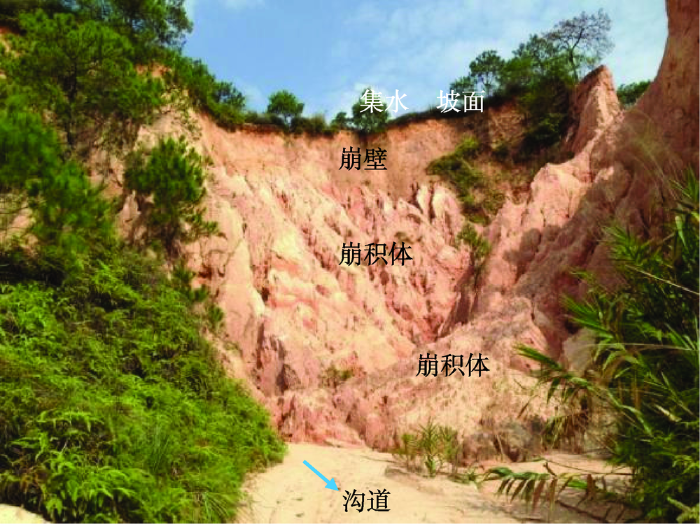
早期的崩岗定义,来源于广东梅州五华县当地客家人所称的“丘陵山地冲沟源头汇水区围椅状崩塌崖壁地貌”,也即崩塌的山岗,在地貌分类中属于花岗岩丘陵地貌(中国科学院《中国自然地理》编辑委员会, 1980)。后来,中国地貌学家吴正(1999)将崩岗定义为发育在侵蚀沟头的集水盆,由于崩岗的发生发展与流水作用形成的沟谷地貌密切相关,将其归属于暴流地貌。虽然暴流地貌这一名称目前已很少使用,但崩岗这一地貌学命名却被保留下来(张大林等, 2014)。所以,换言之,崩岗是指沟头呈“倒泪珠”状的具有一定流域面积的侵蚀沟。鉴于此,完整的崩岗流域包括集水坡面、崩壁、崩积体(坡水堆积物)、沟道、洪积扇(俗称沙渍地)5个地貌组成部分(图1)。
图1 广东德庆县典型崩岗侵蚀地貌
Fig.1 Typical benggang landform in Deqin County of Guangdong Province
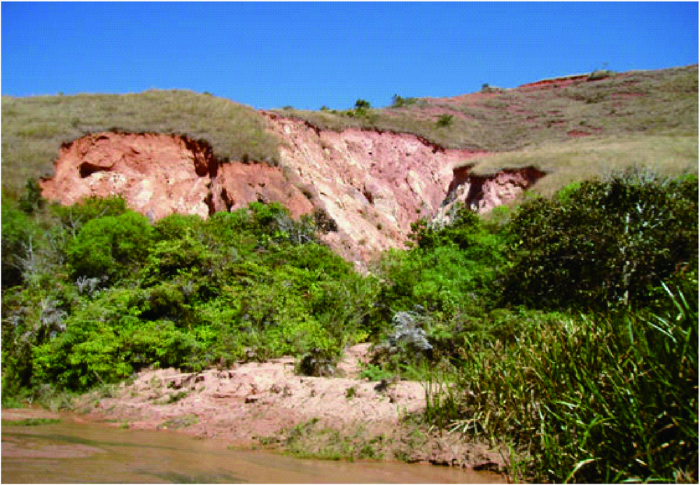
崩岗侵蚀主要发育在华南和东南热带和亚热带湿润季风气候区。崩岗可发育在砂页岩(邱世钧, 1999)、砂砾岩、泥质岩、碳酸盐岩乃至第四纪红土上(赵辉等, 2006),但大多数崩岗主要发育在华南和东南花岗岩厚层风化壳上,因此,花岗岩风化壳及其风化土体是崩岗发育的主要物质基础(刘希林等, 2013)。国外虽无“崩岗侵蚀”之说法,但国外有类似的侵蚀地貌可与之相比较。在马达加斯加,有一种称之为lavaka的侵蚀沟谷,这种具有“圆形露天剧场”般沟头的沟谷,发育在深厚的红色花岗岩风化壳上,沟谷切穿顶部表土层,出露新鲜的“伤口”般的地貌景观(Wells et al, 1991)。lavaka上部为坚实的风化红粘土层(简称红土层)(0.5~2 m),下部为几m至十几m厚的风化砂质红粘土层(简称砂土层)。易碎的砂土层含有大量的粗粒物质,相比红土层,砂土层具有更高的透水性(Voarintsoa et al, 2012)。砂土层下部为厚度20~50 m的花岗岩风化粗碎屑层(简称碎屑层)。在活跃的lavaka沟口部位,分布有泥石流扇形地,局部长有植被(图2)(Cox et al, 2010)。中国崩岗土体的垂直剖面自上而下通常分为:表土层、红土层、砂土层、碎屑层。由此看来,lavaka的物质组成、剖面结构和土体特性,与中国崩岗基本相同,具有地貌学上的可比性(图3)。
图2 马达加斯加典型lavaka侵蚀地貌(Jungers摄)
Fig. 2 Lavaka landform in Madagascar (photo by Jungers)
图3 马达加斯加lavaka与中国benggang地貌形态对比
Fig. 3 Morphometric comparison of lavaka in Madagascar and benggang in China
在巴西东南部的热带湿润地区,有一种广泛分布的令人惊奇的侵蚀沟谷,当地称之为vocoroca (图4)(Bacellar et al, 2005)。这种沟谷沟长400~500 m,沟宽约150 m,沟深可达50 m,通常发育在15°~20°的缓坡地带。上部为抗蚀能力强、有机质含量高的坡积物,下部为厚度可达50 m的花岗岩风化残积物。Bacellar等(2005)认为,在其“圆形露天剧场”般的沟头,因含有承压地下水并处于亚稳定状态,容易产生泥流。泥流的切割,使风化残积物在重力作用下发生坍塌,导致沟壁后退、沟床拓宽。从有限的文献资料看,vocoroca类似于benggang和lavaka,但是否属于同类地貌,还需做进一步对比研究。
图4 巴西东南部A、B两条沟谷向中部分水岭溯源侵蚀,类似于中国的条形崩岗(授权引自
Fig.4 Gullies A and B in southeastern Brazil retreated by erosion toward the middle ridge, similar to the strip-type benggangs in China (from
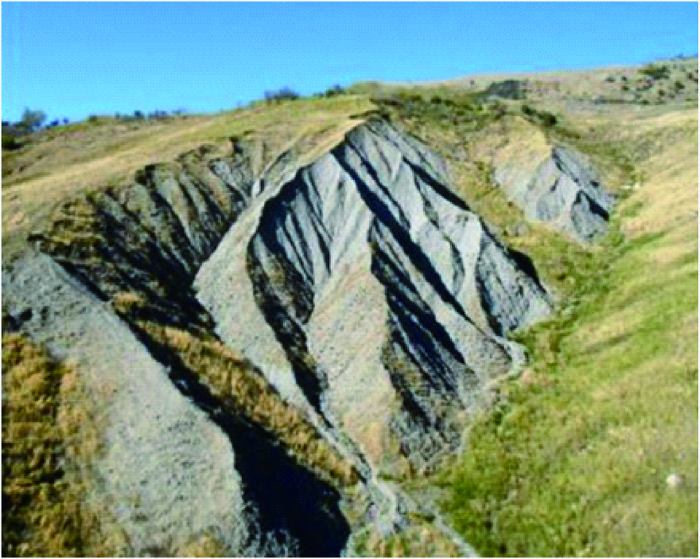
在地中海气候的意大利中部,有一种奇特的侵蚀地貌称之为calanchi,也即意大利以外学者所称的badland(Caraballo-Arias et al, 2014; Neugirg et al, 2016)。Moretti等(2000)认为,calanchi是沟谷流水侵蚀与重力块体运动复合作用的结果,calanchi是badland景观的一部分,但有其特点,它发育在上部为黏土和泥灰土、下部为沙黏土和砂土的亚平宁山麓地带。典型的calanchi被描述为:一个马蹄形山谷,被众多的支沟切割成刀刃状的脊峰,沟床底部有泥流(图5)。Moretti等(2000)在论述calanchi时注意到,浅表层的土体蠕动可使地表水直接下渗至滑动面,由此导致表土层快速液化并转化为泥流。因此calanchi与benggang和lavaka相似,但它们的地貌学意义并不完全相同。
图5 意大利西西里岛典型calanchi侵蚀地貌(
Fig.5 Typical calanchi landform in Sicily of Italy (
美国学者(Cox et al, 2010)、巴西学者(Bacellar et al, 2005)和意大利学者(Moretti et al, 2000)在研究lavaka、vocoroca和calanchi侵蚀地貌时都提到有泥石流/泥流存在,但未有详细的研究。中国学者在对广东五华县莲塘岗崩岗进行全方位、多视角、长达4年的研究发现,崩岗流域一旦遭遇降雨,即可在沟谷中产生一种特殊的固、液两相流,由此提出了崩岗泥砂流的概念,并认为泥砂流是介于高含沙水流与稀性泥石流之间的中间类型,建议将其定义为泥石流的一个亚类(张大林等, 2014)。已有初步成果表明,泥砂流是崩岗沟谷侵蚀的主要外营力,是沟谷泥沙输移的主要载体。深刻认识泥砂流在崩岗沟谷侵蚀及流域产沙中的独特作用,具有重要的科学价值。
Xu(1996)认为,当多个崩岗发育在同一山坡形成崩岗群时,就可以称之为“劣地”,也即badland。他的这一观点,最早将中国的benggang与国际上的badland联系起来。广义上“崩岗”属于“劣地”的一种类型,但就其地貌发育过程而言,benggang并不完全等同于badland,两者在侵蚀类型和机理过程上是有所区别的(图6)。尽管如此,国际上有关badland侵蚀的研究方法,对中国benggang侵蚀的研究仍然具有借鉴意义。近30年来,badland研究文献中有关侵蚀产沙量和侵蚀速率的研究一直呈上升趋势(Gallart et al, 2013)。包括中国南方红壤区的沟谷侵蚀(即benggang侵蚀)、马达加斯加的lavaka侵蚀和地中海地区的badland侵蚀,都已列为国际地表侵蚀科学研究的热点(Boardman, 2006)。由此可见,中国崩岗侵蚀的研究,处于世界同类研究的前沿,研究成果具有世界可比性,是能引起国际同行广泛关注和浓厚兴趣的研究领域。
图6 西班牙东南部典型badland地貌及其坡面细沟侵蚀(
Fig. 6 Typical badland in southeastern Spain (
崩岗主要发育在中等偏缓的丘陵坡地上。在福建永春县,崩岗发育的山坡大多为20°~45°的中等坡度(Xu, 1996)。在马达加斯加,lavaka主要发育在10°~30°的缓坡上(Voarintsoa et al., 2012)。崩岗侵蚀由沟谷侵蚀发展而来(阮伏水, 1996),崩岗侵蚀是沟谷侵蚀的高级阶段(Bocco, 1991; diCenzo et al, 1997; Luk et al, 1997)。
沟谷是流水地貌的一种。沟谷侵蚀的早期研究,对重力块体运动重视不够(Bocco, 1991)。近年来,中国学者在广东五华县莲塘岗崩岗的研究表明,崩岗沟道侵蚀产沙量占崩岗沟谷流域侵蚀产沙总量的53.6%;崩塌侵蚀产沙量占崩岗沟谷流域侵蚀产沙总量的46.4%。在崩岗沟道侵蚀产沙量中,流水下切沟床产沙量占46.6%;沟壁重力坍塌产沙量占53.4%(刘希林等, 2016)。Martínez-Casanovas等(2009)研究也表明,沟壁重力坍塌的产沙量约占沟道侵蚀产沙量的一半左右。
侵蚀测量通常有两种方式:仪器设备的直接测量和模型评估的间接测量。在侵蚀的原因和结果的研究中,许多学者力图在侵蚀变量之间寻找相互关系并建立侵蚀模型,这样就可以通过已知侵蚀变量来推求未知侵蚀参数,从而达到间接测量侵蚀结果的目的(Stroosnijder, 2005)。侵蚀模型的建立,需要大量的测量数据来支撑。因此,只有通过更多的侵蚀数据的测量(包括实体测量和试验测量),才能更好地建立和验证侵蚀模型。
实验室试验测量的优点是可对因变量的范围进行较好的控制,使得测量结果可以重复。不少学者用室内模型试验测量沟谷横断面变化。Bocco(1991)曾提到有学者用面积坡度值(流域面积与沟床坡度的乘积,代表沟谷水流功率)与沟谷宽度进行回归分析,建立沟谷宽度的计算模型;Wells等(2013)在研究沟床坡度和径流量对沟谷横断面的影响时,设计了3组坡度、3组流量、共9个组合的实验室小规模水流冲刷试验,通过摄像记录和图像解译,得出估算沟谷宽度的经验公式。然而,Poesen等(2003)认为,沟谷长度是决定沟谷侵蚀产沙的关键因素,若要推算沟谷的侵蚀产沙量,正确估算沟谷长度要比估算沟谷宽度和沟谷深度重要得多。
尽管实验室人工模拟降雨试验已改进了对“降雨—径流—产沙”过程的解释和描述,但试验设计的不同降雨强度在其降雨过程中仍是恒定的,土壤也是非原状的。实验室人工模拟降雨强度通常较高,一般都是暴雨和大暴雨量级(Aksoy et al, 2012; Jiang et al, 2014; Newesely et al, 2015)。Luffman等(2015)认为,实验室人工模拟降雨试验虽然可以控制降雨强度和降雨历时,但不能完全模拟野外自然降雨条件下土壤侵蚀的真实变化。按一定比例放大的实验室试验测得的侵蚀速率,有可能导致野外尺度下土壤侵蚀速率被低估。因此,野外现场人工模拟降雨试验研究,以及自然降雨条件下的野外现场实证研究,可以更好地接近研究结果的真实性。
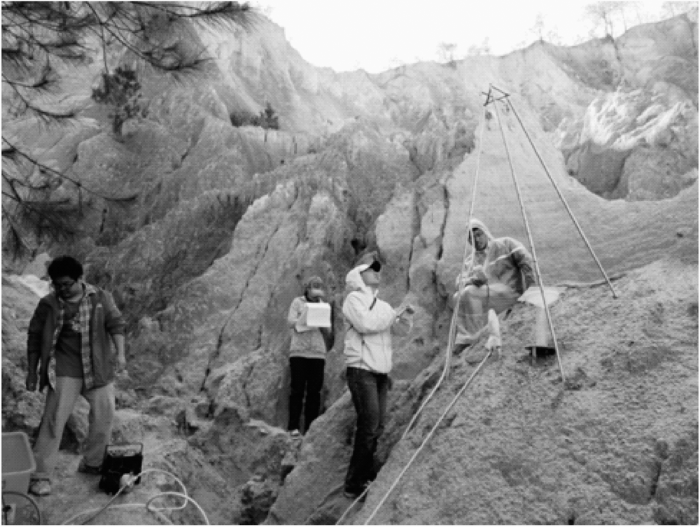
野外人工模拟降雨试验的优点还在于可选择适合的空间尺度,并在真实的土壤和植被条件下进行(Martínez-Murillo et al, 2013)。在badland的有关研究中,已有使用野外人工模拟降雨探讨坡度与土壤侵蚀速率以及径流量与土壤稳定渗透率之间的关系(Cerdà et al, 1997);用恒定降雨强度来评估不同场地的产流、产沙和土壤渗透率以及与植被覆盖度之间的关系(Solé-Benet et al, 1997);通过野外人工模拟降雨,建立土壤含水量与径流含沙量之间的关系,并用其解释土壤侵蚀过程和机理(Bouma et al, 2000);近年来,国内学者在广东五华县莲塘岗崩岗开展了人工模拟降雨试验条件下崩积体坡面产流过程的研究(图7)(刘希林等, 2015)。总之,研究降雨驱动下的崩岗侵蚀及其产流产沙过程,野外人工模拟降雨试验是必不可少的,也是实验室人工模拟降雨试验的重要补充。
图7 模拟降雨条件下崩积体坡面侵蚀产流试验
Fig.7 Slope runoff experiment in benggang colluvium under simulated rainfall
人工模拟降雨是常用的试验测量手段。人工模拟降雨目前尚无统一的标准或方法的规范,也不存在标准化的模拟降雨器的设计(Wildhaber et al, 2012; Iserloh et al, 2013)。在各类人工组装的小型可移动式野外模拟降雨器中,世界各地使用的人工模拟降雨高度和降雨面积也各不相同(表1)。尽管如此,学者们普遍认为,模拟降雨器仍是研究降雨对地表侵蚀及其产流产沙过程十分有效而强有力的创新工具(Aksoy et al, 2012; Wildhaber et al, 2012; Iserloh et al, 2013; Newesely et al, 2015)。
表1 部分野外模拟降雨器主要性能及其应用
Tab.1 Key properties of some field rainfall simulators and applications
| 国别 | 使用者 | 年份 | 降雨高度/m | 降雨面积/m2 | 应用实例 |
|---|---|---|---|---|---|
| 荷兰 | Blijenberg et al | 1996 | 1.5 | 1×1 | 坡面泥石流启动 |
| 瑞士 | Wildhaber et al | 2012 | 1.5 | 1×1 | 坡面侵蚀与产流产沙 |
| 中国 | Huang J et al | 2013 | 1.2 | 1.5×1 | 降雨强度和坡度对渗透的影响 |
| 中国 | Ni H Y | 2015 | 4.5 | 2.5×1.2 | 沟谷泥石流启动 |
| 中国 | Cao et al | 2015 | 3.0 | 1×1 | 水土流失 |
| 中国 | 刘希林等 | 2015 | 2.0 | 2×1 | 崩积体坡面产流 |
在人工模拟降雨和自然降雨条件下,影响坡面侵蚀和沟谷侵蚀产流产沙的降雨因子包括:降雨总量、前期雨量、降雨历时、平均雨强、最大雨强。Sirvent等(1997)认为,高强度降雨与高侵蚀产沙呈正相关;但Luffman等(2015)认为,在热带和亚热带湿润地区,降雨总量和降雨历时对产流产沙的作用更为明显。降雨初期由于渗透充分,很难产生地表径流,随着降雨继续和累计雨量增加,土体水分逐渐饱和,渗透率趋于稳定,此时的降雨才能产生地表径流并导致侵蚀作用的发生。因此,在人工模拟降雨试验研究崩岗侵蚀时,对降雨总量和降雨历时应予以特别关注。
Poesen等(2003)曾提出沟谷侵蚀需要解决的若干问题,其中包括:在特定气候条件和土地利用条件下,沟道侵蚀产沙量在沟谷流域侵蚀产沙量中的比重有多大?能找到沟道侵蚀发生的地貌临界值吗?是否存在能推算和预测沟谷流域侵蚀产沙量的物理模型?这些问题通过十余年来的研究,已经取得了很大的进展,但崩岗侵蚀作为沟谷侵蚀的一种特殊类型,其水力—重力复合侵蚀机理目前还不是很清楚。
影响侵蚀产沙量的因素除降雨以外还有坡度,但坡度对侵蚀作用的影响并非想象的那么简单。有研究认为,坡度对侵蚀产沙量和径流量均无显著影响(Govers, 1992);有研究表明,坡度对侵蚀产沙量有正向影响,对径流量没有影响(Cerdà et al, 1997);Solé-Benet(1997)以55 mm/h的恒定降雨强度在0.24 m2径流试验场进行的16次每次30 min的人工模拟降雨试验表明,坡度与径流量呈正相关;雷廷武等(2002)研究表明,坡度对细沟侵蚀产沙能力(细沟水流所携带的最大泥沙含量)的影响存在一个20°的临界坡度,小于此坡度则产沙能力随坡度增大而增大,大于此坡度则产沙能力趋于稳定而与坡度无关;Luffman等(2015)认为,对于侵蚀产沙量而言,独立的坡度因子可能并不是具有可以合理解释的显著性变量。
影响侵蚀产沙量的因素还有土壤可蚀性。Bacellar等(2005)用土壤中粉砂与黏土的比率(Silt-Clay Ratio,SCR)作为土壤可蚀性的测量指标。当SCR低于0.66时土壤可蚀性低;当SCR大于1.44时土壤可蚀性高;当SCR介于两者之间时土壤可蚀性中等。这一方法所采用的依据虽然是定量的,但对土壤可蚀性结果的划分仍然是定性的。Poesen等(2003)认为,土壤抗剪强度代表了土壤抵抗流水侵蚀的能力,可以作为土壤可蚀性的替代指标。
有关沟谷侵蚀物理模型问题,1966年Seginer (1966)认为可能不存在某种物理方程能用于描述沟谷侵蚀的发育;但Bocco(1991)认为,采用统计分析方法研究沟谷侵蚀是可行的。在现有的土壤侵蚀模型中,1965年美国建立的土壤流失通用方程(USLE)于1997年修订后,在全世界推广应用。USLE模型是一个以降雨、坡长、坡度、土地覆被、土地管理、水土保持6个因子连乘方式来估算土壤侵蚀量的经验模型,主要用于计算坡面流和溅蚀产生的侵蚀量。1995年美国农业部发布的WEPP模型(Water Erosion Prediction Project)是基于质量守恒的连续流方程,主要用于计算细沟侵蚀和细沟间侵蚀产生的侵蚀量(Aksoy et al, 2005)。因为崩岗侵蚀是流水冲刷和重力崩塌构成的复合侵蚀,亦即崩岗沟谷流域侵蚀量是沟谷侵蚀和崩塌侵蚀复合作用的结果,所以美国的USLE模型和WEPP模型不适用于中国崩岗沟谷流域侵蚀量的计算。
一般而言,细沟的最大宽度和最大深度以0.5 m为限,以此作为与切沟的区分界限(Bocco, 1991)。细沟侵蚀的地貌表现即坡面流侵蚀,水流深度通常为厘米量级甚至更浅。因此,与切沟和冲沟侵蚀相比,细沟侵蚀产沙量较小,但却是坡面侵蚀向沟谷侵蚀转化的关键(Poesen et al, 2003)。因此,崩积体坡面细沟侵蚀也是崩岗侵蚀研究的重要内容(蒋芳市等, 2014)。相对而言,由于细沟间侵蚀产沙量仅为细沟侵蚀产沙量的1/40(雷廷武等, 2009),因此,崩积体坡面上细沟与细沟间的侵蚀差异研究的价值相对较小。
近年来,中国有关崩岗侵蚀的研究在上述领域也取得了进展。比如Jiang等(2014)在暴雨和大暴雨量级的降雨强度及陡坡条件下,通过室内人工模拟降雨试验得出了崩积体陡坡渗流与径流、产沙量与含沙量之间的经验公式;黄炎和等(2015)通过不同流量结合不同坡度的室内放水冲刷试验,研究了崩积体坡面侵蚀及其产沙规律,得出了水流流速和流量与坡度的幂函数关系,并将单位水流功率(反映水流侵蚀能力)表达为流速与坡度正弦值的乘积,分析得出产沙率与单位水流功率的线性回归方程;Lin等(2015)采用指纹因子法,识别洪积扇的泥沙来源,定量评估崩岗红土层、砂土层、碎屑层物质对崩岗流域产沙的影响;周红艺等(2016)室内试验研究了广东德庆县崩岗侵蚀区崩壁不同部位土体脱湿作用下裂隙发育及其演变规律,表明崩壁上部土体更容易产生裂隙、且裂隙发育程度比下部土体更为充分。有关中国崩岗侵蚀的研究,近年已有学者采用文献计量法和知识图谱法(陈培波等, 2015; 邱锦安等, 2017),对中国30年来崩岗研究的发展历史、研究主题、研究单位、研究作者、研究进展和研究现状进行了专门综述,本文在此不再赘述。
(1) Benggang与lavaka的物质组成、剖面结构和土体特性基本相同,两者具有地貌学上的可比性,可归为同类地貌。广义上崩岗属于劣地的一种类型,但其地貌发育过程并不完全等同于badland,两者在侵蚀过程和机理上有所区别。中国南方红壤区的benggang侵蚀、非洲马达加斯加的lavaka侵蚀和欧洲地中海地区的badland侵蚀,都已成为国际地表侵蚀科学研究的热点。
(2) 降雨是崩岗流域产流产沙和输沙的主要驱动力。野外人工模拟降雨试验是研究降雨驱动条件下崩岗侵蚀及其产流产沙过程的重要手段和工具,也是实验室人工模拟降雨试验的必要补充和 完善。
(3) 崩积体和沟床物质是崩岗沟谷流域侵蚀产沙和输沙的主要来源,崩积体在崩岗沟谷流域侵蚀产沙来源中的作用或比重,同崩岗沟谷流域崩积体发育规模有关,崩积体越少、流域面积越大,则侵蚀产沙比重越小。在崩岗沟谷侵蚀过程中,泥砂流可将部分悬浮质泥沙带入下游主河;在后期雨水冲刷过程中,洪积扇上沉积的部分细颗粒泥沙亦可被带入下游主河,但带走的泥沙量与洪积扇上沉积的泥沙量相比是很小的,并且这是一个漫长的自然过程。因此,通过对正在活跃发育的、典型的、未被人为强烈干扰和改造的洪积扇地形特征与崩岗流域地貌特征的地形测量学分析,建立两者之间的成因逻辑关系,用地形测量学统计模型进行崩岗流域侵蚀产沙量的定量评估是可行的。
(4) 崩岗沟谷侵蚀是一种地貌临界现象,而这种临界现象只有在降雨、地形、土壤、径流等因子超过某一临界阈值时才会发生。通过对崩岗沟谷流域特征和洪积扇特征的形态测量,采用统计分析和回归模拟,对崩岗沟谷侵蚀及其侵蚀产沙量进行定量评估;基于“降雨产流—侵蚀产沙”的野外模拟试验,以及自然降雨条件下崩岗泥砂流的实证研究,深入研究和探讨崩岗泥砂流的产流输沙过程和崩岗沟谷流域的侵蚀产沙量,可更好地理解和认识崩岗侵蚀的过程和机理。
The authors have declared that no competing interests exist.
| [1] |
中国崩岗研究进展的文献计量分析 [J].https://doi.org/10.13284/j.cnki.rddl.002785 URL Magsci [本文引用: 1] 摘要
<p>运用文献计量学方法,收集中文科技期刊全文数据库、中国期刊全文数据库、中国优秀硕士学位论文数据库和中国博士学位论文数据库的崩岗研究论文作为样本数据,从论文的发表时间、载文期刊类别、核心作者群、研究区域、研究内容等方面,对中国1984―2014年31 a来发表的崩岗研究文献进行了计量统计,揭示了中国崩岗研究起源早、发展慢的历史和定性描述多、动态监测匮乏的现状,以及崩岗研究论文数量由波动式增长转向稳定增长的发展趋势。</p>
Bibliometric analysis of the progress in benggang research in China [J].https://doi.org/10.13284/j.cnki.rddl.002785 URL Magsci [本文引用: 1] 摘要
<p>运用文献计量学方法,收集中文科技期刊全文数据库、中国期刊全文数据库、中国优秀硕士学位论文数据库和中国博士学位论文数据库的崩岗研究论文作为样本数据,从论文的发表时间、载文期刊类别、核心作者群、研究区域、研究内容等方面,对中国1984―2014年31 a来发表的崩岗研究文献进行了计量统计,揭示了中国崩岗研究起源早、发展慢的历史和定性描述多、动态监测匮乏的现状,以及崩岗研究论文数量由波动式增长转向稳定增长的发展趋势。</p>
|
| [2] |
我国南方崩岗侵蚀现状调查 [J].https://doi.org/10.3969/j.issn.1001-4179.2009.08.018 URL [本文引用: 1] 摘要
崩岗是在水力和重力作用下山坡土体受破坏而崩坍和冲刷的侵蚀现象,是沟壑侵蚀的一种特殊形式。崩岗侵蚀不仅破坏土地资源,淤积河道、农田及水利设施,冲毁桥梁、道路、民房,而且给当地生态安全形成巨大威胁,同时也严重制约和阻碍了当地区域经济的发展。为此,开展了大规模崩岗调查,准确地掌握了南方崩岗分布情况、数量和发展趋势,以为开展崩岗治理提供决策依据。
Investigation on status of hill collapsing and soil erosion in southern China [J].https://doi.org/10.3969/j.issn.1001-4179.2009.08.018 URL [本文引用: 1] 摘要
崩岗是在水力和重力作用下山坡土体受破坏而崩坍和冲刷的侵蚀现象,是沟壑侵蚀的一种特殊形式。崩岗侵蚀不仅破坏土地资源,淤积河道、农田及水利设施,冲毁桥梁、道路、民房,而且给当地生态安全形成巨大威胁,同时也严重制约和阻碍了当地区域经济的发展。为此,开展了大规模崩岗调查,准确地掌握了南方崩岗分布情况、数量和发展趋势,以为开展崩岗治理提供决策依据。
|
| [3] |
崩岗崩积体陡坡侵蚀的水动力学特征 [J].https://doi.org/10.13324/j.cnki.jfcf.2015.04.003 URL [本文引用: 1] 摘要
以花岗岩发育形成的崩岗崩积体为研究对象,通过不同流量(3.6、7.2、10.8、14.4 L·min-1)和陡坡坡度(20°、25°、30°、35°、40°)相结合的室内放水冲刷试验,对崩积体坡面侵蚀的动力学参数进行分析,以探讨崩积体坡面的侵蚀水动力机理。结果表明,坡面水流流速随坡度和流量的增大均呈增大趋势,可由流量和坡度呈幂函数进行表达,坡度对流速的影响小于流量,输沙率随流速增大呈线性函数增加;随着流量和坡度的增加,水流剪切力、单位水流功率和断面单位能量3个动力学参数整体呈增大趋势,流量对三者的影响作用均大于坡度;输沙率与3个水动力学参数均呈线性函数关系,可首选单位水流功率作为崩积体冲刷侵蚀的水动力学参数。
Hydrodynamic characteristics in steep colluvial deposits slope [J].https://doi.org/10.13324/j.cnki.jfcf.2015.04.003 URL [本文引用: 1] 摘要
以花岗岩发育形成的崩岗崩积体为研究对象,通过不同流量(3.6、7.2、10.8、14.4 L·min-1)和陡坡坡度(20°、25°、30°、35°、40°)相结合的室内放水冲刷试验,对崩积体坡面侵蚀的动力学参数进行分析,以探讨崩积体坡面的侵蚀水动力机理。结果表明,坡面水流流速随坡度和流量的增大均呈增大趋势,可由流量和坡度呈幂函数进行表达,坡度对流速的影响小于流量,输沙率随流速增大呈线性函数增加;随着流量和坡度的增加,水流剪切力、单位水流功率和断面单位能量3个动力学参数整体呈增大趋势,流量对三者的影响作用均大于坡度;输沙率与3个水动力学参数均呈线性函数关系,可首选单位水流功率作为崩积体冲刷侵蚀的水动力学参数。
|
| [4] |
多场次降雨对崩岗崩积体细沟侵蚀的影响 [J].https://doi.org/10.3969/j.issn.1672-3007.2014.06.001 URL [本文引用: 1] 摘要
崩积体是崩岗的重要组成部分, 因土质疏松,极易被侵蚀。细沟侵蚀特征是探讨崩积体侵蚀机制的重要内容。采用人工模拟降雨试验,研究多场次降雨条件(1.00、1.67、2.33 mm/min分别降3次雨)对崩积体30°坡面(5m×1 m)细沟侵蚀产沙过程及发育形态特征的影响。结果表明:1)1.00 mm/min降雨强度条件下,3次降雨的后期产沙过程趋于一致,而1.67和2.33 mm/min降雨强度条件下,前2次降雨后期产沙过程趋于一致,但第3次降雨后期产沙率急剧增大;2)各降雨强度条件下,沟头溯源作用、细沟平均宽度及深 度随着降雨场次的增加而增加;3)不同降雨强度条件下的细沟特征存在差异,1.00和1.67 mm/min降雨强度时,随着降雨场次的增加,坡面的细沟数及细沟密度增加,宽深比减小,但在2.33 mm/min降雨强度条件下的结果恰好相反;4)各降雨强度条件下细沟侵蚀量及其增加幅度均增大,细沟侵蚀愈剧烈。
Effects of repetitive rainfalls on rill erosion of coluvial deposit in granite slope collapse [J].https://doi.org/10.3969/j.issn.1672-3007.2014.06.001 URL [本文引用: 1] 摘要
崩积体是崩岗的重要组成部分, 因土质疏松,极易被侵蚀。细沟侵蚀特征是探讨崩积体侵蚀机制的重要内容。采用人工模拟降雨试验,研究多场次降雨条件(1.00、1.67、2.33 mm/min分别降3次雨)对崩积体30°坡面(5m×1 m)细沟侵蚀产沙过程及发育形态特征的影响。结果表明:1)1.00 mm/min降雨强度条件下,3次降雨的后期产沙过程趋于一致,而1.67和2.33 mm/min降雨强度条件下,前2次降雨后期产沙过程趋于一致,但第3次降雨后期产沙率急剧增大;2)各降雨强度条件下,沟头溯源作用、细沟平均宽度及深 度随着降雨场次的增加而增加;3)不同降雨强度条件下的细沟特征存在差异,1.00和1.67 mm/min降雨强度时,随着降雨场次的增加,坡面的细沟数及细沟密度增加,宽深比减小,但在2.33 mm/min降雨强度条件下的结果恰好相反;4)各降雨强度条件下细沟侵蚀量及其增加幅度均增大,细沟侵蚀愈剧烈。
|
| [5] |
|
| [6] |
细沟侵蚀动力过程输沙能力试验研究 [J].https://doi.org/10.3321/j.issn:0564-3929.2002.04.004 URL [本文引用: 1] 摘要
细沟水流的输沙能力是土壤侵蚀的重要参数之一,对于土壤侵蚀预报和土壤侵蚀过程模拟尤为重 要.在不考虑土壤团粒结构条件下,根据集中稳定水流条件下侵蚀产沙随沟长增加而增加并将最终趋近于水流输沙能力的事实,提出了通过改变沟长来量测水流输沙 能力的实验室水槽测量方法.相应地提出了根据试验数据计算水流输沙能力的函数表达式.用一种粉粘(黄土)土壤,进行了一系列(405次)室内水槽摹拟试 验.采用五种坡度(5°,10°,15°, 20°,25°)、三个流量(2,4,8 L min-1)的细沟侵蚀产沙数据,分析了输沙能力与沟坡、入流量的相互关系.
Laboratory study on sediment transport capacity in the dynamic process of rill erosion [J].https://doi.org/10.3321/j.issn:0564-3929.2002.04.004 URL [本文引用: 1] 摘要
细沟水流的输沙能力是土壤侵蚀的重要参数之一,对于土壤侵蚀预报和土壤侵蚀过程模拟尤为重 要.在不考虑土壤团粒结构条件下,根据集中稳定水流条件下侵蚀产沙随沟长增加而增加并将最终趋近于水流输沙能力的事实,提出了通过改变沟长来量测水流输沙 能力的实验室水槽测量方法.相应地提出了根据试验数据计算水流输沙能力的函数表达式.用一种粉粘(黄土)土壤,进行了一系列(405次)室内水槽摹拟试 验.采用五种坡度(5°,10°,15°, 20°,25°)、三个流量(2,4,8 L min-1)的细沟侵蚀产沙数据,分析了输沙能力与沟坡、入流量的相互关系.
|
| [7] |
野外模拟崩岗崩积体坡面产流过程及水分分布 [J].
为研究崩岗崩积体坡面产流特征及土体水分分布特征,采用人工模拟降雨方法,在广东五华县莲塘岗崩岗选择7个不同部位的崩积体,进行28场人工模拟降雨,测定降雨过程中坡面产流时间及水分分布。结果表明:1)坡面产流时间与降雨强度呈负指数幂函数关系;2)老崩积体坡面产流时间与10 cm深处土体初始含水率呈负对数函数关系,其他深度土体初始含水率,以及新崩积体各土层初始含水率与坡面产流时间关系不密切;3)根据土体初始含水率和降雨强度,可以应用三维曲面模型预测崩积体坡面产流所需时间;4)当降雨强度≥3.5 mm/min时,崩积体坡面产流时间与坡度呈现出负相关关系,即随着坡度增大,产流时间变短;5)崩积体坡面产流后,新、老崩积体10 cm深处土体含水率差异明显,新崩积体土体含水率在20%以下,老崩积体土体含水率在20%以上;6)无论是降雨结束时还是降雨后24 h的水分再分布,新崩积体的湿润锋深度均大于老崩积体,表明在降雨作用下新崩积体的失稳深度大于老崩积体的失稳深度。该研究为崩岗崩积体侵蚀预测和防治提供参考。
Simulated runoff processes on colluvial deposits of Liantanggang benggang and their water distributions [J].
为研究崩岗崩积体坡面产流特征及土体水分分布特征,采用人工模拟降雨方法,在广东五华县莲塘岗崩岗选择7个不同部位的崩积体,进行28场人工模拟降雨,测定降雨过程中坡面产流时间及水分分布。结果表明:1)坡面产流时间与降雨强度呈负指数幂函数关系;2)老崩积体坡面产流时间与10 cm深处土体初始含水率呈负对数函数关系,其他深度土体初始含水率,以及新崩积体各土层初始含水率与坡面产流时间关系不密切;3)根据土体初始含水率和降雨强度,可以应用三维曲面模型预测崩积体坡面产流所需时间;4)当降雨强度≥3.5 mm/min时,崩积体坡面产流时间与坡度呈现出负相关关系,即随着坡度增大,产流时间变短;5)崩积体坡面产流后,新、老崩积体10 cm深处土体含水率差异明显,新崩积体土体含水率在20%以下,老崩积体土体含水率在20%以上;6)无论是降雨结束时还是降雨后24 h的水分再分布,新崩积体的湿润锋深度均大于老崩积体,表明在降雨作用下新崩积体的失稳深度大于老崩积体的失稳深度。该研究为崩岗崩积体侵蚀预测和防治提供参考。
|
| [8] |
崩岗地貌发育的土体物理性质及其土壤侵蚀意义: 以广东五华县莲塘岗崩岗为例 [J].
<p>摘要:崩岗集中发育在我国广东、福建等东南7省(自治区),面积约5万km<sup>2</sup>,是华南地区土壤侵蚀最严重的区域。崩岗是水力—重力复合侵蚀交替作用的产物,也是沟谷侵蚀发展的结果。崩岗主要发育在花岗岩厚层风化壳上,崩岗土体以高黏粒、低砾石含量的粗砂土为基本特征。崩岗崩积锥土体粒径自坡顶至坡脚由粗变细,反映出坡面流水的侵蚀和搬运过程。崩岗土体可蚀性强,可蚀性因子<em>K</em>值平均为0.26,比花岗岩红壤地区的平均<em>K</em>值高0.03~0.05。崩积锥坡脚<em>K</em>值大于坡顶,即坡脚可蚀性大于坡顶。崩岗崩壁和崩积锥土体的平均黏粒含量为10.13%,大于5%这一泥石流形成的必要条件。崩岗流[JP2]域地形陡峻,一旦遭遇强降雨,有条件转化成“泥石流”。崩岗形成的“泥石流”平均中值粒径仅为常规泥石流的1/12,砾石含量仅为1/4。因此,崩岗型泥石流(即由崩岗转化成的“泥石流”)并不是通常意义上的泥石流,是广义泥石流大类中的一个新种——泥砂流。</p>
Soil physical properties of collapsing hill and gully and their indications for soil erosion: An example of Liantanggang collapsing hill and gully in Wuhua county of Guangdong [J].
<p>摘要:崩岗集中发育在我国广东、福建等东南7省(自治区),面积约5万km<sup>2</sup>,是华南地区土壤侵蚀最严重的区域。崩岗是水力—重力复合侵蚀交替作用的产物,也是沟谷侵蚀发展的结果。崩岗主要发育在花岗岩厚层风化壳上,崩岗土体以高黏粒、低砾石含量的粗砂土为基本特征。崩岗崩积锥土体粒径自坡顶至坡脚由粗变细,反映出坡面流水的侵蚀和搬运过程。崩岗土体可蚀性强,可蚀性因子<em>K</em>值平均为0.26,比花岗岩红壤地区的平均<em>K</em>值高0.03~0.05。崩积锥坡脚<em>K</em>值大于坡顶,即坡脚可蚀性大于坡顶。崩岗崩壁和崩积锥土体的平均黏粒含量为10.13%,大于5%这一泥石流形成的必要条件。崩岗流[JP2]域地形陡峻,一旦遭遇强降雨,有条件转化成“泥石流”。崩岗形成的“泥石流”平均中值粒径仅为常规泥石流的1/12,砾石含量仅为1/4。因此,崩岗型泥石流(即由崩岗转化成的“泥石流”)并不是通常意义上的泥石流,是广义泥石流大类中的一个新种——泥砂流。</p>
|
| [9] |
基于三维激光扫描的崩岗沟道侵蚀与坡向发育及其侵蚀量计算 [J].
探讨崩岗流域沟道侵蚀及其引起的崩岗坡面的坡向变化,对崩岗流域的科学整治具有重要意义;崩岗沟道侵蚀量的计算,是崩岗流域侵蚀强度划分和崩岗侵蚀方式甄别的主要依据.利用Leica Scan Station 2三维激光扫描仪,以广东五华县莲塘岗崩岗为研究案例,通过3年共计6次定位监测,获取了5个监测周期的高精度地形数据.以此为基础,结合Arc GIS软件,对崩岗沟道发育及其坡向变化进行定量分析.研究结果表明,沟道侵蚀是崩岗流域主要侵蚀方式之一,53.6%的侵蚀量来自切沟和冲沟的沟床下切和沟壁侧蚀,其中下切侵蚀又是沟道侵蚀的主要形式.沟道总长度和流域切割密度出现先增加后减小的阶段性变化,3年平均流域切割密度为158km/km2.沟道走向对崩岗坡面的坡向发育具有控制作用.沟头的细沟和切沟的溯源侵蚀对坡面的坡向具有重塑作用,坡面面积减少的坡向的反方向,即为沟道溯源侵蚀的主方向.侵蚀强度最大的坡向与主沟道发育的走向NNW—SSE一致,这是由当地区域构造应力场的一组剪切应力产生的裂隙走向所决定的.沟道侵蚀作用对崩岗流域演化具有深刻的影响.
Erosion volume calculation of benggang gully and their slope development based on 3D laser scanning [J].
探讨崩岗流域沟道侵蚀及其引起的崩岗坡面的坡向变化,对崩岗流域的科学整治具有重要意义;崩岗沟道侵蚀量的计算,是崩岗流域侵蚀强度划分和崩岗侵蚀方式甄别的主要依据.利用Leica Scan Station 2三维激光扫描仪,以广东五华县莲塘岗崩岗为研究案例,通过3年共计6次定位监测,获取了5个监测周期的高精度地形数据.以此为基础,结合Arc GIS软件,对崩岗沟道发育及其坡向变化进行定量分析.研究结果表明,沟道侵蚀是崩岗流域主要侵蚀方式之一,53.6%的侵蚀量来自切沟和冲沟的沟床下切和沟壁侧蚀,其中下切侵蚀又是沟道侵蚀的主要形式.沟道总长度和流域切割密度出现先增加后减小的阶段性变化,3年平均流域切割密度为158km/km2.沟道走向对崩岗坡面的坡向发育具有控制作用.沟头的细沟和切沟的溯源侵蚀对坡面的坡向具有重塑作用,坡面面积减少的坡向的反方向,即为沟道溯源侵蚀的主方向.侵蚀强度最大的坡向与主沟道发育的走向NNW—SSE一致,这是由当地区域构造应力场的一组剪切应力产生的裂隙走向所决定的.沟道侵蚀作用对崩岗流域演化具有深刻的影响.
|
| [10] |
基于知识图谱的中国崩岗研究现状及综合分析 [J].
崩岗是一种发育在中国南方低山丘陵地区的水土流失地貌类型,侵蚀量巨大,危害严重。为回顾半个世纪以来中国崩岗研究的发展历程,以中国知网(CNKI)数据库为数据源,统计分析1966—2016年间以"崩岗"为主题的文献数量、时间分布及载文期刊情况,基于Cite Space对崩岗研究知识图谱进行可视化挖掘与分析,识别出核心作者群、主要研究机构及高频关键词。研究结果表明:1)半个世纪以来中国崩岗研究的论文数量整体呈现区间波动增长的态势。2)载文期刊以水土保持学科为主,学科交叉研究有待加强;期刊影响因子总体偏低,反映崩岗研究水平有待提高。3)研究机构之间学术交流较少,科研实力差异显著,有待加强交流合作,实现共同发展。4)中国崩岗研究主要围绕"崩岗""崩岗侵蚀""土壤侵蚀""水土流失""坡面""风化壳"等展开,"崩积体"和土体"抗剪强度"是近年来崩岗研究的热点。崩岗研究产出论文大部分与防控治理措施有关,定量研究较少。研究结果有助于科研工作者对中国崩岗研究历史与现状有较全面、客观、准确的认识,从而更好地精炼研究方向,为崩岗的后续研究提供更深入具体的指导。
Status and comprehensive analysis of benggang research in China based on knowledge maps [J].
崩岗是一种发育在中国南方低山丘陵地区的水土流失地貌类型,侵蚀量巨大,危害严重。为回顾半个世纪以来中国崩岗研究的发展历程,以中国知网(CNKI)数据库为数据源,统计分析1966—2016年间以"崩岗"为主题的文献数量、时间分布及载文期刊情况,基于Cite Space对崩岗研究知识图谱进行可视化挖掘与分析,识别出核心作者群、主要研究机构及高频关键词。研究结果表明:1)半个世纪以来中国崩岗研究的论文数量整体呈现区间波动增长的态势。2)载文期刊以水土保持学科为主,学科交叉研究有待加强;期刊影响因子总体偏低,反映崩岗研究水平有待提高。3)研究机构之间学术交流较少,科研实力差异显著,有待加强交流合作,实现共同发展。4)中国崩岗研究主要围绕"崩岗""崩岗侵蚀""土壤侵蚀""水土流失""坡面""风化壳"等展开,"崩积体"和土体"抗剪强度"是近年来崩岗研究的热点。崩岗研究产出论文大部分与防控治理措施有关,定量研究较少。研究结果有助于科研工作者对中国崩岗研究历史与现状有较全面、客观、准确的认识,从而更好地精炼研究方向,为崩岗的后续研究提供更深入具体的指导。
|
| [11] |
切割下坠: 砂页岩地区崩岗源头墙壁后退方式之一 [J].https://doi.org/10.3969/j.issn.1000-288X.1999.06.005 URL [本文引用: 1] 摘要
砂页岩地区崩岗源头墙壁的后退是通过切割-下坠的方式进行的,这是水蚀和重力侵蚀共同作用的一种侵蚀方式,这明显区别于花岗岩地区的崩岗侵蚀,那里的崩岗墙壁后退主要是重力侵蚀的结果.
Cutting-toppling: One of patterns of slop disintegration erosion [J].https://doi.org/10.3969/j.issn.1000-288X.1999.06.005 URL [本文引用: 1] 摘要
砂页岩地区崩岗源头墙壁的后退是通过切割-下坠的方式进行的,这是水蚀和重力侵蚀共同作用的一种侵蚀方式,这明显区别于花岗岩地区的崩岗侵蚀,那里的崩岗墙壁后退主要是重力侵蚀的结果.
|
| [12] |
福建崩岗沟侵蚀机理探讨 [J].Study on erosion mechanism of collapse gully in Fujian [J]. |
| [13] |
|
| [14] |
崩岗灾害地貌及其环境效应 [J].Gravity gully erosion and it's influence [J]. |
| [15] |
崩岗泥砂流粒度特性及流体类型分析: 以广东五华县莲塘岗崩岗为例 [J].https://doi.org/10.11867/j.issn.1001-8166.2014.07.0810 URL Magsci [本文引用: 2] 摘要
<p>崩岗泥砂流是降雨过程中在崩岗流域内形成的一种固液两相流,是崩岗侵蚀泥沙向外输移的主要方式,泥砂流流体类型的判别也是崩岗治理的依据之一。通过野外考察与现场采样,对崩岗泥砂流的粒度组成特性进行了分析。结果表明,泥砂流容重介于1.16~1.60 t/m<sup>3</sup>之间,含沙量为257.03~960.55 kg/m<sup>3</sup>,且均自沟道上部至下部逐渐降低。泥砂流浆体以粉砂和黏粒物质为主。随着容重的增加,粒度曲线由单峰型转变为与风化壳土体类似的双峰型,呈现无分选搬运的特点,且流体粒度逐渐粗化。泥砂流固体物质中值粒径与流体容重有较好的线性正相关关系。通过对泥砂流与泥石流和黄土丘陵沟壑区高含沙水流粒度特性的对比后发现,泥砂流属于高含沙水流向泥石流过渡的中间类型,但与泥石流具有更为密切的关系,可以认为泥砂流是广义泥石流的一个亚类,即崩岗型泥石流。</p>
Analysis of the grain size properties and flow body classes of the mud sand flow: An example of Liantanggang collapsing hill and gully in Wuhua county of Guangdong [J].https://doi.org/10.11867/j.issn.1001-8166.2014.07.0810 URL Magsci [本文引用: 2] 摘要
<p>崩岗泥砂流是降雨过程中在崩岗流域内形成的一种固液两相流,是崩岗侵蚀泥沙向外输移的主要方式,泥砂流流体类型的判别也是崩岗治理的依据之一。通过野外考察与现场采样,对崩岗泥砂流的粒度组成特性进行了分析。结果表明,泥砂流容重介于1.16~1.60 t/m<sup>3</sup>之间,含沙量为257.03~960.55 kg/m<sup>3</sup>,且均自沟道上部至下部逐渐降低。泥砂流浆体以粉砂和黏粒物质为主。随着容重的增加,粒度曲线由单峰型转变为与风化壳土体类似的双峰型,呈现无分选搬运的特点,且流体粒度逐渐粗化。泥砂流固体物质中值粒径与流体容重有较好的线性正相关关系。通过对泥砂流与泥石流和黄土丘陵沟壑区高含沙水流粒度特性的对比后发现,泥砂流属于高含沙水流向泥石流过渡的中间类型,但与泥石流具有更为密切的关系,可以认为泥砂流是广义泥石流的一个亚类,即崩岗型泥石流。</p>
|
| [16] |
湖南崩岗侵蚀成因及综合防治体系探讨 [J].Analysis on genesis erosion of dilapidated granite and approach to integrated system of prevention and control in Hunan [J]. |
| [17] |
|
| [18] |
华南活动崩岗崩壁土体裂隙发育规律试验研究 [J].
为了研究崩壁裂隙发育对崩壁稳定性的影响,试验采集了广东德庆崩岗侵蚀区的崩壁不同部位土样,对其进行脱湿作用下的裂隙发育演变规律室内试验研究,试验中采用烘干法模拟脱湿过程,在脱湿过程中,定时定位对土样进行称重、拍照,以记录裂隙发育情况,利用ArcGIS软件对裂隙照片进行矢量化处理,提取裂隙的各种几何要素,进行裂隙度计算来分析裂隙发育情况.结果表明:不同部位土体裂隙发育程度达到相对稳定时的土壤含水量和时间不同,其中崩壁顶部(B1)土体最先产生裂隙和达到稳定状态,其次是中部(B2),最后是下部(B3);不同崩壁土体的裂隙面积密度、长度密度和连通性指数都随着含水率的减少而增大,达到最大值之后保持稳定,变化趋势一致.正是由于崩壁土体裂隙的发育程度不一,在到达稳定的时间和含水量的不同,从而导致崩壁土体各部位受力不均,土体强度产生差异,从而最终导致在雨季崩壁失稳而发生崩岗.
Simulation of morphological development of soil cracks in the collapsing hill region of southern China [J].
为了研究崩壁裂隙发育对崩壁稳定性的影响,试验采集了广东德庆崩岗侵蚀区的崩壁不同部位土样,对其进行脱湿作用下的裂隙发育演变规律室内试验研究,试验中采用烘干法模拟脱湿过程,在脱湿过程中,定时定位对土样进行称重、拍照,以记录裂隙发育情况,利用ArcGIS软件对裂隙照片进行矢量化处理,提取裂隙的各种几何要素,进行裂隙度计算来分析裂隙发育情况.结果表明:不同部位土体裂隙发育程度达到相对稳定时的土壤含水量和时间不同,其中崩壁顶部(B1)土体最先产生裂隙和达到稳定状态,其次是中部(B2),最后是下部(B3);不同崩壁土体的裂隙面积密度、长度密度和连通性指数都随着含水率的减少而增大,达到最大值之后保持稳定,变化趋势一致.正是由于崩壁土体裂隙的发育程度不一,在到达稳定的时间和含水量的不同,从而导致崩壁土体各部位受力不均,土体强度产生差异,从而最终导致在雨季崩壁失稳而发生崩岗.
|
| [19] |
A review of hillslope and watershed scale erosion and sediment transport models [J].https://doi.org/10.1016/j.catena.2005.08.008 URL [本文引用: 1] 摘要
This study reviews the existing erosion and sediment transport models developed at hillslope and watershed scales. The method followed in this review is to summarize the models with a focus on the physically based modeling technique as well as with a brief discussion about empirical and conceptual models. Approaches for determining the sediment transport capacity of flow are explained. The extension of a sediment transport model to a nutrient transport model is then discussed. Finally, the future of erosion and sediment transport models are projected to include the probabilistic description of hydrology, the physical characteristics of the watershed, and the stochastic structure of soil properties. The review is expected to be of interest to researchers, watershed managers and decision-makers while searching for models to study erosion and sediment transport phenomena and related processes such as pollutant and nutrient transport.
|
| [20] |
A rainfall simulator for laboratory-scale assessment of rainfall-runoff-sediment transport processes over a two-dimensional flume [J].https://doi.org/10.1016/j.catena.2012.06.009 URL [本文引用: 2] 摘要
A rainfall simulator is an ideal tool for infiltration, soil erosion, and other related research areas for replicating the process and characteristics of natural rainfall. In this study, a laboratory-scale rainfall simulator is developed. Rainfall characteristics including the rainfall intensity and its spatial uniformity, raindrop size, raindrop velocity, and kinetic energy confirm that natural rainfall conditions are simulated with sufficient accuracy. Pressure nozzles are used to spray water corresponding to rainfall intensities ranging from 45 to 10502mm02h 61021 . The simulator produces rainfall with uniformity coefficient changing between 82 and 89%. The raindrops falling with an initial velocity from a height of 2.4302m have median diameters of 2.2–3.102mm. The impact velocities of the median size raindrops deviate from their terminal velocities with a relative error between 6 and 15%. The accompanying erosion flume can be given slope up to 20% in lateral and longitudinal directions. During the experiments, flow measurement is taken from two outlets at the end of the flume to distinguish the contribution of interrill areas into rills. Experiments result in typical rainfall-induced hydrographs and sedigraphs observed under natural conditions. This shows the ability of the rainfall simulator for use in sediment transport processes over hillslopes.
|
| [21] |
Controlling factors of gullying in the Maracujá catchment, southeastern Brazil [J].https://doi.org/10.1002/esp.1193 URL [本文引用: 5] 摘要
Hundreds of gullies (vo orocas) of huge dimensions (up to 400-500 m long, 150 m wide and 50 m deep) are very common in the small Maracuj Catchment in southeastern Brazil. These erosional features, which occur with an uneven intensity throughout the area, started due to bad soil management practices at the beginning of European settlement, at the end of the 17th century, and nowadays are still evolving, but at a slower rate. As surface soils are usually very resistant to erosion, the outcrop of the more erodible basement saprolites seems to be an essential condition for their beginning. An analysis of well known erosion controlling factors was performed, aiming to explain the beginning and evolution of these gullies and to understand the reasons for their spatial distribution. Data shows that geology and, mainly, geomorphology are the main controlling factors, since gullies tend to be concentrated in basement rock areas with lower relief (domain 2) of Maracuj Catchment, mainly at the fringes of broad and flat interfluves. At the detailed scale (1:10 000), gullies are more common in amphitheatre-like headwater hollows that frequently represent upper Quaternary gullies (paleogullies), which demonstrate the recurrence of channel erosion. So, gullies occur in areas of thicker saprolites (domain 2), in places with a natural concentration of surface and underground water (hollows). Saprolites of the preserved, non-eroded hollows are usually pressurized (confined aquifer) due to a thick seal of Quaternary clay layer, in a similar configuration to the ones found in hollows of mass movement (mudflow) sites in southeastern Brazil. Therefore, the erosion of the resistant soils by human activities, such as road cuts and trenches (valos), or their mobilization by mudflow movements, seem to be likely mechanisms of gullying initiation. Afterwards, gullies evolve by a combination of surface and underground processes, such as wash and tunnel erosion and falls and slumps of gully walls. Copyright 2005 John Wiley & Sons, Ltd.
|
| [22] |
Investigation of infiltration characteristics and debris flow initiation conditions in debris flow source areas using a rainfall simulator [J].https://doi.org/10.1002/(ISSN)1099-1085 URL [本文引用: 1] |
| [23] |
Soil erosion science: Reflections on the limitations of current approaches [J].https://doi.org/10.1016/j.catena.2006.03.007 URL [本文引用: 1] 摘要
In terms of explanation of erosion, the greatest need is for a full recognition of the importance of socio-economic drivers. The accession of new countries to the EU with different economic and land-use histories emphasises this need. Too often we have left people, especially the farmers, out of the picture. Our approach could be characterised as ‘data-rich and people-poor’.
|
| [24] |
Gully erosion: Processes and models [J].https://doi.org/10.1177/030913339101500403 URL [本文引用: 5] 摘要
No abstract available.
|
| [25] |
Investigation of relationships between measured field indicators and erosion processes on badland surfaces at Petrer, Spain [J].https://doi.org/10.1016/S0341-8162(99)00046-6 URL [本文引用: 3] 摘要
Indicators were obtained to measure and predict rill erosion and mass wasting in biancana and calanchi-like badland areas. Rainfall simulation experiments were used to find a relationship between soil moisture change and sediment concentration behaviour. This relationship appeared to be able to show, in its role as indicator, differences between materials affected by various degrees of rill erosion or mass wasting. Indicators explaining this relationship are surface characteristics, runoff and infiltration characteristics and chemical and mineralogical soil properties. From the experimental study it was concluded that the high infiltration capacity in materials affected by mass wasting resulted in an unstable soil and a high degree of erodibility. The materials which were more affected by rill erosion or had a continuous crust at the surface were saturated earlier during the experiment than the other materials. This saturation caused an increase in runoff. The mechanism is explained as the system crossing a threshold after which flow hydraulics at the surface are more important for erosion processes than dynamic soil properties and infiltration characteristics.
|
| [26] |
Runoff and soil loss from Pinus massoniana forest in southern China after simulated rainfall [J].https://doi.org/10.1016/j.catena.2015.02.009 URL [本文引用: 1] 摘要
61Forest soil loss mainly determined by rainfall intensity, slope and runoff rate61There are interactions between the slope and runoff affecting soil loss.61A model composed of rainfall, slope and runoff was used to predict forest soil loss.
|
| [27] |
Testing GIS-morphometric analysis of some Sicilian badlands [J].https://doi.org/10.1016/j.catena.2013.08.021 URL [本文引用: 3] 摘要
Calanchi badlands are erosion landforms characterized by areas with scarce or absent vegetation, steep slopes, knife-edge divides and high erosion rates. They are originated by a combination of morphogenetic processes, partly similar to those shaping bigger fluvial landforms, and therefore can be considered as field “laboratories.” This paper presents the results of an investigation carried out in two badland sites located in Sicily, where the geometry of 25 calanchi has been characterized using Digital Elevation Models having a mesh size equal to 2m. For each landform, a power length–volume relationship is established. This relationship demonstrates that length of calanchi channels can be used as a reliable predictor of eroded volume, as already verified for smaller linear erosion landforms such as rills, ephemeral and permanent gullies. Moreover, length, volume, width and depth of calanchi are combined into two dimensionless groups, allowing to establish a morphological similarity between rills, ephemeral, permanent gullies and the studied badlands. Furthermore the Hack's law, which relates channel length to drainage basin area, is applied to the 25 calanchi basins obtaining an exponent of this power law smaller than 0.5; this result indicates that basins do not become necessarily more elongate with increasing size. Finally the relationships between maximum length and width of the landforms are analyzed demonstrating that calanchi basins become wider, and not longer and narrower, when evolving and increasing their size.
|
| [28] |
The influence of slope angle on sediment, water and seed losses on badland landscapes [J].https://doi.org/10.1016/s0169-555x(96)00019-0 URL [本文引用: 2] 摘要
By means of simulated rainfall the influence of the slope angle on the soil, water and seed erosion has been studied on badland surfaces. Slope angle has a clear positive effect controlling soil erodibility and erosion rates, but it does not have any influence on the volume of runoff after 40 minutes of rain at an intensity of 55 mm h . In contrast, slope angle has a clear influence on runoff initiation, with cracks and crusts as the main factors controlling the time to ponding and time to runoff. Both ponding and runoff initiation start earlier on pediments than on slopes, where more cracks exist. Steady-state infiltration rates and seed losses have an inverse relationships with slope angle. Pediments have 40 times lower erosion rates and 6 times higher seed losses than slopes. The different behaviour of seed losses between pediment and slope is due to the strategy of the seeds against erosion processes.
|
| [29] |
Shakedown in Madagascar: Occurrence of lavakas (erosional gullies) associated with seismic activity [J].https://doi.org/10.1130/G30670.1 URL [本文引用: 2] 摘要
Not Available
|
| [30] |
Gully erosion and sediment transport in a small subtropical catchment, South China [J].https://doi.org/10.1016/S0341-8162(96)00053-7 URL [本文引用: 1] 摘要
ABSTRACT Discharge and sediment concentration were monitored at two dams, as well as gully erosion at four locations during 1988 1989 in the Shenchong experimental basin (0.73 km2) located in subtropical Deqing County, Guangdong Province. The temporal pattern of sediment concentration at the basin outlet is closely related to gully discharge and due to the proximity of the gully sediment source to the gauging station, the hysteresis pattern at the lower dam is dominantly clockwise. Discharge thresholds exist in the sediment concentration-discharge relationships at both the upper and the lower dams. At the upper dam, they are related to the presence of local wetlands which act as a buffer to sediment transport in the channel. At the lower dam, they result from variable sources of sediment as well as early flow cessation in gullies. Computation of sediment yield from gullies confirms that they accounted for over 85% of the sediment load that passed through the lower dam.
|
| [31] |
Thirty years of studies on badlands, from physical to vegetational approaches: A succinct review [J].https://doi.org/10.1016/j.catena.2012.02.008 URL [本文引用: 1] 摘要
The scientific subjects addressed in the research into badlands since the publication of Bryan and Yair's book (Bryan, R.B. and Yair, A. (Editors), 1982 Badland geomorphology and piping. Geo Books, Norwich, 408 pp.) are briefly analysed. With a steadily increasing number of papers per year, attention to some aspects, such as runoff generation, piping and the role of lithology and soils, varied, whereas the percentage of studies on erosion rates increased steadily over time. Vegetation was not a subject of research in early papers, as most of the papers dealing with vegetation were rather descriptive and published in local or limited-diffusion media, which contrasts with the present situation when about 40% of papers published in international journals about badlands address some aspect of vegetation. However, the growth in the attention paid to vegetation and erosion rates was not linked to any increase in papers dealing with badland reclamation. Badlands are now seen as a group of systems with some common features but diverse dynamics, depending mainly on climatic and lithological drivers. More attention should be paid in the future to investigating the evolution of these landforms over time, mostly through modelling studies, whereas emerging technologies foster detailed analyses that were not possible formerly. Although some badland areas determine on- and off-site environmental issues, others are spots of landscape diversity that merit protection rather than reclamation.
|
| [32] |
Relationship between discharge, velocity and flow area for rills eroding loose, non-layered materials [J].https://doi.org/10.1002/esp.3290170510 URL [本文引用: 1] 摘要
Abstract A relationship between discharge, flow velocity and flow area in rills is established using data from four field and laboratory studies. The proposed relationship is shown to predict successfully flow velocities measured in six other studies. Although slopes range from 0.035 to 0.45 and soil materials range from stony sands over silt loams to vertisols, mean flow velocity can be well predicted from discharge alone. Thus, there is no important influence of slope and/or soil material characteristics on flow velocities in rills. The proposed relationship may be used to improve performance of deterministic flow routing models when applied to rilled catchments. Furthermore, it allows the calculation of unit stream power, which has been shown to be related to the transporting capacity of overland flow, in terms of slope and discharge.
|
| [33] |
Effects of rainfall intensity, underlying surface and slope gradient on soil infiltration under simulated rainfall experiments [J].https://doi.org/10.1016/j.catena.2012.10.013 URL [本文引用: 1] 摘要
Knowledge of infiltration patterns and process is very important in understanding and managing slope hydrological processes, crop irrigation, soil erosion, and so on. This paper describes a study in which simulated rainfall events were used to study the effects of various factors (vegetation cover, rainfall intensity, and slope angle) on the soil moisture increase after rainfall and the infiltration recharge coefficient. Soils hosting three different plants (purple medic, PM; spring wheat, SW; and ryegrass, RS) were considered, along with bare soil (BL). These soil surfaces were tested with four different slopes (8.8, 17.6, 26.8 and 36.4%) and subjected to five different rainfall intensities (0.5, 0.75, 1.0, 1.5 and 2.002mm02min 61021 ). The following key results were obtained: (1) The water distribution in BL boxes differed significantly from that in boxes with vegetation cover, but all boxes with vegetation cover exhibited similar distributions. Vegetation cover significantly increased the depth of the wetting front: under very similar conditions, the wetting front in the RS box reached a depth of more than 3502cm, while that in the BL box reached only 2502cm. (2) Vegetation cover (especially ryegrass) yielded a greater soil moisture increase than did bare land. The overall average soil moisture increase for RS boxes was 36.702±025.102mm, about twice than that of BL. (3) The water storage after rain across the whole soil profile initially increased and then decreased as the rainfall intensity rose. No differences in the average soil water content increase were found between various rainfall intensities. (4) As the slope increased from 8.8% to 36.4%, the water storage increase initially rose but then fell sharply. There were significant differences (p02=020.05) between the water storage increases for gradual slopes (8.8 and 17.6%) and steep slopes (26.8 and 3.4%). (5) The recharge coefficient increased with increasing vegetation cover but decreased with increasing rainfall intensity, slope gradient, and initial soil water content. The average value for boxes with vegetation cover was 1.5 times that for BL boxes. The vegetation cover was the most important factor in determining the recharge coefficient.
|
| [34] |
European small portable rainfall simulators: A comparison of rainfall characteristics [J].https://doi.org/10.1016/j.catena.2013.05.013 URL [本文引用: 2] 摘要
61Small portable rainfall simulators in soil erosion and soil hydrology studies61Detailed investigation of simulated rainfall characteristics61Comparison of artificial rainfall generated by 13 rainfall simulators based in Europe61Identical methods in all simulations to ensure comparability61Methods: Laser Precipitation Monitor and rain collectors
|
| [35] |
Effects of rainfall intensity and slope gradient on steep colluvial deposit erosion in southeast China [J].https://doi.org/10.2136/sssaj2014.04.0132 URL [本文引用: 2] 摘要
Abstract Rainfall intensity and slope gradient are important factors that affect soil erosion; however, contradictory observations have been made due to different experimental conditions and materials. Colluvial deposits with loose, coarse material and steep slopes are easily erodible, but the erosion mechanism of colluvial deposition remains obscure. This work investigated the effects of heavy and storm rainfall intensity and steep slope gradients on the infiltration, runoff, and soil loss of colluvial soil. The rainfall intensity ranged from 1.00 to 2.33 mm min(-1), and the slope gradient ranged from 36 to 84%. The infiltration rates declined sharply in the initial stage, whereas an opposite trend was observed for runoff rates until a steady state was reached after 5 min. Single-and multiple-peak models illustrated the two types of changes for the sediment yield process. The infiltration volume and the coefficient increased with increasing rainfall intensity and decreased with increasing slope, whereas the runoff coefficient decreased with increasing rainfall intensity and increased with increasing slope. Runoff volume and sediment yield increased with increasing rainfall intensity but had a critical slope gradient of 58% and >47%. The sediment concentration increased with increasing rainfall intensity, and first increased and then decreased with increasing slope gradients at rainfall intensities of 1.00 and 1.33 mm min(-1) but increased at rainfall intensities of 1.67, 2.00, and 2.33 mm min(-1). The findings of this study can be used to clarify the erosion mechanisms in disturbed soils with high coarse particle content.
|
| [36] |
Assessing the sources of sediment transported in gully systems using a fingerprinting approach: An example from south-east China [J].https://doi.org/10.1016/j.catena.2015.02.012 URL [本文引用: 1] 摘要
61The sediment movement in gully using fingerprinting method was evaluated.61Tracers afforded over 97% correct assignations in discriminate sediment sources.61Surface soil layer contributed 70% of slumping deposit sediment in active gully.61In potential stable and stable gully sediments mainly coming from other two layers61Only 10% of alluvial fan's sediment came from surface layer soils in active gully.
|
| [37] |
Characteristics of slope runoff and soil water content in benggang colluvium under simulated rainfall [J].https://doi.org/10.1007/s11368-017-1742-0 URL [本文引用: 1] 摘要
Purpose The slope-produced runoff time (runoff time) of colluvium in a benggang(collapse hill and erosion gully) is related to rainfall characteristics and water infiltration as well as slope angle....
|
| [38] |
Gully morphology, hillslope erosion, and precipitation characteristics in the Appalachian valley and Ridge province, southeastern USA [J].https://doi.org/10.1016/j.catena.2015.05.015 URL [本文引用: 3] 摘要
This study investigates gully erosion on an east Tennessee hillslope in a humid subtropical climate. The study area is deeply gullied in Ultisols (Acrisol, according to the World Reference Base for Soil), with thirty years of undisturbed erosional history with no efforts to correct or halt the erosion. The objectives are (1) to examine how different gully morphologies (channel, sidewall, and interfluve) behave in response to precipitation-driven erosion, and (2) to identify an appropriate temporal scale at which precipitation-driven erosion can be measured to improve soil loss prediction. Precipitation parameters (total accumulation, duration, average intensity, maximum intensity) extracted from data collected at an on-site weather station were statistically correlated with erosion data. Erosion data were collected from erosion pins installed in four gully systems at 78 locations spanning three different morphological settings: interfluves, channels, and sidewalls. Kruskal–Wallis non-parametric tests and Mann–Whitney U-tests indicated that different morphological settings within the gully system responded differently to precipitation (p02<020.00). For channels and sidewalls, regression models relating erosion and precipitation parameters retained antecedent precipitation and precipitation accumulation or duration (R 2 02=020.50, p02<020.00 for channels, R 2 02=020.28, p02<020.00 for sidewalls) but precipitation intensity variables were not retained in the models. For interfluves, less than 20% of variability in erosion data could be explained by precipitation parameters. Precipitation duration and accumulation (including antecedent precipitation accumulation) were more important than precipitation intensity in initiating and propagating erosion in this geomorphic and climatic setting, but other factors including mass wasting and eolian erosion are likely contributors to erosion. High correlation coefficients between aggregate precipitation parameters and erosion indicate that a suitable temporal scale to relate precipitation to soil erosion is the synoptic time-scale. This scale captures natural precipitation cycles and corresponding measurable soil erosion.
|
| [39] |
Environmental analysis of soil erosion in Guangdong province: A Deqing case study [J].https://doi.org/10.1016/S0341-8162(96)00049-5 URL [本文引用: 1] 摘要
In this paper, the soil erosion problem in Deqing County, especially its impacts and its severity in the spatial context, is discussed. The causes of soil erosion are analysed with respect to dominant factors and observed erosion processes. Based on such information, the relative cost-effectiveness of the range of erosion control measures are determined. These measures, when combined with attempts to improve land productivity in an integrated watershed management plan, and implemented by innovative forms of cost-sharing, are considered to be the ultimate solution to solving the problems of soil erosion and land management in the granitic regions of Guangdong Province.
|
| [40] |
Effects of land-use changes in vegetation cover and sidewall erosion in a gully head of the Penedès region (northeast Spain) [J].https://doi.org/10.1002/esp.1870 URL [本文引用: 1] 摘要
The present research addresses the effects of land-use changes in the evolution of vegetation cover on gully erosion in the Penedès region of northeast Spain. The contribution of vegetation cover to gully wall stabilization is also discussed. The catchment area of the gully is 60·2 ha and is mainly composed of vineyards. In this area, large gullies have developed on Tertiary marls and unconsolidated sandstones. Detailed aerial photographs (1 : 5000 and 1 : 7000 scale) of three dates (1975, 1995 and 2002) were ortho-rectified to derive land-use information in the catchment, gully vegetation cover and height information to construct detailed digital elevation models. Land-use and gully vegetation cover mapping of the most recent period was assisted by means of fieldwork and a photo-interpretation key constructed to help map the older dates. Soil loss in the catchment was estimated for the 1975 and 2002 scenarios to determine the relations between land-use changes to vegetation cover changes and gully sidewall erosion. The Revised Universal Soil Loss Equation was applied for that purpose. Sidewall mass movements were determined by subtraction of digital elevation models (1 m resolution) of each period. The results show important land-use changes in the catchment due to field reorganization for the plantation of mechanized vineyards. It increased soil loss from agricultural fields by 26·5%, which influenced vegetation cover dynamics on gully walls, with an important development of scrubland to forest, and gully erosion, with sidewall retreat at rates of 0·025 to 0·50 ha y-1 and mass movements at rates of 16 to 63·2 Mg ha-1 y-1. These results indicate that vegetation cover on gully walls, although suggesting an improvement with respect to wall protection against splash, sheet and rill erosion, did not affect sidewall retreat and mass movements. Copyright 08 2009 John Wiley & Sons, Ltd.
|
| [41] |
Soil erosion and hydrology of the western Mediterranean badlands throughout rainfall simulation experiments: A review [J].https://doi.org/10.1016/j.catena.2012.06.001 URL [本文引用: 1] 摘要
Rainfall simulation experiments are widely used in geomorphological research in badland areas. This technique contributed significantly to our understanding of badland geomorphology in the Mediterranean belt. Due to the different types of simulated rainfall applied and the variable size of the plots a review of the State-of-the-Art is necessary. This study confirmed that rainfall simulations are well suited to (i) analyse runoff-infiltration processes and sediment detachment within badlands, and (ii) to establish the factors determining the hydrological and erosion response at interrill scale in badland areas.The hydrological response of badlands is characterized by rapid responses, low to moderate infiltration rates (ranging from close to 0 to 55 mm h(-1)) and high runoff coefficients (i.e. >60%). Positive relationships are observed between antecedent soil moisture content and rainfall intensity on the one hand, and runoff coefficients on the other. Sediment concentration and soil detachment rates are among the highest measured on the Mediterranean region (i.e. up to 84.8 g l(-1) and 4722.4 g m(-2) h(-1)). Results show that rainfall intensity, runoff coefficient, and slope angle have a positive influence on sediment concentration and sediment detachment; in the case of rock fragment cover, its influence is variable according to the soil cover percentage. Rainfall simulations increase our understanding of the temporal and spatial variability of the soil erosion processes. However, rainfall simulation provides mostly qualitative rather than quantitative information because of the small plot size and the simulated rainfall characteristics due to facility for repeating experiments and recording a high quantity of data in short time. However, this method allows the comparison amongst different environments and soil conditions as the rainfall properties can be reproduced. (C) 2012 Elsevier B.V. All rights reserved.
|
| [42] |
A typical “calanchi” landscape on the Eastern Apennine margin (Atri, Central Italy): Geomorphological features and evolution [J].https://doi.org/10.1016/S0341-8162(99)00086-7 URL [本文引用: 3] 摘要
The surroundings of the town of Atri (Abruzzo Region, Central Italy), situated about 10 km from the Adriatic shoreline, can be considered as representative of most part of the Italian seaward peninsular landscape. The subject of this research, the calanchi landscape, often generally considered as “badlands” by non-Italian authors, is, in fact, made up of many singular landforms, each of which ( calanco ) corresponds to a more or less extended hydrographic unit. The dynamics are mainly the result of the action of the particularly aggressive climatic factors (such as the Mediterranean rainfall regime) on weak substrata (clay, silt and sand of the Plio–Pleistocene marine cycles). The morphogenetic activity is not only limited to channel erosion, but it is also due to repeated superficial slides, so that it should in fact be better to consider the calanco as the result of a “combined erosion” process ( sensu [Zachar, D., 1982. Soil Erosion. Elsevier, Amsterdam]). Since the mechanism regulating this process remains unclear, this work wants to offer a contribution to this research field. Multitemporal geomorphological analysis has helped us to distinguish the different areas in which the calanchi evolution has been more or less important in the past. In such a way, it has been possible to characterize the landscape evolution as a function of the parameters that influence soil loss, especially in areas, such as that of Atri, where calanchi -like landforms are highly developed. Moreover, this analysis, coupled with the processing of 40 years rainfall data, also taking into account the concurrent land use changes, has clearly shown that the areas affected by calanchi erosion on the Eastern Apennine margin, still tectonically active, are progressively diminishing.
|
| [43] |
Erosion processes in calanchi in the Upper Orcia Valley, Southern Tuscany, Italy based on multitemporal high-resolution terrestrial LiDAR and UAV surveys [J].https://doi.org/10.1016/j.geomorph.2016.06.027 URL [本文引用: 1] 摘要
A 125,00002m 2 calanchi badland in the Province of Siena (Tuscany) was monitored with an unmanned aerial vehicle (UAV) and terrestrial laser scanning over the period of one year. TLS (terrestrial laser scanning) was carried out on two sample slopes, whereas the image acquisition of the UAV covered the entire catchment. In combination with ground control points, the UAV images were used to create orthophotos and 3D point clouds using the Structure from Motion (SfM) software Photoscan. The TLS surface models indicate seasonal differences in erosion and deposition. The surface change measured with SfM showed nearly 6.70002m 3 of net material loss, resulting from 8.70002m 3 erosion and 2.00002m 3 deposition. These values reveal a mean annual surface lowering of 5.302cm for the catchment. Additionally, several geomorphological processes, such as rill erosion, slope wash and translational slides could be detected in the one-year monitoring period. A comparison of TLS and SfM results showed differences in the calculated volumes of mobilised material. These discrepancies resulted from shadowing effects and low point densities of the TLS point clouds.
|
| [44] |
Rain simulation in patchy landscapes: Insights from a case study in the Central Alps [J].https://doi.org/10.1016/j.catena.2014.11.013 URL [本文引用: 2] 摘要
61Small portable rainfall simulator for surface runoff studies61Detailed instruction guide for the small rainfall simulator61Detailed specification of simulated rainfall characteristics61Benefits: low water consumption, marginal impacts on surface, homogenous water distribution61Comparison of 9 artificial rainfall simulators
|
| [45] |
Experimental study on initiation of gully-type debris flow based on artificial rainfall and channel runoff [J].https://doi.org/10.1007/s12665-014-3845-x URL [本文引用: 1] 摘要
Debris flows usually occur abruptly and rapidly in mountainous areas and it is difficult to observe their occurrence progress. Therefore, an experiment has become an important method to study debris flow initiation mechanism in recent years. In this paper, taking Xiongjia Gully in SW China as an example and on the basis of artificial rainfall experiment, the author has studied the initiation of gully-type debris flow. Experiment results indicate some relation between rainfall intensity and gully erosion, failure mode of soil mass, initiation mechanism and characteristics of debris flow. Based on several groups of experiments, conclusions were drawn as follows: (1) Under strong precipitation, the infiltration rate and soil water content in different depths are inversely proportional to the rainfall intensity. Intense rainfall favors the overland flow, gully runoff and erosion, but is not conducive to water infiltration. (2) Slope failure modes and initiation mechanism of debris flow vary with different rainfall and runoff conditions. Under the condition with the rainfall intensity of 55 mm/h, the slope failure mode presents a soil liquefaction and landslide. Accordingly, the debris flow initiation mechanism belongs to landslide transformation. However, under the condition of intense rainfall and runoff, gully beds are easy to be eroded and slopes are prone to collapse. Then, debris flows occurred with initiation mechanism of entrainment. (3) In terms of debris flow characteristics, the debris flow occurrence process consists of several intermittent flows. In addition, the debris flow magnitude and flow viscosity are not consistent with rainfall intensity. On the contrary, under condition of intense rainfall of 65 and 75 mm/h, debris flows tend to be watery. However, under the rainfall condition of 55 mm/h, the flow viscosity is higher. The experiment results are consistent well with the natural debris flow occurrence from Xioangjia Gully.
|
| [46] |
Gully erosion and environmental change: Importance and research needs [J].https://doi.org/10.1016/S0341-8162(02)00143-1 URL [本文引用: 4] 摘要
Assessing the impacts of climatic and, in particular, land use changes on rates of soil erosion by water is the objective of many national and international research projects. However, over the last decades, most research dealing with soil erosion by water has concentrated on sheet (interrill) and rill erosion processes operating at the (runoff) plot scale. Relatively few studies have been conducted on gully erosion operating at larger spatial scales. Recent studies indicate that (1) gully erosion represents an important sediment source in a range of environments and (2) gullies are effective links for transferring runoff and sediment from uplands to valley bottoms and permanent channels where they aggravate off site effects of water erosion. In other words, once gullies develop, they increase the connectivity in the landscape. Many cases of damage (sediment and chemical) to watercourses and properties by runoff from agricultural land relate to (ephemeral) gullying. Consequently, there is a need for monitoring, experimental and modelling studies of gully erosion as a basis for predicting the effects of environmental change (climatic and land use changes) on gully erosion rates. In this respect, various research questions can be identified. The most important ones are: (1) What is the contribution of gully erosion to overall soil loss and sediment production at various temporal and spatial scales and under different climatic and land use conditions? (2) What are appropriate measuring techniques for monitoring and experimental studies of the initiation and development of various gully types at various temporal and spatial scales? (3) Can we identify critical thresholds for the initiation, development and infilling of gullies in different environments in terms of flow hydraulics, rain, topography, soils and land use? (4) How does gully erosion interact with hydrological processes as well as with other soil degradation processes? (5) What are appropriate models of gully erosion, capable of predicting (a) erosion rates at various temporal and spatial scales and (b) the impact of gully development on hydrology, sediment yield and landscape evolution? (6) What are efficient gully prevention and gully control measures? What can be learned from failures and successes of gully erosion control programmes? These questions need to be answered first if we want to improve our insights into the impacts of environmental change on gully erosion. This paper highlights some of these issues by reviewing recent examples taken from various environments.
|
| [47] |
Gully development and sediment yield [J].https://doi.org/10.1016/0022-1694(66)90082-5 URL [本文引用: 1] 摘要
Several methods are presented which may be helpful in quantitative gully erosion studies. Advancement rate of gully heads is related to watershed area, and sediment yield of a gully system is calculated and compared with trapped sediments. A model of gully system development is suggested and the discrepancies between various results are discussed.
|
| [48] |
Erosion rates in badland areas recorded by collectors, erosion pins and profilometer techniques (Ebro Basin, NE-Spain) [J].https://doi.org/10.1016/S0169-555X(96)00023-2 URL [本文引用: 1] 摘要
In badland areas of the Ebro Basin, in a semiarid climate, two erosion plots (257 m ; 5 slope and 128 m ; 23 slope) on exposed Tertiary clays were monitored over two years (Nov. 1991-Nov. 1993). This material is characterized by high sodium absorption ratios which lead to high soil dispersivity. The dominant erosion processes in both plots are rilling and sheet erosion. Rainfall intensity was recorded at a weather station, connected to a data-logger, sediment production for single events was collected in tanks, and ground lowering was measured every six months by erosion pins and microtopographic profile gauge techniques. Significant runoff was produced only by rainfall events above 5 mm. Another threshold at 20 mm rain was noted. For rainfalls higher than 20 mm, the 23 slope plot shows a greater runoff response than the 5 one. Rainfall events exceeding this threshold showed a higher sediment production for the steeper slope. In the relationship between precipitation and sediment concentration, an envelope curve can be drawn indicating that any rainfall event of a given amount and intensity has a maximum sediment concentration which we speculate to be a function of the runoff sediment transport capacity. Runoff response and sediment yield in the studied plots are controlled by the rainfall and soil characteristics and their seasonal variations. In both plots, the erosion pins show that erosion rates in rill areas are 25-50% higher than in the interrill areas. Sediment yield recorded by collector devices was higher than the rates measured by erosion pins. The erosion rates based on rill cross-sections by profilometers were higher than the ones recorded by collectors.
|
| [49] |
Influences of micro-relief patterns and plant cover on runoff related processes in badlands from Tabernas (SE Spain) [J].https://doi.org/10.1016/S0341-8162(97)00032-5 URL [本文引用: 4] 摘要
Soil surface morphology, soil thickness and their evolution strongly affect infiltration processes. Badland surfaces are characterised by a substantially low plant cover and a reduced soil development controlled by high erosion rates. In the badlands of Tabernas (Almeria, SE Spain), the soil surface morphology exhibits a marked spatial variability, caused by different processes under moisture and temperature alternations in different slope aspects. Previous studies on the area have revealed the different hydrologic behaviour of North- and South-facing surfaces. In this paper, we go into more detail trying to establish the influences of both micro-relief patterns and plant cover on the hydrological behaviour of sixteen representative soil surfaces from the badlands of Tabernas. Rain simulations at a constant intensity of 55 mm/h have been carried out on 16 circular plots of 0.24 m, during 30 min, to evaluate runoff, infiltration, and sediment production parameters. Surface morphology has been evaluated by image analysis of photographs, before and after the simulations; the following parameters have been considered: plant cover and type, length and width of cracks, and stoniness. Surface roughness was determined with a laser profile meter. Runoff and erosion responses have been gathered in three and four groups, respectively, which are related to differences in slope gradient, soil depth and surface morphology. Runoff is positively correlated with slope gradient and negatively correlated with plant cover and total cover. Erosion is negatively correlated with lichen cover, with non-cryptogamic plant cover, with total cover and with surface area occupied by cracks. In some aspects, Tabernas badlands have an hydrological behaviour similar to other badlands described elsewhere (i.e., shallow moisture penetration, short times to runoff, different responses in runoff). However, they are particular in the following: (a) apparent morphological stability after rainfall events of high magnitude and intensity, along with high sediment production associated either from micro-rills that follow open cracks in the regolith, or from overland flow on bare, crusted, silty surfaces; (b) runoff enhancement by surface roughness through the channelling effect of the sealed depressions among pedestals and mounds of crustose lichens.
|
| [50] |
Measurement of erosion: Is it possible [J].https://doi.org/10.1016/j.catena.2005.08.004 URL [本文引用: 1] 摘要
Reasons for erosion measurements are: (1) to determine the environmental impact of erosion and conservation practices, (2) scientific erosion research; (3) development and evaluation of erosion control technology; (4) development of erosion prediction technology and (5) allocation of conservation resources and development of conservation regulations, policies and programs. A handicap for the control of the insidious erosion process is the difficulty of determining its magnitude. Four causes are often mentioned in the literature: the large temporal and spatial variation of erosion, the paucity of accurate erosion measurements, the problem of extrapolating data from small plots to higher scales and the conversion of erosion into production and monetary units (impact). It is an illusion to think that the role of measurements can be taken over by the application of erosion prediction technology. Measurements are needed to develop, calibrate and validate that technology. Measurement techniques differ in accuracy, equipment and personnel cost. The most accurate (and often most expensive) techniques do not always serve the measurement purpose. This paper gives a critical overview of current measurements techniques for erosion at different spatial and temporal scales. Examples are presented of techniques for direct measurements as well as for indirect measurements, i.e. measurements of soil properties that serve as input for models. The paper is concluded with a critical evaluation.
|
| [51] |
Relation between bedrock geology, topography and lavaka distribution in Madagascar [J].https://doi.org/10.2113/gssajg.115.225 URL [本文引用: 2] 摘要
The characteristic gullies of central Madagascar–lavakas–vary greatly in abundance over short distances, but existing understanding does not explain why some hillsides should have high concentrations of lavakas when nearby slopes have fewer. We present a GIS analysis of lavaka abundance in relation to bedrock geology and topography, covering two areas in the central highlands: the region near Ambatondrazaka and that around Tsaratanana. Both regions have similar average lavaka density (6 lavakas/km2 in Ambatondrazaka, and 5 lavakas/km2 in Tsaratanana, but local lavaka concentrations vary widely. Individual one-km2 squares can host up to 50 lavakas/km2 in Tsaratanana and up to 150 lavakas/km2 in Ambatondrazaka. We find no predictive relationship between bedrock type and lavaka abundance. There is, however, a relationship between lavakas and slope such that lavakas increase in abundance as slopes get steeper, up to an optimum steepness, beyond which they become less numerous. The optimum steepness for lavaka development is about 10 to 15° in Tsaratanana and 25 to 30° in Ambatondrazaka. Lavakas also seem to favour slopes where the gradient changes locally, with an optimum change in grade somewhere in the range 2 to 5°. Our results provide quantitative constraints on lavaka distribution that can be tested in other areas.
|
| [52] |
Patterns of development of lavaka, Madagascar’s unusual gullies [J].https://doi.org/10.1002/esp.3290160302 URL [本文引用: 1] 摘要
Abstract Lavaka (Madagascar's abundant gullies) show a complex pattern of development. Fourteen independent measures of size and shape in 93 lavaka were investigated by principal components analysis and discriminant function analysis. Typical lavaka start either as wounds and raw patches on mid-hillside that develop step-like head scarps, or as toe slopes collapsed by seepage, slumping, or undercutting. They become deep, raw, vertical-sided, teardrop- to heart-shaped gashes that may be deepest and broadest uphill. As the walls retreat, slump, and become overgrown, lavaka become longer, broader, gentler, and partly filled concavities. They can grow to reach from the valley floor to the hill crest (or even beyond the crest) before healing over. Unless excessive erosion creates tors and inselbergs, they heal over and end up as unremarkable hillside reentrants and side-valleys.
|
| [53] |
An empirical investigation of gully widening rates in upland concentrated flows [J].https://doi.org/10.1016/j.catena.2012.10.004 URL [本文引用: 1] 摘要
Soil erosion, in its myriad forms, devastates arable land and infrastructure. As an integral landscape feature, gully erosion is a complex system as its evolution is controlled by upstream migration of a gully head (headcut face), incision of the gully bed (plunge pool) and gravitational mass-movement (widening) on gully channel sidewalls. Bed incision is often limited by the presence of a less erodible soil layer. When erosion reaches such a layer, the gully typically widens, creating a wide shallow cross section. Once a gully is initiated, transport and deposition of the eroded soil and widening of the channel further govern its evolution. Our knowledge of these processes within agricultural regions, however, is still quite limited with theory largely borrowed from river hydraulics. Experiments were conducted to examine gully expansion (widening) as a function of channel slope and overland flow discharge. Packed soil beds were subjected to simulated rainstorms followed by clear-water overland flow. As bed slope and discharge increased, channel widening increased. An empirical equation, based upon measured channel width from constant discharge experiments, was developed in terms of slope and discharge. By further quantifying key aspects of gully erosion processes, results from this experimental campaign will significantly improve soil erosion prediction technology for use in agricultural regions. Published by Elsevier B.V.
|
| [54] |
Evaluation and application of a portable rainfall simulator on subalpine grassland [J].https://doi.org/10.1016/j.catena.2011.03.004 URL [本文引用: 2] 摘要
These results demonstrate that vegetation cover plays a crucial role in alpine soils for soil structure stability and erosion. Even though it was not possible to achieve natural rain conditions with the used simulators, the proposed field simulator is a useful tool in steep alpine terrain to study relative differences in the effects of rain erosion on soils with differing characteristics and vegetation cover.
|
| [55] |
Benggang erosion: The influencing factors [J].https://doi.org/10.1016/0341-8162(96)00014-8 URL [本文引用: 3] 摘要
Abstract In the tropical and southern subtropic granite areas of South China, a special kind of small-scale erosional landform is widely distributed, called “benggang” by the local people. Many natural factors are responsible for the development of benggang, such as lithology, precipitation, relief, vegetation etc., which are discussed in detail in this paper. Study shows that the development of benggangs is the outcome of a joint operation of natural factors and human activities. Lithology, especially the characteristics of the granite weathering mantle, provides material in which benggangs can develop, while intense rainstorms in a tropical monsoon climate act as a powerful force to cause benggang erosion. The slope characteristics, such as steepness and exposure, control the spatial difference of the distribution of benggangs. The development of benggangs results from the reverse succession of vegetation induced by human activities in this region, and the density of benggangs is closely related to forest cover and unit timber growing stock.
|

/
| 〈 |
|
〉 |


