吴绍洪 , 高江波
, 高江波
WU Shaohong, GAO Jiangbo
收稿日期: 2018-01-9
修回日期: 2018-01-17
网络出版日期: 2018-01-28
版权声明: 2018 地理科学进展 《地理科学进展》杂志 版权所有
基金资助:
作者简介:
作者简介:吴绍洪(1961-),男,广东潮州人,研究员,博士生导师,主要研究方向为自然地理综合研究与全球变化,E-mail: wush@igsnrr.ac.cn。
展开
摘要
风险评估是气候变化研究领域的核心课题之一,减缓和适应战略的理论需求推动下发展出许多定量评估方法,完成了大量的评估工作。然而,已有研究在气候变化的风险构成上从不同的角度去认识,且评估方法论在整体上缺乏对致险因子与承险体的集成分类。基于此,本文明晰气候变化风险构成,包括致险因子的危险性、承险体的暴露度与脆弱度及其相互关系,明晰了风险产生与变化逻辑。融合致险因子与承险体特征,将气候变化风险定量评估方法归纳为突发事件和渐变事件两类,并分别进行了理论阐述和案例剖析。最后,根据气候变化风险的研究现状和评估需求,从温升目标、脆弱性曲线、适应措施等方面提出未来展望。
关键词:
Abstract
Risk assessment is a core area of climate change research. Quantitative assessment methods have been developed particularly due to the needs for theory of mitigation and adaptation strategies, and have been applied to a great number of specific assessments. However, there have been different viewpoints of the risk composition of climate change, and overall, integrated classification by coupling risk causing factors and risk bearing bodies is lacking. This article illuminates the risk composition of climate change, including the danger of risk causing factors, the exposure and vulnerability of risk bearing bodies, and their interrelations. The emergence and change of risk were clarified. Based on the integrated analysis of risk causing factors and risk bearing bodies, this study divided the climate change risk quantitative assessment methods into sudden onset hazard risk and slow onset hazard risk assessment methods, then the theoretical elaboration and case analysis were conducted for the two types of risks respectively. Finally, according to the current status and needs, this article proposes the future development directions of climate change risk research, including risk assessment under different warming amplitude, vulnerability curve construction, and adaptation.
Keywords:
在气候变化议题受到持续关注和相关研究不断深化的过程中,气候变化风险始终处于核心地位(Carpenter et al, 2008; Schuur et al, 2011; Hirabayashi et al, 2013; Urban, 2015; 吴绍洪等, 2017)。风险评估是从气候变化影响到应对的必然要求和链接桥梁,其中影响程度是风险评估的基础(Jones, 2001; Prudhomme et al, 2010),风险是应对(尤其是适应)的对象(吴绍洪等, 2011; Wilby et al, 2012; FAO, 2016)。在联合国政府间气候变化工作委员会(IPCC)第五次评估报告第二工作组(WGII AR5)报告《气候变化2014:影响、适应和脆弱性》中,评估了气候变化的影响、适应和脆弱性,倡导气候变化风险的管理与可持续路径的建立(IPCC, 2014)。《巴黎协定》本着减少气候变化风险的目的,提出2℃甚至1.5℃的全球长期温控目标(United Nations, 2015)。虽然新近研究表明,即使各国完全实现国家自主减排贡献承诺,本世纪末全球增温仍极有可能超过3℃(Höhne et al, 2017; UNEP, 2017),但1.5℃、2℃、3℃等不同增温幅度的确定,使风险评估的靶向和适应战略的制定变得有据可依,在很大程度上推进了气候变化风险的定量评估。
鉴于气候变化风险内涵的综合性特征,大多研究均从致险因子与承险体的角度出发,但由于研究目的或管理方案不尽相同,对于风险构成并未达成统一认识(吴绍洪等, 2011)。IPCC第二工作组第五次评估报告和《管理极端事件和灾害风险促进气候变化适应特别报告》(SREX)在对气候变化风险形式框架的理解上,认为风险是气候相关危害(极端事件和变化趋势)、承险体暴露度与脆弱性三者的相互作用结果,且存在三者间纯粹的两两相交领域(IPCC, 2012, 2014)。而在联合国粮农组织(FAO)的2016年报告中,采用气候的状况、变率和季节变化来表示系统受到的冲击,加上系统易损性构成风险(FAO, 2016)。尽管表达方式有所不同,但致险因子(危险性)、承险体暴露度与脆弱性无疑是气候变化风险的基本构成要素(高江波等, 2017)。
近年来,随着计算机数值模型、大数据分析方法、3S技术的迅速发展,全球及不同国家和区域的多层次、多尺度气候变化风险定量评估成果不断涌现(Castellari, 2007; HM Government, 2012; Kromp-Kolb et al, 2014; Melillo et al, 2014; 《第三次气候变化国家评估报告》编写委员会, 2015)。此类研究多从致险因子或承险体单要素为主导开展评估,如气候变化背景下的干旱、洪涝、热浪等社会经济损失定量评估(D'Ippoliti et al, 2010; Aghakouchak et al, 2014; Gordon et al, 2014; Alfieri et al, 2016),面向农业与生态安全的气候变化风险评估(Scholze et al, 2006; Li et al, 2009; Rosenzweig et al, 2014)。气候变化风险区划虽在一定程度上综合考虑了气候变化的危险性及人口、经济、粮食和生态的响应脆弱性(吴绍洪等, 2017),但总体来看,气候变化风险研究领域仍缺乏融合致险因子与承险体的集成分类及相应的方法学研究,致使风险评估结论难归一、可比性较差、应用指向性不足(Jones et al, 2011; Ploberger et al, 2016)。
针对气候变化风险内涵理解不统一、定量评估方法论研究薄弱等问题,本文将明晰风险的构成要素与组织形式、归纳定量评估方法类别,在此基础上,系统考虑温升目标、气候情景、脆弱性曲线、风险适应程度等方面的不足与需求,凝练未来研究方向,以期推动气候变化风险认识论和方法论研究。
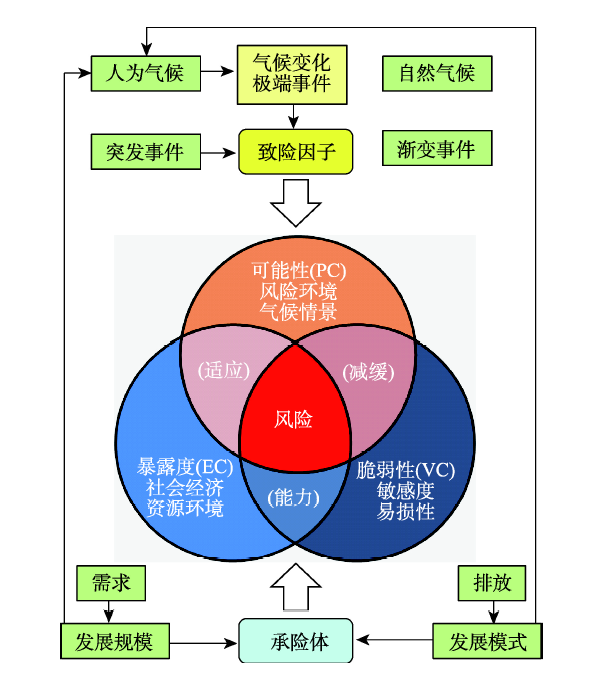
气候变化风险构成包括两个维度(即致险因子和承险体)、三个方面(即可能性、脆弱性和暴露度)(图1)。其中,在气候变化风险研究中,致险因子,即自然气候与人为气候的变化,决定着风险发生的可能性(IPCC, 2007);气候变化风险源主要包括两个方面:一是平均气候状况(气温,降水趋势),属于渐变事件;二是极端天气/气候事件(热带气旋、风暴潮、极端降水、河流洪水、热浪与寒潮、干旱),属于突发事件。承险体即为遭受负面影响的社会经济和资源环境,包括人员、生计、环境服务和各种资源、基础设施,以及经济、社会或文化资产等(Jones, 2004);暴露度和脆弱性是承险体的两个属性,前者指处在有可能受到不利影响位置的承险体数量,后者指受到不利影响的倾向或趋势,常以敏感性和易损性为表征指标(IPCC, 2012)。也就是说,单独气候变化与极端气候事件并不一定导致灾害,而必须与脆弱性和暴露程度交集之后才可能产生风险。
图1 气候变化风险的基本要素与构成形式
Fig.1 Basic components and formation of climate change risk
承险体的发展规模和模式不仅决定着暴露度和脆弱性,即承受极端事件的能力,还对人为气候的变化幅度与速率有直接作用(Cotton et al, 2007; Lamb et al, 2015; Schaller et al, 2016)。基于上述风险构成理念,从调整承险体的发展规模和模式入手,通过减缓人为气候变化来降低过高增温、降水异动和极端事件发生可能性,同时增强承险体的气候变化适应能力和恢复能力,是降低气候变化风险的有效途径(图1)。
对气候变化风险进行定量评估是风险管理的基础,同时也是适应气候变化需要解决的重要科学问题(Jones, 2001; IPCC, 2012)。气候变化风险最基本的性质可归纳为未来性、不利性和不确定性,即分别从时间的角度、后果的角度以及后果的表征上揭示自然气候变化风险的本质特征(吴绍洪等,2011)。风险定量评估是在充分考虑影响评价不确定性的基础上,量化系统未来可能遭受的损失。
基于此,本文从两个角度系统阐释气候变化风险定量评估方法:①对于突发性事件,一旦发生即在短时间显现出危害和后果,气候变化因素相当于自然灾害中的致灾因子(此处为致险因子)——“灾害风险”;②缓发性变化表现为渐变过程,当超过某个阈值,随即发生突变,产生不利影响,并出现风险。后一类风险往往出现于生态系统中,其突出的特征是,气候变化因素既是生态系统生长的动力,同时又是致险因子,导致“生态风险”。
3.1.1 理论内涵
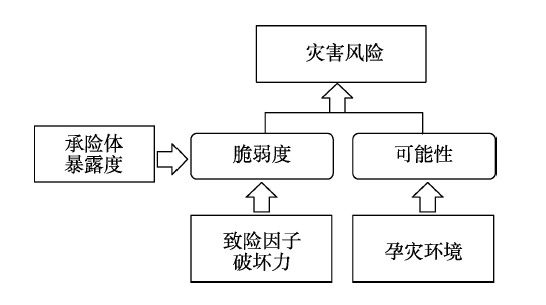
自然灾害风险评估受到国内外学者的广泛关注,许多研究通过对致灾因子危险性与承灾体脆弱性分等定级,借助评估矩阵等方法对区域风险进行评估(史培军, 2005)。随着自然灾害风险向评估结果定量化、区域综合化、管理空间化发展,原有的自然灾害风险等级评估由于不能定量表现各等级之间的具体差别,因而难以满足灾害风险管理的要求。本文提出包括自然灾害的破坏力或承险体损毁标准(D),承险体的暴露度(E),灾害发生的可能性或孕灾环境(P)三个成分的自然灾害风险定量评估模型(图2)。
图2 自然灾害风险定量评估概念框架
Fig.2 Conceptual framework for the quantitative evaluation of natural disaster risk
相应地,突发性极端天气气候事件的风险定量评估模型可表述为:
式中:风险=(致险因子,即气候变化)破坏力×(承险体)暴露度×发生可能性或孕灾环境。
基于对灾害风险上述三要素(D、E、P)的剖析,可根据承险体响应特征差异,将不同灾种风险评估分为“面向类型”的灾害风险评估和“适用区域”的灾害风险评估。前者是指某一等级强度的灾种发生后,对承险体的影响程度与幅度是可控的,即对应特定灾害等级的损失标准是相对确定的;后者主要是考虑到自然地理与人文环境的区域差异性,即使是同等强度的灾害发生后,不同地区的损失程度明显不同。
3.1.2 洪水案例
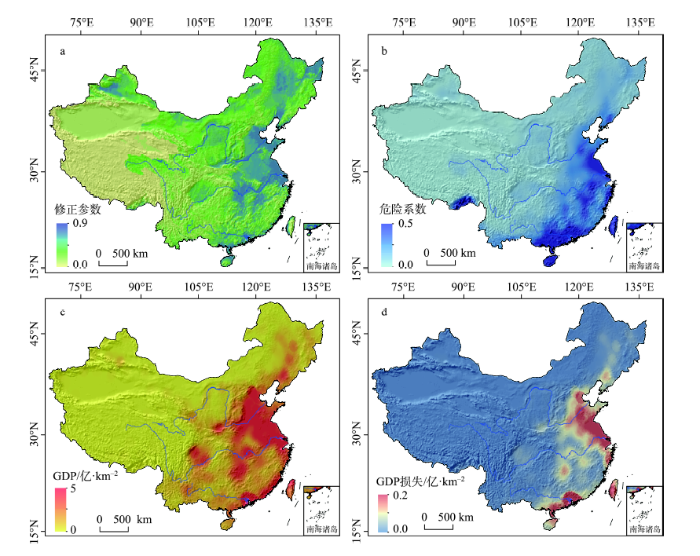
根据上述理论模型的思路,按照过去灾情拟合结果,暴雨洪涝损失在3日降雨趋于最大,因而将3日最大降雨作为计算损失的关键节点。气候变化背景下洪水发生可能性的计算是基于IPCC RCPs情景中的最大3日降雨量达到30(35)~150 mm、150~250 mm和≥250 mm的次数,以此作为轻、中、重度洪水的最大发生频次,然后将其转化为发生概率(概率=频次/时间尺度×100%,若发生概率大于100%则置为1),进而,考虑到区域自然地理环境的差异性,借助高程和坡度等因子形成的下垫面环境修正参数对其进行修正(图3a),从而得到各地区的洪水的危险性(图3b);对于承险体,洪涝灾害可对经济及人口造成严重影响,其脆弱性曲线的构建由不同程度洪水破坏力构成,可根据过去洪水灾害灾情数据拟合获得;对于承险体暴露度,通过IIASAS预测的未来社会经济统计数据获得(图3c)。最终,构建气候变化下洪水风险定量评估模型(如下),并获得中国洪涝灾害经济损失风险空间格局(图3d)。
图3 RCP8.5情景下中国洪涝灾害危险性(a, b)、经济暴露度(c)、损失风险(d)空间格局
Fig.3 Spatial patterns of flood disaster probability (a, b), economic exposure (c), and loss risk in China under RCP8.5
式中:
3.2.1 理论内涵
将生态系统的脆弱性(功能和结构破坏的程度)作为非期望事件发生的后果程度,按照风险管理的定义,气候变化即为致灾危险性因子,生态系统为承险体,而气候情景即是气候发生变化的可能性,三者构成了气候变化的风险。由此,生态系统风险评估仍可沿用灾害风险评估的主要因素:致险因子危险性,承险体脆弱性,暴露量等。但是,由于气候因子既是生态系统生产的动力,同时又是其致险因子,以及考虑到生态系统的恢复力,因而引入阈值的概念来评估其风险。一方面,当生态系统受到环境的胁迫时,结构、功能、生境可能发生变化,其响应与胁迫的幅度和速率有关,与生态系统生物因子本身的稳定性也有关,生态系统所承受的压力与胁迫的速率与幅度成正相关关系。另一方面,生态系统自身具有抗干扰的恢复能力,对外来胁迫进行调节,经过一定过程,系统可能适应或恢复。但如果环境胁迫的速率或幅度超过生态系统的调节能力,则系统将变得脆弱,生态系统也将处于风险状态,气候变化继续加剧则甚至导致系统发生逆向演替。
3.2.2 NPP案例
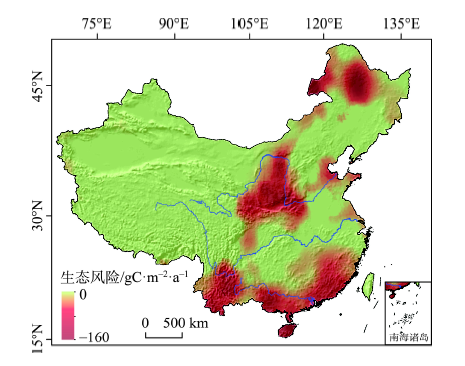
根据van Minnen等人的思想,假设不能接受的气候变化对生态系统生产功能的影响是某种程度的NPP损失,即气候变化造成NPP的损失如果超过了此类生态系统NPP的自然波动范围,就认为其发生风险(van Minnen et al, 2002)。根据世界气象组织对“异常”的定义(即超过平均值的±2倍标准差)(Jones et al, 1999; Hulme et al, 2008),选取两套数据对中国生态系统NPP的正常波动范围进行计算以便互相验证(一套是根据中国自然环境特点重新参数化的Lund-Potsdam-Jena模型模拟结果;另一套是大气—植被相互作用模型AVIM2模拟结果)(赵东升等, 2011; 黄玫等, 2006)),它们的异常值计算结果分别为9.9%和8.5%,与van Minnen等人计算的欧洲NPP的自然波动范围(10%)非常接近。因此,选择相对于平均值10%的损失作为“不能接受的影响”的参考。以生态系统生产功能“不能接受的影响”为参考,确定各生态系统的风险标准,可将各生态系统分为无风险、低风险、中风险和高风险(石晓丽等, 2017)。基于此,获得未来30年中国气候变化生态风险空间格局(图4)。
图4 RCP8.5情景下中国未来30年生态风险空间分布
Fig.4 Spatial distribution of ecological risk of China in the next 30 years under RCP8.5
气候变化风险虽是目前研究的热点,众多学者和管理者高度关注,但尚属于研究的初期。并且,由于气候变化风险是自然因子行为机理,社会经济与资源环境的承受能力,以及政策与管理机制的交汇,因而使得气候变化风险具有高度的复杂性,并且存在着很大的不确定性,需要逐步深入研究。
(1) 不同温升目标下的气候变化风险
2015年12月达成的《巴黎协定》确立了2℃的温升目标,并提出向1.5℃内努力(United Nations, 2015),但即使完全实现各国自主承诺的目标,21世纪末全球平均增温很有可能会超过3℃(UNEP, 2017)。随着温升幅度的增加,气候变化导致的极端事件发生的频率更高,强度更大,灾害的破坏力更加严重(徐影等, 2014; Fischer et al, 2015; Roudier et al, 2016);相应地,承险体暴露度和脆弱性范围不断扩大,对人类生活、社会经济发展和生态环境均造成严重威胁(Blaikie et al, 1994)。因而,认识不同增温目标下的气候变化、评估不同增温情景下气候变化风险,不仅是气候变化风险评估的必然要求,也是制定气候变化应对方案和实施路线图的根本依据。
(2) 基于IPCC新气候情景数据的定量评估
目前耦合模式比较计划第六阶段(Coupled Model Intercomparison Project Phase 6,CMIP6)正按时间节点有序进行(Eyring et al, 2016)。CMIP6试验设计和组织的核心是生物地球化学强迫和反馈,拟解决以下三大问题:①地球系统如何响应强迫;②模式系统偏差的来源和后果是什么;③考虑到内部气候变率、可预测性和情景的不确定性,如何评估未来的气候变化。随着科学认识的发展,CMIP模拟中考虑的地球系统的强迫和反馈也会更加科学,在未来的气变化风险评估中采用该计划获得的气候情景数据以及相应的社会经济情景,既可推动定量评估结果更趋客观合理,又能为未来达成新的认识和科学应对奠定基础。
(3) 降低脆弱性曲线构建的不确定性
构建脆弱性曲线是定量评估气候变化风险的核心内容。目前的构建方法主要基于历史灾情数据、已有脆弱性曲线的修正、系统调查和模式模拟等。脆弱性曲线具有一定的不确定性,随着历史文献的整理、灾害统计数据的完善、问卷访谈和灾害保险工作的深入,脆弱性曲线的区域性参数化修正和针对性将有所增强;随着致险因子强度和承险体脆弱性对应关系系统调查的深入,以及基于作物生产模型、生态系统模型等的模拟水平的不断提高,脆弱性曲线的不确定性将逐渐减小。未来脆弱性曲线构建需朝着多元化、综合化方向发展。
(4) 基于定量风险的适应成效
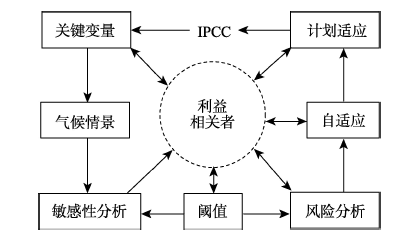
适应是应对气候变化的主要途径之一,也是气候变化风险管理的主要目的。在应对气候变化不利影响的研究与行动中,气候变化风险的定量评估,有利于确立适应目标和开展适应行动。根据气候变化风险的定量评估结果,遵循“趋利避害”的原则,建立适应气候变化的目标,在国家和区域层面上建立完善的适应气候变化体系,开展适应气候变化行动;进而,加强相关行业和领域的适应技术应用后评估,即综合分析、对比适应技术应用前后的风险格局与总体态势,据此判定适应技术的成效、提出有序适应的技术和措施(图5)。
图5 气候变化风险理论评估框架(
Fig.5 Theoretical framework of climate change risk assessment (
The authors have declared that no competing interests exist.
| [1] |
|
| [2] |
气候变化影响与风险研究的理论范式和方法体系 [J].Theory paradigm and a methods system for research on climate change impacts and risks [J]. |
| [3] |
中国区域植被地上与地下生物量模拟 [J].
应用大气-植被相互作用模型AVIM2在0.1°×0.1°经纬度网格上估算了中国区域植被总生物量、地下和地上生物量以及根茎比的空间分布格局。研究了植被生物量和根茎比的空间分布与水热限制条件的关系。研究表明:中国植被总生物量、地下和地上生物量受水热条件影响明显,空间分布趋势基本相似,即在暖湿的东南和西南地区生物量大,而在干冷的西部地区生物量小。同类植被生物量的空间分布有显著区域差异,气温高、降水量大的区域植被生物量大;低温和干旱地区的植被生物量小。除灌木以外,植被生物量大小的空间分布受水分的影响大于温度。中国区域植被根茎比的空间分布存在明显区域差异,全国大致以大兴安岭、太行山、秦岭以及青藏高原东南侧一线为界线,界线东南植被根茎比较小;界线以西,植被根茎比较大。植被根茎比的空间分布与年平均气温、土壤湿度和年降水量显著反相关,水分因子对根茎比空间分布的影响大于温度。
Modeling study of vegetation shoot and root biomass in China [J].
应用大气-植被相互作用模型AVIM2在0.1°×0.1°经纬度网格上估算了中国区域植被总生物量、地下和地上生物量以及根茎比的空间分布格局。研究了植被生物量和根茎比的空间分布与水热限制条件的关系。研究表明:中国植被总生物量、地下和地上生物量受水热条件影响明显,空间分布趋势基本相似,即在暖湿的东南和西南地区生物量大,而在干冷的西部地区生物量小。同类植被生物量的空间分布有显著区域差异,气温高、降水量大的区域植被生物量大;低温和干旱地区的植被生物量小。除灌木以外,植被生物量大小的空间分布受水分的影响大于温度。中国区域植被根茎比的空间分布存在明显区域差异,全国大致以大兴安岭、太行山、秦岭以及青藏高原东南侧一线为界线,界线东南植被根茎比较小;界线以西,植被根茎比较大。植被根茎比的空间分布与年平均气温、土壤湿度和年降水量显著反相关,水分因子对根茎比空间分布的影响大于温度。
|
| [4] |
基于阈值识别的生态系统生产功能风险评价: 以北方农牧交错带为例 [J].https://doi.org/10.16258/j.cnki.1674-5906.2017.01.002 URL [本文引用: 1] 摘要
明晰未来气候变化情景下不同类型生态系统生产功能面临的风险,对因地制宜地采取气候变化适应措施具有重要的现实意义。目前从阈值识别角度对生态系统风险进行评价的研究还较少。该研究提出一种基于阈值识别的气候变化下生态系统风险分析的方法。基于气候、土壤和植被数据,运用大气-植被相互作用模型对1961—2080年北方农牧交错带的生态系统净初级生产力进行模拟,根据气候变化对不同类型生态系统净初级生产力的影响定义了“危险的影响”和“不能接受的影响”两类阈值,并根据生态系统净初级生产力在气候变化下的减少趋势与两类阈值的对比关系进行风险等级的划分,进而对未来气候变化下北方农牧交错带不同类型生态系统生产功能面临的风险进行了评估。结果表明:气候变化将给北方农牧交错带生态系统生产功能带来风险,以低风险为主。风险分布与未来气候变化密切相关,主要集中在西北地区北部、内蒙古地区东北部和东北地区中南部。风险范围随增温幅度的增加而扩展,到远期风险面积达到165.72×10⁴km2,占研究区总面积的44.78%。混交林、稀树草原与荒漠草原较为危险;高寒草甸与常绿针叶林是较为安全的生态系统。农牧交错带核心区风险程度高于边缘区,揭示了其核心区在未来气候变化下趋于脆弱的趋势。
Risk assessment of ecosystems production based on the thresholds identification: The case study of farming-pastoral ecotone in northern China [J].https://doi.org/10.16258/j.cnki.1674-5906.2017.01.002 URL [本文引用: 1] 摘要
明晰未来气候变化情景下不同类型生态系统生产功能面临的风险,对因地制宜地采取气候变化适应措施具有重要的现实意义。目前从阈值识别角度对生态系统风险进行评价的研究还较少。该研究提出一种基于阈值识别的气候变化下生态系统风险分析的方法。基于气候、土壤和植被数据,运用大气-植被相互作用模型对1961—2080年北方农牧交错带的生态系统净初级生产力进行模拟,根据气候变化对不同类型生态系统净初级生产力的影响定义了“危险的影响”和“不能接受的影响”两类阈值,并根据生态系统净初级生产力在气候变化下的减少趋势与两类阈值的对比关系进行风险等级的划分,进而对未来气候变化下北方农牧交错带不同类型生态系统生产功能面临的风险进行了评估。结果表明:气候变化将给北方农牧交错带生态系统生产功能带来风险,以低风险为主。风险分布与未来气候变化密切相关,主要集中在西北地区北部、内蒙古地区东北部和东北地区中南部。风险范围随增温幅度的增加而扩展,到远期风险面积达到165.72×10⁴km2,占研究区总面积的44.78%。混交林、稀树草原与荒漠草原较为危险;高寒草甸与常绿针叶林是较为安全的生态系统。农牧交错带核心区风险程度高于边缘区,揭示了其核心区在未来气候变化下趋于脆弱的趋势。
|
| [5] |
四论灾害系统研究的理论与实践 [J].https://doi.org/10.3969/j.issn.1004-4574.2005.06.001 URL [本文引用: 1] 摘要
作者曾分别于1991,1995和2001年发表了关于灾害研究理论与实践的3篇文章,对灾害系统的性质、动力学机制等进行了探讨。本文在前3篇文章的基础上,从综合灾害风险管理的角度,完善了灾害系统的结构与功能体系,论证了灾情形成过程中恢复力的作用机制,分析了区域开发与安全建设的互馈关系,构建了区域综合减灾的行政管理体系,提出了由政府、企业与社区构成的区域综合减灾范式。研究结果表明,区域灾情形成过程中,脆弱性与恢复力有着明显的区别,脆弱性是区域灾害系统中致灾因子、承灾体和孕灾环境综合作用过程的状态量,它主要取决于区域的经济发达程度与社区安全建设水平;恢复力则是灾害发生后,区域恢复、重建及安全建设与区域发展相互作用的动态量,它主要取决于区域综合灾害风险行政管理能力、政府与企业投入和社会援助水平。区域安全水平与土地利用的时空格局和产业结构关系密切,通过划定区域高风险“红线区”的办法,调整土地利用时空格局和产业结构,有利于建立区域可持续发展的综合减灾范式。针对区域自然灾害系统存在着相互作用、互为因果的灾害链规律,以及灾害系统所具有的结构与功能特征,完善由纵向、横向和政策协调共同组成的一个“三维矩阵式”的区域综合减灾行政管理体系,构建以政府为主导、企业为主体、社区全面参与的区域综合减灾范式。以此促进在发展中提高区域减灾能力,并在一定安全水平下,建设区域可持续发展模式。
Theory and practice on disaster system research in a fourth time [J].https://doi.org/10.3969/j.issn.1004-4574.2005.06.001 URL [本文引用: 1] 摘要
作者曾分别于1991,1995和2001年发表了关于灾害研究理论与实践的3篇文章,对灾害系统的性质、动力学机制等进行了探讨。本文在前3篇文章的基础上,从综合灾害风险管理的角度,完善了灾害系统的结构与功能体系,论证了灾情形成过程中恢复力的作用机制,分析了区域开发与安全建设的互馈关系,构建了区域综合减灾的行政管理体系,提出了由政府、企业与社区构成的区域综合减灾范式。研究结果表明,区域灾情形成过程中,脆弱性与恢复力有着明显的区别,脆弱性是区域灾害系统中致灾因子、承灾体和孕灾环境综合作用过程的状态量,它主要取决于区域的经济发达程度与社区安全建设水平;恢复力则是灾害发生后,区域恢复、重建及安全建设与区域发展相互作用的动态量,它主要取决于区域综合灾害风险行政管理能力、政府与企业投入和社会援助水平。区域安全水平与土地利用的时空格局和产业结构关系密切,通过划定区域高风险“红线区”的办法,调整土地利用时空格局和产业结构,有利于建立区域可持续发展的综合减灾范式。针对区域自然灾害系统存在着相互作用、互为因果的灾害链规律,以及灾害系统所具有的结构与功能特征,完善由纵向、横向和政策协调共同组成的一个“三维矩阵式”的区域综合减灾行政管理体系,构建以政府为主导、企业为主体、社区全面参与的区域综合减灾范式。以此促进在发展中提高区域减灾能力,并在一定安全水平下,建设区域可持续发展模式。
|
| [6] |
气候变化风险研究的初步探讨 [J].https://doi.org/10.3969/j.issn.1673-1719.2011.05.009 URL Magsci [本文引用: 3] 摘要
讨论了气候变化风险的基本内涵,指出敏感性、暴露程度及可能性是气候变化风险的三个基本组成要素。气候变化风险具有不确定性、未来事件、损害性以及相对性等特征。风险评估与风险管理是气候变化风险研究的两个主要环节,以风险评估为手段,以风险管理为最终目标,是应对气候变化行动的基本思路。提出了气候变化风险研究的初步框架和主要方法。并给出未来气候变化下中国洪涝灾害风险研究的实际案例。最后指出,气候变化风险研究要从风险集合预测、定量风险损失评估、风险区划与制图以及风险管理等多个方面展开。
Primary study on the theories and methods of research on climate change risk [J].https://doi.org/10.3969/j.issn.1673-1719.2011.05.009 URL Magsci [本文引用: 3] 摘要
讨论了气候变化风险的基本内涵,指出敏感性、暴露程度及可能性是气候变化风险的三个基本组成要素。气候变化风险具有不确定性、未来事件、损害性以及相对性等特征。风险评估与风险管理是气候变化风险研究的两个主要环节,以风险评估为手段,以风险管理为最终目标,是应对气候变化行动的基本思路。提出了气候变化风险研究的初步框架和主要方法。并给出未来气候变化下中国洪涝灾害风险研究的实际案例。最后指出,气候变化风险研究要从风险集合预测、定量风险损失评估、风险区划与制图以及风险管理等多个方面展开。
|
| [7] |
中国综合气候变化风险区划 [J].https://doi.org/10.11821/dlxb201701001 URL [本文引用: 2] 摘要
气候变化作用于自然环境与社会经济系统,产生一系列影响.随着未来社会经济发展,气候变化危险性与自然环境和社会经济承险体耦合形成有规律的风险时空格局.将此时空格局系统化表达即是综合气候变化风险区划,是适应气候变化的科学基础之一.本文基于RCP 8.5下的近中期(2021-2050年)气候情景,分析了中国未来气温和降水变化趋势与速率,评价了干旱、高温热浪以及洪涝等极端事件危险性,选取人口、经济、粮食生产和生态系统等承险体风险作为综合风险定量评估的指标.在系统性、主导因素以及空间连续性原则的指导下,提出中国综合气候变化风险区划三级区域系统方案,划分出8个气候变化敏感区、19个极端事件危险区和46个承险体综合风险区.结果发现:2021-2050年RCP 8.5情景下中国的气候变化高风险区主要包括:华北弱暖增雨敏感区,华北平原热浪危险区,人口经济粮食高风险区;华南—西南弱暖增雨敏感区,黔滇山地热浪危险区,生态经济粮食人口高风险区;华南沿海涝热危险区,生态粮食经济人口高风险区.中国综合气候变化风险区划涵盖了气候变化情景、极端事件发生、社会经济与生态系统的可能损失信息,可以为国家或地方应对气候变化及气候变化风险管理提供科技支撑.
Comprehensive climate change risk regionalization of China [J].https://doi.org/10.11821/dlxb201701001 URL [本文引用: 2] 摘要
气候变化作用于自然环境与社会经济系统,产生一系列影响.随着未来社会经济发展,气候变化危险性与自然环境和社会经济承险体耦合形成有规律的风险时空格局.将此时空格局系统化表达即是综合气候变化风险区划,是适应气候变化的科学基础之一.本文基于RCP 8.5下的近中期(2021-2050年)气候情景,分析了中国未来气温和降水变化趋势与速率,评价了干旱、高温热浪以及洪涝等极端事件危险性,选取人口、经济、粮食生产和生态系统等承险体风险作为综合风险定量评估的指标.在系统性、主导因素以及空间连续性原则的指导下,提出中国综合气候变化风险区划三级区域系统方案,划分出8个气候变化敏感区、19个极端事件危险区和46个承险体综合风险区.结果发现:2021-2050年RCP 8.5情景下中国的气候变化高风险区主要包括:华北弱暖增雨敏感区,华北平原热浪危险区,人口经济粮食高风险区;华南—西南弱暖增雨敏感区,黔滇山地热浪危险区,生态经济粮食人口高风险区;华南沿海涝热危险区,生态粮食经济人口高风险区.中国综合气候变化风险区划涵盖了气候变化情景、极端事件发生、社会经济与生态系统的可能损失信息,可以为国家或地方应对气候变化及气候变化风险管理提供科技支撑.
|
| [8] |
基于CMIP5模式的中国地区未来洪涝灾害风险变化预估 [J].https://doi.org/10.3969/j.issn.1673-1719.2014.04.007 URL Magsci [本文引用: 1] 摘要
利用22个CMIP5全球气候模式模拟结果,结合社会经济以及地形高度数据,分析了RCP8.5温室气体排放情景下21世纪近期(2016—2035年)、中期(2046—2065年)和后期(2080—2099年)中国洪涝致灾危险性、承灾体易损性以及洪涝灾害风险。结果表明,洪涝灾害危险等级较高的地区集中在中国的东南部,洪涝承灾体易损度高值区位于中国的东部地区。在RCP8.5情景下,未来我国洪涝灾害高风险区主要出现在四川东部、华东的大部分地区、华北的京津冀地区、陕西和山西的部分地区以及东南沿海部分地区。东北地区的各大省会城市面临洪涝灾害的风险也很高。与基准期(1986—2005年)相比,21世纪后期,虽然发生洪涝灾害的区域变化不大,但高风险区域有所增加。鉴于模式较粗的分辨率以及确定权重系数的方法学等问题,洪涝灾害风险的预估还存在较大的不确定性。
Projected risk of flooding disaster in China based on CMIP5 models [J].https://doi.org/10.3969/j.issn.1673-1719.2014.04.007 URL Magsci [本文引用: 1] 摘要
利用22个CMIP5全球气候模式模拟结果,结合社会经济以及地形高度数据,分析了RCP8.5温室气体排放情景下21世纪近期(2016—2035年)、中期(2046—2065年)和后期(2080—2099年)中国洪涝致灾危险性、承灾体易损性以及洪涝灾害风险。结果表明,洪涝灾害危险等级较高的地区集中在中国的东南部,洪涝承灾体易损度高值区位于中国的东部地区。在RCP8.5情景下,未来我国洪涝灾害高风险区主要出现在四川东部、华东的大部分地区、华北的京津冀地区、陕西和山西的部分地区以及东南沿海部分地区。东北地区的各大省会城市面临洪涝灾害的风险也很高。与基准期(1986—2005年)相比,21世纪后期,虽然发生洪涝灾害的区域变化不大,但高风险区域有所增加。鉴于模式较粗的分辨率以及确定权重系数的方法学等问题,洪涝灾害风险的预估还存在较大的不确定性。
|
| [9] |
气候变化情景下中国自然植被净初级生产力分布 [J].
<p>基于国际上较通用的Lund-Potsdam-Jena(LPJ)模型,根据中国自然环境特点对其运行机制进行调整,并重新进行了参数化,以B2情景气候数据作为主要的输入数据,以1961—1990年为基准时段,模拟了中国1991—2080自然植被净初级生产力(NPP)对气候变化的响应.结果表明:1961—1990年,中国自然植被的NPP总量为3.06 Pg C·a<sup>-1</sup>;1961—2080年,NPP总量呈波动下降趋势,且下降速度逐渐加快.在降水相对变化不大的条件下,平均温度的增加对我国植被生产力可能会产生一定的负面影响.NPP的空间分布从东南沿海向西北内陆呈逐渐递减趋势,在气候变化过程中,该格局基本没有太大变化.在东部NPP值相对较高地区,NPP值以减少为主,东北地区、华北东部和黄土高原地区的减少趋势尤为明显;在西部NPP值相对较低地区,NPP以增加趋势为主,青藏高原地区和塔里木盆地的表现尤为突出.随着气候变化的深入,东西部地区这种变化趋势的对比将越发明显.</p>
Variation trends of natural vegetation net primary productivity in China under climate change scenario [J].
<p>基于国际上较通用的Lund-Potsdam-Jena(LPJ)模型,根据中国自然环境特点对其运行机制进行调整,并重新进行了参数化,以B2情景气候数据作为主要的输入数据,以1961—1990年为基准时段,模拟了中国1991—2080自然植被净初级生产力(NPP)对气候变化的响应.结果表明:1961—1990年,中国自然植被的NPP总量为3.06 Pg C·a<sup>-1</sup>;1961—2080年,NPP总量呈波动下降趋势,且下降速度逐渐加快.在降水相对变化不大的条件下,平均温度的增加对我国植被生产力可能会产生一定的负面影响.NPP的空间分布从东南沿海向西北内陆呈逐渐递减趋势,在气候变化过程中,该格局基本没有太大变化.在东部NPP值相对较高地区,NPP值以减少为主,东北地区、华北东部和黄土高原地区的减少趋势尤为明显;在西部NPP值相对较低地区,NPP以增加趋势为主,青藏高原地区和塔里木盆地的表现尤为突出.随着气候变化的深入,东西部地区这种变化趋势的对比将越发明显.</p>
|
| [10] |
Global warming and changes in risk of concurrent climate extremes: Insights from the 2014 California drought [J].https://doi.org/10.1002/2014GL062308 URL [本文引用: 1] 摘要
Abstract Global warming and the associated rise in extreme temperatures substantially increase the chance of concurrent droughts and heat waves. The 2014 California drought is an archetype of an event characterized by not only low precipitation but also extreme high temperatures. From the raging wildfires, to record low storage levels and snowpack conditions, the impacts of this event can be felt throughout California. Wintertime water shortages worry decision-makers the most because it is the season to build up water supplies for the rest of the year. Here we show that the traditional univariate risk assessment methods based on precipitation condition may substantially underestimate the risk of extreme events such as the 2014 California drought because of ignoring the effects of temperature. We argue that a multivariate viewpoint is necessary for assessing risk of extreme events, especially in a warming climate. This study discusses a methodology for assessing the risk of concurrent extremes such as droughts and extreme temperatures.
|
| [11] |
Increasing flood risk under climate change: A pan-European assessment of the benefits of four adaptation strategies [J].https://doi.org/10.1007/s10584-016-1641-1 URL [本文引用: 1] 摘要
Abstract Future flood risk in Europe is likely to increase due to a combination of climatic and socio-economic drivers. Effective adaptation strategies need to be implemented to limit the impact of river flooding on population and assets. This research builds upon a recently developed flood risk assessment framework at European scale to explore the benefits of adaptation against extreme floods. The effect of implementing four different adaptation measures is simulated in the modeling framework. Measures include the rise of flood protections, reduction of the peak flows through water retention, reduction of vulnerability and relocation to safer areas. Their sensitivity is assessed in several configurations under a high-end global warming scenario over the time range 1976 2100. Results suggest that the future increase in expected damage and population affected by river floods can be compensated through different configurations of adaptation measures. The adaptation efforts should favor measures targeted at reducing the impacts of floods, rather than trying to avoid them. Conversely, adaptation plans only based on rising flood protections have the effect of reducing the frequency of small floods and exposing the society to less-frequent but catastrophic floods and potentially long recovery processes.
|
| [12] |
At risk: Natural hazards, people's vulnerability and disasters [M]. |
| [13] |
One-third of reef-building corals face elevated extinction risk from climate change and local impacts [J].https://doi.org/10.1126/science.1159196 URL PMID: 18653892 [本文引用: 1] 摘要
The conservation status of 845 zooxanthellate reef-building coral species was assessed by using International Union for Conservation of Nature Red List Criteria. Of the 704 species that could be assigned conservation status, 32.8% are in categories with elevated risk of extinction. Declines in abundance are associated with bleaching and diseases driven by elevated sea surface temperatures, with extinction risk further exacerbated by local-scale anthropogenic disturbances. The proportion of corals threatened with extinction has increased dramatically in recent decades and exceeds that of most terrestrial groups. The Caribbean has the largest proportion of corals in high extinction risk categories, whereas the Coral Triangle (western Pacific) has the highest proportion of species in all categories of elevated extinction risk. Our results emphasize the widespread plight of coral reefs and the urgent need to enact conservation measures.
|
| [14] |
Climate change assessment report[EB/OL]. |
| [15] |
|
| [16] |
The impact of heat waves on mortality in 9 European cities: Results from the EuroHEAT project [J].https://doi.org/10.1186/1476-069X-9-37 URL PMID: 2914717 [本文引用: 1] 摘要
Background The present study aimed at developing a standardized heat wave definition to estimate and compare the impact on mortality by gender, age and death causes in Europe during summers 1990-2004 and 2003, separately, accounting for heat wave duration and intensity. Methods Heat waves were defined considering both maximum apparent temperature and minimum temperature and classified by intensity, duration and timing during summer. The effect was estimated as percent increase in daily mortality during heat wave days compared to non heat wave days in people over 65 years. City specific and pooled estimates by gender, age and cause of death were calculated. Results The effect of heat waves showed great geographical heterogeneity among cities. Considering all years, except 2003, the increase in mortality during heat wave days ranged from + 7.6% in Munich to + 33.6% in Milan. The increase was up to 3-times greater during episodes of long duration and high intensity. Pooled results showed a greater impact in Mediterranean (+ 21.8% for total mortality) than in North Continental (+ 12.4%) cities. The highest effect was observed for respiratory diseases and among women aged 75-84 years. In 2003 the highest impact was observed in cities where heat wave episode was characterized by unusual meteorological conditions. Conclusions Climate change scenarios indicate that extreme events are expected to increase in the future even in regions where heat waves are not frequent. Considering our results prevention programs should specifically target the elderly, women and those suffering from chronic respiratory disorders, thus reducing the impact on mortality.
|
| [17] |
Overview of the Coupled Model Intercomparison Project Phase 6 (CMIP6) experimental design and organization [J].https://doi.org/10.5194/gmd-9-1937-2016 URL [本文引用: 1] 摘要
By coordinating the design and distribution of global climate model simulations of the past, current, and future climate, the Coupled Model Intercomparison Project (CMIP) has become one of the foundational elements of climate science. However, the need to address an ever-expanding range of scientific questions arising from more and more research communities has made it necessary to revise the organization of CMIP. After a long and wide community consultation, a new and more federated structure has been put in place. It consists of three major elements: (1) a handful of common experiments, the DECK (Diagnostic, Evaluation and Characterization of Klima) and CMIP historical simulations (1850–near present) that will maintain continuity and help document basic characteristics of models across different phases of CMIP; (2) common standards, coordination, infrastructure, and documentation that will facilitate the distribution of model outputs and the characterization of the model ensemble; and (3) an ensemble of CMIP-Endorsed Model Intercomparison Projects (MIPs) that will be specific to a particular phase of CMIP (now CMIP6) and that will build on the DECK and CMIP historical simulations to address a large range of specific questions and fill the scientific gaps of the previous CMIP phases. The DECK and CMIP historical simulations, together with the use of CMIP data standards, will be the entry cards for models participating in CMIP. Participation in CMIP6-Endorsed MIPs by individual modelling groups will be at their own discretion and will depend on their scientific interests and priorities. With the Grand Science Challenges of the World Climate Research Programme (WCRP) as its scientific backdrop, CMIP6 will address three broad questions: – How does the Earth system respond to forcing? – What are the origins and consequences of systematic model biases? – How can we assess future climate changes given internal climate variability, predictability, and uncertainties in scenarios? This CMIP6 overview paper presents the background and rationale for the new structure of CMIP, provides a detailed description of the DECK and CMIP6 historical simulations, and includes a brief introduction to the 21 CMIP6-Endorsed MIPs.
|
| [18] |
Climate change and food security: Risks and responses [M]. |
| [19] |
Anthropogenic contribution to global occurrence of heavy-precipitation and high-temperature extremes [J].https://doi.org/10.1038/nclimate2617 URL [本文引用: 1] 摘要
Climate change includes not only changes in mean climate but also in weather extremes. For a few prominent heatwaves and heavy precipitation events a human contribution to their occurrence has been demonstrated. Here we apply a similar framework but estimate what fraction of all globally occurring heavy precipitation and hot extremes is attributable to warming. We show that at the present-day warming of 0.85 C about 18% of the moderate daily precipitation extremes over land are attributable to the observed temperature increase since pre-industrial times, which in turn primarily results from human influence. For 2 C of warming the fraction of precipitation extremes attributable to human influence rises to about 40%. Likewise, today about 75% of the moderate daily hot extremes over land are attributable to warming. It is the most rare and extreme events for which the largest fraction is anthropogenic, and that contribution increases nonlinearly with further warming. The approach introduced here is robust owing to its global perspective, less sensitive to model biases than alternative methods and informative for mitigation policy, and thereby complementary to single-event attribution. Combined with information on vulnerability and exposure, it serves as a scientific basis for assessment of global risk from extreme weather, the discussion of mitigation targets, and liability considerations.
|
| [20] |
Gordon K. 2014. The economic risks of climate change in the United States-a climate risk assessment for the United States [EB/OL]. [ |
| [21] |
Global flood risk under climate change [J].https://doi.org/10.1038/NCLIMATE1911 URL [本文引用: 1] 摘要
A warmer climate would increase the risk of floods(1). So far, only a few studies(2,3) have projected changes in floods on a global scale. None of these studies relied on multiple climate models. A few global studies(4,5) have started to estimate the exposure to flooding (population in potential inundation areas) as a proxy of risk, but none of them has estimated it in a warmer future climate. Here we present global flood risk for the end of this century based on the outputs of 11 climate models. A state-of-the-art global river routing model with an inundation scheme(6) was employed to compute river discharge and inundation area. An ensemble of projections under a new high-concentration scenario(7) demonstrates a large increase in flood frequency in Southeast Asia, Peninsular India, eastern Africa and the northern half of the Andes, with small uncertainty in the direction of change. In certain areas of the world, however, flood frequency is projected to decrease. Another larger ensemble of projections under four new concentration scenarios(7) reveals that the global exposure to floods would increase depending on the degree of warming, but interannual variability of the exposure may imply the necessity of adaptation before significant warming.
|
| [22] |
UK climate change risk assessment: Government report[R]. London, UK: |
| [23] |
Action by China and India slows emissions growth, president Trump’s policies likely to cause US emissions to flatten [EB/OL]. ( |
| [24] |
Predicting, deciding, learning: Can one evaluate the ‘success’ of national climate scenarios [J].https://doi.org/10.1088/1748-9326/3/4/045013 URL [本文引用: 1] 摘要
Scenarios may be understood as products and/or processes. Viewing scenario exercises as productive tends to emphasize their tangibility: scenario products may acquire value unrelated to the processes of their creation. Viewing scenario exercises as procedural tends to emphasize their modes of formation: the process of constructing scenarios may have benefits irrespective of the value of ensuing products. These two framings yield different expectations about how one might evaluate the 'success' or otherwise of scenario exercises. We illustrate three approaches to evaluating the success or otherwise of scenarios using the example of the series of national UK climate scenarios published between 1991 and 2002. These are: predictive success (has the future turned out as envisaged?), decision success (have 'good' decisions subsequently been made?) and learning success (have scenarios proved engaging and enabled learning?). We reflect on the different ways the 'success' of national climate scenarios might be evaluated and on the relationship between the productive and procedural dimensions of scenario exercises.
|
| [25] |
|
| [26] |
|
| [27] |
|
| [28] |
When do POETS become dangerous [C]// |
| [29] |
An environmental risk assessment/management framework for climate change impact assessments [J].https://doi.org/10.1023/A:1011148019213 URL [本文引用: 2] |
| [30] |
Climate change impacts in the Hunter Valley [J].https://doi.org/10.9774/GLEAF.978-1-907643-29-3_4 URL [本文引用: 1] 摘要
This report provides a real world application of a risk assessment framework for climatechange developed by CSIRO. The framework is applied to thresholds of heat stress in dairycattle under climate change in order to estimate the risk of losses to milk production. Optionsfor adaptation to reduce risk are also analysed.This study is based on historical climate and projected climate change for Muswellbrook in theHunter Valley of New South Wales. Heat stress in cattle is associated with high temperatureand humidity. Projected increases in temperature due to climate change will increase heatstress with resultant negative impacts, including reduced milk production.
|
| [31] |
Adaptation and risk management [J].https://doi.org/10.1002/wcc.97 URL [本文引用: 3] |
| [32] |
Austrian climate change assessment report 2014: Summary for policymakers [M]. |
| [33] |
Human development in a climate-constrained world: What the past says about the future [J].https://doi.org/10.1016/j.gloenvcha.2015.03.010 URL [本文引用: 1] 摘要
Energy consumption is necessary for the delivery of human development by supporting access to basic needs, services and infrastructure. Given prevailing technologies and the high degree of inertia in practical rates of decarbonisation, growth in energy consumption from rising global living standards may drive consequent greenhouse gas emissions (GHG). In this paper the ‘development as usual’ GHG emissions impact of achieving high levels of life expectancy, access to basic needs and continued economic growth are projected to the mid-century using historical elasticities of development and energy consumption in 3 regions – Africa, Centrally Planned Asia, and South Asia. The results suggest that long life expectancy and high levels of access to basic needs are achievable at lower levels of emissions than continued economic growth, but will consume a substantial share of the global budget associated with a 2°C climate goal.
|
| [34] |
Climate change and drought: A risk assessment of crop-yield impacts [J].https://doi.org/10.3354/cr00797 URL [本文引用: 1] 摘要
We assessed the drought risk for world crop production under current and future climatic conditions by using an integrated approach to analyze the correlation between historical crop yield and meteorological drought. Future drought frequencies are estimated based on ensemble results from 20 general circulation model (GCM) climate change patterns and 6 emissions scenarios from SRES (Special Repo...
|
| [35] |
Climate change impacts in the United States: The third national climate assessment [J].https://doi.org/10.1017/S0022216X14000996 URL [本文引用: 1] 摘要
This report assesses the science of climate change and its impacts across the United States, now and throughout this century. It integrates findings of the U.S. Global Change Research Program (USGCRP) with the results of research and observations from across the U.S. and around the world, including reports from the U.S. National Research Council. This report documents climate change related impacts and responses for various sectors and regions, with the goal of better informing public and private decision-making at all levels. The report has eight major sections including: Our Changing Climate: presents recent advances in climate change science, which includes discussions of extreme weather events, observed and projected changes in temperature and precipitation, and the uncertainties associated with these projections. Sectors: focuses on climate change impacts for seven societal and environmental sectors: human health, water, energy, transportation, agriculture, forests, and ecosystems and biodiversity; six additional chapters consider the interactions among sectors (such as energy, water, and land use) in the context of a changing climate. Regions: assesses key impacts on U.S. regions – Northeast, Southeast and Caribbean, Midwest, Great Plains, Southwest, Northwest, Alaska, and Hawai‘i and the U.S. affiliated Pacific Islands – as well as coastal areas, oceans, and marine resources. Responses: assesses the current state of responses to climate change, including adaptation, mitigation, and decision support activities. Research Needs: highlights major gaps in science and research to improve future assessments. Sustained Assessment Process: describes an initial vision for and components of an ongoing, long-term assessment process.
|
| [36] |
Towards long-term resilience: The challenge of integrating climate change related risks into a risk analysis framework [M]//Filho W L, Musa H, Cavan G, et al. |
| [37] |
Scenario-neutral approach to climate change impact studies: application to flood risk [J].https://doi.org/10.1016/j.jhydrol.2010.06.043 URL [本文引用: 1] 摘要
This paper presents a novel framework for undertaking climate change impact studies, which can be used for testing the robustness of precautionary climate change allowances used in engineering design. It is illustrated with respect to fluvial flood risk in the UK. The methodology departs from conventional scenario-led impact studies because it is based on sensitivity analyses of catchment responses to a plausible range of climate changes (rather than the time-varying outcome of individual scenarios), making it scenario-neutral. The method involves separating the climate change projections (the hazard) from the catchment responsiveness (the vulnerability) expressed as changes in peak flows. By combining current understanding of likelihood of the climate change hazard with knowledge of the sensitivity of a given catchment, it is possible to evaluate the fraction of climate model projections that would not be accommodated by specified safety margins. This enables rapid appraisal of existing or new precautionary allowances for a set of climate change projections, but also for any new set of climate change projections for example arising from a new generation of climate models as soon as they are available, or when focusing on a different planning time horizon, without the need for undertaking a new climate change impact analysis with the new scenarios. The approach is demonstrated via an assessment of the UK Government 20% allowance for climate change applied in two contrasting catchments. In these exemplars, the allowance defends against the majority of sampled climate projections for the 2080s from the IPCC-AR4 GCM and UKCP09 RCM runs but it is still possible to identify a sub-set of regional scenarios that would exceed the 20% threshold.
|
| [38] |
Assessing agricultural risks of climate change in the 21st century in a global gridded crop model intercomparison [J].https://doi.org/10.1073/pnas.1222463110 URL PMID: 24344314 [本文引用: 1] 摘要
Abstract Here we present the results from an intercomparison of multiple global gridded crop models (GGCMs) within the framework of the Agricultural Model Intercomparison and Improvement Project and the Inter-Sectoral Impacts Model Intercomparison Project. Results indicate strong negative effects of climate change, especially at higher levels of warming and at low latitudes; models that include explicit nitrogen stress project more severe impacts. Across seven GGCMs, five global climate models, and four representative concentration pathways, model agreement on direction of yield changes is found in many major agricultural regions at both low and high latitudes; however, reducing uncertainty in sign of response in mid-latitude regions remains a challenge. Uncertainties related to the representation of carbon dioxide, nitrogen, and high temperature effects demonstrated here show that further research is urgently needed to better understand effects of climate change on agricultural production and to devise targeted adaptation strategies.
|
| [39] |
Projections of future floods and hydrological droughts in Europe under a +2°C global warming [J].https://doi.org/10.1007/s10584-015-1570-4 URL [本文引用: 1] 摘要
We present an assessment of the impacts of a +2 C global warming on extreme floods and hydrological droughts (1 in 10 and 1 in 100 year events) in Europe using eleven bias-corrected climate model simulations from CORDEX Europe and three hydrological models. The results show quite contrasted results between northern and southern Europe. Flood magnitudes are expected to increase significantly south of 60oN, except for some regions (Bulgaria, Poland, south of Spain) where the results are not significant. The sign of these changes are particularly robust in large parts of Romania, Ukraine, Germany, France and North of Spain. North of this line, floods are projected to decrease in most of Finland, NW Russia and North of Sweden, with the exception of southern Sweden and some coastal areas in Norway where floods may increase. The results concerning extreme droughts are less robust, especially for drought duration where the spread of the results among the members is quite high in some areas. Anyway, drought magnitude and duration may increase in Spain, France, Italy, Greece, the Balkans, south of the UK and Ireland. Despite some remarkable differences among the hydrological models structure and calibration, the results are quite similar from one hydrological model to another. Finally, an analysis of floods and droughts together shows that the impact of a +2 C global warming will be most extreme for France, Spain, Portugal, Ireland, Greece and Albania. These results are particularly robust in southern France and northern Spain.
|
| [40] |
Human influence on climate in the 2014 southern England winter floods and their impacts [J].https://doi.org/10.1038/nclimate2927 URL [本文引用: 1] 摘要
A succession of storms reaching southern England in the winter of 2013/2014 caused severe floods and 451 million insured losses. In a large ensemble of climate model simulations, we find that, as well as increasing the amount of moisture the atmosphere can hold, anthropogenic warming caused a small but significant increase in the number of January days with westerly flow, both of which increased extreme precipitation. Hydrological modelling indicates this increased extreme 30-day-average Thames river flows, and slightly increased daily peak flows, consistent with the understanding of the catchment sensitivity to longer-duration precipitation and changes in the role of snowmelt. Consequently, flood risk mapping shows a small increase in properties in the Thames catchment potentially at risk of riverine flooding, with a substantial range of uncertainty, demonstrating the importance of explicit modelling of impacts and relatively subtle changes in weather-related risks when quantifying present-day e_ects of human influence on climate.
|
| [41] |
A climate-change risk analysis for world ecosystems [J].https://doi.org/10.1073/pnas.0601816103 URL PMID: 16924112 [本文引用: 1] 摘要
Abstract We quantify the risks of climate-induced changes in key ecosystem processes during the 21st century by forcing a dynamic global vegetation model with multiple scenarios from 16 climate models and mapping the proportions of model runs showing forest/nonforest shifts or exceedance of natural variability in wildfire frequency and freshwater supply. Our analysis does not assign probabilities to scenarios or weights to models. Instead, we consider distribution of outcomes within three sets of model runs grouped by the amount of global warming they simulate: 3 degrees C. High risk of forest loss is shown for Eurasia, eastern China, Canada, Central America, and Amazonia, with forest extensions into the Arctic and semiarid savannas; more frequent wildfire in Amazonia, the far north, and many semiarid regions; more runoff north of 50 degrees N and in tropical Africa and northwestern South America; and less runoff in West Africa, Central America, southern Europe, and the eastern U.S. Substantially larger areas are affected for global warming >3 degrees C than for 3 degrees C this sink converts to a carbon source during the 21st century (implying a positive climate feedback) in 44% of cases. The risks continue increasing over the following 200 years, even with atmospheric composition held constant.
|
| [42] |
Climate change: High risk of permafrost thaw [J].https://doi.org/10.1038/480032a URL PMID: 22129707 [本文引用: 1] 摘要
Northern soils will release huge amounts of carbon in a warmer world, say Edward A. G. Schuur, Benjamin Abbott and the Permafrost Carbon Network.
|
| [43] |
The emissions gap report 2017: A UN environment synthesis report[R]. Nairobi: |
| [44] |
United Nations conference on environment and development: Framework convention on climate change [J].摘要
united nations conference on environment and development: framework convention on climate change
|
| [45] |
Paris agreement [EB/OL]. ( |
| [46] |
Accelerating extinction risk from climate change [J].https://doi.org/10.1126/science.aaa4984 URL [本文引用: 1] 摘要
There is great interest in understanding how species might respond to our changing climate, but predictions have varied greatly. Urban looked at over 130 studies to identify the level of risk that climate change poses to species and the specific traits and characteristics that contribute to risk (see the Perspective by Hille Ris Lambers). If climate changes proceed as expected, one in six species could face extinction. Several regions, including South America, Australia, and New Zealand, face the greatest risk. Understanding these patterns will help us to prepare for, and hopefully prevent, climate-related loss of biodiversity.Science , this issue p. [571][1]; see also p. [501][2] [1]: /lookup/volpage/348/571?iss=6234 [2]: /lookup/volpage/348/501?iss=6234
|
| [47] |
Critical climate change as an approach to assess climate change impacts in Europe: Development and application [J].https://doi.org/10.1016/S1462-9011(02)00044-8 URL [本文引用: 1] 摘要
This paper presents a new methodology called the “critical climate change” approach for evaluating policies for reducing climate change impacts on natural ecosystems. This method is particularly suited for integrated assessments because of its long-term and large-scale perspective. This is an analogous approach to the “critical loads” concept used for assessing regional air pollution impacts in Europe. Critical climate change is defined as the “quantitative magnitude of climate change (expressed as changes in temperature and precipitation) above which unacceptable long-term effects on ecosystems may occur, according to current knowledge”. The approach consists of four main steps: (1) Selection of appropriate indicators of climate change impact. Here we select changes in net primary productivity of ecosystems. (2) Assigning to the selected indicator a level of “unacceptable impact” of climate change. Here we assume this level to be at least a 10% loss in the net primary productivity of natural ecosystems, after considering other thresholds and the historical variation in ecosystem productivity. (3) Determining the response of the indicator to one or more climate-related driving force. This includes identifying the combinations of driving forces that produce the assigned unacceptable impact . (4) Computing the area where critical climate changes exceeded under climate change scenarios. An analysis of climate scenarios show that critical climate changes may be exceeded on 9–13% of Europe’s area by 2100, depending on the scenario. The areas where critical climate changes are exceeded are located mostly in southern Europe, even under relatively low emission scenarios.
|
| [48] |
Adapting to flood risk under climate change [J].https://doi.org/10.1177/0309133312438908 URL [本文引用: 1] 摘要
ABSTRACT Flooding is the most common natural hazard and third most damaging globally after storms and earthquakes. Anthropogenic climate change is expected to increase flood risk through more frequent heavy precipitation, increased catchment wetness and sea level rise. This paper reviews steps being taken by actors at international, national, regional and community levels to adapt to flood risk from tidal, fluvial, surface and groundwater sources. We refer to existing inventories, national and sectoral adaptation plans, flood inquiries, building and planning codes, city plans, research literature and international policy reviews. We distinguish between the enabling environment for adaptation and specific implementing measures to manage flood risk. Enabling includes routine monitoring, flood forecasting, data exchange, institutional reform, bridging organizations, contingency planning for disasters, insurance and legal incentives to reduce vulnerability. All such activities are 'low regret' in that they yield benefits regardless of the climate scenario but are not cost-free. Implementing includes climate safety factors for new build, upgrading resistance and resilience of existing infrastructure, modifying operating rules, development control, flood forecasting, temporary and permanent retreat from hazardous areas, periodic review and adaptive management. We identify evidence of both types of adaptation following the catastrophic 2010/11 flooding in Victoria, Australia. However, significant challenges remain for managing transboundary flood risk (at all scales), protecting existing property at risk from flooding, and ensuring equitable outcomes in terms of risk reduction for all. Adaptive management also raises questions about the wider preparedness of society to systematically monitor and respond to evolving flood risks and vulnerabilities.
|

/
| 〈 |
|
〉 |