洪长桥 , 金晓斌, 陈昌春
HONG Changqiao, JIN Xiaobin, CHEN Changchun
通讯作者:
版权声明: 2017 地理科学进展 《地理科学进展》杂志 版权所有
基金资助:
作者简介:
作者简介:洪长桥(1993-),男,湖南衡阳人,硕士研究生,主要从事资源遥感研究,E-mail: hcqnuist@126.com。
展开
摘要
净初级生产力(NPP)是衡量碳循环、指导土地利用、评估生态安全、指示环境变化、反映粮食安全等的重要参量,其估算受模型构建机理和生态系统关键地表参数输入的影响。近年来,随着遥感数据的不断丰富和遥感处理技术的快速发展,集成遥感数据的NPP估算模型相较于仅采用气候、土壤等传统观测数据的非遥感模型,在分析时空异质性等方面的优势日益凸显。本文基于Web of Science和CNKI两大数据库,采用文献统计分析方法,系统回顾NPP研究概况及国内外集成遥感数据的NPP估算模型的近期进展;并将集成遥感数据进行NPP估算的模型分为统计模型、光能利用率模型、过程模型及耦合模型四类;重点阐述了各类遥感估算模型的机理、差异性、适宜性及局限性;最后,在分析NPP遥感估算面临困境和科学挑战的基础上,从机理与影响因素、数据基础、参数反演、时空尺度拓展、软硬件支撑等方面对未来研究进行了展望。
关键词:
Abstract
As a general term that describes the accumulation of organic matters within specific temporal and spatial scopes on crop land, woodland, grassland, or other types of lands, land net primary productivity (NPP) is considered an important parameter to measure carbon cycle, guide land use, assess ecological security, reflect environmental changes, and indicate the level of food security. The estimation precision of NPP is significantly influenced by the type of models and input of key surface parameters of ecosystems. In recent years, with the continuous growth of remote sensing data and the rapid development of remote sensing data processing technologies, NPP estimation models based on remote sensing data, as compared to NPP estimation using traditional observation data such as climate and soil data with coarse spatiotemporal resolutions, have become very prominent in analyzing temporal and spatial heterogeneity. Based on the Web of Science and CNKI databases and statistical analysis methods, this study systematically reviewed research on NPP and its estimation models integrating remote sensing data in China and internationally. The commonly used models can be divided into four categories: statistical models, light use efficiency models, process models, and coupling models. We examined the mechanisms, differences, suitability, and limitation of the various kinds of models, Based on an analysis of the difficulties and scientific challenges that face integrating remote sensing data into NPP estimation models, research prospects are put forward with regard to model mechanism, influencing factors, data provision, parameter derivation, expansion of spatiotemporal scales, and hardware and software supports.
Keywords:
“净初级生产力(Net Primary Production/Productivity, NPP)”一词,早期研究主要集中在植物生理生态学领域(Whittaker, 1961; Hadley et al, 1967),用于评估自然和农业生产的能力。在《Primary Production of the Biosphere》一书中,其概念被界定为:绿色植被在单位时间、面积上通过光合作用同化CO2的产物扣除自养呼吸消耗后的剩余有机物,是碳循环过程的重要分量(Lieth et al, 1975),并为学界广泛认可。NPP研究对于环境保护、土地利用、粮食安全、生态建设等政策制定意义重大(陶波等, 2001; 王宗明等, 2009; Yin et al, 2016; Yu et al, 2016),引起了国际社会各界的高度重视。在1971年人与生物圈计划(MAB)建立之初,就被用于分析人类活动与环境变化对生态系统的影响,其研究成果为后续NPP研究奠定了良好的基础。20世纪80年代以来,世界气候研究计划(WCRP)、国际地圈-生物圈计划(IGBP)、国际生物多样性计划(DIVERSITAS)、国际全球环境变化人文因素计划(IHDP)等国际重大计划均将NPP相关研究作为重要内容之一。
目前,NPP测算方法主要包括站点观测法、实验法和模型法(蔡晓明, 2000; 陈吉泉等, 2014)。早期发展的站点观测或实验法,如样地清查法(直接收割法等)、涡度相关法、叶绿素测定法、放射性标记测定法及原料消耗量测定法等虽能获取较高精度的样点NPP,为估算模型构建提供基础参数和验证数据,但难以获取较大区域的NPP结果。用于估算大尺度NPP的模型法在20世纪末期发展迅速。依据Ruimy等(1994)的划分方法,相关模型可分为统计模型、参数模型和过程模型三类。其中,统计模型主要利用气象数据与实测NPP的经验统计关系来估算NPP;参数模型以太阳辐射作为主要变量,采用温度、降水等作为限制因子来估算NPP;过程模型则采用气象、土壤数据和植物生理参数来估算NPP。由于传统地面观测获取的气象、土壤数据的时空分辨率较低,因而仅利用这些数据使得模型发展、应用受到较大限制。陆地NPP形成过程复杂,涉及植物生理、水文、气象、土壤、物理以及灾害等众多学科,同时陆地生态系统又是一个自然因素与人为因素共同作用的领域,致使NPP估算模型的发展在理论、技术上均面临较大瓶颈(张方敏等, 2012; 李明泽等, 2015)。同时,随着NPP研究的深入,研究尺度涵盖生态系统、特定景观等小尺度及区域、全球等大尺度,研究对象逐渐从单一功能型生态系统转向具体物种及空间镶嵌型生态系统,迫切需要对NPP估算方法论加以更新。
21世纪初,伴随着对地物信息敏感的遥感观测数据的不断丰富与遥感处理技术的快速发展,时空异质性反映优势明显的集成遥感数据的陆地NPP估算模型逐渐兴起。尤其是近期多尺度、多分辨率遥感数据的出现,为模型参数时空特征的量化创造了有利的条件。同时结合遥感数据对植物生长机理与影响因素深入探讨,以及引入同化方法与耦合原理等新方法、新理论,为模型参数与结构的优化提供了新的思路。其中,遥感数据介入模型时主要采用两种方式:①同化方式,即结合遥感数据获取原非遥感参数;②驱动方式,即采用遥感数据构建模型参数。然而,尽管集成遥感数据的陆地NPP估算模型已成为生态学、地理学研究的热点方向,但对于其理论与方法进行系统梳理的研究尚不多见。基于上述认识,本文结合Web of Science和CNKI两大数据库,采用文献统计分析方法总结NPP及其遥感估算模型的发展历程,重点综述近期应用较为普遍的基于集成遥感数据的NPP估算模型的原理、结构、适宜性、差异性及局限性,并概要分析了遥感数据介入模型的方式。在此基础上,提出目前NPP遥感估算研究面临的困境与挑战,进而对NPP遥感估算未来发展趋势进行归纳和展望,以期为有效模拟陆地生态系统碳循环过程,并为农业、国土及环保等政府决策部门对环境变化、土地利用与功能等监测和应对的实践需求提供参考。
图1 1990-2016年Web of Science中NPP文献量
Fig.1 Number of net primary productivity (NPP)-related articles in Web of Science, 1990-2016
由于NPP研究涉及学科众多,包括生态学、植物学、地理学以及气候学等。为探究不同学科领域NPP研究情况,在Web of Science中以“net primary productivity” or “net primary production”为主题共搜集到10030篇文献(检索时段为1990-2016年,检索时间为2016年10月11日,下同)。统计表明,近20多年有关NPP的文献数量呈指数型增长(图1)。不同研究方向的文献数量存在较大差异,居于前三位的研究方向分别为:生态环境学(47.65%)、植物学(17.64%)和生物学(17.25%);紧随其后是地理学(16.25%)、气候学(10.22%)和农学(9.77%);遥感学仅占4.49%(指各研究方向文献占总检索文献数量的比例)。由此可见,NPP研究存在较明显的学科交叉现象(各研究方向所占比例总和>1),同时遥感作为一门可应用于NPP研究的新兴技术,受到了学术界的关注(图2)。
为探索NPP研究中采用遥感数据的总体情况,在Web of Science中以“net primary productivity” and “remote sensing” or “net primary production” and “remote sensing” 为主题进行文献检索的同时,在CNKI中同样以“净初级生产力”并且“遥感”为主题进行文献检索。文献分析表明,近20多年来NPP研究中采用遥感数据的文献数量不断增加(图3),尤其是2000年之后,随着遥感数据的大量涌现,遥感数据在NPP估算中的应用能力受到国内外学者的广泛关注。可能由于卫星资料收集和研究方法滞后等方面的原因,国内研究起步稍晚于国外。国际论文主要刊发在《Remote Sensing of Environment》《International Journal of Remote Sensing》《Agricultural and Forest Meteorology》《Global Change Biology》《IEEE International Symposium on Geoscience and Remote Sensing IGARSS》《Remote Sensing》《Biogeosciences》《Journal of Geophysical Research Biogeosciences》《Ecological Modelling》《Proceedings of the Society of Photo Optical Instrumentation Engineers Spin》等期刊(图4)。国内论文主要刊发在《生态学报》《生态学杂志》《自然资源学报》《应用生态学报》《资源科学》《植物生态学报》《干旱区资源与环境》《地理学报》《农业工程学报》《水土保持通报》等期刊。
图4 NPP研究中应用遥感的文献量前10名国际核心期刊
Fig.4 Top 10 journals with articles using remote sensing in NPP study
为探究NPP遥感估算模型的发展状况,分别在Web of Science中以“net primary production /productivity”and“remote sensing”and“model”为主题,在CNKI中以“净初级生产力”并且“遥感”并且“模型”为主题进行文献检索。结合已有划分方法(Ruimy et al, 1994),依据经验统计关系、资源平衡原理、植物生理生态学过程和耦合原理等理论,将所收集文献中的集成遥感数据的NPP估算模型归纳为四类,即:统计模型、光能利用率模型、过程模型和耦合模型。相关模型文献概况如图5。遥感数据主要以同化、驱动两种方式影响模型的构建与发展(图6)。
图5 1990-2016年国内外集成遥感数据的NPP估算模型统计
Fig.5 Statistics of NPP estimation models intergrating remote sensing from journals indexed by SCI and from CNKI, 1990-2016
图6 遥感数据介入NPP估算模型的典型过程
Fig.6 A typical procedure of integrating remote sensing data into NPP estimation models
植被指数(VI)、叶面积指数(LAI)等能反映植被长势状况(刘洋等, 2013; 史舟等, 2015),气候条件能影响植物生长、发育过程(孙成明等, 2015)。可通过探讨VI、LAI、气象因子等与地面样点实测NPP之间的经验统计关系,构建统计模型,进而用于区域NPP估算。遥感数据大多用于反演VI、LAI,以驱动方式介入统计模型。依据考虑的因子个数,将目前应用较多的遥感数据驱动的统计模型划分为两类:第一类是基于VI或LAI等单个因子的线性或非线性关系模型,如简单线性回归、指数函数模型、幂函数模型、对数函数模型、移动平均回归及二次多项式函数模型等;第二类是采用统计分析方法,考虑VI或LAI及气候条件等多类因子的综合模型。
图7 集成遥感数据的陆地净初级生产力估算模型特点比较
Fig.7 Comparison of application characteristics of land NPP estimation models integrating remote sensing data
在第一类统计模型发展过程中,利用以NDVI为代表的VI构建区域NPP估算模型最为常见。考虑到NDVI的地物表征适宜性及植被生长特征,NDVI不同使用方式为众多学者尝试,包括年内累积NDVI、生长季累积NDVI、每周NDVI、10天NDVI、年内平均NDVI、年内最大NDVI及某时间断面NDVI等。对于草原植被,尤其是一年生植被而言,由于植被覆盖水平、气候条件等的差异,NPP与NDVI之间的统计关系在生长季内不同时期存在差异,一般在7月、8月表现较优(An et al, 2013; 郭群等, 2013; 常学礼等, 2015)。然而,由年内累积NDVI构建的统计模型解释能力有时强于由年内最大NDVI或生长季累积NDVI构建的统计模型(Blanco et al, 2016)。有学者利用年内累积NDVI成功构建相应区域NPP估算模型,如指数函数模型(Lo Seen Chong et al, 1993)、对数函数模型(肖乾广等, 1996)、幂函数模型(Paruelo et al, 1997);也有学者利用季度NDVI与横轴所构成的面积求取年内累积值,进而估算NPP (Roces-Díaz et al, 2015)。对于森林等多年生植被类型,年内植被覆盖相对稳定,因此年内平均NDVI也可用于构建当年NPP估算模型(郑元润等, 2000; 蒋蕊竹等, 2011)。
尽管NDVI与NPP相关性较好,但这种关系的强度受土地覆盖类型、土壤背景及土壤湿度等因素的影响。通过考虑这些因素,可构建精度较好的区域NPP估算模型。例如,针对NDVI因采用非线性拉伸增强红光和近红外波段的反射率对比度而在植被高覆盖区较易饱和的不足,以及为消除土壤背景等的影响,选用修正土壤调节植被指数(MSAVI)估测LAI,进而构建较好的区域NPP估算模型(宗玮等, 2011)。而从考虑土地覆盖类型角度来看,可通过以下三种方式提高区域NPP估算精度:一是在植被(如草本、木本)混合生长区提取各自所占比例,进而基于NDVI等进行回归建模(Blanco et al, 2016);二是寻找不同土地覆盖类型区的基于NDVI等的最优关系模型(Gao J X et al, 2012);三是选取多种植被指数(如RVI、NDVI、EVI、MSAVI及WDVI等),获取不同土地覆盖类型最优关系,进而构建整合模型(Mao et al, 2014)。
由于植物生长过程受气候条件的影响,而第一类统计模型显然对于气候因素考虑欠缺,使得模型应用能力受到较大限制。通过相关性分析,结合VI或LAI及水分、温度、辐射等因子构建的综合模型,则是近期发展的第二类统计模型。例如,Irisarri等(2012)发现基于APAR(基于NDVI或EVI获取的FPAR乘以入射光合有效辐射PAR)的回归模型解释能力大多优于仅基于VI的回归模型;Petrosillo等(2013)考虑了水的影响,结合NDVI和NDII较好地模拟了区域初级生产力;孙成明等(2013)引入水热影响因子,建立了在NDVI回归建模的基础上,以年均温、年降水量作为调节因子的中国南方草地NPP估算综合模型,避免了模型关系在年际间的波动;此外,孙成明等(2015)基于相关性分析,采用LAI和考虑月辐射、月均温、月降水量的单位叶面积光合累积量,成功构建了中国草地NPP估算综合模型。
近期有研究表明,日光诱导叶绿素荧光SIF与GPP在全球尺度上存在线性回归关系(Damm et al, 2015)。在日光诱导荧光遥感方面的进一步探索,将为NPP估算提供新的思路。统计模型通过探讨VI、LAI及气候因子与NPP的经验统计关系,能在一定程度上估算区域NPP。但该方法尚存在以下一些不足:①对陆地生态系统过程与功能考虑不足,在植物物理和生理等机理解释方面存在一定局限。②在应用能力方面存在不足。目前主要关注自然植被类型(尤其是草地),对于受人为影响较大的耕地、园地等土地覆盖类型变化较大的农用地研究不足;对于各土地覆盖类型在不同时期采用的VI类型等缺乏系统分析;现有统计模型一般建立在一定的时空尺度上,具有时空依赖性;统计模型是基于地面观测数据和遥感数据而建立,无法应用于预测研究。③模型构建存在不确定性。样地代表性及其观测的方法、遥感数据的质量及其对象适宜性等均可对研究结果产生较大影响。
植被吸收的太阳辐射(APAR)与其生产力呈强相关;光能利用率(Ɛ)可表示为同化过程中存储的化学能与吸收的太阳辐射的比值(Monteith, 1972; Monteith et al, 1977)。二者的乘积可用来表征植被生产力;但二者受温度、水分、大气CO2浓度等外部条件限制。这一资源平衡原理,为光能利用率模型构建的理论基础。利用光能利用率模型(表1)估算NPP时,有两种方式:一是以NPP为直接因变量;二是以GPP为直接因变量,考虑自养呼吸或碳利用效率,间接估算NPP。由于参数简单易得、具有一定机理性及遥感介入优势明显等原因,这类模型成为学者们研究区域NPP遥感估算的重点。
表1 集成遥感数据的光能利用率模型应用案例
Tab.1 Examples of light use efficiency models integrating remote sensing data
| 模型 | 表达形式 | 范围/土地覆盖类型 | Ɛ*来源(取值) | 参考文献 |
|---|---|---|---|---|
| CASA | APAR×Ɛ*(N)×f(T)×f(W) | 湖南省/5大类19小类 | 文献(0.39~0.99) | 陈晓玲等, 2016 |
| SEBAL | APAR×Ɛ*(N)×f(T)×f(W) | 河北省2县/农作物 | — | 苏伟等, 2014 |
| NNPP | APAR×Ɛ*(N)×min[f(T), f(W)] | 青海省/6类草地 | 文献、实测反演 | 卫亚星等, 2012 |
| AgI-LUE | APAR×Ɛ(N) | 美国2州/玉米、大豆 | 统计数据反演 | Bandaru et al, 2013 |
| PEM | APAR×Ɛ*(N)×f(Ta, Ts) | 美国2地/城郊草坪 | 涡度通量观测 | Wu et al, 2012 |
| Modis-derived NPP | APAR×Ɛ*(N)×f(T)×f(W) | 中国2站点/林地 | 文献(55.2α(C3);2.76(C4)) | Chen et al, 2008 |
| GPP/NPP | APAR×Ɛ*(G)×f(T)×f(W) | 黑河流域/5类植被 | 文献 | Gao S et al, 2012 |
| C-Fix | APAR×Ɛ*(G)×f(T)×f(CO2) | 中国/陆地植被 | 1.1 | 陈斌等, 2007 |
| GLO-PEM | APAR×Ɛ*(G)×f(T)×f(W)×f(VPD) | 中国西南地区/陆地植被 | 55.2α(C3);2.76(C4) | 赵志平等, 2015 |
| VPM | APAR×Ɛ*(G)×f(T)×f(W)×f(P) | 中国/耕地 | 涡度通量观测 | 冀咏赞等, 2015 |
| Beams | APAR×Ɛ*(G)×(Pactual/Pmax) | 全球/陆地植被 | 0~1 | Sasai et al, 2005 |
| TL-LUE | (APARmsu×Ɛmsu*(G)+APARmsh×Ɛmsh*(G))×f(T)× f(VPD) | 中国/5类植被 | 实测反演 | He et al, 2013 |
| TL-LUEn | [(APARmsu×Ɛmsu*(G)×β)/(APARmsu×Ɛmsu*(G)+β)×LAImsu+(APARmsh×Ɛmsh*(G)×β)/(APARmsh×Ɛmsh*(G)+β)×LAImsh]×f(T)×f(VPD) | 美国18站点、加拿大 4站点/4类植被 | — | Wang F M et al, 2014 |
| 3PG | APAR×Ɛ*(G)×f(T)×f(VPD)×f(CO2)×f(F)× f(θs)×f(N) | 俄勒冈州西部/冷杉 | — | McAdam, 2015 |
| EC-LUE | APAR×Ɛ*(G)×min[f(T), f(W)] | 全球36站点/C3/C4作物 | 2.14 | Yuan et al, 2016 |
| TEC | APAR×Ɛ*(G)×f(T)×f(W) | 美国18站点/3类植被 | 文献(1.8(C3);2.76(C4) | Yan et al, 2015 |
| GEO-LUE | APAR×Ɛ*(G)×f(T)×f(W)×f(VPD) | 中国/陆地植被 | — | Gao Z Q et al, 2012 |
| TURC | APAR×Ɛ(G) | 全球/陆地植被 | 1.21 | Ruimy et al, 1996 |
| CFLUX | APAR×Ɛ*(G)×f(T)×min[f(W)×f(VPD)]×f(SA) | 北美/8类植被 | 实测反演(0.7~4.9) | King et al, 2011 |
不同光能利用率模型由于对土地覆盖类型、植被吸收光合有效辐射比(FPAR)、环境限制因子、光合有效辐射(PAR)及最大光能利用率(Ɛ*)等参数的考虑不同而存在差异。遥感数据介入光能利用率模型时,在土地覆盖类型和FPAR等方面,主要表现为驱动方式;在环境限制因子、PAR和Ɛ*方面,则主要表现为同化方式。通过对目前应用较多的集成遥感数据的光能利用率模型进行分析,从以下几方面论述模型特点及其发展过程:
(1) 土地覆盖类型可从研究对象角度影响模型构建与应用。例如,CASA模型构建时考虑土地覆盖类型之间的差异,设置不同参数(陈晓玲等, 2016);以C3植被作为整体构建的EC-LUE模型在应用于C4植被时存在低估现象(Yuan et al, 2016);AgI-LUE模型模拟的玉米、大豆NPP分别是MOD17A3中对应时空范围模拟的耕地NPP的2.4倍、1.1倍,但其与通量观测数据一致性较好(Bandaru et al, 2013)等。这些研究结果说明,以不同土地覆盖类型为研究对象而建立的相应模型,其应用对象适宜性存在差异。
(2) Ɛ*影响模型估算的NPP结果,在各模型中由于取值方式、研究对象、时空尺度等原因而存在取值差异。目前在以NPP、GPP为直接因变量的模型中,分别采用Ɛ*(N)、Ɛ*(G)来表示NPP、GPP阶段Ɛ*值(表1)。Ɛ*取值时,则主要通过涡度通量观测、统计数据反演、样点实测反演及文献结果提取等方式获取对象(考虑时间、空间或土地覆盖类型等)适宜值。值得一提的是,在土地覆盖类型混合区,可通过对区内各土地覆盖类型的Ɛ*进行加权平均,进而获取区内植被Ɛ*(卫亚星等, 2012);而考虑到阴叶、阳叶光合作用差异,可将植被Ɛ*分为阴叶、阳叶Ɛ*(He et al, 2013)。另外,由于不同时空尺度下Ɛ*存在差异,还应详细考虑Ɛ*在区域NPP估算中的应用(Xin et al, 2015)。学界对于Ɛ*的取值存在争议,因此这方面仍有待进一步研究。
(3) 光能利用率模型最初多利用辐射站点的太阳辐射数据获取PAR(陈斌等, 2007),但由于辐射站点较少的原因,在中小尺度区域的应用受到限制。因此,采用气象站点数据与辐射站点数据的回归关系获取气象站点下的PAR(刘玉安等, 2013),在某种程度上讲,可实现对辐射站点数据的加密。而从点到面的区域PAR估算则经历了由格网插值(尤其是克里金插值)到ANUSPLIN样条插值(陈斌等, 2007; 卫亚星等, 2012; 牛忠恩等, 2016),由未考虑地形到考虑地形的过程(陈斌等, 2007; 刘玉安等, 2013; 池源等, 2015)。随着这些估算方式的改进,模型参数估算精度得到了提高,模型应用能力也相应得到了提高。从点数据推测面数据在一定程度上能获取区域PAR,但面数据的直接获取可能将进一步提高模型的估算精度。因此,近期基于遥感数据的区域PAR估算方法被逐步引入光能利用率模型(牛忠恩等, 2016)。值得一提的是,鉴于云层状况对光合作用的影响,对太阳辐射中的直接辐射和散射辐射分别加以考虑,将显著提高模型在有云条件下的模拟精度(He et al, 2013; Yuan et al, 2014)。
(4) 在一定尺度下,由FPAR产生的模型模拟不确定性可能大于气象数据(Sjöström et al, 2013; 王苗苗等, 2016)。在模型中,有关FPAR的算法探讨较多。目前,光能利用率模型中FPAR主要依据基于遥感数据获取的指标与其经验关系得到。相关指标主要有EVI(Bandaru et al, 2013; Dong et al, 2015; 赵志平等, 2015)、SR(李庆等, 2013)、NDVI(Yuan et al, 2016)、植被覆盖度指数f(侯湖平等, 2012)、植物覆盖比(Cook et al, 2009)及LAI(Gao S et al, 2012)等。值得一提的是,在CASA模型中,由于采用SR模拟时偏高,而采用NDVI模拟时偏低,因此一般常取由SR和NDVI模拟的FPAR的平均值(苏伟等, 2014);另外,一部分模型,如VPM模型等,将FPAR分为光合部分和非光合部分,模拟植被生产力时多考虑光合作用部分的FPAR(FPARchl)(冀咏赞等, 2015)。
(5) 环境限制因子主要通过影响实际光能利用率(Ɛ)进而影响光合作用结果,不同模型对于这些环境限制因子的考虑不尽相同,原理或算法存在差异。温度(主要包括空气温度、土壤温度和植物生长温度等)和水分(包括土壤水分和水汽压差等)是光能利用率模型中的普遍限制因子(表1)。温度限制因子体现在高温、低温时植物内在生化作用对光合作用的限制,环境温度从最适温度向低温、高温变化时植物的光能转化率呈逐渐变小的趋势,还反映在对植物物候的影响等。其在光能利用率模型中主要以CASA模型(李庆等, 2013)、TEM模型(周才平等, 2004)相应算法为主。水分限制因子主要反映植物所能利用的有效水分条件对光能利用率的影响,因此大部分模型考虑了土壤水分的影响;而水汽压差可通过影响气孔的开关状态进而影响光合作用、呼吸作用、蒸腾作用等,因而考虑水汽压差的模型也相对较多。随着模型研究的深入,对相关水分限制因子算法进行了广泛的探讨。例如,原CASA模型通过采用土壤水分子模型、Thornthwait模型获取实际蒸散和潜在蒸散进而得到水分限制因子,但由于其需要的土壤质地精度难以保证以及计算过程复杂等问题,导致目前使用相对较少;众多学者对其改进以适应模型区域估算要求,所采用的算法主要有实际蒸散与潜在蒸散的比值(Yan et al, 2015)、基于水体指数(李庆等, 2013)、基于地表水分指数(冀咏赞等, 2015; Bao et al, 2016)、基于>0℃积温与湿润度指标(Zhang et al, 2016)、蒸发比(潜热通量与潜热通量、显热通量之和的比值)(卫亚星等, 2012; Yuan et al, 2016)、基于区域实际蒸散模型与潜在蒸散模型(池源等, 2015)、基于相应温度下的饱和大气压和实际大气压(Gao S et al, 2012)等算法。由于采用水分限制因子的差异而导致模型在不同类型植被中表现各异。例如EC-LUE模型由于蒸发比与非林地区域(如热带草原、草地等半干旱气候区)主要水分限制(地表土壤含水量)密切相关,在该类型生态系统应用较好;而GLO-PEM、CASA模型由于采用的水分限制因子(土壤水分条件、大气水汽压差、地表水分条件等),可反映林地区域(尤其是高的年降水量、在干旱季节得到深层土壤水的深根系统)主要水分限制(叶、冠层含水量),在该类型生态系统应用较好等(Zhang et al, 2015)。
除温度、水分之外,有些模型还考虑了其他因素。例如CO2施肥效应(C-Fix模型)、物候期(VPM模型)、林龄(CFLUX模型)及每月低于2℃的天数所占比例、冠层气孔导度及营养(3PG模型)等。多数模型采用最小值法或乘积法来表征对整体环境的限制。有研究表明,最小值法比乘积法更能整合多个环境限制因子对Ɛ的影响(Zhang et al, 2015)。
值得一提的是,利用基于遥感数据的光化学指数PRI估算Ɛ,可能有助于提高光能利用率模型估算植被生产力的精度(Soudani et al, 2014),可拓展光能利用率模型估算NPP的思路。光能利用率模型建立时采用不同的方式(体现在建模时针对不同土地覆盖类型、时空要求等而采用的参数计算过程存在差异),导致模型的适用性特点不尽相同。从土地覆盖类型来看,TURC模型属于未考虑植被类型的通用性模型,因而对于不同地类的有效针对性存在不足;有些模型是针对具体地类而建立,模型适用性存在差别,例如NNPP模型适用于草地、SEBAL模型适用于耕地等。从时间尺度来看,C-FIX、MODIS-derived NPP、SEBAL及C-FLUX等模型大多可用于计算日尺度NPP,这与模型中考虑的植被对环境因子的响应有关;而VPM、CASA等模型可基于遥感数据特点或研究对象,计算8天、10天、16天及月尺度NPP,时间拓展能力相对较强。从空间尺度来看,受气象数据与遥感数据的时空分辨率及不同区域植被功能型差异限制等,目前大多数模型为针对县以上区域进行NPP估算,基于镇域、小矿区、土地整治区等特定的大范围小尺度区域研究相对 较少。
集成遥感数据的光能利用率模型机理性较好(相对于统计模型而言)、参数较少、时空拓展性较好,在区域尺度应用较普遍。但多数模型的主要参数一般基于经验关系得到,使其面临诸多不确定性。除太阳总辐射与PAR的关系、植被非光合作用部分对PAR的影响、PAR与APAR的关系、不同状态(包括类型、生长阶段及外部环境条件等)下的植物呼吸消耗、地下部分NPP等测算存在不确定性之外,多数模型对于时空尺度(例如随时间尺度的增大,TL-LUE模型、TL-LUEn模型与MOD17模型差异逐渐减少)、土地覆盖变化(例如同一块耕地,玉米、大豆隔年耕种,会导致其Ɛ模拟相对困难)(Wu et al, 2015)以及影响Ɛ的冠层结构、氮的分布(Xue et al, 2016)等也考虑不足。
通过对植物光合作用、蒸腾蒸发、呼吸作用、土壤湿度变化、有机物分解以及碳、氮、营养物质的动态过程等进行模拟,结合土壤、气象及植物生理学参数等,建立植被生产力估算模型,称为过程模型。模拟碳循环的过程模型数量众多,但多以气象、土壤等数据为驱动。现有集成遥感数据的过程模型多由遥感数据以同化方式介入生成,且数量较少。相关过程模型主要有TEM模型、BEPS模型、Biome-BGC模型、InTEC模型、EPPML模型、SiB2模型及MOD-Sim-CYCLE模型等(表2)。
表2 集成遥感数据的过程模型应用案例
Tab.2 Examples of process models integrating remote sensing data
| 模型 | 动态模拟 | 模型主要结构或表达 | 范围/土地覆盖类型 | 参考文献 | |||
|---|---|---|---|---|---|---|---|
| 碳 | 氮 | 水 | 能量 | ||||
| TEM | √ | √ | WBM水分平衡模型、物候模型、植物摄取N模型 | 全球/10类功能型植被 | Liao et al, 2015 | ||
| BEPS | √ | 气孔导度模型(Jarvis经验模型)、叶片瞬时光合作用模型(Farquhar模型)、两叶模型 | 南京/9类土地覆盖 | Zhou et al, 2015 | |||
| Biome-BGC | √ | √ | √ | √ | 包括初始化文件、气象数据文件及包含44个生理生态参数的文件* | 加拿大/半干旱草地 | He et al, 2015 |
| InTEC | √ | √ | 叶片瞬时光合作用模型(Farquhar模型)、CENTURY土壤碳和氮循环模型、净氮矿化模型、age-NPP关系模型、土壤三维水文模型 | 东北地区/森林 | 李明泽等, 2015 | ||
| EPPML | √ | √ | 气孔导度模型与气体传输模型相结合、叶片瞬时光合作用模型(Farquhar模型)、两叶模型 | 长白山自然保护区/9类植被 | 张娜等, 2003 | ||
| SiB2 | √ | √ | √ | 空气动力学转移、水力学扩散、重力引流、一维能量平衡、转移模型(冠层结构为单叶,包含融雪模块) | 位山引黄灌区/小麦、玉米 | 雷慧闽等, 2012 | |
| MOD-Sim-CYCLE | √ | 叶片光合作用速率采用Michaelis型函数、气孔导度模型使用Ball修正公式、冠层尺度过程是基于叶片光合作用速率、光合作用量子通量密度,在日长、叶面积指数上的积分 | 全球/7大类31小类 | Hazarika et al, 2005 | |||
上述模型在发展早期,主要利用基于遥感数据获取的VI、LAI、FPAR、冠层绿度比及物候等作为模型光合作用部分的基础参数。例如,周才平等(2004)利用基于MODIS LAI获取的物候学参数,以及利用NDVI获取的生物量,来驱动TEM模型;Sellers 等(1996)利用AVHRR数据获取的FPAR、LAI、冠层绿度比N,来驱动SiB2模型;张娜等(2003)利用基于TM数据的LAI来驱动EPPML模型;以及Hazarika 等(2005)利用MODIS LAI驱动MOD-Sim-CYCLE模型等。相较于仅采用气象、土壤数据的过程模型,遥感数据的引入使相关模型应用能力得到了较大提升。
近年来,为提高集成遥感数据的过程模型适用性,众多学者相继开展探索,重点为模型结构优化和参数优化两方面。就模型结构优化而言,主要包括引入新的参数以及调整原有算法结构。例如,考虑干旱(尤其是严重干旱、极端干旱)影响及其时间滞后效应,将干旱指数PDSI引入TEM模型(Liao et al, 2015);由于在原BEPS模型中,氮对碳通量及生物量碳氮比的影响未被恰当考虑(氮含量被设置为基于植被类型的常数),通过构建植被—大气—土壤系统氮循环模型,将其整合到BEPS模型中,可提高氮限制区域的植被NPP模拟精度(Zhang et al, 2011);为使BEPS模型适用于模拟冬小麦NPP,将适用于模拟森林NPP的两片大叶模型修改为基于冬小麦生理特点、种植结构的多层—两片大叶模型(王培娟等, 2009);将解释冠层光合作用能力、物候及水压力的LSWI、EVI,整合到TEM模型并构建SAT-TEM模型,在非林地区域的模拟精度优于原TEM模型(Chen et al, 2011);为弥补模型仅考虑降水的垂直运动的不足,通过从水循环角度增加浸润、地表径流过程改进BEPS模型,以适用于中国西北干旱、半干旱地区植被生产力模拟(Wang P J et al, 2014);通过修改草地相应参数,考虑灌溉、施肥与收割等,填补了Biome-BGC模型中农作物参数的空白(胡波等, 2011)等。就参数优化而言,主要包括利用同化数据如模型模拟数据(MODIS GPP、BEPS模拟结果等)或通量观测数据等,基于迭代优化等方法对关键参数进行优化,以及改进参数数据输入等。例如,利用MODIS数据获取的碳氮比率代替原基于植被类型的常数,从而可更好地模拟地面实际NPP(He et al, 2015);比较NDVI、WDRVI等植被指数估算LAI的能力,选取对作物生长初期、末期LAI变化过程反映较好的WDRVI模拟结果作为SiB2模型遥感参数输入(雷慧闽等, 2012);将BEPS模型模拟值作为参考年数据引入InTEC模型(李明泽等, 2015);基于MODIS GPP与干旱数据(不同植被功能型的时间滞后特点、PDSI阈值)的经验关系,利用数据同化方法改进TEM模型适用能力(Liao et al, 2015);基于月尺度通量数据和贝叶斯推理方法对SAT-TEM模型进行参数优化(Chen et al, 2011);基于半小时步长BEPSHourly模型,利用迭代优化的方法对最大羧化速率Vcmax和最大电子传递速率Jmax进行不同组合,以优化BEPSHourly模型参数(卢伟等, 2016b);将优化后的参数引入日步长BEPSDaily模型,提高计算效率和模拟精度(卢伟等, 2016a)等。值得一提的是,利用基于遥感数据获取的叶绿素含量指代Vcmax估算植被生产力(Houborg et al, 2015),为集成遥感数据的过程模型发展提供了新的思路。
相比于其他类模型,集成遥感数据的过程模型以植被-土壤-大气连续体为研究对象,机理性较强;但同时参数较多且复杂,导致其应用相对较少。当前,集成遥感数据的过程模型构建与发展存在以下问题:①模型构建问题。植物的生理生态过程复杂,至今认识仍有限,致使模型构建仍存在诸多经验过程,无法清晰地解释植物在不同生长阶段、不同环境条件下的生物地球化学过程、生物地理过程与生物物理过程(例如同一植被在不同生长阶段的结构状态、在不同区域或不同干扰下的适应特征等)。②模型应用问题。当前过程模型中对于植被分类精度以及所讨论的植被类型相对有限,许多类型植被的相关研究不足;模型本地化过程中由于缺乏相应参数或验证数据(如通量观测或其他实测数据)而存在参数优化困难等问题;由于模型构建时,将时空信息反映较差的气象、土壤及水文等传统观测数据整合到植物光合作用过程,导致模型时间、空间扩展能力相对较差(目前多数模型以日时间尺度、中大区域以上空间尺度为主),限制模型在其他时空尺度的应用。③模型数据问题。模型高精度模拟的特点对参数要求较高,而当前基础数据相对缺乏,所需初始数据和驱动数据的更新缓慢、精度有限;目前以同化方式介入为主的遥感数据的参与,尽管在一定程度上能提高过程模型应用能力,但作用相对有限(多用于光合作用过程模拟),即遥感数据介入过程模型的能力有待提高。
统计模型是基于经验统计关系建立的模型,尽管其空间异质性反映较好,但在植物物理和生理等机理解释方面存在明显局限。过程模型是基于叶片、冠层尺度的生理生态学分析而建立的“自下而上”模型,这类模型在利用试验点模拟外推至区域尺度时存在较大的不确定性,且难以充分反映景观的异质性;光能利用率模型是基于资源平衡理论而建立的“自上而下”模型,能较好地反映景观异质性,但缺乏充分解释物理现象的生理生态学机理(王军邦等, 2009)(图7)。
为实现NPP的跨尺度高精度模拟,有学者对二者进行耦合,GLOPEM-CEVSA模型便是典型的基于光能利用率模型与过程模型的耦合模型,并在站点尺度得到了验证(Wang et al, 2011)。GLOPEM-CEVSA模型在总初级生产力估算部分采用GLO-PEM模型的算法,并在自养呼吸部分考虑了植物生理生态学过程机理,而非简单经验关系。初始化过程中需迭代运行至生态系统(植被和土壤碳库)平衡状态(王军邦等, 2009)。它综合了过程模型与光能利用率模型的优点,较好地融合了气象数据、土壤数据及遥感数据(以驱动方式介入模型为主)等多源数据,一方面增加了模型机理性,另一方面增强了空间异质性反映。
然而,耦合模型由于复杂性程度仍高于光能利用率模型,参数、算法要求较高,并且与过程模型的整合也存在一定的困难,因此,耦合模型在当前应用与发展上存在理论与技术瓶颈。
基于遥感数据估算NPP的模型研究成果丰硕,学术界通过对估算模型不断地改进、完善,大大提高了模型的应用能力。但目前集成遥感数据的NPP估算模型发展仍面临诸多挑战:
(1) 模型验证相对困难。当前主要采用通量观测、统计数据、其他模型结果、实地采样等数据来验证模型模拟结果,但这些数据使用时均存在局限性。其中通量观测被认为是目前四种方法中较为精确的手段,能连续实时地观测碳等通量,但通量观测站仪器较为昂贵、站点数量少、站点所在土地覆盖类型相对有限;统计数据一般为县域以上尺度数据,空间性反映不足,且受主观因素影响,数据不确定性较大;不同模型结果由于模型模拟时所采用的步长、空间分辨率、使用的数据源等的差异而造成可比性较差;实地采样则表现为数据获取困难,样点的代表性、适宜性及取样过程等均存在不确定性,且向区域及以上尺度推广困难。
(2) 模型的生理生态机理尚未明晰。例如,不同植被对区域环境变化存在一定的自适应过程,即植被对环境响应存在差异,直接导致植被气候响应过程量化困难,而相应问题在现有模型中较少得到体现。另外,现有模型大多对生理生态过程进行了不同程度的简化,例如部分参数是通过经验关系获取,部分参数因为野外实验较为困难而采用常数值,均导致实际值与模拟结果存在一定的偏差等。
(3) 模型应用存在诸多问题。模型在矿区、土地整治区、土壤污染修复区以及城郊区等受人为干扰以及气象灾害、极端事件(林火、虫害)等自然干扰较强区域的研究与应用相对缺乏;模型应用时所需遥感反演参数已有产品精度有限(主要是由于卫星遥感传感器的时空分辨率局限等原因导致目前绝大部分产品的空间分辨率≤1 km);参数厘定时对土地覆盖变化(如耕地作物种植的年内或年际变化等)考虑较少,涉及具体种类时通常按所属土地覆盖大类或相近类型进行处理;在区域尺度应用时,模型本地化困难,例如光能利用率模型中最大光能利用率的取值问题,统计模型需重新构建经验关系问题,过程模型需进行相应参数优化(如BEPS模型中的最大羧化速率等)问题等;数据处理技术存在不足,例如在数据融合技术(多源数据的融合需求)、数据计算能力(随着相应数据时空精度要求的提高,其数据量增量巨大)方面亟待加强。
遥感手段的大尺度、动态实时观测等自身特点决定了其将具有很好的发展前景,在NPP估算模型中参数的量化及时空动态的表征能力等方面,具有传统统计观测手段所无法比拟的优势。当前,遥感数据的快速增加,众多遥感数据的免费提供,遥感观测形式的多样化,以及遥感处理技术水平的不断提高等,必将大大促进NPP估算模型的发展。本文在分析NPP遥感估算模型面临挑战的基础上,结合目前遥感技术与模型算法的发展态势,从以下几个方面提出研究展望:
(1) 融合多学科视野,深入研究NPP的形成机理与影响因素。NPP形成过程复杂,涉及众多学科,这些学科的发展将促进NPP估算模型的发展。在理论上,借助于植物学、生态学、水文学、气象学、土壤学、物理学及灾害学等学科,可进一步认识NPP形成过程与影响因素,如土壤因素(有机质、营养及重金属含量等土壤性状)、气候因素(受雾霾、地形、云层及地物等影响的太阳辐射、温度及降水等)、水分因素(水分转移过程、水质条件等)、空气因素(CO2浓度与含氮量等)、植物因素(植物的结构、生长过程特点、光合作用、呼吸作用、蒸腾作用及环境自适应能力等)及外界干扰因素(虫害等自然灾害、人为干扰等)等。
(2) 加快发展空天地一体化观测体系,为NPP估算模型提供大范围、长时间、高精度的遥感、地面观测及验证数据。强化由侧重单一源遥感(常规多光谱遥感)向完善多源遥感(荧光遥感、激光雷达、合成孔径雷达等)、由卫星遥感向融合航空(无人机遥感等)和地面遥感、由多光谱遥感向高光谱遥感、由低时空分辨率遥感向高时空分辨率遥感等方向发展。完善通量观测、实验站点、气象站点、辐射站点及常规统计等地面观测网络。
(3) 提高遥感处理技术与地物信息识别能力,挖掘模型参数遥感化潜力,提高遥感产品适用性。发展融合技术、同化算法,充分利用多源数据的优势挖掘地物信息;提高遥感数据处理技术,充分拓展荧光遥感、微波遥感等的应用能力;加快探索新的遥感化参数,如基于遥感数据获取的日光诱导叶绿素荧光SIF、光化学指数PRI、叶绿素含量Chll等在NPP估算中的应用潜力;充分整合现有遥感产品,如30 m全球土地覆盖、GLASS地表参数等产品,并针对当前遥感产品空间分辨率大多不高于1 km、时间分辨率相对较低(如土地覆盖产品更新缓慢)的缺陷,加快发展遥感手段和利用遥感观测数据生产高精度产品,例如加快开发基于高分四号、风云三号、资源三号等卫星的地表参数产品等,以此推进NPP估算模型的发展与应用。
(4) 拓展NPP估算模型的时空尺度。由于地学现象的普遍复杂性,尺度转换是NPP估算建模过程中的重要科学问题。在一定空间分辨率的遥感数据下,空间尺度的差异往往导致像元的异质性,进而影响NPP估算的精度及模型的适用性,这一问题在时间尺度也同样存在。目前,学者已尝试建立不同时空尺度的NPP遥感估算模型,通过站点尺度的验证,在区域等较大尺度上取得了积极的研究进展。然而大多数研究仍局限于特定时空尺度,仍有必要充分考虑区域适宜性、地类适宜性及植被适宜性,加强NPP估算模型的综合集成,进一步完善相应的时空尺度转换技术。
(5) 加快构建数据共享网络,增强模型估算NPP的软硬件支撑。模型复杂性是相对的,与数据来源、处理能力等存在关联。要借助发展日趋成熟的互联网构建共享网络,提高已有数据使用效率,进而促进NPP估算模型的发展。另外,鉴于数据的大量产生(例如高精度的数据必然带来数据量级倍增、多源数据的发展使数据源分析复杂化等),必须开发或引入相应的数据处理方法、软件与存储设备等,以提高大数据处理能力,进而为大区域高精度NPP估算服务。
The authors have declared that no competing interests exist.
| [1] |
he ecology of ecosystem [J]. |
| [2] |
地形对草甸草原植被生产力分布格局的影响 [J].https://doi.org/10.5846/stxb201306201748 URL [本文引用: 1] 摘要
草原植被生产力在陆地生态系统碳平衡分析中扮演重要角色,而地形作为影响植被生产力(NPP)分布格局的重要环境因子在已有的草原遥感监测研究中没有被充分重视.以USGS和GLCF共享MODIS和DEM数据为数据源,选取呼伦贝尔辉河湿地保护区草甸草原核心区为研究对象,在地面光谱生物量模型构建的基础上,采用ARCGIS的空间分析功能对呼伦贝尔草甸草原2000-2012年的NPP分布格局进行了分析.研究结果表明,地形对草甸草原植被生产力分布格局有显著的影响.在海拔高度、坡度和坡向等3个地形因子中,海拔高度引起的NPP变化幅度最大,坡度次之,坡向最小.在总体特征上,海拔高度每升高1Om,生产力增加4.78 g/m2;坡度每增加1°生产力增加-1.42g/m2;N坡向植被生产力水平最高(184.8g/m2),西南(SW)坡向最低(173.3g/m2).从不同地形因子的分布面积特点判断,地形对草甸草原NPP的影响尺度介于土壤环境异质性和草场类型异质性之间.不同生产力水平年份对生产力分布格局的影响趋势一致,但变化幅度不同,在中等生产力水平年份NPP变幅最大.
Impact of topography on the spatial distribution pattern of net primary productivity in a meadow [J].https://doi.org/10.5846/stxb201306201748 URL [本文引用: 1] 摘要
草原植被生产力在陆地生态系统碳平衡分析中扮演重要角色,而地形作为影响植被生产力(NPP)分布格局的重要环境因子在已有的草原遥感监测研究中没有被充分重视.以USGS和GLCF共享MODIS和DEM数据为数据源,选取呼伦贝尔辉河湿地保护区草甸草原核心区为研究对象,在地面光谱生物量模型构建的基础上,采用ARCGIS的空间分析功能对呼伦贝尔草甸草原2000-2012年的NPP分布格局进行了分析.研究结果表明,地形对草甸草原植被生产力分布格局有显著的影响.在海拔高度、坡度和坡向等3个地形因子中,海拔高度引起的NPP变化幅度最大,坡度次之,坡向最小.在总体特征上,海拔高度每升高1Om,生产力增加4.78 g/m2;坡度每增加1°生产力增加-1.42g/m2;N坡向植被生产力水平最高(184.8g/m2),西南(SW)坡向最低(173.3g/m2).从不同地形因子的分布面积特点判断,地形对草甸草原NPP的影响尺度介于土壤环境异质性和草场类型异质性之间.不同生产力水平年份对生产力分布格局的影响趋势一致,但变化幅度不同,在中等生产力水平年份NPP变幅最大.
|
| [3] |
中国陆地生态系统NPP模拟及空间格局分析 [J].Study on modeling and spatial pattern of net primary production in China's terrestrial ecosystem [J]. |
| [4] |
|
| [5] |
亚热带山地丘陵区植被NPP时空变化及其与气候因子的关系: 以湖南省为例 [J].https://doi.org/10.11821/dlxb201601003 URL [本文引用: 1] 摘要
以湖南省为研究区,采用250 m×250 m空间分辨率的MODIS-NDVI数据,结合相应时间段的气象数据,使用改进的CASA模型,模拟并分析该区域2000-2013年间的植被NPP的时空变化特征,并借助统计分析方法对不同土地覆盖类型中植被NPP的变化趋势及其显著性、NPP与气候因子的相关性进行量化分析。结果表明:1该区域的净初级生产量年际变化特征明显,年净初级生产量分布在41.62~125.40 Tg C/yr之间,平均值为86.34 Tg C/yr,总体来看,14年间湖南省植被净初级生产量呈波动减少趋势,年际减少趋势为2.70 Tg C/yr;2 NPP空间分布差异较大,基本特点是西高东低、南高北低,从西南向东北呈逐渐递减趋势,其中,各植被分区的NPP有明显差异;3 2000-2013年,湖南省植被NPP呈极显著增加(slope〉0,p〈0.01)、显著增加(slope〉0,0.01≤p〈0.05)、无明显变化(p≥0.05)、极显著减少(slope〈0,p〈0.01)和显著减少(slope〈0,0.01≤p〈0.05)的区域分别占总面积的比例为5.40%、2.02%、61.64%、16.79%和14.15%。植被NPP变化趋势总体上显示为减少的趋势,而不同土地覆盖类型的植被NPP变化趋势及显著性存在较大差异,其中草地的NPP变化趋势最为显著,接着依次是森林、其他土地、建设用地和农田;4分析不同土地覆盖类型的植被NPP对气候因子的响应,发现NPP与降水量之间的相关关系强于其与温度的相关关系。
Spatial and temporal variability of the net primary production (NPP) and its relationship with climate factors in subtropical mountainous and hilly regions of China: A case study in Hunan Province [J].https://doi.org/10.11821/dlxb201601003 URL [本文引用: 1] 摘要
以湖南省为研究区,采用250 m×250 m空间分辨率的MODIS-NDVI数据,结合相应时间段的气象数据,使用改进的CASA模型,模拟并分析该区域2000-2013年间的植被NPP的时空变化特征,并借助统计分析方法对不同土地覆盖类型中植被NPP的变化趋势及其显著性、NPP与气候因子的相关性进行量化分析。结果表明:1该区域的净初级生产量年际变化特征明显,年净初级生产量分布在41.62~125.40 Tg C/yr之间,平均值为86.34 Tg C/yr,总体来看,14年间湖南省植被净初级生产量呈波动减少趋势,年际减少趋势为2.70 Tg C/yr;2 NPP空间分布差异较大,基本特点是西高东低、南高北低,从西南向东北呈逐渐递减趋势,其中,各植被分区的NPP有明显差异;3 2000-2013年,湖南省植被NPP呈极显著增加(slope〉0,p〈0.01)、显著增加(slope〉0,0.01≤p〈0.05)、无明显变化(p≥0.05)、极显著减少(slope〈0,p〈0.01)和显著减少(slope〈0,0.01≤p〈0.05)的区域分别占总面积的比例为5.40%、2.02%、61.64%、16.79%和14.15%。植被NPP变化趋势总体上显示为减少的趋势,而不同土地覆盖类型的植被NPP变化趋势及显著性存在较大差异,其中草地的NPP变化趋势最为显著,接着依次是森林、其他土地、建设用地和农田;4分析不同土地覆盖类型的植被NPP对气候因子的响应,发现NPP与降水量之间的相关关系强于其与温度的相关关系。
|
| [6] |
庙岛群岛南五岛生态系统净初级生产力空间分布及其影响因子 [J].https://doi.org/10.5846/stxb201405040880 URL [本文引用: 2] 摘要
净初级生产力(NPP)估算对于海岛碳源/汇研究具有重要意义.以庙岛群岛南五岛为例,结合CASA模型和区域特征构建NPP估算模型,借助RS和GIS技术进行NPP估算,进而分析南五岛NPP空间分布特征及其影响因子.结果表明:南五岛NPP总量为11043.52 t C/a,平均密度为340.19 g C m-2 a-1,处于全国平均水平,高于同纬度的西部地区,低于东部沿海大陆地区;夏季NPP总量占全年的80%左右,春季和秋季分别占11%和7%,冬季仅占1.3%;不同海岛的NPP平均密度由大到小依次为大黑山岛、北长山岛、庙岛、南长山岛和小黑山岛,各岛NPP平均密度与建设用地比例呈明显负相关;不同地表覆盖类型的NPP平均密度由大到小依次为阔叶林、针叶林、农田、草地、建设用地和裸地,林地具有较高的NPP值,说明南五岛的人工林建设具有重要生态作用;NDVI和地表覆盖类型是NPP最主要的影响参数,地形参数通过影响NDVI和地表覆盖类型间接作用于NPP结果;NPP与土壤pH、有效磷、全磷、全钾呈显著负相关,与全氮、总碳、总有机碳呈显著正相关,与含水量、速效钾和含盐量之间相关关系不明显.
The spatial distribution and impact factors of net primary productivity in the island ecosystem of five southern islands of Miaodao Archipelago [J].https://doi.org/10.5846/stxb201405040880 URL [本文引用: 2] 摘要
净初级生产力(NPP)估算对于海岛碳源/汇研究具有重要意义.以庙岛群岛南五岛为例,结合CASA模型和区域特征构建NPP估算模型,借助RS和GIS技术进行NPP估算,进而分析南五岛NPP空间分布特征及其影响因子.结果表明:南五岛NPP总量为11043.52 t C/a,平均密度为340.19 g C m-2 a-1,处于全国平均水平,高于同纬度的西部地区,低于东部沿海大陆地区;夏季NPP总量占全年的80%左右,春季和秋季分别占11%和7%,冬季仅占1.3%;不同海岛的NPP平均密度由大到小依次为大黑山岛、北长山岛、庙岛、南长山岛和小黑山岛,各岛NPP平均密度与建设用地比例呈明显负相关;不同地表覆盖类型的NPP平均密度由大到小依次为阔叶林、针叶林、农田、草地、建设用地和裸地,林地具有较高的NPP值,说明南五岛的人工林建设具有重要生态作用;NDVI和地表覆盖类型是NPP最主要的影响参数,地形参数通过影响NDVI和地表覆盖类型间接作用于NPP结果;NPP与土壤pH、有效磷、全磷、全钾呈显著负相关,与全氮、总碳、总有机碳呈显著正相关,与含水量、速效钾和含盐量之间相关关系不明显.
|
| [7] |
降水时间对内蒙古温带草原地上净初级生产力的影响 [J].Effects of precipitation timing on aboveground net primary productivity in Inner Mongolia temperate steppe [J]. |
| [8] |
基于植被净初级生产力的煤矿区生态损失测度研究 [J].Study on the measurement of ecological loss based on the net primary productivity in coal mines [J]. |
| [9] |
遥感数据结合Biome-BGC模型估算黄淮海地区生态系统生产力 [J].Estimation of the net ecosystem productivity in Huang-Huai-Hai region combining with Biome-BGC model and remote sensing data [J]. |
| [10] |
基于MODIS数据的中国耕地高中低产田空间分布格局 [J].A MODIS data derived spatial distribution of high-, medium- and low-yield cropland in China [J]. |
| [11] |
基于MODIS黄河三角洲湿地NPP与NDVI相关性的时空变化特征 [J].
应用EOS/MODIS卫星遥感资料,分析2001—2006年黄河三角洲地区植被净初级生产NPP及NDVI时空变化特征,在到海岸线不同距离的区域内,讨论了年植被净初级生产力(aNPP)与年均归一化植被指数(ANDVI)的相关性,并建立一元回归分析模型。可以看出,黄河三角洲湿地生态系统分布自海向陆具有明显的空间异质性,滩涂湿地分布于沿海地区,生产力高,该地区aNPP值高且与ANDVI呈显著正相关;其他区域由于是盐碱荒地或农业生态系统,因土壤盐分含量高而系统生产力低,或农耕地受人类干扰严重,一年总的生产力下降,而导致这些区域ANDVI与aNPP呈负相关。利用NDVI进行黄河三角洲生产力监测的可行区域,在距离海岸线小于6_km的范围内,所研究的6a回归模型均通过α=0.01的显著水平的F检验,模型的R2值为0.86—0.97。同时在生产力无法估测的区域,可以使用NDVI有效管理黄河三角洲生态系统,提高其生产力水平。
Spatial-temporal variation of NPP and NDVI correlation in wetland of Yellow River Delta based on MODIS data [J].
应用EOS/MODIS卫星遥感资料,分析2001—2006年黄河三角洲地区植被净初级生产NPP及NDVI时空变化特征,在到海岸线不同距离的区域内,讨论了年植被净初级生产力(aNPP)与年均归一化植被指数(ANDVI)的相关性,并建立一元回归分析模型。可以看出,黄河三角洲湿地生态系统分布自海向陆具有明显的空间异质性,滩涂湿地分布于沿海地区,生产力高,该地区aNPP值高且与ANDVI呈显著正相关;其他区域由于是盐碱荒地或农业生态系统,因土壤盐分含量高而系统生产力低,或农耕地受人类干扰严重,一年总的生产力下降,而导致这些区域ANDVI与aNPP呈负相关。利用NDVI进行黄河三角洲生产力监测的可行区域,在距离海岸线小于6_km的范围内,所研究的6a回归模型均通过α=0.01的显著水平的F检验,模型的R2值为0.86—0.97。同时在生产力无法估测的区域,可以使用NDVI有效管理黄河三角洲生态系统,提高其生产力水平。
|
| [12] |
1984~2006年黄河下游大型灌区碳平衡长期变化 [J].Long-term variability of the carbon balance in a large irrigated area along the lower Yellow River from 1984 to 2006 [J]. |
| [13] |
东北林区净初级生产力及大兴安岭地区林火干扰影响的模拟研究 [J].https://doi.org/10.17521/cjpe.2015.0031 URL [本文引用: 2] 摘要
?森林净初级生产力(NPP)是衡量陆地碳源/汇的重要参数,准确地估算森林生态系统的NPP,同时通过引入干扰因子以期更加完整地描述生态学过程及其响应是目前森林生态系统碳循环研究的重点。因此,该研究基于北方生态系统生产力(BEPS)模型,结合遥感数据和气象数据等模拟2003年东北林区NPP;将BEPS模型模拟的结果作为整合陆地生态系统碳收支(InTEC)模型的参考年数据,模拟东北林区1901–2008年的NPP,并在InTEC模型中加入林火干扰数据,模拟大兴安岭地区1966–2008年的森林NPP。结果显示:在1901年,东北林区NPP平均值仅为278.8gC·m–2·a–1,到了1950年,NPP平均值增加到338.5gC·m–2·a–1,2008年NPP平均值进一步增加到378.4gC·m–2·a–1。其中长白山地区的NPP平均值始终最高,大兴安岭次之,小兴安岭始终最低。到了2008年,大、小兴安岭和长白山地区的NPP平均值都有较大涨幅,其中涨幅最高的是长白山地区,达到200–300gC·m–2·a–1;东北三省中,黑龙江和吉林的NPP平均值和总量都比较高,辽宁相对较低,但相比于1901年的涨幅最高,达到70%;重大火灾(100–1000hm2)对NPP的影响不是很大,而特大火灾(>1000hm2)的影响比较大,使NPP下降幅度达到10%左右,其他火灾年份,NPP增长迅速并保持在较高水平;对火灾面积在100000hm2以上的4个年份的NPP进行分析,发现NPP平均值都大幅度下降,其中1987年下降幅度最大,为11%以上。
Simulation of forest net primary production and the effects of fire disturbance in Northeast China [J].https://doi.org/10.17521/cjpe.2015.0031 URL [本文引用: 2] 摘要
?森林净初级生产力(NPP)是衡量陆地碳源/汇的重要参数,准确地估算森林生态系统的NPP,同时通过引入干扰因子以期更加完整地描述生态学过程及其响应是目前森林生态系统碳循环研究的重点。因此,该研究基于北方生态系统生产力(BEPS)模型,结合遥感数据和气象数据等模拟2003年东北林区NPP;将BEPS模型模拟的结果作为整合陆地生态系统碳收支(InTEC)模型的参考年数据,模拟东北林区1901–2008年的NPP,并在InTEC模型中加入林火干扰数据,模拟大兴安岭地区1966–2008年的森林NPP。结果显示:在1901年,东北林区NPP平均值仅为278.8gC·m–2·a–1,到了1950年,NPP平均值增加到338.5gC·m–2·a–1,2008年NPP平均值进一步增加到378.4gC·m–2·a–1。其中长白山地区的NPP平均值始终最高,大兴安岭次之,小兴安岭始终最低。到了2008年,大、小兴安岭和长白山地区的NPP平均值都有较大涨幅,其中涨幅最高的是长白山地区,达到200–300gC·m–2·a–1;东北三省中,黑龙江和吉林的NPP平均值和总量都比较高,辽宁相对较低,但相比于1901年的涨幅最高,达到70%;重大火灾(100–1000hm2)对NPP的影响不是很大,而特大火灾(>1000hm2)的影响比较大,使NPP下降幅度达到10%左右,其他火灾年份,NPP增长迅速并保持在较高水平;对火灾面积在100000hm2以上的4个年份的NPP进行分析,发现NPP平均值都大幅度下降,其中1987年下降幅度最大,为11%以上。
|
| [14] |
以HJ-1卫星遥感数据估算高寒草地植被净第一性生产力的潜力评估: 以若尔盖草地为例 [J].https://doi.org/10.7522/j.issn.1000-694X.2013.00176 URL [本文引用: 3] 摘要
基于HJ-1卫星数据、数字高程数据、气象数据和地面实测数据,利用改进后的CASA模型估算了2010年若尔盖草地的植被净第一性生产力(NPP),以评价该卫星数据在高寒草地NPP估算中的应用潜力。结果表明:(1)利用改进后的CASA模型模拟草地生物量,通过与实测地上生物量比较,两者的相关程度较高,R2=0.8726。模拟精度达80%,因此可以作为估产模型实际应用;(2)利用改进后的CASA模型模拟草地NPP,模拟结果比其他研究结果略大,但更适合于若尔盖草地;(3)HJ-1卫星数据为高寒草地NPP的估算提供了高时间和高空间分辨率的数据源。
Evaluation on net primary productivity of alpine meadow based on HJ-1 satellite data: A case study in the Zoige grassland [J].https://doi.org/10.7522/j.issn.1000-694X.2013.00176 URL [本文引用: 3] 摘要
基于HJ-1卫星数据、数字高程数据、气象数据和地面实测数据,利用改进后的CASA模型估算了2010年若尔盖草地的植被净第一性生产力(NPP),以评价该卫星数据在高寒草地NPP估算中的应用潜力。结果表明:(1)利用改进后的CASA模型模拟草地生物量,通过与实测地上生物量比较,两者的相关程度较高,R2=0.8726。模拟精度达80%,因此可以作为估产模型实际应用;(2)利用改进后的CASA模型模拟草地NPP,模拟结果比其他研究结果略大,但更适合于若尔盖草地;(3)HJ-1卫星数据为高寒草地NPP的估算提供了高时间和高空间分辨率的数据源。
|
| [15] |
叶面积指数遥感反演研究进展与展望 [J].https://doi.org/10.3724/SP.J.1047.2013.00734 URL [本文引用: 1] 摘要
叶面积指数表征叶片的疏密程度和冠层结构特征,体现植被光合、呼吸和蒸腾作用等生物物理过程的能力,是描述土壤-植被-大气之间物质和能量交换的关键参数。目前多种卫星传感器观测生成了多个区域和全球的叶面积指数标准产品。本文综述了基于光学遥感数据的叶面积指数反演进展:首先,介绍了叶面积指数的定义和在生态系统模拟中的作用;然后,阐述了基于光学遥感反演叶面积指数的基本原理;在此基础上,论述了基于植被指数经验关系和基于物理模型的两种主要遥感反演算法,讨论了2种算法的优点和存在的问题,并总结了现有的主要全球数据产品及其特点,论述了产品检验的方法和需要注意的问题;最后,总结了当前叶面积指数反演中存在的问题,并展望了其发展趋势和研究方向。
Current status and perspectives of leaf area index retrieval from optical remote sensing data [J].https://doi.org/10.3724/SP.J.1047.2013.00734 URL [本文引用: 1] 摘要
叶面积指数表征叶片的疏密程度和冠层结构特征,体现植被光合、呼吸和蒸腾作用等生物物理过程的能力,是描述土壤-植被-大气之间物质和能量交换的关键参数。目前多种卫星传感器观测生成了多个区域和全球的叶面积指数标准产品。本文综述了基于光学遥感数据的叶面积指数反演进展:首先,介绍了叶面积指数的定义和在生态系统模拟中的作用;然后,阐述了基于光学遥感反演叶面积指数的基本原理;在此基础上,论述了基于植被指数经验关系和基于物理模型的两种主要遥感反演算法,讨论了2种算法的优点和存在的问题,并总结了现有的主要全球数据产品及其特点,论述了产品检验的方法和需要注意的问题;最后,总结了当前叶面积指数反演中存在的问题,并展望了其发展趋势和研究方向。
|
| [16] |
基于地形校正的植被净初级生产力遥感模拟及分析 [J].Simulation by remote sensing and analysis of net primary productivity of vegetation based on topographical correction [J]. |
| [17] |
a. 不同步长尺度下BEPS碳循环模型的协同应用 [J].https://doi.org/10.13287/j.1001-9332.201609.017 URL 摘要
小时步长的BEPSHourly模型可以模拟植被日内生态生理过程,但模型的结构及解算过程复杂耗时,常适用于站点尺度进行参数优化及总初级生产力(GPP)、净初级生产力(NPP)的日内变化分析;日步长的BEPSDaily模型解算日光合速率方法简单,不涉及众多的迭代过程,模型耗时较少,适用于模拟计算区域初级生产力及分析区域碳源/汇空间分布。本研究根据BEPSDaily及BEPSHourly各自的模型特点及适用性,提出了小时步长及日步长BEPS模型的协同应用研究方法。首先利用BEPSHourly模型在站点尺度进行主要光合作用参数——最大羧化速率(Vc max)、最大电子传递速率(Jmax)的优化,将优化后主要光合作用参数引入区域BEPSDaily模型进行参数修正,再基于优化修正后的区域BEPSDaily模型进行区域NPP估测。结果表明:基于通量数据对光合作用主要参数进行优化可以提高模型的模拟能力;2011年,帽儿山地区不同森林类型的初级生产能力依次为阔叶林〉针阔混交林〉针叶林;本研究提出的不同步长尺度碳循环模型协同应用研究方法能够有效地进行主要光合作用参数的优化,模拟GPP、NPP的月平均日内变化,快速估测区域NPP并分析碳源/汇空间分布。
a. Collaborative application of BEPS at different time steps [J].https://doi.org/10.13287/j.1001-9332.201609.017 URL 摘要
小时步长的BEPSHourly模型可以模拟植被日内生态生理过程,但模型的结构及解算过程复杂耗时,常适用于站点尺度进行参数优化及总初级生产力(GPP)、净初级生产力(NPP)的日内变化分析;日步长的BEPSDaily模型解算日光合速率方法简单,不涉及众多的迭代过程,模型耗时较少,适用于模拟计算区域初级生产力及分析区域碳源/汇空间分布。本研究根据BEPSDaily及BEPSHourly各自的模型特点及适用性,提出了小时步长及日步长BEPS模型的协同应用研究方法。首先利用BEPSHourly模型在站点尺度进行主要光合作用参数——最大羧化速率(Vc max)、最大电子传递速率(Jmax)的优化,将优化后主要光合作用参数引入区域BEPSDaily模型进行参数修正,再基于优化修正后的区域BEPSDaily模型进行区域NPP估测。结果表明:基于通量数据对光合作用主要参数进行优化可以提高模型的模拟能力;2011年,帽儿山地区不同森林类型的初级生产能力依次为阔叶林〉针阔混交林〉针叶林;本研究提出的不同步长尺度碳循环模型协同应用研究方法能够有效地进行主要光合作用参数的优化,模拟GPP、NPP的月平均日内变化,快速估测区域NPP并分析碳源/汇空间分布。
|
| [18] |
b. 基于东北温带落叶阔叶林通量数据的BEPS模型参数优化 [J].https://doi.org/10.13287/j.1001-9332.201605.001 URL 摘要
控制其他参数为经验常数,利用迭代方法对主要光合作用参数最大羧化速率(V_(c max))及最大电子传递速率(J_(max))进行不同数值组合,将得到的多组模拟结果的逐日总初级生产力(GPP)分别与东北帽儿山落叶阔叶林的通量观测数据进行比较,实现对小时步长BEPSHourly模型V_(c max)和J_(max)的参数优化.结果表明:对于东北温带落叶阔叶林,当V_(c max)为41.1μmol·m^(-2)·s^(-1)、J_(max)为82.8μmol·m^(-2)·s^(-1)时,模拟的2011年逐日GPP与观测数据比较的均方根误差(RMSE)最小,为1.10 g C·m^(-2)·d^(-1),R^2最高,为0.95.经过光合作用参数V_(c max)和J_(max)优化后,BEPSHourly模型能更好地模拟GPP的季节变化.
b. Parameter optimization of BEPS model based on the flux data of the temperate deciduous broad-leaved forest in Northeast China [J].https://doi.org/10.13287/j.1001-9332.201605.001 URL 摘要
控制其他参数为经验常数,利用迭代方法对主要光合作用参数最大羧化速率(V_(c max))及最大电子传递速率(J_(max))进行不同数值组合,将得到的多组模拟结果的逐日总初级生产力(GPP)分别与东北帽儿山落叶阔叶林的通量观测数据进行比较,实现对小时步长BEPSHourly模型V_(c max)和J_(max)的参数优化.结果表明:对于东北温带落叶阔叶林,当V_(c max)为41.1μmol·m^(-2)·s^(-1)、J_(max)为82.8μmol·m^(-2)·s^(-1)时,模拟的2011年逐日GPP与观测数据比较的均方根误差(RMSE)最小,为1.10 g C·m^(-2)·d^(-1),R^2最高,为0.95.经过光合作用参数V_(c max)和J_(max)优化后,BEPSHourly模型能更好地模拟GPP的季节变化.
|
| [19] |
基于MODIS-OLI遥感数据融合技术的农田生产力估算 [J].Agricultural productivity estimation with MODIS-OLI fusion data [J]. |
| [20] |
农业遥感研究现状与展望 [J].https://doi.org/10.6041/j.issn.1000-1298.2015.02.037 URL [本文引用: 1] 摘要
遥感技术具有覆盖面积大、重访周期短、获取成本相对低等优势,对大面积露天农业生产的调查、评价、监测和管理具有独特的作用。从20世纪70年代出现民用资源卫星后,农业成为遥感技术最先投入应用和收益显著的领域。特别是随着高空间、高光谱和高时间分辨率遥感数据的出现,农业遥感技术在长时间序列作物长势动态监测、农作物种类细分、田间精细农业信息获取等关键技术方面得到了突破。但是农业生产的分散性、时空变异性等特点,对当前农业遥感技术的应用还存在诸多挑战。本文简要回顾了农业遥感发展历程以及其应用的理论基础;再从农作物估产、农业资源调查、农业灾害监测和精准农业管理4个领域阐述了国内外相关研究和应用情况。最后提出农业遥感应加强与地面农业观测网技术的结合,推动新一代低空无人机遥感平台的发展,强化多源传感器融合以及农业过程模型与遥感数据同化的研究。
Status and prospect of agricultural remote sensing [J].https://doi.org/10.6041/j.issn.1000-1298.2015.02.037 URL [本文引用: 1] 摘要
遥感技术具有覆盖面积大、重访周期短、获取成本相对低等优势,对大面积露天农业生产的调查、评价、监测和管理具有独特的作用。从20世纪70年代出现民用资源卫星后,农业成为遥感技术最先投入应用和收益显著的领域。特别是随着高空间、高光谱和高时间分辨率遥感数据的出现,农业遥感技术在长时间序列作物长势动态监测、农作物种类细分、田间精细农业信息获取等关键技术方面得到了突破。但是农业生产的分散性、时空变异性等特点,对当前农业遥感技术的应用还存在诸多挑战。本文简要回顾了农业遥感发展历程以及其应用的理论基础;再从农作物估产、农业资源调查、农业灾害监测和精准农业管理4个领域阐述了国内外相关研究和应用情况。最后提出农业遥感应加强与地面农业观测网技术的结合,推动新一代低空无人机遥感平台的发展,强化多源传感器融合以及农业过程模型与遥感数据同化的研究。
|
| [21] |
基于SEBAL模型的农作物NPP反演 [J].Crop NPP inversion using surface energy balance algorithm for land model [J]. |
| [22] |
基于MODIS的南方草地NPP遥感估算与应用 [J].https://doi.org/10.11686/cyxb20130502 URL 摘要
草地NPP遥感模型的构建是实现大面积草地NPP估算的有效途径之一。以MODIS-NDVI数据为基础,以南方草山草坡为研究对象,结合野外实测数据,分析了草地NPP与NDVI之间的关系,同时构建了以NDVI为自变量以及水热条件为调节因子的南方草地NPP遥感估算模型,并通过不同年份独立的实测数据对模型进行了验证。结果表明,南方草地NPP与NDVI之间存在5种相关类型,均达到了极显著水平。NPP的模拟值和实测值之间具有很好的相关性和一致性,5种草地类型R2分别为0.902 2,0.826 6,0.871 2,0.887 7和0.875 5,均达到了极显著水平,均方根误差(RMSE)和相对均方根差(RRMSE)均较小。表明模型的模拟结果比较可靠,为南方草地NPP估算及草地资源管理提供了一种有效的方法。
Remote sensing estimation and application of grassland NPP based on MODIS data in southern China [J].https://doi.org/10.11686/cyxb20130502 URL 摘要
草地NPP遥感模型的构建是实现大面积草地NPP估算的有效途径之一。以MODIS-NDVI数据为基础,以南方草山草坡为研究对象,结合野外实测数据,分析了草地NPP与NDVI之间的关系,同时构建了以NDVI为自变量以及水热条件为调节因子的南方草地NPP遥感估算模型,并通过不同年份独立的实测数据对模型进行了验证。结果表明,南方草地NPP与NDVI之间存在5种相关类型,均达到了极显著水平。NPP的模拟值和实测值之间具有很好的相关性和一致性,5种草地类型R2分别为0.902 2,0.826 6,0.871 2,0.887 7和0.875 5,均达到了极显著水平,均方根误差(RMSE)和相对均方根差(RRMSE)均较小。表明模型的模拟结果比较可靠,为南方草地NPP估算及草地资源管理提供了一种有效的方法。
|
| [23] |
基于MODIS的中国草地NPP综合估算模型 [J].https://doi.org/10.5846/stxb201305030909 URL [本文引用: 2] 摘要
草地生态系统是陆地生态系统分布最广的生态系统类型之一,其碳储量的估算在全球变化中的作用越来越受到重 视.为了快速、便捷地实现中国草地净初级生产力(NPP)的估算,在获取野外调查资料与同期遥感影像数据的基础上,利用归一化植被指数(NDVI)以及气 候数据,构建了草地NPP综合估算模型.模型包括叶面积指数(LAI)和光合累积量(PA)两个子模型,其中LAI子模型利用了遥感数据NDVI,PA子 模型利用了温度、降水和辐射等气候数据.通过建模以外独立的实测数据的验证,模拟值与实测值之间有很好的相关性,R2为0.8519,相关性达到极显著水 平.RMSE和RRMSE均较小,表明模型的模拟结果比较可靠.同时模拟值与实测值之间的平均相对误差仅为1.97%,模拟结果的准确度较高,因此利用上 述模型估算中国草地NPP是可行的.以上结果为中国草地NPP估算提供了新的方法.
Comprehensive estimation model of grassland NPP based on MODIS in China [J].https://doi.org/10.5846/stxb201305030909 URL [本文引用: 2] 摘要
草地生态系统是陆地生态系统分布最广的生态系统类型之一,其碳储量的估算在全球变化中的作用越来越受到重 视.为了快速、便捷地实现中国草地净初级生产力(NPP)的估算,在获取野外调查资料与同期遥感影像数据的基础上,利用归一化植被指数(NDVI)以及气 候数据,构建了草地NPP综合估算模型.模型包括叶面积指数(LAI)和光合累积量(PA)两个子模型,其中LAI子模型利用了遥感数据NDVI,PA子 模型利用了温度、降水和辐射等气候数据.通过建模以外独立的实测数据的验证,模拟值与实测值之间有很好的相关性,R2为0.8519,相关性达到极显著水 平.RMSE和RRMSE均较小,表明模型的模拟结果比较可靠.同时模拟值与实测值之间的平均相对误差仅为1.97%,模拟结果的准确度较高,因此利用上 述模型估算中国草地NPP是可行的.以上结果为中国草地NPP估算提供了新的方法.
|
| [24] |
陆地生态系统碳循环研究进展 [J].Progress in the studies on carbon cycle in terrestrial ecosystem [J]. |
| [25] |
基于遥感—过程耦合模型的1988-2004年青海三江源区净初级生产力模拟 [J].https://doi.org/10.3773/j.issn.1005-264x.2009.02.003 URL [本文引用: 2] 摘要
三江源区不仅是地处青藏高原的全球气候变化的敏感区,也是我国甚至亚洲最重要河流的上游关键源区。作为提供物质基础的植被净初级生产力(Net primary production,NPP),是评价生态系统状况的重要指标。该文应用已在碳通量观测塔验证,扩展到区域水平的遥感-过程耦合模型GLOPEM-CEVSA,以空间插值的气象数据和1km分辨率的AVHRR遥感反演的FPAR数据为模型主要输入,模拟并分析了1988~2004年该区NPP时空格局及其控制机制。结果表明,该区植被平均NPP为143.17gC·m–2·a–1,呈自东南向西北逐渐降低的空间格局,其中,以森林NPP最高(267.90gC·m–2·a–1),其次为农田(222.94gC·m–2·a–1)、草地(160.90gC·m–2·a–1)和湿地(161.36gC·m–2·a–1),荒漠最低(36.13gC·m–2·a–1)。其年际变化趋势在空间上呈现出明显的差异,西部地区NPP表现为增加趋势,每10a增加7.8~28.8gC·m–2;而中、东部表现为降低趋势,每10a降低13.1~42.8gC·m–2。根据显著性检验,NPP呈增加趋势(趋势斜率b0),显著性水平高于99%和95%的区域占研究区总面积的13.43%和20.34%,主要分布在西部地区;NPP呈降低趋势(趋势斜率b0),显著性水平高于99%和95%的区域占研究区面积的0.75%和3.77%,主要分布在中、东部地区,尤以该区长江和黄河等沿线区分布更为集中,变化显著性也更高。三江源NPP的年际变化趋势的气候驱动力分析表明,整个区域水平上该地区植被生产力受气候变化的主导,西部地区暖湿化趋势,造成了该地区生产力较为明显的、大范围的增加趋势;但东、中部地区则主要受人类活动的影响,特别是长江、黄河等河流沿线,是人类居住活动密集的地区,造成这些地区放牧压力较大、草地退化严重,而该地区暖干化趋势加剧了这一过程。
Spatial-temporal patterns of net primary productivity for 1988-2004 based on GLOPEM-CEVSA model in the "Three-River Headwaters" region of Qinghai Province, China [J].https://doi.org/10.3773/j.issn.1005-264x.2009.02.003 URL [本文引用: 2] 摘要
三江源区不仅是地处青藏高原的全球气候变化的敏感区,也是我国甚至亚洲最重要河流的上游关键源区。作为提供物质基础的植被净初级生产力(Net primary production,NPP),是评价生态系统状况的重要指标。该文应用已在碳通量观测塔验证,扩展到区域水平的遥感-过程耦合模型GLOPEM-CEVSA,以空间插值的气象数据和1km分辨率的AVHRR遥感反演的FPAR数据为模型主要输入,模拟并分析了1988~2004年该区NPP时空格局及其控制机制。结果表明,该区植被平均NPP为143.17gC·m–2·a–1,呈自东南向西北逐渐降低的空间格局,其中,以森林NPP最高(267.90gC·m–2·a–1),其次为农田(222.94gC·m–2·a–1)、草地(160.90gC·m–2·a–1)和湿地(161.36gC·m–2·a–1),荒漠最低(36.13gC·m–2·a–1)。其年际变化趋势在空间上呈现出明显的差异,西部地区NPP表现为增加趋势,每10a增加7.8~28.8gC·m–2;而中、东部表现为降低趋势,每10a降低13.1~42.8gC·m–2。根据显著性检验,NPP呈增加趋势(趋势斜率b0),显著性水平高于99%和95%的区域占研究区总面积的13.43%和20.34%,主要分布在西部地区;NPP呈降低趋势(趋势斜率b0),显著性水平高于99%和95%的区域占研究区面积的0.75%和3.77%,主要分布在中、东部地区,尤以该区长江和黄河等沿线区分布更为集中,变化显著性也更高。三江源NPP的年际变化趋势的气候驱动力分析表明,整个区域水平上该地区植被生产力受气候变化的主导,西部地区暖湿化趋势,造成了该地区生产力较为明显的、大范围的增加趋势;但东、中部地区则主要受人类活动的影响,特别是长江、黄河等河流沿线,是人类居住活动密集的地区,造成这些地区放牧压力较大、草地退化严重,而该地区暖干化趋势加剧了这一过程。
|
| [26] |
空间分辨率对总初级生产力模拟结果差异的影响 [J].https://doi.org/10.11821/dlyj201604002 URL [本文引用: 1] 摘要
利用模型分析气候变化对陆地生态系统功能的影响,是当前全球变化生态学的研究热点,然而模型模拟不确定性来源之一就是空间异质性的问题。空间异质性是尺度的函数,基于气象和遥感数据驱动的生态系统过程模型(BEPS模型),分别模拟2003-2005年中国生态系统通量观测与研究网络(China FLUX)长白山站、千烟洲站、海北站及当雄站在1 km和8 km空间分辨率下的总初级生产力(GPP)的时间动态变化,并结合土地覆盖类型及叶面积指数(LAI)的差异,探讨两种空间分辨率输入数据对GPP模拟结果的影响。结果表明:1差异性主要是由于8 km范围内混合像元导致LAI的不同,4个站点月均差异值分别为0.85、1.60、0.13及0.04;2两种空间分辨率均能较好地反映各站点GPP的季节动态变化,与GPP观测值的相关性R2为0.79~0.97(1 km)、0.69~0.97(8 km),月均差异值为11.46~29.65 g C/m2/month(1 km)、11.87~24.81g C/m2/month(8 km);3 4个通量站点在两种空间分辨率下的GPP月均差异值分别为14.43,12.05,4.79,3.22 g C/m2/month,不同空间分辨率的模拟结果在森林站的差异大于草地站,且生长季的差异大于非生长季。因此,模型在模拟大尺度、长时间序列GPP时,为了提高模型模拟效率,适度降低空间分辨率是可行的,但应尽量减小低空间分辨率对于森林生态系统以及生长季GPP模拟上的误差。
An analysis of the gross primary productivity simulation difference resulting from the spatial resolution [J].https://doi.org/10.11821/dlyj201604002 URL [本文引用: 1] 摘要
利用模型分析气候变化对陆地生态系统功能的影响,是当前全球变化生态学的研究热点,然而模型模拟不确定性来源之一就是空间异质性的问题。空间异质性是尺度的函数,基于气象和遥感数据驱动的生态系统过程模型(BEPS模型),分别模拟2003-2005年中国生态系统通量观测与研究网络(China FLUX)长白山站、千烟洲站、海北站及当雄站在1 km和8 km空间分辨率下的总初级生产力(GPP)的时间动态变化,并结合土地覆盖类型及叶面积指数(LAI)的差异,探讨两种空间分辨率输入数据对GPP模拟结果的影响。结果表明:1差异性主要是由于8 km范围内混合像元导致LAI的不同,4个站点月均差异值分别为0.85、1.60、0.13及0.04;2两种空间分辨率均能较好地反映各站点GPP的季节动态变化,与GPP观测值的相关性R2为0.79~0.97(1 km)、0.69~0.97(8 km),月均差异值为11.46~29.65 g C/m2/month(1 km)、11.87~24.81g C/m2/month(8 km);3 4个通量站点在两种空间分辨率下的GPP月均差异值分别为14.43,12.05,4.79,3.22 g C/m2/month,不同空间分辨率的模拟结果在森林站的差异大于草地站,且生长季的差异大于非生长季。因此,模型在模拟大尺度、长时间序列GPP时,为了提高模型模拟效率,适度降低空间分辨率是可行的,但应尽量减小低空间分辨率对于森林生态系统以及生长季GPP模拟上的误差。
|
| [27] |
BEPS模型在华北平原冬小麦估产中的应用 [J].https://doi.org/10.3969/j.issn.1002-6819.2009.10.027 URL [本文引用: 1] 摘要
粮食是一切生产和生活的根本,准确地估计冬小麦的产量,对国家制定粮食政策至关重要。该文利用北部生态系统生产力模拟(BEPS,boreal ecosystem productivity simulator)模型能够模拟森林植被净第一性生产力的特点,分析了BEPS模型在冬小麦估产中的适用性和局限性。针对冬小麦和森林植被冠层的不同生长特点,假设冬小麦冠层具有水平均一、垂直分层的结构,利用辐射传输方程,将原BEPS模型中的两片大叶模型改造为多层-两片大叶模型;同时,利用前人提出的收获指数(HI,harvest index)的概念,将冬小麦的净第一性生产力转化为经济产量,从而实现利用遥感机理模型对冬小麦产量的估算。将改进后的模型用于华北平原冬小麦估产中,并利用国家级农业气象站点的实测产量资料对模拟结果进行验证,复相关系数达到0.817,说明改进后的BEPS模型可以用于华北平原冬小麦的估产研究。
Application of BEPS model in estimating winter wheat yield in North China Plain [J].https://doi.org/10.3969/j.issn.1002-6819.2009.10.027 URL [本文引用: 1] 摘要
粮食是一切生产和生活的根本,准确地估计冬小麦的产量,对国家制定粮食政策至关重要。该文利用北部生态系统生产力模拟(BEPS,boreal ecosystem productivity simulator)模型能够模拟森林植被净第一性生产力的特点,分析了BEPS模型在冬小麦估产中的适用性和局限性。针对冬小麦和森林植被冠层的不同生长特点,假设冬小麦冠层具有水平均一、垂直分层的结构,利用辐射传输方程,将原BEPS模型中的两片大叶模型改造为多层-两片大叶模型;同时,利用前人提出的收获指数(HI,harvest index)的概念,将冬小麦的净第一性生产力转化为经济产量,从而实现利用遥感机理模型对冬小麦产量的估算。将改进后的模型用于华北平原冬小麦估产中,并利用国家级农业气象站点的实测产量资料对模拟结果进行验证,复相关系数达到0.817,说明改进后的BEPS模型可以用于华北平原冬小麦的估产研究。
|
| [28] |
2000~2005年三江平原土地利用/覆被变化对植被净初级生产力的影响研究 [J].Effects of land use/cover change on net primary productivity of Sanjiang Plain, during 2000-2005 [J]. |
| [29] |
青海省草地资源净初级生产力遥感监测 [J].Net primary productivity of grassland resources monitoring based on remote sensing data in Qinghai Province [J]. |
| [30] |
用NOAA气象卫星的AVHRR遥感资料估算中国的净第一性生产力 [J].Estimating the net primary productivity in China using meteorological satellite data [J]. |
| [31] |
应用生态学报 ,Characteristics of terrestrial ecosystem primary productivity in East Asia based on remote sensing and process-based model [J]. |
| [32] |
基于3S的自然植被光能利用率的时空分布特征的模拟 [J].https://doi.org/10.17521/cjpe.2003.0049 URL 摘要
光能利用率(LUE)直接影响植被各层中的能量分布和光合速率,在确定环境对光合和地上部生长分配的综合限制上十分有价值,是衡量系统功能的一个重要指标。本研究以遥感图像(TM)作为数据源,获取了影响植被LUE的重要变量———叶面积指数(LAI);用程序语言编写了描述系统碳循环和水循环的景观尺度生态系统生产力过程模型(EPPML),对长白山自然保护区的太阳总辐射、净初级生产力(NPP)和LUE等的季节动态和空间分布进行了模拟;并用地理信息系统(GIS)手段对空间数据进行处理、分析和显示,从而实现了将植物生理生态研
Simulation of temporal and spatial distribution of natural vegetation light utilization efficiency based on 3S [J].https://doi.org/10.17521/cjpe.2003.0049 URL 摘要
光能利用率(LUE)直接影响植被各层中的能量分布和光合速率,在确定环境对光合和地上部生长分配的综合限制上十分有价值,是衡量系统功能的一个重要指标。本研究以遥感图像(TM)作为数据源,获取了影响植被LUE的重要变量———叶面积指数(LAI);用程序语言编写了描述系统碳循环和水循环的景观尺度生态系统生产力过程模型(EPPML),对长白山自然保护区的太阳总辐射、净初级生产力(NPP)和LUE等的季节动态和空间分布进行了模拟;并用地理信息系统(GIS)手段对空间数据进行处理、分析和显示,从而实现了将植物生理生态研
|
| [33] |
2009-2011年我国西南地区旱灾程度及其对植被净初级生产力的影响 [J].https://doi.org/10.5846/stxb201304040604 URL [本文引用: 1] 摘要
2009--2011年,我国西南地区遭受了极端干旱气候影响。利用1980—2011年气象站点观测数据和基于光能利用率的植被净初级生产力估算模型GloPEM,研究了2009--2011年西南地区干旱灾害过程和程度及其对植被净初级生产力的影响,结果显示:2009--2011年西南地区年均降水量和湿润指数明显低于1980--2008年均值。受干旱气候影响,研究区植被净初级生产力比2001--2011年均值低12.55gCm^-2a^-1,总计低0.017PgC/a,造成的碳损失约占我国总碳汇的7.91%。2001—2011年西南地区植被净初级生产力与蒸散量变化显著相关(R^2=0.44,P〈0.05),而降水量和湿润指数变化过程与植被净初级生产力和蒸散量不同步,可能是由于该地区森林覆盖率较高,具有较强的涵养水源功能,导致土壤湿度变化滞后于降水量和湿润指数变化,从而使降水量变化过程与植被净初级生产力变化不同步。
Drought in Southwestern China and its impact on the net primary productivity of vegetation from 2009-2011 [J].https://doi.org/10.5846/stxb201304040604 URL [本文引用: 1] 摘要
2009--2011年,我国西南地区遭受了极端干旱气候影响。利用1980—2011年气象站点观测数据和基于光能利用率的植被净初级生产力估算模型GloPEM,研究了2009--2011年西南地区干旱灾害过程和程度及其对植被净初级生产力的影响,结果显示:2009--2011年西南地区年均降水量和湿润指数明显低于1980--2008年均值。受干旱气候影响,研究区植被净初级生产力比2001--2011年均值低12.55gCm^-2a^-1,总计低0.017PgC/a,造成的碳损失约占我国总碳汇的7.91%。2001—2011年西南地区植被净初级生产力与蒸散量变化显著相关(R^2=0.44,P〈0.05),而降水量和湿润指数变化过程与植被净初级生产力和蒸散量不同步,可能是由于该地区森林覆盖率较高,具有较强的涵养水源功能,导致土壤湿度变化滞后于降水量和湿润指数变化,从而使降水量变化过程与植被净初级生产力变化不同步。
|
| [34] |
基于NDVI的中国天然森林植被净第一性生产力模型 [J].https://doi.org/10.1007/s11769-000-0028-3 URL [本文引用: 1] 摘要
根据叶面积指数、归一化植被指数(NDVI)建立了中国森林植被净第一性生产力(NPP)模型:NPP=-0.6394-67.064ln(1-NDVI)经我国13组森林植被生产力数据的验证表明,该模型的预测结果与实测值相符较好。通过与Chikuo模型和综合模型(周广胜等,1996)预测结果的比较,该模型在总体上优于Chikugo模型和综合模型。表明基于NDVI的净第一生产力模型对我国森林植被有良好的适应
A forest vegetation NPP model based on NDVI [J].https://doi.org/10.1007/s11769-000-0028-3 URL [本文引用: 1] 摘要
根据叶面积指数、归一化植被指数(NDVI)建立了中国森林植被净第一性生产力(NPP)模型:NPP=-0.6394-67.064ln(1-NDVI)经我国13组森林植被生产力数据的验证表明,该模型的预测结果与实测值相符较好。通过与Chikuo模型和综合模型(周广胜等,1996)预测结果的比较,该模型在总体上优于Chikugo模型和综合模型。表明基于NDVI的净第一生产力模型对我国森林植被有良好的适应
|
| [35] |
青藏高原主要生态系统净初级生产力的估算 [J].https://doi.org/10.3321/j.issn:0375-5444.2004.01.009 URL [本文引用: 2] 摘要
利用青藏高原贡嘎山、海北、五道梁、拉萨等4个野外台站2000~2002年的观测数据、陆地生态系统模型与2001年MODIS遥感数据相结合的方法来估算青藏高原区域的净初级生产力。结果表明:青藏高原区域的净初级生产力空间分布趋势表现出由东南向西北逐渐递减的梯度,该趋势也与水热梯度表现基本一致;整个青藏高原的净初级生产力为302.44×10¹² gC yr-1,其中森林的净初级生产力最高,120.11×1012 gC yr-1,占整个高原净初级生产力的39.7%;全年中夏季(6~8月) 的净初级生产力最高,246.7×1012 gC yr-1,约占全年总净初级生产力的80%。用实测数据验证模拟结果表明,二者非常相符。
Estimation of net primary productivity in Tibetan Plateau [J].https://doi.org/10.3321/j.issn:0375-5444.2004.01.009 URL [本文引用: 2] 摘要
利用青藏高原贡嘎山、海北、五道梁、拉萨等4个野外台站2000~2002年的观测数据、陆地生态系统模型与2001年MODIS遥感数据相结合的方法来估算青藏高原区域的净初级生产力。结果表明:青藏高原区域的净初级生产力空间分布趋势表现出由东南向西北逐渐递减的梯度,该趋势也与水热梯度表现基本一致;整个青藏高原的净初级生产力为302.44×10¹² gC yr-1,其中森林的净初级生产力最高,120.11×1012 gC yr-1,占整个高原净初级生产力的39.7%;全年中夏季(6~8月) 的净初级生产力最高,246.7×1012 gC yr-1,约占全年总净初级生产力的80%。用实测数据验证模拟结果表明,二者非常相符。
|
| [36] |
基于遥感的上海崇明东滩湿地典型植被净初级生产力估算 [J].
Wetlands are rich in biological diversity and high productivity of the ecosystem,they play an important role in ecosystem carbon cycle.Wetland vegetation net primary productivity(NPP)is an important indicator of the health of wetland ecosystems.In this paper,combined with field surveys,laboratory measurement and remote sensing technology,the three kinds of typical wetland vegetation——〖WTBX〗Spartina alterniflora,Phragmites australis〖WT〗 and 〖WTBX〗Scirpus mariqueter〖WT〗 NPP were studied in Shanghai Chongming Dongtan.Firstly,selected three kinds of typical wetland vegetation type,the biological characteristics parameters of the vegetation was surveyed,including fresh weight of vegetation,height,density,coverage and leaf area index(LAI),etc..The regression model between NPP and LAI was set up in the sample of different vegetation type.Secondly,using SPOT5 images,after geometric correction and radiometric calibration,the image was classified by objectoriented,and modified adjust soil vegetation index(MSAVI)was calculated,which can reflect the elimination of soil and vegetation characteristics of the background factors.Then estimation LAI model was set up with SPOT5 MSAVI.Finally,according the NPP regression model and LAI estimation model,different wetland vegetation NPP model was set up at regional scale in Chongming Dongtan.It provides a good method and theoretical base for typical wetland vegetation structure and function.
Estimation of typical wetland vegetation NPP in Shanghai Chongming Dongtan based on remote sensing [J].
Wetlands are rich in biological diversity and high productivity of the ecosystem,they play an important role in ecosystem carbon cycle.Wetland vegetation net primary productivity(NPP)is an important indicator of the health of wetland ecosystems.In this paper,combined with field surveys,laboratory measurement and remote sensing technology,the three kinds of typical wetland vegetation——〖WTBX〗Spartina alterniflora,Phragmites australis〖WT〗 and 〖WTBX〗Scirpus mariqueter〖WT〗 NPP were studied in Shanghai Chongming Dongtan.Firstly,selected three kinds of typical wetland vegetation type,the biological characteristics parameters of the vegetation was surveyed,including fresh weight of vegetation,height,density,coverage and leaf area index(LAI),etc..The regression model between NPP and LAI was set up in the sample of different vegetation type.Secondly,using SPOT5 images,after geometric correction and radiometric calibration,the image was classified by objectoriented,and modified adjust soil vegetation index(MSAVI)was calculated,which can reflect the elimination of soil and vegetation characteristics of the background factors.Then estimation LAI model was set up with SPOT5 MSAVI.Finally,according the NPP regression model and LAI estimation model,different wetland vegetation NPP model was set up at regional scale in Chongming Dongtan.It provides a good method and theoretical base for typical wetland vegetation structure and function.
|
| [37] |
Estimating above-ground net primary productivity of the tallgrass prairie ecosystem of the Central Great Plains using AVHRR NDVI [J].https://doi.org/10.1080/01431161.2012.757376 URL [本文引用: 1] 摘要
Abstract Aboveground Net Primary Productivity (ANPP) is indicative of an ecosystem's ability to capture solar energy and store it in the form of carbon (or biomass). Annual and interannual ecosystem variation in ANPP is often linked to climatic dynamics and anthropogenic influences. The Great Plains grasslands occupy over 1.5 million km2 and are a primary resource for livestock production in North America. The tallgrass prairies are the most productive of the grasslands of the region and the Flint Hills of North America represent the largest contiguous area of unplowed tallgrass prairie (1.6 million ha) (Knapp and Seastead, 1998). Measurements of ANPP are of critical importance to the proper management and understanding of climatic and anthropogenic influences on tallgrass prairie, yet accurate, detailed, and systematic measurements of ANPP over large geographic regions of this system do not exist. For these reasons, this study was conducted to investigate the use of the Normalized Difference Vegetation Index (NDVI) to model ANPP for the tallgrass prairie. Many studies have established a positive relationship between the NDVI and ANPP, but the strength of this relationship is influenced by vegetation types and can significantly vary from year-to-year depending on land use and climatic conditions. The goal of this study is to develop a robust model using the Advanced Very High Resolution Radiometer (AVHRR) biweekly NDVI values to predict tallgrass ANPP. This study was conducted using the Konza Prairie Biological Station as the primary study area with data also from the Rannells Flint Hills Prairie Preserve and other sites near Manhattan, Kansas. The dominant study period was 1989 to 2005. The optimal period for estimating ANPP using AVHRR NDVI composite datasets is prairie 30 (late July). The Tallgrass ANPP Model (TAM) explained 53% (r2 = 0.53, r = 0.73) of the year-to-year variation. Efforts to validate the TAM results were frustrated by considerable variations among existing remote sensing based ANPP model estimates and in situ clipplot measurements of peak season tallgrass production. These findings support the conclusion that ecosystem specific ANPP models are needed to improve global scale ANPP estimates. The creation of 1 km x 1 km resolution ANPP maps for a four county (~7,000 ha) for years 1989 - 2007 showed considerable variation in annual and interannual ANPP spatial patterns suggesting complex interactions among factors influencing ANPP spatially and temporally. The observed patterns on these maps would be lost using the much coarser resolution ground weather recording stations.
|
| [38] |
Estimating crop net primary production using national inventory data and MODIS-derived parameters [J].https://doi.org/10.1016/j.isprsjprs.2013.03.005 URL [本文引用: 2] 摘要
National estimates of spatially-resolved cropland net primary production (NPP) are needed for diagnostic and prognostic modeling of carbon sources, sinks, and net carbon flux between land and atmosphere. Cropland NPP estimates that correspond with existing cropland cover maps are needed to drive biogeochemical models at the local scale as well as national and continental scales. Existing satellite-based NPP products tend to underestimate NPP on croplands. An Agricultural Inventory-based Light Use Efficiency (AgI-LUE) framework was developed to estimate individual crop biophysical parameters for use in estimating crop-specific NPP over large multi-state regions. The method is documented here and evaluated for corn (Zea mays L.) and soybean (Glycine max L. Merr.) in Iowa and Illinois in 2006 and 2007. The method includes a crop-specific Enhanced Vegetation Index (EVI), shortwave radiation data estimated using the Mountain Climate Simulator (MTCLIM) algorithm, and crop-specific LUE per county. The combined aforementioned variables were used to generate spatially-resolved, crop-specific NPP that corresponds to the Cropland Data Layer (CDL) land cover product. Results from the modeling framework captured the spatial NPP gradient across croplands of Iowa and Illinois, and also represented the difference in NPP between years 2006 and 2007. Average corn and soybean NPP from AgI-LUE was 917gCm612yr611 and 409gCm612yr611, respectively. This was 2.4 and 1.1 times higher, respectively, for corn and soybean compared to the MOD17A3 NPP product. Site comparisons with flux tower data show AgI-LUE NPP in close agreement with tower-derived NPP, lower than inventory-based NPP, and higher than MOD17A3 NPP. The combination of new inputs and improved datasets enabled the development of spatially explicit and reliable NPP estimates for individual crops over large regional extents.
|
| [39] |
Modeling net primary productivity of terrestrial ecosystems in the semi-arid climate of the Mongolian Plateau using LSWI-based CASA ecosystem model [J].https://doi.org/10.1016/j.jag.2015.12.001 URL [本文引用: 1] 摘要
Since the estimate of moisture stress coefficients (MSC) in the current Carnegie-Ames-Stanford-Approach (CASA) model still requires considerable inputs from ground meteorological data and many soil parameters, here we present a modified CASA model by introducing the land-surface water index (LSWI) and scaled precipitation to model the vegetation net primary productivity (NPP) in the arid and semiarid climate of the Mongolian Plateau. The field-observed NPP data and a previously proposed model (the Yu-CASA model) were used to evaluate the performance of our LSWI-based CASA model. The results show that the NPP predicted by both the LSWI-based CASA model and the Yu-CASA model showed good agreement with the observed NPP in the grassland ecosystems in the study area, with coefficients of determination of 0.717 and 0.714, respectively. The LSWI-based CASA model also performed comparably with the Yu-CASA model at both biome and per-pixel scales when keeping other inputs unchanged, with a difference of approximately 16gC in the growing-season total NPP and an average value of 2.3gC bias for each month. This indicates that, unlike an earlier method that estimated MSCs based entirely on climatic variables or a soil moisture model, the method proposed here simplifies the model structure, reduces the need for ground measurements, and can provide results comparable with those from earlier models. The LSWI-based CASA model is potentially an alternative method for modelling NPP for a wide range of vegetation types in the Mongolian Plateau.
|
| [40] |
Spatial and temporal patterns of herbaceous primary production in semi-arid shrublands: A remote sensing approach [J].https://doi.org/10.1111/jvs.12398 URL [本文引用: 2] 摘要
Questions Can herbaceous above-ground net primary production (ANPP) be estimated from remote sensing when woody and herbaceous plants are intermingled? How does herbaceous ANPP change in space and time in an ecosystem dominated by woody species? What are the main controls of herbaceous ANPP to paddock scale? Location Native plant communities and buffelgrass roller chopped pastures of the Arid Chaco, western Argentina (28–32°02S, 64–67°02W; area: 1000200002km2). Methods We decomposed normalized difference vegetation index (NDVI) data from MODIS (pixel size: 25002m02×0225002m) into woody ( W ) and herbaceous ( H ) components. We calibrated the relationship between field estimates of herbaceous ANPP and the H component of NDVI using linear regression. The regression model fitted was applied to a 10-yr MODIS database for four paddocks to estimate herbaceous ANPP. We analysed the relationship between herbaceous ANPP and watering point distance and growing season precipitation. Results <p>The annual integral of NDVI02×02proportion of the herbaceous component [ H /( H + W )] explained 71% and 91% of herbaceous ANPP variation in native plant communities and buffelgrass roller chopped pastures, respectively. The regression model fitted, however, differed (P02 Conclusion Our model was able to estimate herbaceous ANPP from the decomposition of an NDVI time series that included woody components. Thus, the model provides the basis for more accurate monitoring of spatial and temporal variability of herbaceous ANPP in areas where herbaceous and woody plant components co-exist. Applying our models, we detected clear spatial and temporal patterns of herbaceous ANPP. The possibility of describing in a spatially explicit way the past 1402yrs of herbaceous ANPP allows designing livestock management strategies and devise alternatives to control degradation processes in the Arid Chaco.
|
| [41] |
Forest NPP estimation based on MODIS data under cloudless condition [J].https://doi.org/10.1007/s11430-008-0013-8 URL 摘要
Based on light-use efficiency model, an MODIS-derived daily net primary production (NPP) model was developed. In this model, a new model for the fraction of photosynthetically active radiation absorbed by vegetation (FPAR) is developed based on leaf area index (LAI) and albedo parameters, and a photosynthetically active radiation (PAR) is calculated from the combination of Bird鈥檚 model with aerosol optical thickness and water vapor derived from cloud free MODIS images. These two models are integrated into our predicted NPP model, whose most parameters are retrieved from MODIS data. In order to validate our NPP model, the observed NPP in the Qianyanzhou station and the Changbai Mountains station are used to compare with our predicted NPP, showing that they are in good agreement. The NASA NPP products also have been downloaded and compared with the measurements, which shows that the NASA NPP products underestimated NPP in the Qianyanzhou station but overestimated in the Changbai Mountains station in 2004.
|
| [42] |
Quantification of terrestrial ecosystem carbon dynamics in the conterminous United States combining a process-based biogeochemical model and MODIS and AmeriFlux data [J].https://doi.org/10.5194/bgd-8-2721-2011 URL [本文引用: 2] 摘要
Satellite remote sensing provides continuous temporal and spatial information of terrestrial ecosystems. Using these remote sensing data and eddy flux measurements and biogeochemical models, such as the Terrestrial Ecosystem Model (TEM), should provide a more adequate quantification of carbon dynamics of terrestrial ecosystems. Here we use Moderate Resolution Imaging Spectroradiometer (MODIS) Enhanced Vegetation Index (EVI), Land Surface Water Index (LSWI) and carbon flux data of AmeriFlux to conduct such a study. We first modify the Gross Primary Production (GPP) modeling in TEM by incorporating EVI and LSWI to account for the effects of the changes of canopy photosynthetic capacity, phenology and water stress. Second, we parameterize and verify the new version of TEM with eddy flux data. We then apply the model to the conterminous United States over the period 2000–2005 at a 0.05amp;deg;amp;times;0.05amp;deg; spatial resolution. We find that the new version of TEM generally captured the expected temporal and spatial patterns of regional carbon dynamics. We estimate that regional GPP is between 7.02 and 7.78 Pg C yrlt;supgt;611lt;/supgt; and Net Primary Production (NPP) ranges from 3.81 to 4.38 Pg C yrlt;supgt;611lt;/supgt; and Net Ecosystem Production (NEP) varies within 0.08–0.73 Pg C yrlt;supgt;611lt;/supgt; over the period 2000–2005 for the conterminous United States. The uncertainty due to parameterization is 0.34, 0.65 and 0.18 Pg C yrlt;supgt;611lt;/supgt; for the regional estimates of GPP, NPP and NEP, respectively. The effects of extreme climate and disturbances such as severe drought in 2002 and destructive Hurricane Katrina in 2005 were captured by the model. Our study provides a new independent and more adequate measure of carbon fluxes for the conterminous United States, which will benefit studies of carbon-climate feedback and facilitate policy-making of carbon management and climate.
|
| [43] |
Using LiDAR and quickbird data to model plant production and quantify uncertainties associated with wetland detection and land cover generalizations [J].https://doi.org/10.1016/j.rse.2009.06.017 URL [本文引用: 1] 摘要
Spatiotemporal data from satellite remote sensing and surface meteorology networks have made it possible to continuously monitor global plant production, and to identify global trends associated with land cover/use and climate change. Gross primary production (GPP) and net primary production (NPP) are routinely derived from the Moderate Resolution Imaging Spectroradiometer (MODIS) onboard satellites Terra and Aqua, and estimates generally agree with independent measurements at validation sites across the globe. However, the accuracy of GPP and NPP estimates in some regions may be limited by the quality of model input variables and heterogeneity at fine spatial scales. We developed new methods for deriving model inputs (i.e., land cover, leaf area, and photosynthetically active radiation absorbed by plant canopies) from airborne laser altimetry (LiDAR) and Quickbird multispectral data at resolutions ranging from about 30聽m to 1聽km. In addition, LiDAR-derived biomass was used as a means for computing carbon-use efficiency. Spatial variables were used with temporal data from ground-based monitoring stations to compute a six-year GPP and NPP time series for a 3600聽ha study site in the Great Lakes region of North America. Model results compared favorably with independent observations from a 400聽m flux tower and a process-based ecosystem model (BIOME-BGC), but only after removing vapor pressure deficit as a constraint on photosynthesis from the MODIS global algorithm. Fine-resolution inputs captured more of the spatial variability, but estimates were similar to coarse-resolution data when integrated across the entire landscape. Failure to account for wetlands had little impact on landscape-scale estimates, because vegetation structure, composition, and conversion efficiencies were similar to upland plant communities. Plant productivity estimates were noticeably improved using LiDAR-derived variables, while uncertainties associated with land cover generalizations and wetlands in this largely forested landscape were considered less important.
|
| [44] |
Far-red sun-induced chlorophyll fluorescence shows ecosystem-specific relationships to gross primary production: An assessment based on observational and modeling approaches [J].https://doi.org/10.1016/j.rse.2015.06.004 URL [本文引用: 1] 摘要
Sun-induced chlorophyll fluorescence ( SIF ) is a radiation flux emitted from chlorophyll molecules and is considered an indicator of the actual functional state of plant photosynthesis. The remote measurement of SIF opens a new perspective to assess actual photosynthesis at larger, ecologically relevant scales and provides an alternative approach to study the terrestrial carbon cycle. Recent studies demonstrated the reliability of measured SIF signals and showed significant relationships between SIF and gross primary production ( GPP ) at ecosystem and global scales. Despite these encouraging results, understanding the complex mechanisms between SIF and GPP remains challenging before SIF can be finally utilized to constrain estimates of GPP . In this study, we present a comprehensive assessment of the relationship between far-red SIF retrieved at 76002nm ( SIF 760 ) and GPP , and its transferability across three structurally and physiologically contrasting ecosystems: perennial grassland, cropland and mixed temperate forest. We use multi-temporal imaging spectroscopy (IS) data acquired with the Airborne Prism EXperiment (APEX) sensor as well as eddy covariance (EC) flux tower data to evaluate the relationship between SIF 760 and GPP EC . We use simulations performed with the coupled photosynthesis–fluorescence model SCOPE to prove trends obtained from our observational data and to assess apparent confounding factors such as physiological and structural interferences or temporal scaling effects. Observed relationships between SIF 760 and GPP EC were asymptotic and ecosystem-specific, i.e., perennial grassland ( R 2 02=020.59, rRMSE02=0227.1%), cropland ( R 2 02=020.88, rRMSE02=023.5%) and mixed temperate forest ( R 2 02=020.48, rRMSE02=0215.88%). We demonstrate that asymptotic leaf level relationships between SIF 760 and GPP EC became more linear at canopy level and scaled with temporal aggregation. We conclude that remote sensing of SIF provides a new observational approach to decrease uncertainties in estimating GPP across ecosystems but requires dedicated strategies to compensate for the various confounding factors impacting SIF – GPP relationships. Our findings help in bridging the gap between mechanistic understanding at leaf level and ecosystem-specific observations of the relationships between SIF and GPP .
|
| [45] |
Comparison of four EVI-based models for estimating gross primary production of maize and soybean croplands and tallgrass prairie under severe drought [J].https://doi.org/10.1016/j.rse.2015.02.022 URL [本文引用: 1] 摘要
61LSWI showed a greater sensitivity to drought than did EVI or NDVI.61All four EVI-based GPP models performed reasonably well in non-drought years.61VPM performed better than the VI, TG and GR models during drought years.61LSWI-based water stress scalar contributes to higher sensitivity of VPM in droughts.
|
| [46] |
A ground spectral model for estimating biomass at the peak of the growing season in Hulunbeier grassland, Inner Mongolia, China [J].https://doi.org/10.1080/01431161.2011.639401 URL [本文引用: 3] 摘要
To investigate the application of hyperspectral remote sensing to estimate grassland biomass at the peak of the growing season, hyperspectral data were measured with an analytical spectral device (ASD) Fieldspec3 spectroradiometer, and harvested aboveground net primary productivity (ANPP) was recorded simultaneously in Hulunbeier grassland, Inner Mongolia, China. Ground spectral models were developed to estimate ANPP from the normalized difference vegetation index (NDVI) measured in the field following the same method as that of the National Aeronautic and Space Administration (NASA) Moderate Resolution Imaging Spectroradiometer (MODIS-NDVI). Regression analysis was used to assess the relationship between ANPP and NDVI. Based on coefficients of determination (R 2) and error analysis, we determined that each vegetation type and the entire study area had unique optimal regression models. A linear equation best fit the arid steppe data, an exponential equation was best suited to wetland vegetation and power equations were optimal for meadow steppe and sand vegetation. After considering all factors, an exponential model between ANPP and NDVI (ANPP = 20.1921e3.2154(NDVI); standard error (SE) = 62.50 g m鈥2, R 2 = 0.7445, p < 0.001) was selected for the entire Hulunbeier grassland study area. Ground spectral models could become the foundation for yield estimation over large areas of Hulunbeier grassland.
|
| [47] |
Estimating terrestrial vegetation primary productivity using satellite SAR data [
|
| [48] |
10. The analysis of net primary productivity in China based on GEOLUE model [
|
| [49] |
Plant community composition and net primary production within a native eastern north Dakota Prairie [J].https://doi.org/10.2307/2423431 URL [本文引用: 1] 摘要
The community composition and net primary production were studied for six community types within a native tallgrass prairie in eastern North Dakota. Estimates of green herbage production and litter weight were made using the harvest method. Six community types were examined: 1) Poa-Andropogon-Stipa on upland ridges with very low soil salinity and good internal drainage, 2) Bromus-Poa communities on small mounds having low soil salinity and good internal drainage, 3) Poa-Melilotus communities on a previously plowed low ridge, with somewhat saline soil with good internal drainage, 4) Distichlis-Hordeum-Poa on lowland sites with moderate soil salinity and poor drainage, 5) Distichlis-Hordeum communities on lowland soils with still higher soil salinity and poorer drainage, and 6) Salicornia-Suaeda communities on lowland sites with poorest drainage, highest soil salinity, and highest soil moisture. Floristically, the first type was the richest (46 species) and the last the poorest (only 4 species). Maximum observed green herbage weight within the six community types ranged from 109 to 353 grams/square meter; the first, second, and fourth community types being significantly higher than the others. Lowest green herbage weight was recorded in the Salicornia-Suaeda communities. Litter weight within the unburned communities was highly uniform and ranged from 368 to 473 grams.
|
| [50] |
Estimation of net primary productivity by integrating remote sensing data with an ecosystem model [J].https://doi.org/10.1016/j.rse.2004.10.004 URL 摘要
This paper describes a method for integrating leaf area index (LAI) derived from remote sensing data with an ecosystem model for accurate estimation of net primary productivity (NPP). The ecosystem model used in this study was Sim-CYCLE, with which LAI retrieved from the data acquired by MODIS sensor (MODIS-LAI) was integrated. Global annual NPP was estimated as 59.6 Gt C year 611 by MOD-Sim-CYCLE (Sim-CYCLE after integration of MODIS-LAI), whereas it was 62.7 Gt C year 611 in case of Sim-CYCLE for the year 2001. Both models predicted highest NPP around the equator with another smaller peak occurring around 60°N. These two regions represented the tropical and boreal forests biomes, respectively. The NPP estimated by MOD-Sim-CYCLE exceeded the NPP estimated by Sim-CYCLE in these two regions. Other than the tropical and boreal forests biomes, NPP values estimated by the MOD-Sim-CYCLE were typically lower than Sim-CYCLE across the latitudes. Validations of results in Australia and USA showed that MOD-Sim-CYCLE estimated NPP more accurately than Sim-CYCLE. Our results demonstrate the utility of combining satellite-observation with an ecosystem process model to achieve improved accuracy in estimates and monitoring global net primary productivity.
|
| [51] |
Development of a two-leaf light use efficiency model for improving the calculation of terrestrial gross primary productivity [J].https://doi.org/10.1016/j.agrformet.2013.01.003 URL [本文引用: 2] 摘要
Gross primary productivity (GPP) is a key component of land鈥揳tmospheric carbon exchange. Reliable calculation of regional/global GPP is crucial for understanding the response of terrestrial ecosystems to climate change and human activity. In recent years, many light use efficiency (LUE) models driven by remote sensing data have been developed for calculating GPP at various spatial and temporal scales. However, some studies show that GPP calculated by LUE models was biased by different degrees depending on sky clearness conditions. In this study, a two-leaf light use efficiency (TL-LUE) model is developed based on the MOD17 algorithm to improve the calculation of GPP. This TL-LUE model separates the canopy into sunlit and shaded leaf groups and calculates GPP separately for them with different maximum light use efficiencies. Different algorithms are developed to calculate the absorbed photosynthetically active radiation for these two groups. GPP measured at 6 typical ecosystems in China was used to calibrate and validate the model. The results show that with the calibration using tower measurements of GPP, the MOD17 algorithm was able to capture the variations of measured GPP in different seasons and sites. But it tends to understate and overestimate GPP under the conditions of low and high sky clearness, respectively. The new TL-LUE model outperforms the MOD17 algorithm in reproducing measured GPP at daily and 8-day scales, especially at forest sites. The calibrated LUE of shaded leaves is 2.5鈥3.8 times larger than that of sunlit leaves. The newly developed TL-LUE model shows lower sensitivity to sky conditions than the MOD17 algorithm. This study demonstrates the potential of the TL-LUE model in improving GPP calculation due to proper description of differences in the LUE of sunlit and shaded leaves and in the transfer of direct and diffuse light beams within the canopy.
|
| [52] |
Grassland productivity simulation: Integrating remote sensing and an ecosystem process model [M] |
| [53] |
Leaf chlorophyll constraint on model simulated gross primary productivity in agricultural systems [J].https://doi.org/10.1016/j.jag.2015.03.016 URL [本文引用: 1] 摘要
The benefit of using in-situ measured and satellite retrieved Chl l for constraining model simulations of Gross Primary Productivity (GPP) is evaluated over fields in central Nebraska, U.S.A between 2001 and 2005. Landsat-based Chl l time-series records derived from the Regularized Canopy Reflectance model (REGFLEC) are used as forcing to the CLM. Validation of simulated GPP against 15 site-years of flux tower observations demonstrate the utility of Chl l as a model constraint, with the coefficient of efficiency increasing from 0.91 to 0.94 and from 0.87 to 0.91 for maize and soybean, respectively. Model performances particularly improve during the late reproductive and senescence stage, where the largest temporal variations in Chl l (averaging 35–5502μg02cm 612 for maize and 20–3502μg02cm 612 for soybean) are observed. While prolonged periods of vegetation stress did not occur over the studied fields, given the usefulness of Chl l as an indicator of plant health, enhanced GPP predictabilities should be expected in fields exposed to longer periods of moisture and nutrient stress. While the results support the use of Chl l as an observational proxy for V max 25 mathContainer Loading Mathjax , future work needs to be directed towards improving the Chl l retrieval accuracy from space observations and developing consistent and physically realistic modeling schemes that can be parameterized with acceptable accuracy over spatial and temporal domains.
|
| [54] |
Patterns and controls of above-ground net primary production in meadows of Patagonia: A remote sensing approach [J].https://doi.org/10.1111/j.1654-1103.2011.01326.x URL [本文引用: 1] 摘要
Questions:(1) Can above-ground net primary production (ANPP) of Patagonian meadows be estimated from remote sensing? (2) How does ANPP of Patagonian meadows change in space and time?Location:Northwestern Patagonia, meadows embedded in a steppe matrix (39–43°S, 70–7202W; area: 85 000 km2).Methods:For the first question, we contrasted field ANPP measurements with MODIS high-spatial resolution (pixel size: 0.0625 km2) data and developed a model that estimates radiation use efficiency. For the second question, we applied the model to a 6-year MODIS record for 14 meadows whose physiognomic heterogeneity was known from previous work.Results:Up to 77% of the field-based ANPP variation was accounted for by the absorbed photosynthetic radiation, based on a linear transformation of the normalized difference vegetation index derived from MODIS data. Mean radiation use efficiency was 0.54 g dry matter MJ611. ANPP ranged between 610 and 1060 g m612 year611, which represents three to 5.3 times the ANPP of the surrounding arid and semi-arid steppes. The inter-annual coefficient of variation of ANPP was 10%, which is higher than other systems of similar productivity, but much lower than the surrounding steppes (33%). At the level of management units (paddock), ANPP spatial variations were mainly related to the proportion of Prairies, a proxy for low topographic position in the landscape, and longitude, a proxy for precipitation. ANPP inter-annual variation was most related to latitude, a proxy for temperature.Conclusion:The model developed and tested can be used to infer ANPP from remote sensing data at a spatial resolution that allows one to detect variability within meadows and management units. Variations at both the physiognomic unit and paddock level were associated with geographic patterns and topography. Meadows were three to five times more productive and less fluctuating than nearby steppes. When compared with other ecosystems, their productivity was high, but more variable inter-annually, likely due to exceptionally high variability of precipitation in Patagonia.
|
| [55] |
Parameterization of a diagnostic carbon cycle model for continental scale application [J].https://doi.org/10.1016/j.rse.2011.02.024 URL 摘要
Diagnostic carbon cycle models depend on parameterization to establish model sensitivity to climate variables and site factors. Here we acquired meteorological and carbon flux data from a diverse set (N聽=聽18) of eddy covariance (EC) flux towers, along with MODIS data on FPAR (the fraction of incident photosynthetically active radiation that is absorbed by the plant canopy) at the sites, and used the data to develop a parameter set for the application of a diagnostic carbon cycle model over North America. The parameter optimization approach relied on goodness of fit between model simulations and tower estimates of gross primary production and net ecosystem production (NEP). Parameters such as light use efficiency (LUE) and base rate of heterotrophic respiration varied widely between sites representing different plant functional types (PFTs), thus supporting the value of stratification by PFT when parameterizing the model. Where multiple EC sites were available within a PFT, overall prediction error and bias in mean NEP was reduced by cross-site optimization as opposed to reliance on a single site. Optimization with the MODIS Enhanced Vegetation Index (EVI) instead of MODIS FPAR resulted in a similar goodness of fit, however, LUE values were pushed to levels that were not physiologically realistic when using EVI. The increasing availability of gap-filled EC tower data is rapidly improving the opportunities for direct coupling of satellite and ground observational data for parameterizing of diagnostic carbon flux models.
|
| [56] |
Reduction of global plant production due to droughts from 2001 to 2010: An analysis with a process-based global terrestrial ecosystem model [J].https://doi.org/10.1175/EI-D-14-0030.1 URL [本文引用: 2] 摘要
Droughts dramatically affect plant production of global terrestrial ecosystems. To date, quantification of this impact remains a challenge due to complex plant physiological and biochemical processes associated with drought. Here, we incorporate a drought index into an existing process-based terrestrial ecosystem model to estimate the drought impact on global plant production for the period 2001-2010. Global Moderate Resolution Imaging Spectroradiometer (MODIS) Gross Primary Production (GPP) data products are used to constrain model parameters and verify the model algorithms. The verified model is then applied to evaluate the drought impact. The study indicates that droughts will reduce GPP by 9.8 g C mmonthduring the study period. On average, drought reduces GPP by 10% globally. As a result, the global GPP decreased from 106.4 to 95.9 Pg C yrwhile the global Net Primary Production (NPP) decreased from 54.9 to 49.9 Pg C yr. This study revises the estimation of the global NPP and suggests that the future quantification of global carbon budget of terrestrial ecosystems should take the drought impact into account.
|
| [57] |
Primary productivity of the biosphere [M]. |
| [58] |
Relating the global vegetation index to net primary productivity and actual evapotranspiration over Africa [J].https://doi.org/10.1080/01431169308953984 URL [本文引用: 1] 摘要
Abstract Nel Primary Productivity (NPP) and Actual Evapotranspiration (AET) are key processes characterizing the vegetation activity. At a continental scale, Annual Net Primary Productivity (ANPP) and annual AET are related to the integrated Normalized Difference Vegetation Index (NDVI). When applied to the African continent, the ANPP/ZNDVI relation gives an estimation of the productivity with a precision comparable to those given by climate models. The estimation of annual AET is possible within climatic zones defined here by their Rain-Use Efficiencies (RUE). On the other hand, on a monthly basis, the AET/ SNDVI relations are less clear and are strongly dependent on the physiognomy of the vegetation community considered. These results show the limits of using ENDVI for estimating the elementary processes of terrestrial vegetation at a continental scale.
|
| [59] |
Spatiotemporal dynamics of grassland aboveground net primary productivity and its association with climatic pattern and changes in Northern China [J].https://doi.org/10.1016/j.ecolind.2014.01.020 URL [本文引用: 1] 摘要
Various vegetation indices and environmental parameters derived from remote sensing were used to investigate the spatiotemporal dynamics of grassland aboveground net primary productivity (ANPP) in Northern China from 2000 to 2011. An integrated model for grassland ANPP estimation was proposed based on 209 field observations and the corresponding MODIS reflectance products. Five samples for each of five grassland types were extracted randomly to validate the remote sensing model. The model was then used to derive the spatial and temporal patterns of ANPP for the five grassland types. Additionally, the correlations of ANPP to land surface temperature (LST) and land surface water index (LSWI) were analyzed to explore the response of ANPP to changes in hydrothermal conditions. Results show that different vegetation indices have different sensitivities to diverse grassland types. A notable gradient of ANPP in grasslands from west to east is obvious, and a slight increase in annual ANPP for each type of grassland during 2000鈥2011 is observed. The spatial pattern of ANPP in grasslands is found to correlate with the gradients of LST and LSWI. The temporal correlation of ANPP in grasslands is significantly negative to LST, but positive to LSWI. For alpine steppe and desert steppe, the ANPP is most sensitive to the change of LST; for desert steppe, the ANPP has the highest sensitivity to the change of LSWI. With this improved understanding of the spatiotemporal dynamics of ANPP as well as the effects of climate change, an efficient and sustainable use of China's grasslands could be possible.
|
| [60] |
Using remote sensing and process-based growth modeling to predict forest productivity across Western Oregon [D].
|
| [61] |
Solar radiation and productivity in tropical ecosystems [J].https://doi.org/10.2307/2401901 URL [本文引用: 1] 摘要
CiteSeerX - Scientific documents that cite the following paper: Solar-radiation and productivity in tropical ecosystems
|
| [62] |
Climate and the efficiency of crop production in Britain [and discussion] [J]. |
| [63] |
ANPP estimates from NDVI for the central grassland region of the United States [J]. |
| [64] |
The possible combined effects of land-use changes and climate conditions on the spatial-temporal patterns of primary production in a natural protected area [J].https://doi.org/10.1016/j.ecolind.2013.01.025 URL 摘要
Multifunctional landscapes are characterized by various functions and values that sustain directly or indirectly the quality of human life, through the provision of natural capital flow. Primary production (PP), representing a measure of the solar energy captured by the system and available to drive its functioning, is recognized as a fundamental supporting service. Several biophysical modification and conversion altering the primary production are due to land-use change. Natural protected areas with a sustainable management of land-use could be able to guarantee the persistence of structure and processes (primary production) fundamental for the provision of natural capital. In this context, the aims of this paper are to investigate the spatial–temporal patterns of PP variability (1986–2010) in the Natural Protected Area of “Torre Guaceto” (southern Italy), taking into account land-cover change and climate conditions and looking at PP as a supporting service able to guarantee natural capital flow. In dealing with this issue, this paper aims at testing whether NDVI (Normalized Difference Vegetation Index) integrated with NDII (Normalized Difference Infrared Index) can be suitable surrogates for the assessment of shifts in the spatial–temporal dynamics of PP, useful to explore possible feedbacks related to conservation management choices in supporting natural capital flow. Therefore, the assessment of the complex spatial–temporal dynamics of natural vegetation has been performed by using NDVI and NDII. The results showed that after the establishment of the Natural Protected Area of “Torre Guaceto” in 2000, there has been an increase of NDVI that could represent an increase of PP. However, since PP depends also on water content, measured by NDII, a Pearson correlation analysis between NDII and land Surface Temperature (TS) has been carried out, demonstrating that low level of PP in 2005 was not imputable to climate conditions but to the worse quality of vegetation associated to the wetland due to aging phenomenon. In conclusion, to make the conservation management more effective it is not enough to identify and quantify the major landscape transformations and the underlying causes, but rather to detect the capability of new landscape patterns, in terms of configuration and composition, to sustain ecosystem services. The analysis of conservation management based on NDVI and NDII, used as surrogate to detect the maintenance of PP, appears to be very promising in order to develop better strategies for the adaptive management of natural protected areas.
|
| [65] |
A multiscale analysis of ecosystem services supply in the NW Iberian Peninsula from a functional perspective [J].https://doi.org/10.1016/j.ecolind.2014.10.027 URL [本文引用: 1] 摘要
In recent years, the assessment of ecosystem services (ES) supply has been based on the use of Land Use/Land Cover (LULC) data as proxies for spatial representation of ecosystems. Nevertheless, some shortcomings of this method, such as uncertainties derived from generalization of the ecosystem types and assumptions of invariance across spatial scales, indicate the need for new approaches. Such approaches could be aimed at improving knowledge of the relationships between ecosystem services and landscape structure and the spatial characteristics of ES patterns. In this study, we propose an integrative approach that involves the generation and analysis of continuous maps representing the supply of five ES potentially related to the amount of biomass. Five remote sensing images of the Northwestern Iberian Peninsula, obtained with Landsat-5 TM, were used to generate a proxy for net primary production by combining the normalized difference vegetation index (NDVI) of each image to calculate a 危NDVI index that could act as a potential indicator of some ecosystem services. This information was combined with three variables 鈥 terrain slope, population density and occurrence of protected areas 鈥 to produce spatial models for the five ES and eventually a series of five supply maps. Food, materials and energy provision services showed a clustered pattern, with high supply values in flat zones and areas with high population densities. In contrast, mass flow and climate regulation services were more widely distributed throughout the study area. The five ecosystem service patterns were analyzed at different scales by two methods: lacunarity and four term local quadrat variance (4TLQV) analysis. These methods revealed differences in the spatial pattern: lacunarity analysis was useful for detection of scale thresholds at the local level, whereas 4TLQV was more sensitive to scale thresholds at larger spatial levels. Thus, the variance analysis yielded higher values for larger windows sizes, particularly for provisioning services. The results demonstrated the suitability of the proposed approach for the spatially explicit modeling of ecosystem services, avoiding the uncertainty of other assessments such as those based on LULC data, and for the exploratory analysis of ES supply from a spatial point of view.
|
| [66] |
TURC: A diagnostic model of continental gross primary productivity and net primary productivity [J].https://doi.org/10.1029/96GB00349 URL 摘要
TURC, a diagnostic model for the estimation of continental gross primary productivity (GPP) and net primary productivity (NPP), is presented. This model uses a remotely sensed vegetation index to estimate the fraction of solar radiation absorbed by canopies, and an original parameterization of the relationship between absorbed solar radiation and GPP, based on measurements of CO
|
| [67] |
Methodology for the estimation of terrestrial net primary production from remotely sensed data [J]. |
| [68] |
Simulating terrestrial carbon fluxes using the new biosphere model "biosphere model integrating eco-physiological and mechanistic approaches using satellite data" (BEAMS) [J].https://doi.org/10.1029/2005JG000045 URL 摘要
[1] 聽In this study we present a new biosphere model called the Biosphere model integrating Eco-physiological And Mechanistic approaches using Satellite data (BEAMS). BEAMS provides a new method of calculating the environmental stress affecting plant growth (Stress). Stress is calculated eco-physiologically using a photosynthesis model and stomatal conductance formulation, providing a more realistic result than previous models. Stress values are used to estimate Gross Primary Production (GPP) estimates via the light use efficiency concept. We used BEAMS, including our new Stress approach, to investigate global spatial and temporal patterns of net primary production (NPP) and net ecosystem production (NEP). BEAMS was run for the years 1982鈥2000 using global scale satellite and climate data. Comparison of model results with observational measurements at flux sites reveals that GPP values predicted by BEAMS agree with measured GPP. Obtained Stress values were compared with those of MOD17 and CASA; the three methods produce contrasting spatial patterns. Upon comparing predicted and observed NPP, the pattern of NPP for each plant functional type can be adequately estimated. In terms of trend analysis, NPP increased for the years 1982鈥2000 in most regions. Different NPP trends were observed in Europe, Russia, and northeast Canada than those proposed by Nemani et al. (2003); we attribute these differences to climate-related processes. Simulated interannual variations in global NEP are similar to results from inverse modeling. A sensitivity study of obtained NEP shows that the interannual variability in NEP is strongly controlled by air temperature, precipitation, CO2, and the fraction of absorbed photosynthetically active radiation.
|
| [69] |
A revised land surface parameterization (SiB2) for atmospheric GCMS. Part II: The generation of global fields of terrestrial biophysical parameters from satellite data [J].https://doi.org/10.1175/1520-0442(1996)0092.0.CO;2 URL 摘要
The global parameter fields used in the revised Simple Biosphere Model (SiB2) of Sellers et al. are reviewed. The most important innovation over the earlier SiB1 parameter set of Dorman and Sellers is the use of satellite data to specify the time-varying phonological properties of FPAR, leaf area index. and canopy greenness fraction. This was done by processing a monthly 1掳 by 1掳 normalized difference vegetation index (NDVI) dataset obtained farm Advanced Very High Resolution Radiometer red and near-infrared data. Corrections were applied to the source NDVI dataset to account for (i) obvious anomalies in the data time series, (ii) the effect of variations in solar zenith angle, (iii) data dropouts in cold regions where a temperature threshold procedure designed to screen for clouds also eliminated cold land surface points, and (iv) persistent cloud cover in the Tropics. An outline of the procedures for calculating the land surface parameters from the corrected NDVI dataset is given, and a brief description is provided of source material, mainly derived from in situ observations, that was used in addition to the NDVI data. The datasets summarized in this paper should he superior to prescriptions currently used in most land surface parameterizations in that the spatial and temporal dynamics of key land surface parameters, in particular those related to vegetation, are obtained directly from a consistent set of global-scale observations instead of being inferred from a variety of survey-based land-cover classifications.
|
| [70] |
Evaluation of MODIS gross primary productivity for Africa using eddy covariance data [J].https://doi.org/10.1016/j.rse.2012.12.023 URL [本文引用: 1] 摘要
MOD17A2 provides operational gross primary production (GPP) data globally at 1聽km spatial resolution and 8-day temporal resolution. MOD17A2 estimates GPP according to the light use efficiency (LUE) concept assuming a fixed maximum rate of carbon assimilation per unit photosynthetically active radiation absorbed by the vegetation (蔚 max ). Minimum temperature and vapor pressure deficit derived from meteorological data down-regulate 蔚 max and constrain carbon assimilation. This data is useful for regional to global studies of the terrestrial carbon budget, climate change and natural resources. In this study we evaluated the MOD17A2 product and its driver data by using in situ measurements of meteorology and eddy covariance GPP for 12 African sites. MOD17A2 agreed well with eddy covariance GPP for wet sites. Overall, seasonality was well captured but MOD17A2 GPP was underestimated for the dry sites located in the Sahel region. Replacing the meteorological driver data derived from coarse resolution reanalysis data with tower measurements reduced MOD17A2 GPP uncertainties, however, the underestimations at the dry sites persisted. Inferred 蔚 max calculated from tower data was higher than the 蔚 max prescribed in MOD17A2. This, in addition to uncertainties in fraction of absorbed photosynthetically active radiation (FAPAR) explains some of the underestimations. The results suggest that improved quality of driver data, but primarily a readjustment of the parameters in the biome parameter look-up table (BPLUT) may be needed to better estimate GPP for African ecosystems in MOD17A2.
|
| [71] |
Relationships between photochemical reflectance index and light-use efficiency in deciduous and evergreen broadleaf forests [J].https://doi.org/10.1016/j.rse.2014.01.017 URL [本文引用: 1] 摘要
In this study, we evaluate the relationships between the photochemical reflectance index (PRI) and light-use efficiency (LUE) based on eight years of continuous in situ measurements acquired on a half-hourly basis for PRI, NDVI (Normalized Difference Vegetation Index), the main micrometeorological variables and net CO 2 exchange data in two deciduous and evergreen mature forests. More specifically, the objectives of this study include investigating the daily, seasonal, and interannual variations of PRI and LUE; linking PRI variations to the main influencing meteorological and eco-physiological variables; and evaluating the performance of PRI as a remote-sensing proxy of LUE under different environmental conditions. The data analysis was performed at different time scales within the season using moving temporal windows and between years. On a seasonal scale, statistical analyses revealed positive relationships between PRI and absorbed photosynthetically active radiation (aPAR) and negative relationships between PRI and LUE. Over shorter periods of a few days, the signs of these relationships remained unchanged; however, their correlations were strongly improved. The highest correlations were most often observed over periods characterized by clear or slightly overcast skies. However, all the periods of clear skies did not involve improvements in the relations of PRI vs. aPAR or PRI vs. LUE. Temporal variations of the intercept (called PRI 0 in this study) of PRI vs. aPAR regressions suggest the presence of a temporal trend that may reflect seasonal changes of the biochemical characteristics of the canopy. Regardless of the cause of this trend, it is important to note that once PRI 0 was subtracted from the measured PRI, the correlations between the corrected PRI and LUE for each year were significantly improved, and a stable multi-year model was obtained. Nevertheless, further studies are required to explain the temporal changes of PRI 0 during the season and to develop a more accurate disentangling approach that would make PRI-based remote-sensing of ecosystem light-use efficiency less sensitive to confounding factors related to spatial and temporal changes in the structural and biochemical properties of the canopy.
|
| [72] |
A two-leaf rectangular hyperbolic model for estimating GPP across vegetation types and climate conditions [J].https://doi.org/10.1002/2013JG002596 URL [本文引用: 1] 摘要
Abstract There are mainly three types of gross primary production (GPP), including light use efficiency (LUE) model, rectangular hyperbolic model (RHM), and process-based model (PBM). RHM is not widely used because its parameters, namely, quantum yield ( 伪 ) and maximum photosynthetic rate (Pm), vary temporally with temperature and spatially with vegetation type under natural conditions. In the study, we present a temperature- and vegetation-type-adapted RHM by linking it to the Baldocchi's model to obtain the relationship between 伪 -Pm and Vcmax,25-temperature to overcome the shortcomings of traditional RHM. The modified RHM (MRHM) coupled with a two-leaf upscaling strategy makes it possible to accurate and fast estimation of GPP at large scale. Twenty-two CO2 eddy-covariance sites with different vegetation types, including evergreen needleleaf forest, deciduous broadleaf forest, grassland, and evergreen broadleaf forest, are used to evaluate the performance of MRHM for GPP estimation. The comparisons of the simulated GPP using MRHM with measured and Boreal Ecosystem Productivity Simulator-simulated GPP demonstrate that the MRHM can simulate GPP as accurately as PBM and in the meantime with the advantage of simplicity as LUE model. These results show the promising potential of MRHM for accurately simulating GPP with relative high computational efficiency, providing an ideal alternative tool for large-scale and long time series GPP simulations.
|
| [73] |
Modelling carbon fluxes of different forests by coupling a remote-sensing model with an ecosystem process model [J].https://doi.org/10.1080/01431161.2010.512933 URL [本文引用: 1] 摘要
A new model (GLOPEM-CEVSA) to determine terrestrial carbon budgets was developed by coupling remote sensing with ecosystem process simulation, and was validated with reference to the carbon fluxes of three forests. MODIS FPAR (MOD15A2 product) was applied together with meteorological data on flux towers. The seasonal variances of modelled gross primary production and ecosystem respiration were significantly correlated with observed values (correlation coefficient, r > 0.9). The seasonal dynamics of the modelled net ecosystem production over the plant-growth season showed significant agreement with observed values with a r range of 0.64 to 0.87. This work demonstrates the potential of GLOPEM-CEVSA to quantify the spatial patterns and temporal dynamics of terrestrial ecosystem carbon sources and sinks with consideration of the spatial heterogeneity of ecosystems based on remote sensing.
|
| [74] |
Estimation of net primary productivity using a process-based model in Gansu Province, Northwest China [J].https://doi.org/10.1007/s12665-013-2462-4 URL Magsci 摘要
The ecological structure in the arid and semi-arid region of Northwest China with forest, grassland, agriculture, Gobi, and desert, is complex, vulnerable, and unstable. It is a challenging and sustaining job to keep the ecological structure and improve its ecological function. Net primary productivity (NPP) modeling can help to improve the understanding of the ecosystem, and therefore, improve ecological efficiency. The boreal ecosystem productivity simulator (BEPS) model provides the possibility of NPP modeling in terrestrial ecosystem, but it has some limitations for application in arid and semi-arid regions. In this paper, we improve the BEPS model, in terms of its water cycle by adding the processes of infiltration and surface runoff, to be applicable in arid and semi-arid regions. We model the NPP of forest, grass, and crop in Gansu Province as an experimental area in Northwest China in 2003 using the improved BEPS model, parameterized with moderate resolution remote sensing imageries and meteorological data. The modeled NPP using improved BEPS agrees better with the ground measurements in Qilian Mountain than that with original BEPS, with a higher R (2) of 0.746 and lower root mean square error (RMSE) of 46.53 gC m(-2) compared to R (2) of 0.662 and RMSE of 60.19 gC m(-2) from original BEPS. The modeled NPP of three vegetation types using improved BEPS shows evident differences compared to that using original BEPS, with the highest difference ratio of 9.21 % in forest and the lowest value of 4.29 % in crop. The difference ratios between different vegetation types lie on the dependence on natural water sources. The modeled NPP in five geographic zones using improved BEPS is higher than those with original BEPS, with higher difference ratio in dry zones and lower value in wet zones.
|
| [75] |
Estimation of net primary production of forest and shrub communities [J].https://doi.org/10.2307/1933283 URL [本文引用: 1] 摘要
The bonding in the molecule ion VO(H2O)(5)(2+) is described in terms of molecular orbitals. In particular, the most significant feature of the electronic structure of VO2+ seems to be the existence of considerable oxygen to vanadium pi-bonding. A molecular orbital energy level scheme is estimated which is able to account for both the "crystal field" and the "charge transfer" spectra of VO(H2O)(5)(2+) and related vanadyl complexes. The paramagnetic resonance g factors and the magnetic susceptibilities of vanadyl complexes are discussed.
|
| [76] |
Estimating net primary production of Turfgrass in an Urban-Suburban landscape with QuickBird imagery [J].https://doi.org/10.3390/rs4040849 URL 摘要
Vegetation is a basic component of urban-suburban environments with significant area coverage. As a major vegetation type in US cities, urban turfgrass provides a range of important ecological services. This study examined the biological carbon fixation of turfgrass in a typical residential neighborhood by linking ground-based measurements, high resolution satellite remote sensing, and ecological modeling. The spatial distribution of turfgrass and its vegetative conditions were mapped with QuickBird satellite imagery. The significant amount of shadows existing in the imagery were detected and removed by taking advantage of the high radiometric resolution of the data. A remote sensing-driven production efficiency model was developed and parameterized with field biophysical measurements to estimate annual net primary production of turfgrass. The results indicated that turfgrass accounted for 38% of land cover in the study area. Turfgrass assimilated 0–1,301 g67C67m61267yr611 depending on vegetative conditions and management intensity. The average annual net primary production per unit turfgrass cover by golf course grass (1,100.5 g67C67m612) was much higher than that by regular lawn grass (771.2 g67C67m612). However, lawn grass contributed more to the total net primary production than golf course grass due to its larger area coverage, although with higher spatial variability.
|
| [77] |
Performance of linear and nonlinear two-leaf light use efficiency models at different temporal scales [J].https://doi.org/10.3390/rs70302238 URL [本文引用: 1] 摘要
The reliable simulation of gross primary productivity (GPP) at various spatial and temporal scales is of significance to quantifying the net exchange of carbon between terrestrial ecosystems and the atmosphere. This study aimed to verify the ability of a nonlinear two-leaf model (TL-LUEn), a linear two-leaf model (TL-LUE), and a big-leaf light use efficiency model (MOD17) to simulate GPP at half-hourly, daily and 8-day scales using GPP derived from 58 eddy-covariance flux sites in Asia, Europe and North America as benchmarks. Model evaluation showed that the overall performance of TL-LUEn was slightly but not significantly better than TL-LUE at half-hourly and daily scale, while the overall performance of both TL-LUEn and TL-LUE were significantly better (p lt; 0.0001) than MOD17 at the two temporal scales. The improvement of TL-LUEn over TL-LUE was relatively small in comparison with the improvement of TL-LUE over MOD17. However, the differences between TL-LUEn and MOD17, and TL-LUE and MOD17 became less distinct at the 8-day scale. As for different vegetation types, TL-LUEn and TL-LUE performed better than MOD17 for all vegetation types except crops at the half-hourly scale. At the daily and 8-day scales, both TL-LUEn and TL-LUE outperformed MOD17 for forests. However, TL-LUEn had a mixed performance for the three non-forest types while TL-LUE outperformed MOD17 slightly for all these non-forest types at daily and 8-day scales. The better performance of TL-LUEn and TL-LUE for forests was mainly achieved by the correction of the underestimation/overestimation of GPP simulated by MOD17 under low/high solar radiation and sky clearness conditions. TL-LUEn is more applicable at individual sites at the half-hourly scale while TL-LUE could be regionally used at half-hourly, daily and 8-day scales. MOD17 is also an applicable option regionally at the 8-day scale.
|
| [78] |
Multi-scale evaluation of light use efficiency in MODIS gross primary productivity for croplands in the Midwestern United States [J].https://doi.org/10.1016/j.agrformet.2014.11.004 URL [本文引用: 1] 摘要
Satellite remote sensing provides continuous observations of land surfaces, thereby offering opportunities for large-scale monitoring of terrestrial productivity. Production Efficiency Models (PEMs) have been widely used in satellite-based studies to simulate carbon exchanges between the atmosphere and ecosystems. However, model parameterization of the maximum light use efficiency (εGPP*) varies considerably for croplands in agricultural studies at different scales. In this study, we evaluate cropland εGPP* in the MODIS Gross Primary Productivity (GPP) model (MOD17) using in situ measurements and inventory datasets across the Midwestern US. The site-scale calibration using 28 site-years tower measurements derives εGPP* values of 2.78±0.48gCMJ611 (±standard deviation) for corn and 1.64±0.23gCMJ611 for soybean. The calibrated models could account for approximately 60–80% of the variances of tower-based GPP. The regional-scale study using 4-year agricultural inventory data suggests comparable εGPP* values of 2.48±0.65gCMJ611 for corn and 1.18±0.29gCMJ611 for soybean. Annual GPP derived from inventory data (1848.4±298.1gCm612y611 for corn and 908.9±166.3gCm612y611 for soybean) are consistent with modeled GPP (1887.8±229.8gCm612y611 for corn and 849.1±122.2gCm612y611 for soybean). Our results are in line with recent studies and imply that cropland GPP is largely underestimated in the MODIS GPP products for the Midwestern US. Our findings indicate that model parameters (primarily εGPP*) should be carefully recalibrated for regional studies and field-derived εGPP* can be consistently applied to large-scale modeling as we did here for the Midwestern US.
|
| [79] |
Nutritional and developmental influences on components of rice crop light use efficiency [J].https://doi.org/10.1016/j.agrformet.2016.03.018 URL [本文引用: 1] 摘要
Light use efficiency (LUE) plays a vital role in determination of crop biomass and yield. Important components of LUE, i.e. canopy structure, nitrogen distribution, photosynthetic capacity and CO2diffusion conductance were investigated in paddy rice grown under low, normal and high supplemental nitrogen (0, 115, and 180kgNha鈭1). Photosynthetic characteristics varied linearly with leaf nitrogen content (Na), independent of treatment and canopy position, so differences in photosynthesis were due to differences in N allocation. CO2diffusion resistances were significant and constrained LUE (more during late season), but there were no differences between treatments. Early in the season (tillering stage) leaves in the fertilized treatments had higher photosynthetic rates due to higher leaf N content leading to larger amounts of rate-limiting photosynthetic proteins, which gave them an early head start and boost in productivity and leaf area index (LAI), bringing increases in canopy light interception. Later during the growth season, differences in leaf Naand photosynthetic characteristics between treatments were slight. Enhanced LAI in fertilized plots throughout the growing season was related to greater leaf number and leaf area per planted bundle and a larger leaf area in the upper canopy (LAUC). Fertilized treatments had a higher LAUC with high leaf nitrogen concentration and reduced mesophyll diffusion limitation but greater exposure to full sunlight that led to improved nitrogen use efficiency and efficient carbon gain. In conclusion, differences in carbon gain and biomass accumulation under differing N fertilization were associated primarily with resource allocation associated with canopy leaf area development rather than leaf morphological or physiological properties. The results provide new insights with respect to the multidimensional coordinated structural and physiological adjustments governing LUE over the course of rice crop development.
|
| [80] |
Improved global simulations of gross primary product based on a new definition of water stress factor and a separate treatment of C3 and C4 plants [J].https://doi.org/10.1016/j.ecolmodel.2014.11.002 URL [本文引用: 1] 摘要
Accurate simulation of terrestrial gross primary production (GPP), the largest global carbon flux, benefits our understanding of carbon cycle and its source of variation. This paper presents a novel light use efficiency-based GPP model called the terrestrial ecosystem carbon flux model (TEC) driven by MODIS FPAR and climate data coupled with a precipitation-driven evapotranspiration ( E ) model ( Yan et al., 2012 ). TEC incorporated a new water stress factor, defined as the ratio of actual E to Priestley and Taylor (1972) potential evaporation ( E PT ). A maximum light use efficiency ( 03 *) of 1.802gC02MJ 611 and 2.7602gC02MJ 611 was applied to C3 and C4 ecosystems, respectively. An evaluation at 18 eddy covariance flux towers representing various ecosystem types under various climates indicates that the TEC model predicted monthly average GPP for all sites with overall statistics of r 02=020.85, RMSE02=022.2002gC02m 612 02day 611 , and bias02=02610.0502gC02m 612 02day 611 . For comparison the MODIS GPP products (MOD17A2) had overall statistics of r 02=020.73, RMSE02=022.8202gC02m 612 02day 611 , and bias02=02610.3102gC02m 612 02day 611 for this same set of data. In this case, the TEC model performed better than MOD17A2 products, especially for C4 plants. We obtained an estimate of global mean annual GPP flux at 128.202±021.502Pg02C02yr 611 from monthly MODIS FPAR and European Centre for Medium-Range Weather Forecasts (ECMWF) ERA reanalysis data at a 1.0° spatial resolution over 11 year period from 2000 to 2010. This falls in the range of published land GPP estimates that consider the effect of C4 and C3 species. The TEC model with its new definition of water stress factor and its parameterization of C4 and C3 plants should help better understand the coupled climate-carbon cycle processes.
|
| [81] |
Risk and contributing factors of ecosystem shifts over naturally vegetated land under climate change in China [J].https://doi.org/10.1038/srep20905 URL PMID: 4751438 [本文引用: 1] 摘要
Abstract Identifying the areas at risk of ecosystem transformation and the main contributing factors to the risk is essential to assist ecological adaptation to climate change. We assessed the risk of ecosystem shifts in China using the projections of four global gridded vegetation models (GGVMs) and an aggregate metric. The results show that half of naturally vegetated land surface could be under moderate or severe risk at the end of the 21(st) century under the middle and high emission scenarios. The areas with high risk are the Tibetan Plateau region and an area extended northeastward from the Tibetan Plateau to northeast China. With the three major factors considered, the change in carbon stocks is the main contributing factor to the high risk of ecosystem shifts. The change in carbon fluxes is another important contributing factor under the high emission scenario. The change in water fluxes is a less dominant factor except for the Tibetan Plateau region under the high emission scenario. Although there is considerable uncertainty in the risk assessment, the geographic patterns of the risk are generally consistent across different scenarios. The results could help develop regional strategies for ecosystem conservation to cope with climate change.
|
| [82] |
The global impact factors of net primary production in different land cover types from 2005 to 2011 [J].https://doi.org/10.1186/s40064-016-2910-1 URL PMID: 4971002 [本文引用: 1] 摘要
With the seriously polluted environment due to social development, the sustainability of net primary production (NPP), which is used to feed most lives on the earth, has become one of the biggest concerns that we have to consider for the sake of food shortage. There have been many researches analyzing one or two potential impact factors of NPP based on field observation data, which brings about many uncertainties for further calculation. Moreover, the frequently used process-based models heavily depend on the understandings of researchers about the NPP process. The premises of such models hinder the impact factor analysis from being objective and confident. To overcome such shortages, we collected 27 potential impact factors of global NPP in terms of eight land cover types. The feature variables include atmosphere, biosphere, anthroposphere and lithosphere parameters, which can be obtained from public available remote sensed products. The experiment shows that latitude, irradiance ultraviolet and normalized difference vegetation index are dominant factors impacting global NPP. Anthropogenic activities, precipitation and surface emissivity are influencing NPP calculation largely. However, some commonly used biosphere parameters in process-based models are actually not playing that important roles in NPP estimation. This work provides a new insight in analyzing NPP impact factors, being more objective and comprehensive compared with frequently used process-based models.
|
| [83] |
Global comparison of light use efficiency models for simulating terrestrial vegetation gross primary production based on the LaThuile database [J].https://doi.org/10.1016/j.agrformet.2014.03.007 URL [本文引用: 1] 摘要
Simulating gross primary productivity (GPP) of terrestrial ecosystems has been a major challenge in quantifying the global carbon cycle. Many different light use efficiency (LUE) models have been developed recently, but our understanding of the relative merits of different models remains limited. Using CO 2 flux measurements from multiple eddy covariance sites, we here compared and assessed major algorithms and performance of seven LUE models (CASA, CFix, CFlux, EC-LUE, MODIS, VPM and VPRM). Comparison between simulated GPP and estimated GPP from flux measurements showed that model performance differed substantially among ecosystem types. In general, most models performed better in capturing the temporal changes and magnitude of GPP in deciduous broadleaf forests and mixed forests than in evergreen broadleaf forests and shrublands. Six of the seven LUE models significantly underestimated GPP during cloudy days because the impacts of diffuse radiation on light use efficiency were ignored in the models. CFlux and EC-LUE exhibited the lowest root mean square error among all models at 80% and 75% of the sites, respectively. Moreover, these two models showed better performance than others in simulating interannual variability of GPP. Two pairwise comparisons revealed that the seven models differed substantially in algorithms describing the environmental regulations, particularly water stress, on GPP. This analysis highlights the need to improve representation of the impacts of diffuse radiation and water stress in the LUE models.
|
| [84] |
Estimating crop yield using a satellite-based light use efficiency model [J].https://doi.org/10.1016/j.ecolind.2015.08.013 URL [本文引用: 3] 摘要
Satellite-based techniques that provide temporally and spatially continuous information over vegetated surfaces have become increasingly important in monitoring the global agriculture yield. In this study, we examine the performance of a light use efficiency model (EC-LUE) for simulating the gross primary production (GPP) and yield of crops. The EC-LUE model can explain on average approximately 90% of the variability in GPP for 36 FLUXNET sites globally. The results indicate that a universal set of parameters, independent of crop species (except for C4 crops), can be adopted in the EC-LUE model for simulating crops鈥 GPP. At both irrigated and rainfed sites, the EC-LUE model exhibits a similar level of performance. However, large errors are found when simulating yield based on crop harvest index. This analysis highlights the need to improve the representation of the harvest index and carbon allocation for improving crop yield estimations from satellite-based methods.
|
| [85] |
A process model for simulating net primary productivity (NPP) based on the interaction of water-heat process and nitrogen: A case study in Lantsang Valley [J].https://doi.org/10.1007/s11676-011-0132-5 URL Magsci [本文引用: 1] 摘要
Terrestrial carbon cycle and the global atmospheric CO<sub>2</sub> budget are important foci in global climate change research. Simulating net primary productivity (NPP) of terrestrial ecosystems is important for carbon cycle research. In this study, a plant-atmosphere-soil continuum nitrogen (N) cycling model was developed and incorporated into the Boreal Ecosystem Productivity Simulator (BEPS) model. With the established database (leaf area index, land cover, daily meteorology data, vegetation and soil) at a 1 km resolution, daily maps of NPP for Lantsang valley in 2007 were produced, and the spatial-temporal patterns of NPP and mechanisms of its responses to soil N level were further explored. The total NPP and mean NPP of Lantsang valley in 2007 were 66.5 Tg C and 416 g·m<sup>−2</sup>·a<sup>−1</sup> C, respectively. In addition, statistical analysis of NPP of different land cover types was conducted and investigated. Compared with BEPS model (without considering nitrogen effect), it was inferred that the plant carbon fixing for the upstream of Lantsang valley was also limited by soil available nitrogen besides temperature and precipitation. However, nitrogen has no evident limitation to NPP accumulation of broadleaf forest, which mainly distributed in the downstream of Lantsang valley.
|
| [86] |
Comparison of four light use efficiency models for estimating terrestrial gross primary production [J].https://doi.org/10.1016/j.ecolmodel.2015.01.001 URL [本文引用: 2] 摘要
Light use efficiency (LUE) models that with different structures (i.e., methods to address environmental stresses on LUE) have been widely used to estimate terrestrial gross primary production (GPP) because of their theoretical soundness and practical conveniences. However, a systematic validation of those models with field observations across diverse ecosystems is still lacking and whether the model can be further improved by structural optimization remains unclear. Using GPP estimates at global 51 eddy covariance flux towers that cover a wide climate range and diverse vegetation types, we evaluated the performances of the four major LUE models (i.e., Carnegie-Ames-Stanford approach (CASA), Global Production Efficiency Model (GLO-PEM), Vegetation Photosynthesis Model (VPM), and Eddy Covariance-Light Use Efficiency (EC-LUE)) and examined the possible further improvement of the better-performed model(s) via model structural optimization. Our results showed that the GLO-PEM, VPM, and EC-LUE exhibited the similar capabilities in simulating GPP (explained around 68% of the total variations) and overall performed better than CASA (58%). Nevertheless, the EC-LUE and VPM were the optimal ones because they required less model inputs than the GLO-PEM. For the two optimal models, we found that the minimum method is better than the multiplication approach to integrate multiple environmental stresses on LUE. Moreover, we found that the VPM can be further improved by incorporating the constraint of water vapor deficit (VPD s ). We suggested that a modified VPM by using minimum method and adding VPD s may be the best model in estimating large-scale GPP if high-quality remote sensing data available, otherwise, the modified models with the water stress reflected by VPD s only is optimal.
|
| [87] |
Estimating net primary production of natural grassland and its spatio-temporal distribution in China [J].https://doi.org/10.1016/j.scitotenv.2016.02.106 URL PMID: 26925730 [本文引用: 1] 摘要
The net primary production (NPP) of grassland largely determines terrestrial carbon (C) sinks, and thus plays an important role in the global C cycle. Comprehensive and sequential classification system of grasslands (CSCS) is a unique vegetation classification system (mainly for grassland) that is dependent on quantitative measurement indices [>02002°C annual cumulative temperature (Σθ) and moisture index (K-value)]. Based on the relationship of the quantitative classification of CSCS and grassland NPP, a modified model of Carnegie–Ames–Stanford Approach (CASA) was used to predict the grassland NPP and its temporal and spatial distribution in China from 2004 to 2008. The scatter plot of the estimated NPP and the observed NPP showed that the estimated data can be accepted with correlation coefficient of 0.896 ( P 02<020.05). The average annual NPP of grassland from 2004 to 2008 in China ranged from 443.23 to 554.4002g02C02m 61022 02yr. 61 1 . The NPP also showed spatial–temporal variations. There existed an increasing trend of NPP from the northwest to southeast due to the zonal distribution of vegetation. From the trend of monthly variations, it can be drawn that the NPP accumulation primarily occurred between April and October. The average NPP over seven months from April to October was 482.1902g02C02m 61022 , or about 88.78% of the annual total. The spatial–temporal trend suggests the importance of water and thermal regimes in determining the grassland NPP (i.e. water and thermal are key limited factors for the grassland production), which is also confirmed by a cluster analysis. The mean annual NPP and the total annual NPP differed significantly among grassland classes corresponding with different Σθ and K-value. The results demonstrate that the grassland NPP and the classes/super-classes in CSCS achieve the optimum coupling.
|
| [88] |
Assessing the impact of urban sprawl on net primary productivity of terrestrial ecosystems using a process-based model: A case study in Nanjing, China [J].https://doi.org/10.1109/JSTARS.2015.2440274 URL 摘要
Urban sprawl/urbanization has large impacts on the structure and function of terrestrial ecosystems. Net primary production (NPP) is an important indicator for estimating the earth's ability to support life and aids the evaluation of sustainable development of the terrestrial ecosystem. In this study, the process-based boreal ecosystem productivity simulator (BEPS) model was used in conjunction with leaf area index (LAI) dataset, land cover, and meteorological and soil data to simulate daily NPP at spatial resolution 250 m in Nanjing, a representative region within the Yangtze Delta, for the period 2001-2010. Effects of urbanization on land-cover change and regional NPP are quantitatively evaluated. The results show that during this period, urbanization caused significant land-cover change. Compared with 2001, urbanized area and area covered by water bodies increased significantly, while vegetated area declined greatly. The greatest loss was cropland, followed by evergreen coniferous and closed deciduous forests. There were obvious spatial differences in NPP variations. The reduction rate of annual NPP in the major city of Nanjing, Jiangning District, and Gaochun County was much higher than that in Pukou and Luhe district, and Lishui County. These results indicate that a process-based model driven by remote sensing is useful in assessing the impact of urban sprawl on NPP, and urbanization, not climate factors, is a main factor for NPP reduction for an urbanizing region.
|

/
| 〈 |
|
〉 |
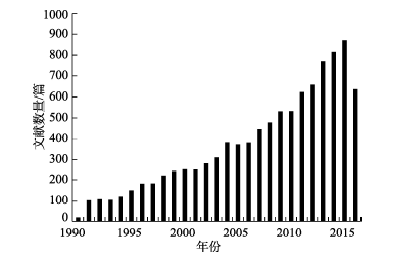
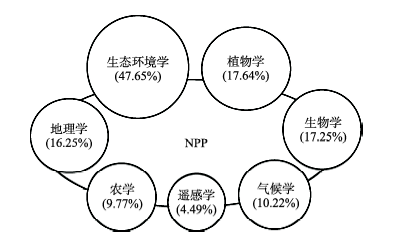
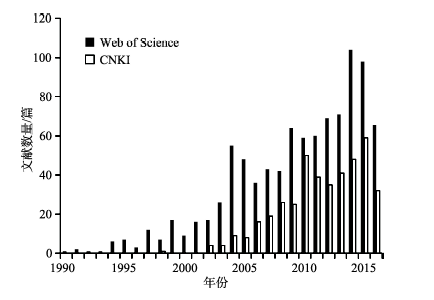


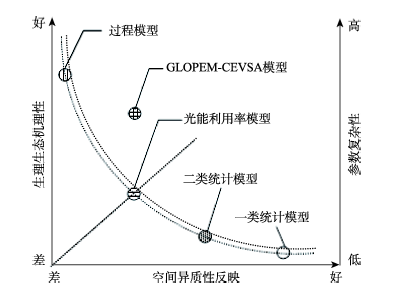