郭禹含 , 王中根, 伍玉良
GUO Yuhan, WANG Zhonggen, WU Yuliang
通讯作者:
版权声明: 2017 地理科学进展 《地理科学进展》杂志 版权所有
基金资助:
作者简介:
作者简介:郭禹含(1994-),女,云南昆明人,博士研究生,主要从事水文水资源研究,E-mail: guoyh.16b@igsnrr.ac.cn。
展开
摘要
针对资料稀缺地区水文模拟计算难题,开展多源再分析降水数据在拉萨河流域应用对比研究,本文基于HIMS系统构建了拉萨河流域分布式水文模型,以气象站实测数据为参照,对比分析了中国区域地面降水格点日值数据集和中国区域高时空分辨率地面气象要素驱动数据集两套遥感再分析数据集的气象数据在拉萨河流域的径流模拟效果。结果表明:在日和月时间尺度上,气象站实测降水数据的径流模拟精度最好,驱动集降水数据径流模拟结果要好于网格点降水数据。总体上,基于气象站实测降水数据的径流模拟纳西效率系数为0.86(日过程)和0.93(月过程),相关系数均在0.9以上。基于两类再分析数据的降水径流模拟纳西效率系数均在0.7(日过程)和0.8(月过程)以上,相关系数均在0.9左右。对于资料稀缺地区,多源再分析降水数据是重要的可用数据来源。借助于降水—径流模型,探讨多源再分析降水数据对径流模拟精度的影响,是完善多源再分析降水数据产品质量的一个重要环节。
关键词:
Abstract
Hydrological simulation in ungauged basins is a challenging topic in hydrology and water resource fields internationally. With the fast development of remote sensing technology, it is possible to utilize remote sensing derived precipitation data in hydrological fields to accelerate the progress of research in the PUB (predictions in ungauged basins) plan. This study compared the applications of different reanalyzed precipitation data—the grid and forcing precipitation data—in hydrological simulation in the Lhasa River Basin. The study built a distributed hydrological model using the HIMS model for the basin. The process started with inputting the daily precipitation data from the National Meteorological Center, then based on the measured flow in the Lhasa hydrological control station to calibrate and verify the hydrological model. After this, two types of remote sensing reanalyzed precipitation data in HIMS model were imported for runoff simulation, and the results were compared with simulation results of the measured weather station daily precipitation data. Subsequently, the applicability of the two types of remote sensing reanalyzed precipitation data in the Lhasa River Basin was analyzed. On the whole, the Nash-Sutcliffe efficiency coefficient of the runoff simulation based on daily precipitation data is 0.86 (daily process) and 0.93 (monthly process), and the correlation coefficient is above 0.9. The Nash-Sutcliffe efficiency coefficient of the rainfall-runoff simulations based on the two reanalyzed precipitation datasets are both above 0.7 in the daily scale process and over 0.8 in the monthly scale process, and the correlation coefficient are both around 0.9. The results show that the measured weather station daily precipitation data resulted in the best simulation outcomes and both the grid precipitation data and forcing precipitation data generate satisfactory runoff simulation results in the Lhasa River Basin. This indicates that daily precipitation data are useful although the number of rainfall stations in this area is limited. The remote sensing reanalyzed precipitation datasets can be well used in ungauged areas such as the Lhasa River Basin and it may become a reliable source when analyzing the relationship between rainfall and runoff in ungauged basins. Using rainfall-runoff model to examine the impact of multi-sources reanalyzed precipitation datasets on the accuracy of runoff simulation is essential for evaluating the quality of such datasets.
Keywords:
资料稀缺地区水文模拟是国际水文水资源界研究的前沿热点与难点之一(黄粤等, 2009; 徐宗学, 2010),需要在水文学理论、观测以及计算机技术三方面取得不断的突破(Sivapalan, 2003; Sivapalan et al, 2003)。因此,早在2003年国际水文科学协会(IAHS)便实施PUB(Prediction in Ungauged Basins)国际水文十年计划(引自Hrachowitz et al, 2013)。在水文理论研究方面,大量具有一定物理机制的水文模型应用于资料稀缺地区径流模拟计算(刘昌明等, 2012),如SWAT模型(季漩等, 2011; 陆志翔等, 2012; 罗吉忠等, 2013)、VIC模型(陈利群等, 2006; 刘文丰等, 2012)等。在观测方面,遥感技术不受复杂地形与恶劣环境的影响,能相对准确地识别降水空间分布 (刘俊峰等, 2010)。利用遥感反演、数据融合与同化等手段获得的相对丰富的降水数据,成为资料稀缺地区水文模拟计算的重要数据来源。但通过遥感手段获取降水数据仍存在一些问题(刘元波等, 2011),可靠的降水数据对于资料稀缺地区径流模拟而言至关重要(芮孝芳, 1997; Bastola et al, 2014),需要开展多源降水数据的对比分析。
目前,多源降水数据比较研究主要是以实测降水数据为参照,分析遥测雨量数据、遥感反演降水数据与融合再分析降水数据等多源降水数据的精度,并研究其在不同流域上的时空分布特征(刘波等, 2011; 杨旭等, 2016)。如Janowiak等(1998)早就比较了两类降水再分析数据的误差精度;黄浠等(2016)分析了雅鲁藏布江流域年、月尺度上不同来源降水数据的精度。上述研究仅探讨多源降水数据相比于实测气象数据的差异性以及精度,但在水文计算中应更加关注不同来源降水数据驱动径流模拟效果如何。为此,本文以国际典型PUB区——西藏拉萨河流域为案例,基于自主产权的HIMS系统构建流域分布式水文模型,针对国家气象中心的日降水数据和两类再分析数据,开展不同源降水数据对于径流模拟影响的对比分析,为稀缺资料地区水文模拟预报和水资源管理提供参考。
2.1.1 地理位置
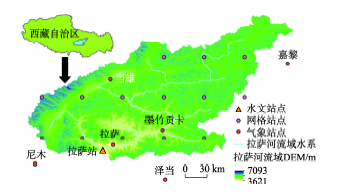
拉萨河位于西藏自治区中南部,发源于念青唐古拉山中段南侧嘉黎里彭措拉孔马沟,流经墨竹 工卡县、达孜县,最后经过拉萨市,在拉萨市南部郊区汇入雅鲁藏布江。流域范围主要在东经90°05′~93°20′,北纬29°20′~31°15′之间;流域总河长约500 km,流域面积31877 km2,是雅鲁藏布江的五大支流之一。
2.1.2 水文气象条件
拉萨河流域径流来源主要有降水、冰雪融水和地下水3类,其中降水径流占总径流的50%。拉萨河总落差1683.4 m,平均纵比降为0.34%。流域水能资源丰富,其干流部分蕴藏量达到171.7万kW,在雅鲁藏布江各部分支流中位居第三。
拉萨河流域属于高原温带干旱半干旱区,具有大陆性气候特点。流域雨热同期,干湿两季分布明显。汛期主要有两条水汽输送带,分别为印度季风输送带和中纬度西风输送带(林志强等, 2011)。流域内多年平均降水量在500 mm左右,多年平均最大4个月降水量占多年平均年降水量的80%以上(蔺学东等, 2007)。降水多集中在6-9月,年均气温为7℃,最高为12℃,最低-2.5℃左右。
拉萨河流域的DEM分辨率为30 m×30 m;土地利用数据为拉萨河流域2005年的土地利用类型①,包括耕地、林地、草地、水域、居民用地和未利用土地6个一级分类;土壤数据采用1:100万的土壤分类及其相应的理化性质,数据均来自中国科学院资源环境科学数据中心(http://www.resdc.cn)。
图1 拉萨河流域DEM及站点水系分布图
Fig.1 Location and DEM of the Lhasa River Basin and distribution of data stations and drainage network
本文基于HIMS平台构建拉萨河流域分布式水文模型。HIMS是基于模块化的流域水循环综合模拟系统,能根据目标流域的特点定制水文模型。普适版的HIMS模型主要包含截留填洼、下渗、蒸发、产汇流等几个大过程 (刘昌明等, 2008)。
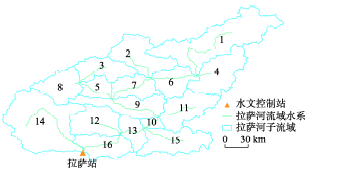
基于DEM提取河网以及子流域(图2),拉萨站是整个流域的控制水文站。将子流域编码后,形成河网拓扑结构关系。其中,14号子流域和16号子流域的流量最终汇入流域出口断面,即出口子流域有2个,在后续的分析中,主要应用16号子流域的出口流量与实测流量进行比较。
应用IDW反距离加权法(Bartier et al, 1996)进行空间插值,产生子流域面降水数据、最高气温和最低气温输入数据。根据子流域的土地利用情况和土壤分布情况,给出每个子流域的参数初始值。
以拉萨河水文站的实测流量过程为参照,利用HIMS模型中的随机选优方法进行模型参数率定,并对模型参数合理性进行分析,最终得到各子流域参数如表1所示。
表1 拉萨河流域分布式HIMS模型最终调参结果
Tab.1 Results of final parameters of the HIMS distributed model in the Lhasa River Basin
| 流域编号 | 土壤蓄水容量Wmm | 产流参数 | 壤中流 系数La | 地下水补给系数Rc | 实际蒸散发系数ε | 基流系数Kb | 汇流参数 | ||
|---|---|---|---|---|---|---|---|---|---|
| R | r | C1 | C2 | ||||||
| 1 | 356.0 | 9.00 | 0.10 | 0.23 | 0.01 | 0.10 | 0.01 | 0.06 | 0.05 |
| 2 | 50.0 | 0.48 | 0.19 | 0.97 | 0.03 | 1.56 | 0.05 | 0.90 | 0.90 |
| 3 | 50.0 | 0.22 | 0.99 | 0.57 | 0.09 | 0.15 | 0.02 | 0.05 | 0.06 |
| 4 | 50.0 | 5.31 | 0.10 | 0.14 | 0.01 | 0.16 | 0.03 | 0.05 | 0.25 |
| 5 | 73.0 | 8.65 | 0.16 | 0.20 | 0.01 | 0.86 | 0.02 | 0.05 | 0.05 |
| 6 | 50.0 | 3.00 | 0.99 | 0.10 | 0.01 | 0.10 | 0.01 | 0.05 | 0.05 |
| 7 | 50.0 | 2.88 | 0.10 | 0.19 | 0.02 | 0.96 | 0.01 | 0.06 | 0.05 |
| 8 | 1000.0 | 3.60 | 0.63 | 0.15 | 0.09 | 0.10 | 0.02 | 0.09 | 0.28 |
| 9 | 50.0 | 2.62 | 0.36 | 0.51 | 0.01 | 0.15 | 0.01 | 0.07 | 0.16 |
| 10 | 96.0 | 11.25 | 0.10 | 0.10 | 0.13 | 0.10 | 0.01 | 0.05 | 0.05 |
| 11 | 93.5 | 0.30 | 0.10 | 0.33 | 0.02 | 0.38 | 0.01 | 0.07 | 0.17 |
| 12 | 50.0 | 0.22 | 0.10 | 0.10 | 0.01 | 0.14 | 0.01 | 0.13 | 0.07 |
| 13 | 50.0 | 4.83 | 0.70 | 0.10 | 0.03 | 0.35 | 0.06 | 0.06 | 0.05 |
| 14 | 50.0 | 0.68 | 0.10 | 0.10 | 0.14 | 0.10 | 0.01 | 0.09 | 0.09 |
| 15 | 50.0 | 4.34 | 0.99 | 0.15 | 1.00 | 0.13 | 0.01 | 0.05 | 0.05 |
| 16 | 113.0 | 0.37 | 0.19 | 0.42 | 0.01 | 0.10 | 0.01 | 0.05 | 0.90 |
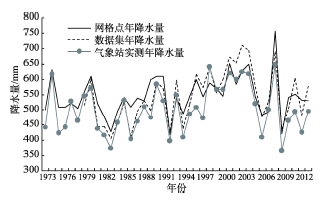
对3种降水数据进行分析,以气象站实测降水数据为参照,在0.01的显著性水平上,网格点降水、数据集降水与气象站降水的相关性分别为0.814、0.790。年际变化方面(图3),网格点和数据集的年降水量总体偏大,其中数据集降水数据的相对误差为9.69%,网格点降水数据的为8.80%。通过各个季节降水量的比较分析,发现引起年总降水量差异的主要是夏季和秋季。
图3 三种降水数据多年平均年总降水量过程线
Fig.3 Curves of the three types of average annual total precipitation data
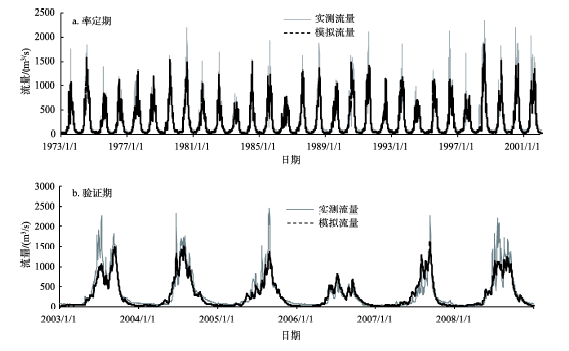
以气象站点实测降水为输入进行拉萨流域径流模拟,结果如表2和图4所示。HIMS模型的主要评估因子包括3个:①纳西效率系数(NSE);②相关系数(RE);③水量误差(WE)。其中,日过程模拟的纳西效率系数,率定期和验证期均在0.80以上,相关系数在0.90以上,水量误差较小。月过程纳西效率系数在0.90以上,相关系数在0.95以上,整体水量误差比日尺度模拟结果小。总体上,模拟流量整体小于实测流量,枯水期模拟结果要优于汛期。造成模拟流量整体偏小可能的原因为:一是面降水空间插值使输入的降水数据趋于均化,导致模拟流量出现高值低估;二是拉萨河流域属于高寒区存在融雪径流,模型采用简单的度—日因子模拟融雪径流存在一定偏差。
图4 拉萨站实测流量与模拟流量日过程
Fig.4 Daily process of measured flow and simulated flow at the Lhasa station
表2 拉萨站气象站降水输入模拟结果
Tab. 2 Results of simulation using meteorological precipitation data at the Lhasa station
| 计算时期 | NSE | RE | WE/% | |||||
|---|---|---|---|---|---|---|---|---|
| 日尺度 | 月尺度 | 日尺度 | 月尺度 | 日尺度 | 月尺度 | |||
| 率定期(1973-2002) | 0.86 | 0.93 | 0.93 | 0.97 | -6.86 | -6.91 | ||
| 验证期(2003-2008) | 0.83 | 0.90 | 0.92 | 0.95 | -11.57 | -7.85 | ||
以网格点降水数据为输入进行径流模拟,并与气象站点降水模拟结果比较发现,在率定期和验证期,网格点降水径流模拟的纳西效率系数和相关系数均比前者低(表3)。可能原因是:①网格点利用多个站台数据插值,使数据趋于坦化;②网格点降水的数据分辨率为0.5°,气象站点数据IDW插值分辨率为0.1°,气象站点降水数据插值分辨率更高。日月尺度上,气象站点降水径流模拟水量误差偏小,网格站点降水径流模拟的水量误差偏大,说明气象站点降水模拟径流在总量上偏小,而网格点降水模拟径流偏大。可能原因是网格点降水数据的多年平均降水量大于气象站点降水数据。按照该思路,若将两类降水数据加以融合,有可能更好地描述与预测实测流量。
表3 拉萨气象站降水数据与两类再分析降水数据模拟结果对比
Tab. 3 Comparison of the results of simulations using meteorological precipitation data and two reanalyzed precipitation data at the Lhasa station
| 日尺度 | 率定期(1973-2002) | 验证期(2003-2008) | 月尺度 | 率定期(1973-2002) | 验证期(2003-2008) | ||||||||||
|---|---|---|---|---|---|---|---|---|---|---|---|---|---|---|---|
| NSE | RE | WE/% | NSE | RE | WE/% | NSE | RE | WE/% | NSE | RE | WE/% | ||||
| 气象站降水数据 | 0.86 | 0.93 | -6.86 | 0.83 | 0.92 | -11.57 | 气象站降水数据 | 0.93 | 0.97 | -6.91 | 0.90 | 0.95 | -7.85 | ||
| 网格点降水数据 | 0.74 | 0.89 | 16.33 | 0.80 | 0.89 | 8.23 | 网格点降水数据 | 0.81 | 0.93 | 16.32 | 0.88 | 0.94 | 8.16 | ||
| 驱动集降水数据 | 0.79 | 0.90 | 6.36 | 0.78 | 0.88 | -2.66 | 驱动集降水数据 | 0.87 | 0.94 | 6.38 | 0.86 | 0.93 | -2.66 | ||
以驱动集降水数据为输入进行径流模拟,并与气象站点降水模拟结果比较发现,在率定期和验证期,驱动集降水径流模拟的纳西效率系数和相关系数均比前者低(表3)。但在整体的模拟效果上驱动集降水数据好于网格点降水数据。在率定期内,气象站点降水数据径流模拟的水量误差偏小,驱动集降水数据径流模拟的水量误差偏大。在验证期内,驱动集降水数据在总量模拟上相对更接近于实测流量,可能原因是驱动集数据在生成过程中结合气象观测资料与TRMM降水资料,修正了部分降水总量上的误差。同样由于遥感降水资料的融合,在日过程的模拟中降水数据存在“高值低估、低值高估”现象。
本文应用HIMS模型在拉萨河流域构建分布式水文模型,收集整理国家气象中心的日降水数据和两类再分析数据,输入HIMS模型中得到不同径流模拟过程,进一步比较分析径流模拟结果。两种再分析数据输入均能较好模拟径流过程,总体的径流模拟精度低于气象站点降水输入。主要结论如下:
(1) 在日和月尺度上,利用HIMS平台构建拉萨河流域分布式水文模型,采用有限的常规气象站点观测数据开展降水径流过程模拟,能达到较高的模拟精度,其中,率定期和验证期的模型纳西效率系数均在0.8以上。但总径流量模拟值比实测值偏低,可能原因是气象站点较少,在面雨量处理中存在一定误差。此外,拉萨河流域融雪径流较大,采用简单的度—日因子模型模拟融雪径流也存在一定偏差。
(2) 与气象站降水径流模拟相比,网格点数据降水径流模拟精度稍低,日和月尺度上在拉萨河流域的适用性均较好。其中,日尺度上率定期和验证期纳西效率系数分别为0.74和0.80,相关系数都为0.89;月尺度上率定期和验证期的纳西效率系数分别为0.81和0.88,相关系数分别为0.93和0.94,精度较高。说明在缺常规气象观测站点的地区,可以使用网格点降水数据进行径流模拟分析,并具有一定的模拟精度。
(3) 驱动集数据降水径流模拟在拉萨河流域的适用性均较好,且优于网格点降水数据径流模拟结果。其中,日尺度上率定期和验证期纳西效率系数分别为0.79和0.78,相关系数分别为0.90和0.88;月尺度上率定期和验证期的纳西效率系数分别为0.87和0.86,相关系数分别为0.94和0.93,精度较高。说明在稀缺资料地区,融合了遥感信息的驱动集降水数据比常规站点空间插值生成的网格点降水数据,在降水径流模拟中效果要好。
多源再分析降水数据对于资料稀缺地区水文计算是一个重要的数据源。但是,目前该类数据产品质量参差不齐,一些数据产品存在严重的“低值高估,高值低估”现象(黄浠, 2016),影响了水文计算精度。因此,对于多源再分析降水数据质量评价,不能仅仅局限于降水数据系列本身,需要借助于降水—径流模型,进一步分析其对径流模拟计算精度的影响。这对于完善多源再分析降水数据产品质量,提高其实际应用价值,是一个不可缺少的重要环节。
The authors have declared that no competing interests exist.
| [1] |
近35 a西藏拉萨河流域耕地时空变化趋势 [J].Spatial-temporal dynamics of cultivated land in recent 35 years in the Lhasa River basin of Tibet [J]. |
| [2] |
大尺度资料稀缺地区水文模拟可行性研究 [J].Feasibility study on hydrologic simulation in basins with macro-scale data scarce [J]. |
| [3] |
雅鲁藏布江流域不同源降水数据质量对比研究 [J].https://doi.org/10.18306/dlkxjz.2016.03.008 URL [本文引用: 1] 摘要
本文以雅鲁藏布江流域为研究区,利用13个气象站点的实测降水量数据在年和月尺度上验证了中国地面降水网格数据、CRU(Climatic Research Unit)降水数据和GLDAS(Global Land Data Assimilation System)降水数据的精度,并分析了不同源数据降水量年际变化特征和概率分布特性之间的差异.结果表明:4种不同来源的降水数据均存在一定程度的差异.年尺度和月尺度上中国地面降水网格数据与实测降水量数值最接近;而CRU降水数据和GLDAS降水数据与实测降水量相差较大,在使用时需谨慎.从空间差异性看,年尺度上CRU降水数据在每个站点与实测降水数据的相关性均高于GLDAS降水数据,说明前者的空间一致性较好,但相对误差却比GLDAS降水数据大.从年内变化趋势看,中国地面降水网格数据能较好地反映流域降水月尺度的变化特征,CRU降水数据则在流域大部分地区的汛期时段都存在明显的高估,而GLDAS数据无法反映月降水变化趋势,年内坦化现象十分显著.从年际变化特征看,中国地面降水网格数据能较好地反映实际降水量的年际变化特征,而GLDAS降水数据和CRU降水数据反映的降水量年际变化特征偏小,其中GLDAS数据的坦化现象更严重,会高估低降水值,低估高降水值.从降水概率分布情况来看,3种来源的降水数据均不能反映站点实测的极端降水事件.
Precision of data in three precipitation datasets of the Yarlung Zangbo River basin [J].https://doi.org/10.18306/dlkxjz.2016.03.008 URL [本文引用: 1] 摘要
本文以雅鲁藏布江流域为研究区,利用13个气象站点的实测降水量数据在年和月尺度上验证了中国地面降水网格数据、CRU(Climatic Research Unit)降水数据和GLDAS(Global Land Data Assimilation System)降水数据的精度,并分析了不同源数据降水量年际变化特征和概率分布特性之间的差异.结果表明:4种不同来源的降水数据均存在一定程度的差异.年尺度和月尺度上中国地面降水网格数据与实测降水量数值最接近;而CRU降水数据和GLDAS降水数据与实测降水量相差较大,在使用时需谨慎.从空间差异性看,年尺度上CRU降水数据在每个站点与实测降水数据的相关性均高于GLDAS降水数据,说明前者的空间一致性较好,但相对误差却比GLDAS降水数据大.从年内变化趋势看,中国地面降水网格数据能较好地反映流域降水月尺度的变化特征,CRU降水数据则在流域大部分地区的汛期时段都存在明显的高估,而GLDAS数据无法反映月降水变化趋势,年内坦化现象十分显著.从年际变化特征看,中国地面降水网格数据能较好地反映实际降水量的年际变化特征,而GLDAS降水数据和CRU降水数据反映的降水量年际变化特征偏小,其中GLDAS数据的坦化现象更严重,会高估低降水值,低估高降水值.从降水概率分布情况来看,3种来源的降水数据均不能反映站点实测的极端降水事件.
|
| [4] |
干旱区资料稀缺流域日径流过程模拟 [J].https://doi.org/10.3321/j.issn:1001-6791.2009.03.004 URL [本文引用: 1] 摘要
选取具有物理基础的分布式水文模型MIKESHE来模拟大尺度资料稀缺地区水文过程。以塔里木河主要源区之一开都河流域为研究区域,将流域内气象水文站点观测数据与遥感数据相结合,运用GIS空间分析方法修正数据输入。利用气象、土壤类型、土地利用和地表覆盖、数字高程和降雨等资料,研究大气、陆面、地表水和地下水的相互作用机理,通过模型敏感性分析确定了5个“自由”参数,并依据出山口水文站数据对模型进行率定和验证。结果表明,MIKESHE能在水文、气象站点稀少,土壤及水文地质数据缺乏的条件下,模拟开都河流域的日径流过程,模型效率系数达到0.7以上,率定期与验证期水量平衡误差均小于3%,模拟径流与实测径流高度相关。
Daily flow modeling in arid ungauged basin [J].https://doi.org/10.3321/j.issn:1001-6791.2009.03.004 URL [本文引用: 1] 摘要
选取具有物理基础的分布式水文模型MIKESHE来模拟大尺度资料稀缺地区水文过程。以塔里木河主要源区之一开都河流域为研究区域,将流域内气象水文站点观测数据与遥感数据相结合,运用GIS空间分析方法修正数据输入。利用气象、土壤类型、土地利用和地表覆盖、数字高程和降雨等资料,研究大气、陆面、地表水和地下水的相互作用机理,通过模型敏感性分析确定了5个“自由”参数,并依据出山口水文站数据对模型进行率定和验证。结果表明,MIKESHE能在水文、气象站点稀少,土壤及水文地质数据缺乏的条件下,模拟开都河流域的日径流过程,模型效率系数达到0.7以上,率定期与验证期水量平衡误差均小于3%,模拟径流与实测径流高度相关。
|
| [5] |
资料稀缺高海拔山区降水量推算方法及在水文模拟中的应用 [J].
在无法使用常规降水插值方法情况下,以SWAT模型划分高程段做 法为基础,提出基于多年平均实测径流量与模拟量偏差率最小为目标函数推算资料稀缺山区降水的方法,并用于玛纳斯河流域流量模拟。结果表明,月流量模拟结果 良好,日值模拟效果一般,实测与模拟值平均相对误差都在4%以内。说明该方法能有效控制模型中长时间尺度水的输入量,能在一定程度上解决流域高海拔山区径 流模拟的降水数据稀缺问题。
A precipitation estimation method and its application in hydrologic simulation in data-scarce high mountain area [J].
在无法使用常规降水插值方法情况下,以SWAT模型划分高程段做 法为基础,提出基于多年平均实测径流量与模拟量偏差率最小为目标函数推算资料稀缺山区降水的方法,并用于玛纳斯河流域流量模拟。结果表明,月流量模拟结果 良好,日值模拟效果一般,实测与模拟值平均相对误差都在4%以内。说明该方法能有效控制模型中长时间尺度水的输入量,能在一定程度上解决流域高海拔山区径 流模拟的降水数据稀缺问题。
|
| [6] |
多源降水数据在澜沧江—湄公河流域的比较研究 [J].
利用不同来源的格点降水数据和气象站点降水观测资料,对比了多个数据源的年、季平均降水量在澜沧江流域和整个流域的时间和空间变化特征。结果发现:(1)不同来源的降水数据在平均值上存在着较大差异,但其变化趋势在1979年以后都表现为上升趋势,这一点无论对于整个澜沧江-湄公河流域还是在澜沧江流域都是一致的。(2)在时间变化上,Xie-Arkin和CRU的降水数据都能较好的反映区域平均的澜沧江流域的年降水变化规律;而Xie-Arkin数据在春季和秋季相对更合理,在夏季和冬季,CRU数据的结果更接近于观测事实。(3)在空间分布形态上,各个不同来源的降水数据都能表现出从上游到下游降水量逐渐增多的趋势,但CRU数据空间分辨率最高,能够更好地描绘该区域降水的空间分布细节。(4)利用区域平均降水数据和水文站实测径流数据建立的降水-径流之间的简单一元线性回归模型,能够很好地预测年径流量。
Comparison of different precipitation datasets in Lancang-Mekong River basin [J].
利用不同来源的格点降水数据和气象站点降水观测资料,对比了多个数据源的年、季平均降水量在澜沧江流域和整个流域的时间和空间变化特征。结果发现:(1)不同来源的降水数据在平均值上存在着较大差异,但其变化趋势在1979年以后都表现为上升趋势,这一点无论对于整个澜沧江-湄公河流域还是在澜沧江流域都是一致的。(2)在时间变化上,Xie-Arkin和CRU的降水数据都能较好的反映区域平均的澜沧江流域的年降水变化规律;而Xie-Arkin数据在春季和秋季相对更合理,在夏季和冬季,CRU数据的结果更接近于观测事实。(3)在空间分布形态上,各个不同来源的降水数据都能表现出从上游到下游降水量逐渐增多的趋势,但CRU数据空间分辨率最高,能够更好地描绘该区域降水的空间分布细节。(4)利用区域平均降水数据和水文站实测径流数据建立的降水-径流之间的简单一元线性回归模型,能够很好地预测年径流量。
|
| [7] |
基于HIMS的稀缺资料地区径流估算 [ |
| [8] |
HIMS系统及其定制模型的开发与应用 [J].HIMS system and development and application of its customized model [J]. |
| [9] |
多卫星遥感降水数据精度评价 [J].Evaluating TRMM multi-satellite precipitation analysis using gauge precipitation and MODIS snow-cover products [J]. |
| [10] |
基于VIC模型的拉萨河流域分布式水文模拟 [J].
通过构建大尺度分布式VIC(variable infiltration capacity)模型,对拉萨河流域的水文过程进行了模拟,并以拉萨水文站为控制站点对模型进行率定和验证.结果表明:日尺度上,率定期和验证期的 Nash-Suttcliffe效率系数(ENS)、确定性系数(R2)、相关性系数(r)基本都在0.80以上;月尺度上,3个指标达0.90以上;空 间上,网格水量相对误差都小于1%.表明VIC模型能够较好地应用于拉萨河流域,适用性较好.VIC模型的构建,为研究气候变化对拉萨河流域水循环的影响 奠定了基础.
Distributed hydrological simulation in the Lhasa River basin based on VIC model [J].
通过构建大尺度分布式VIC(variable infiltration capacity)模型,对拉萨河流域的水文过程进行了模拟,并以拉萨水文站为控制站点对模型进行率定和验证.结果表明:日尺度上,率定期和验证期的 Nash-Suttcliffe效率系数(ENS)、确定性系数(R2)、相关性系数(r)基本都在0.80以上;月尺度上,3个指标达0.90以上;空 间上,网格水量相对误差都小于1%.表明VIC模型能够较好地应用于拉萨河流域,适用性较好.VIC模型的构建,为研究气候变化对拉萨河流域水循环的影响 奠定了基础.
|
| [11] |
卫星遥感反演降水研究综述 [J].https://doi.org/10.11867/j.issn.1001-8166.2011.11.1162 URL [本文引用: 1] 摘要
降水是地球水循环的基本组成部分,具有重要的气象、气候和水文学意义。精准地测量降水及其区域和全球分布,长期以来一直是一个颇具挑战性的科学研究目标。经过近50年的发展,基于可见光、红外和微波等各类卫星传感器的降水反演算法也逐渐发展成熟起来。简要回顾可见光/红外、被动微波、雷达和多传感器联合反演等卫星遥感降水反演的基本原理、主要反演算法以及存在的难点和前沿性研究问题,介绍了应用降水反演算法制成的3种主要全球降水数据集,包括热带雨林观测卫星(TRMM)、全球降水卫星制图(GSMaP)和全球降水气候项目(GPCP)数据集,并结合目前存在的问题探讨卫星降水反演研究发展趋势。
Satellite retrieval of precipitation: An overview [J].https://doi.org/10.11867/j.issn.1001-8166.2011.11.1162 URL [本文引用: 1] 摘要
降水是地球水循环的基本组成部分,具有重要的气象、气候和水文学意义。精准地测量降水及其区域和全球分布,长期以来一直是一个颇具挑战性的科学研究目标。经过近50年的发展,基于可见光、红外和微波等各类卫星传感器的降水反演算法也逐渐发展成熟起来。简要回顾可见光/红外、被动微波、雷达和多传感器联合反演等卫星遥感降水反演的基本原理、主要反演算法以及存在的难点和前沿性研究问题,介绍了应用降水反演算法制成的3种主要全球降水数据集,包括热带雨林观测卫星(TRMM)、全球降水卫星制图(GSMaP)和全球降水气候项目(GPCP)数据集,并结合目前存在的问题探讨卫星降水反演研究发展趋势。
|
| [12] |
西藏高原汛期水汽输送特征与降水异常 [J].Features of water vapor transfer in rainy season and their relations to rainfall anomalies over Tibetan Plateau [J]. |
| [13] |
拉萨河流域近50年来径流变化趋势分析 [J].Trend analysis of the runoff variation in Lhasa River Basin in Tibetan Plateau during the last 50 years [J]. |
| [14] |
SWAT模型在伊犁河上游缺资料区的应用 [J].
In the development of distribution hydrological models, finding a way to produce distribution precipitation data is a hotspot in hydrological research. And it is not only a hot issue, but also a difficulty that develops a model calibration method based the hydrological and physical processes for the practice of the PUB. In this study, the distributed hydrological model-SWAT is applied in the upstream of the Yili River basin with scarce data for the key issue about its water resources evaluation. The catchment area of the basin is nearly 57 000 square kilometers, only four hydrological stations and two meteorological stations have. Firstly, the input data are important for hydrological processes of the basin,especially the precipitation. The spatial distribution of precipitation in this basin is appropriately described by dividing the basin into eight regions, and the precipitation lapse rates in these regions are different each other, varying from 7.9 mm/100 m to 19.6 mm/100 m. Furthermore, there are many elevation bands according to the variation of the elevation in each subbasin. Then, a new suitable method for model calibration is adopted using multitemporal scales, including annual scale, monthly scale, flood and drought period, multivariables, such as precipitation, evaporation, total runoff, surface runoff and ground water, and multisites incorporates the natural and social characteristics of the basin, which include topography, geological structure, precipitation mechanism, general circulation, agricultural irrigation and reservoirs. This application obtained a preferable simulation results, all indexes reaching the standard. Both NSE and r2 are above 0.6, the highest of 0.83, and RE are all within 8%. It indicates that the model represents the hydrological processes of the basin properly; the results can provide references for the evaluation and management of water resources of the basin. Besides, to improve the model's simulation, the following studies are needful: to perfect the research on hydrologic mechanism, to improve the observation level of precipitation, and to investigate the related parameters of underlying surface including soil and vegetation.
Application of SWAT model in the upstream of Ili River basin with scarce data [J].
In the development of distribution hydrological models, finding a way to produce distribution precipitation data is a hotspot in hydrological research. And it is not only a hot issue, but also a difficulty that develops a model calibration method based the hydrological and physical processes for the practice of the PUB. In this study, the distributed hydrological model-SWAT is applied in the upstream of the Yili River basin with scarce data for the key issue about its water resources evaluation. The catchment area of the basin is nearly 57 000 square kilometers, only four hydrological stations and two meteorological stations have. Firstly, the input data are important for hydrological processes of the basin,especially the precipitation. The spatial distribution of precipitation in this basin is appropriately described by dividing the basin into eight regions, and the precipitation lapse rates in these regions are different each other, varying from 7.9 mm/100 m to 19.6 mm/100 m. Furthermore, there are many elevation bands according to the variation of the elevation in each subbasin. Then, a new suitable method for model calibration is adopted using multitemporal scales, including annual scale, monthly scale, flood and drought period, multivariables, such as precipitation, evaporation, total runoff, surface runoff and ground water, and multisites incorporates the natural and social characteristics of the basin, which include topography, geological structure, precipitation mechanism, general circulation, agricultural irrigation and reservoirs. This application obtained a preferable simulation results, all indexes reaching the standard. Both NSE and r2 are above 0.6, the highest of 0.83, and RE are all within 8%. It indicates that the model represents the hydrological processes of the basin properly; the results can provide references for the evaluation and management of water resources of the basin. Besides, to improve the model's simulation, the following studies are needful: to perfect the research on hydrologic mechanism, to improve the observation level of precipitation, and to investigate the related parameters of underlying surface including soil and vegetation.
|
| [15] |
基于SWAT模型的缺资料流域径流模拟研究 [J].https://doi.org/10.3969/j.issn.1003-4271.2013.01.18 URL [本文引用: 1] 摘要
为实现流域水功能区水质目标管理,需要知道河道各控制断面的径流情况,然而中小河流常因水文站点缺乏而难以满足要求,为此,本文以赣江袁河流域为例,利用袁河上游芦溪、茅洲两站的实测资料构建了分布式SWAT水文模型,以月径流模拟的相对误差、相关系数和Nash-Suttcliffe效率系数3个指标为标准。对模型的敏感参数进行率定和验证.然后,利用已建立的袁河流域分布式SWAT模型模拟分析了下游无资料地区的径流数据.结果表明:以流域内有资料的区域为基础构建分布式SWAT分布式水文模型推求中下游无资料地区径流过程的方法具有物理成因、能够充分考虑流域的水循环特征,是一种缺资料流域推求径流比较实用的方法.
Runoff simulation in data-scarce basins based on SWAT hydrological model [J].https://doi.org/10.3969/j.issn.1003-4271.2013.01.18 URL [本文引用: 1] 摘要
为实现流域水功能区水质目标管理,需要知道河道各控制断面的径流情况,然而中小河流常因水文站点缺乏而难以满足要求,为此,本文以赣江袁河流域为例,利用袁河上游芦溪、茅洲两站的实测资料构建了分布式SWAT水文模型,以月径流模拟的相对误差、相关系数和Nash-Suttcliffe效率系数3个指标为标准。对模型的敏感参数进行率定和验证.然后,利用已建立的袁河流域分布式SWAT模型模拟分析了下游无资料地区的径流数据.结果表明:以流域内有资料的区域为基础构建分布式SWAT分布式水文模型推求中下游无资料地区径流过程的方法具有物理成因、能够充分考虑流域的水循环特征,是一种缺资料流域推求径流比较实用的方法.
|
| [16] |
流域水文模型研究中的若干问题 [J].Some problems in research of watershed hydrology model [J]. |
| [17] |
水文模型: 回顾与展望 [J].
梳理和总结了水文模型发展的历史,对水文模型的主要分类方法与类别进行了系统的归纳和总结.从当前水文科学研究的热点问题出发,总结了水文模型在水文预报、水资源规划与利用、土壤侵蚀、非点源污染模拟等传统水文问题,以及解决水文学当前面临的一些热点问题包括气候变化和人类活动对水循环的影响中具体的研究与应用现状以及主要进展,分析了水文模型今后可能的发展趋势以及所存在的主要难点问题和关键技术.
Hydrological models: Past, present, future [J].
梳理和总结了水文模型发展的历史,对水文模型的主要分类方法与类别进行了系统的归纳和总结.从当前水文科学研究的热点问题出发,总结了水文模型在水文预报、水资源规划与利用、土壤侵蚀、非点源污染模拟等传统水文问题,以及解决水文学当前面临的一些热点问题包括气候变化和人类活动对水循环的影响中具体的研究与应用现状以及主要进展,分析了水文模型今后可能的发展趋势以及所存在的主要难点问题和关键技术.
|
| [18] |
多源降水数据在长江上游流域比较研究 [J].
降水是洪水预报重要的输入因子,是保证洪水预报精度的前提条件。提出一种从站点、子流域以及全流域3种空间尺度上评价水情遥测降水数据精度的方法。采用该方法,以国家气象信息中心公开发布的日降水数据为基准,针对覆盖宜昌-宜宾425000 km的377个遥测雨量站降雨数据进行精度评价。在日、月时间尺度上,综合评价了中国长江三峡集团所属的遥测雨量数据精度特征。结果表明,其遥测雨量数据与国家气象信息中心公开发布的日降水数据,具有较高的相关度,相关指标到达0.81。部分数据受到地形以及站点位置差异等因素的影响,存在一定差异。这些差异为雨量站的调整和补充提供重要依据。为验证其他遥测站网的降水数据精度提供了范例,利用该方法,可对运行多年的遥测雨量站网进行评价,也可开展多源降水融合相关工作,提高地面遥测降水数据的代表性和准确性。
Comparative study on various rainfall data in upper reaches in Yangtze River [J].
降水是洪水预报重要的输入因子,是保证洪水预报精度的前提条件。提出一种从站点、子流域以及全流域3种空间尺度上评价水情遥测降水数据精度的方法。采用该方法,以国家气象信息中心公开发布的日降水数据为基准,针对覆盖宜昌-宜宾425000 km的377个遥测雨量站降雨数据进行精度评价。在日、月时间尺度上,综合评价了中国长江三峡集团所属的遥测雨量数据精度特征。结果表明,其遥测雨量数据与国家气象信息中心公开发布的日降水数据,具有较高的相关度,相关指标到达0.81。部分数据受到地形以及站点位置差异等因素的影响,存在一定差异。这些差异为雨量站的调整和补充提供重要依据。为验证其他遥测站网的降水数据精度提供了范例,利用该方法,可对运行多年的遥测雨量站网进行评价,也可开展多源降水融合相关工作,提高地面遥测降水数据的代表性和准确性。
|
| [19] |
近50年中国降水格点日值数据集精度及评估 [J].Assessing quality of grid daily precipitation datasets in china in recent 50 years [J]. |
| [20] |
Multivariate interpolation to incorporate thematic surface data using inverse distance weighting (IDW) [J].https://doi.org/10.1016/0098-3004(96)00021-0 URL [本文引用: 1] 摘要
This paper introduces an interpolation routine that explicitly addresses surface variation across thematic polygonal boundaries. The inverse distance weighted (IDW) interpolation method has been expanded to allow users to define the expected degree of surface abruptness along thematic boundaries using a transition matrix. The procedure is demonstrated using as a case study an interpolated surface nickel geochemistry modified by terrane stratigraphic boundaries.
|
| [21] |
Evaluation of dynamically downscaled reanalysis precipitation data for hydrological application [J].https://doi.org/10.1002/hyp.9734 URL [本文引用: 1] 摘要
Skilful and reliable precipitation data are essential for seasonal hydrologic forecasting and generation of hydrological data. Although output from dynamic downscaling methods is used for hydrological application, the existence of systematic errors in dynamically downscaled data adversely affects the skill of hydrologic forecasting. This study evaluates the precipitation data derived by dynamically downscaling the global atmospheric reanalysis data by propagating them through three hydrological models. Hydrological models are calibrated for 28 watersheds located across the southeastern United States that is minimally affected by human intervention. Calibrated hydrological models are forced with five different types of datasets: global atmospheric reanalysis (National Centers for Environmental Prediction/Department of Energy Global Reanalysis and European Centre for Medium-Range Weather Forecasts 40-year Reanalysis) at their native resolution; dynamically downscaled global atmospheric reanalysis at 10-km grid resolution; stochastically generated data from weather generator; bias-corrected dynamically downscaled; and bias-corrected global reanalysis. The reanalysis products are considered as surrogates for large-scale observations. Our study indicates that over the 28 watersheds in the southeastern United States, the simulated hydrological response to the bias-corrected dynamically downscaled data is superior to the other four meteorological datasets. In comparison with synthetically generated meteorological forcing (from weather generator), the dynamically downscaled data from global atmospheric reanalysis result in more realistic hydrological simulations. Therefore, we conclude that dynamical downscaling of global reanalysis, which offers data for sufficient number of years (in this case 22鈥墆ears), although resource intensive, is relatively more useful than other sources of meteorological data with comparable period in simulating realistic hydrological response at watershed scales. Copyright 漏 2013 John Wiley & Sons, Ltd.
|
| [22] |
A decade of Predictions in Ungauged Basins (PUB): A review [J].https://doi.org/10.1080/02626667.2013.803183 URL [本文引用: 1] 摘要
The Prediction in Ungauged Basins (PUB) initiative of the International Association of Hydrological Sciences (IAHS), launched in 2003 and concluded by the PUB Symposium 2012 held in Delft (23-25 October 2012), set out to shift the scientific culture of hydrology towards improved scientific understanding of hydrological processes, as well as associated uncertainties and the development of models with increasing realism and predictive power. This paper reviews the work that has been done under the six science themes of the PUB Decade and outlines the challenges ahead for the hydrological sciences community.
|
| [23] |
A comparison of the NCEP-NCAR reanalysis precipitation and the GPCP rain gauge-satellite combined dataset with observational error considerations [J]. |
| [24] |
Prediction in ungauged basins: A grand challenge for theoretical hydrology [J].https://doi.org/10.1002/hyp.5155 URL [本文引用: 1] 摘要
M3 - Refereed article in scholarly journal (C1)
|
| [25] |
IAHS decade on Predictions in Ungauged Basins (PUB), 2003 - 2012: Shaping an exciting future for the hydrological sciences [J].https://doi.org/10.1623/hysj.48.6.857.51421 URL 摘要
Drainage basins in many parts of the world are ungauged or poorly gauged, and in some cases existing measurement networks are declining. The problem is compounded by the impacts of human-induced changes to the land surface and climate, occurring at the local, regional and global scales. Predictions of ungauged or poorly gauged basins under these conditions are highly uncertain. The IAHS Decade on Predictions in Ungauged Basins, or PUB, is a new initiative launched by the International Association of Hydrological Sciences (IAHS), aimed at formulating and implementing appropriate science programmes to engage and energize the scientific community, in a coordinated manner, towards achieving major advances in the capacity to make predictions in ungauged basins. The PUB scientific programme focuses on the estimation of predictive uncertainty, and its subsequent reduction, as its central theme. A general hydrological prediction system contains three components: (a) a model that describes the key processes of interest, (b) a set of parameters that represent those landscape properties that govern critical processes, and (c) appropriate meteorological inputs (where needed) that drive the basin response. Each of these three components of the prediction system, is either not known at all, or at best known imperfectly, due to the inherent multi-scale space鈥攖ime heterogeneity of the hydrological system, especially in ungauged basins. PUB will therefore include a set of targeted scientific programmes that attempt to make inferences about climatic inputs, parameters and model structures from available but inadequate data and process knowledge, at the basin of interest and/or from other similar basins, with robust measures of the uncertainties involved, and their impacts on predictive uncertainty. Through generation of improved understanding, and methods for the efficient quantification of the underlying multi-scale heterogeneity of the basin and its response, PUB will inexorably lead to new, innovative methods for hydrological predictions in ungauged basins in different parts of the world, combined with significant reductions of predictive uncertainty. In this way, PUB will demonstrate the value of data, as well as provide the information needed to make predictions in ungauged basins, and assist in capacity building in the use of new technologies. This paper presents a summary of the science and implementation plan of PUB, with a call to the hydrological community to participate actively in the realization of these goals.
|

/
| 〈 |
|
〉 |