黄文婕 , 葛全胜
, 葛全胜
HUANG Wenjie, GE Quansheng
通讯作者:
版权声明: 2017 地理科学进展 《地理科学进展》杂志 版权所有
基金资助:
作者简介:
作者简介:黄文婕(1984- ),女,蒙古族,内蒙古赤峰人,博士生,主要从事植被地理和物候学研究,E-mail: hwj5242@163.com。
展开
摘要
植物物候期的温度敏感度反映了植物是怎样及在何种程度上响应气候变化,研究不同物种物候期的温度敏感度有利于鉴别易受气候变化影响的物种。现有关于始花期的温度敏感度研究主要集中在温带地区,在亚热带地区研究仍较少。本文以位于亚热带的贵阳为研究区,利用1980-2014年60种典型木本植物的始花期观测资料,分析了该地区植物始花期变化趋势及对气温变化的敏感度,评估了样本量大小对敏感度估计稳定性的影响。结果表明:①研究时段内贵阳发生了明显的气候变化,年平均气温显著升高,其中春、秋季的增温比夏、冬季显著。②绝大多数植物(88.3%)的始花期在研究时段内呈提前趋势,其中显著提前的占物种总数的21.7%(P<0.05);60种植物始花期总体的提前趋势为2.89 d/10 a。③绝大多数(88.3%)植物始花期的年际变化与最优时段内平均气温呈显著负相关(P<0.05),所有植物始花期的总体敏感度为-5.75 d/℃。④样本量大小对温度敏感度估计的稳定性有显著影响,15年长序列能将敏感度估计结果的波动范围以99%的概率控制在2 d/℃之内。
关键词:
Abstract
Temperature sensitivity of phenophases can reflect how and to what degree plants could tract climate change, and is related to the ability of plants to adapt to climate change. Investigating the temperature sensitivity of phenophases of different plant species could help us to identify species that are sensitive to climate change. To date, the studies about temperature sensitivity of first flowering date (FFD) mainly focused on the temperate area, and fewer studies focused on the subtropical area. We selected Guiyang City, located in subtropical China, as the study area, and analyzed the temporal changes in FFD of plants and their temperature sensitivities based on phenological observation data of 60 typical woody plants from 1980 to 2014. In addition, we evaluated the impact of the length of time series on the stability of the estimates of temperature sensitivity. The results show that: (1) Guiyang City experienced notable climate change with significantly increased annual mean temperature during the study period. The warming of spring and autumn was stronger than summer and winter. (2) FFD of 53 species (88.3%) advanced during the study period with 13 species (21.7%) significantly advancing (P<0.05). Most trends of FFD were between -4 and -2 d/decade. The overall advancing trend for FFD of 60 species was 2.89 d/decade. (3) FFD was significantly and negatively correlated with mean temperature during the optimum period for most species (88.3%). Most temperature sensitivities of FFD ranged from -8 to -4 d/°C. The overall temperature sensitivity for FFD of all species was -5.75 d/°C. (4) Sample size clearly affected stability of the estimates of temperature sensitivity. The time series of 15 years could make the difference of estimates less than 2 d/°C with a probability of 99%. Thus, time series should be as long as possible to be used in estimating the temperature sensitivity of flowering phenology with a stability that is sufficient for interspecific comparisons.
Keywords:
虽然观测到的春季物候变化以提前为主,但提前程度存在明显的种间差异。例如,匈牙利4种植物始花期显著提前,其平均趋势在1.9~4.4 d/10a之间(Szabó et al, 2016)。北京1963-2007年48种木本植物始花期的提前趋势在0.19~5.31 d/10a之间(Bai et al, 2011)。加拿大19种植物的始花期在2001-2012年间的变化速率在-22~2 d/10 a之间(Gonsamo et al, 2013)。在同样的气候变化背景下,造成种间物候变化差异的主要原因是不同植物物候期对温度响应的敏感度不同。例如,西安42种植物的始花期温度敏感度在-11.44~-2.84 d/℃之间(Dai et al, 2013)。这种温度敏感度的差异甚至改变了年内物候期次序(仲舒颖等, 2012)。对美国马萨诸塞州(Massachusetts)康科德(Concord)附近森林的物候长期观测表明,始花期温度敏感度较弱的物种在过去150年间种群密度显著降低(Willis et al, 2008)。该结果意味着物候期的温度敏感度与植物对气候变化的适应能力有关。因此,研究不同物种物候期的温度敏感度有利于鉴别易受气候变化影响的植物种,从而为未来气候变化背景下的生态系统管理提供依据。
目前为止,关于始花期的温度敏感度研究主要集中在温带地区,例如中国华北地区(Bai et al, 2011; Dai et al, 2013)、日本及韩国(Ho et al, 2006; Miller-Rushing et al, 2007)、欧洲西北部(Fitter et al, 2002; Bolmgren et al, 2013; Bock et al, 2014; Wang et al, 2014)和美国东北部地区(Ellwood et al, 2013)等。而在亚热带湿润气候下植物始花期的温度敏感度研究较少。之前一项研究利用刺槐(Robiniapseudoacacia)、什锦丁香(Syringa chinensis)和欧丁香(Syringa vulgaris)始花期资料,发现始花期对温度响应的敏感度在纬度较低的亚热带地区比温带地区更强(Wang, Dai et al, 2015)。但这一结论仍需利用其他种的资料加以验证。
有鉴于此,本文以位于亚热带的贵阳为研究区,采用1980-2014年60种木本植物的始花期资料,适用滑动相关法计算了影响各植物始花期的最优时段,并用回归分析法计算了物候变化趋势及对气温响应的敏感度。本文重点关注3个科学问题:①过去30多年来贵阳植物始花期随时间的变化趋势是提前还是推迟;②始花期对温度响应的敏感度变化范围;③样本量大小对敏感度估计结果的影响。
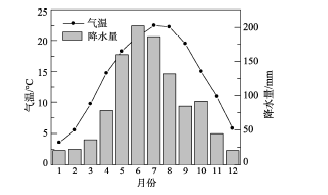
贵阳市位于贵州省中部地区,境内海拔高度在1100 m左右,地貌以山地、丘陵为主。物候观测点位于贵州大学花溪南校区,所处地理位置为北纬26°25′44″,东经106°40′09″,属亚热带湿润温和型气候。在物候观测时段内(1980-2014)年,年平均气温为14.1℃,全年最冷月是1月,平均气温3.6℃,而最热月为7月,平均气温22.5℃(图1)。年平均降水量为1076.5 mm,其中5-8月降水量较多,占全年降水量的63%(图1)。贵阳的地带性植被为中亚热带湿润性常绿阔叶林,但城区原生植被已完全被破坏,现以园林植物为主(安静等, 2014)。
本文所用的物候资料来自于“中国物候观测网”贵阳站,共包括1980-2014年60种木本植物的始花期资料(物种名称及数量见图2、表1)。根据中国物候观测网观测标准,始花期定义为在选定同种的几株树木上,看见一半以上的树有一朵或同时有几朵花的花瓣开始完全开放的日期(宛敏渭等, 1979)。在整个研究时段内,1992年和1996-2002年没有进行物候观测(图2)。为保证有足够样本量获得准确的趋势估计结果,所选植物种需满足以下条件:①1980-2014年间至少有15年观测记录;②1980-1995年和2003-2014年间各至少有5年观测记录。据此从所观测的126种植物中选定了60种木本植物(表1)。另外,物候观测不连续导致每年所观测的物种数目不同,在38~60种之间(图2)。
表1 本文所采用的物种基本情况
Tab.1 Plant species investigated in this study
| 学名 | 拉丁名 | 科 | 观测年数 | 平均始花期 |
|---|---|---|---|---|
| 侧柏 | Platycladusorientalis | Cupressaceae | 25 | 2-16 |
| 大叶早樱 | Cerasus subhirtella | Rosaceae | 27 | 2-19 |
| 金钟花 | Forsythia viridissima | Oleaceae | 26 | 2-19 |
| 毛叶木瓜 | Chaenomeles cathayensis | Rosaceae | 26 | 2-21 |
| 榆树 | Ulmuspumila | Ulmaceae | 28 | 2-21 |
| 澳洲合欢 | Acacia decurrens | Leguminosae | 23 | 2-22 |
| 杏 | Armeniaca vulgaris | Rosaceae | 28 | 2-28 |
| 贴梗海棠 | Chaenomelesspeciosa | Rosaceae | 27 | 2-28 |
| 窄叶蚊母树 | Distylium dunnianum | Hamamelidaceae | 25 | 2-29 |
| 响叶杨 | Populus adenopoda | Salicaceae | 23 | 3-2 |
| 垂柳 | Salix babylonica | Salicaceae | 26 | 3-3 |
| 李 | Prunus salicina | Rosaceae | 23 | 3-7 |
| 滇杨 | Populus yunnanensis | Salicaceae | 20 | 3-8 |
| 西府海棠 | Malusmicromalus | Rosaceae | 21 | 3-9 |
| 沙梨 | Pyruspyrifolia | Rosaceae | 24 | 3-11 |
| 紫玉兰 | Magnolia liliflora | Magnoliaceae | 22 | 3-12 |
| 紫荆 | Cercischinensis | Leguminosae | 33 | 3-12 |
| 木瓜 | Chaenomeles sinensis | Rosaceae | 26 | 3-14 |
| 枫杨 | Pterocarya stenoptera | Juglandaceae | 27 | 3-15 |
| 野花椒 | Zanthoxylumsimulans | Rutaceae | 24 | 3-16 |
| 白花泡桐 | Paulowniafortunei | Scrophulariaceae | 27 | 3-20 |
| 河柳 | Salix chaenomeloides | Salicaceae | 25 | 3-20 |
| 白蜡 | Fraxinuschinensis | Oleaceae | 24 | 3-21 |
| 二球悬铃木 | Platanusacerifolia | Platanaceae | 25 | 3-25 |
| 麻栎 | Quercus acutissima | Fagaceae | 24 | 3-27 |
| 东京樱花 | Cerasus yedoensis | Rosaceae | 27 | 3-28 |
| 马尾松 | Pinus massoniana | Pinaceae | 27 | 3-28 |
| 紫藤 | Wisteria sinensis | Leguminosae | 22 | 4-3 |
| 香叶树 | Lindera communis | Lauraceae | 24 | 4-4 |
| 构树 | Broussonetia papyifera | Moraceae | 25 | 4-4 |
| 云实 | Caesalpinia decapetala | Leguminosae | 27 | 4-9 |
| 小叶女贞 | Ligustrum quihoui | Oleaceae | 24 | 4-10 |
| 刺槐 | Robiniapseudoacacia | Leguminosae | 34 | 4-14 |
| 猴樟 | Cinnamomum bodinieri | Lauraceae | 23 | 4-14 |
| 楸树 | Catalpa bungei | Bignoniaceae | 25 | 4-15 |
| 香樟 | Cinnamomumcamphora | Lauraceae | 22 | 4-15 |
| 火棘 | Pyracantha fortuneana | Rosaceae | 25 | 4-15 |
| 楝树 | Meliaazedarach | Meliaceae | 23 | 4-20 |
| 皂荚 | Gleditsia sinensis | Leguminosae | 25 | 4-22 |
| 石榴 | Punicagranatum | Punicaceae | 28 | 5-4 |
| 梓树 | Catalpa ovata | Bignoniaceae | 28 | 5-15 |
| 线叶冬青 | Ilex fargesiivar.angustifolia | Aquifoliaceae | 23 | 5-18 |
| 枣树 | Ziziphusjujuba | Rhamnaceae | 26 | 5-20 |
| 小梾木 | Swida paucinervis | Cornaceae | 26 | 5-21 |
| 夹竹桃 | Nerium indicum | Apocynaceae | 25 | 5-22 |
| 华瓜木 | Alangium chinense | Alangiaceae | 21 | 5-27 |
| 木槿 | Hibiscus syriacus | Malvaceae | 17 | 6-7 |
| 女贞 | Ligustrumlucidum | Oleaceae | 28 | 6-13 |
| 六月雪 | Serissa japonica | Rubiaceae | 21 | 6-18 |
| 乌桕 | Sapium sebiferum | Euphorbiaceae | 24 | 6-19 |
| 梧桐 | Firmiana simples | Sterculiaceae | 33 | 6-23 |
| 海州常山 | Clerodendrumtrichotomum | Verbenaceae | 25 | 7-1 |
| 紫薇 | Lagerstroemia indica | Lythraceae | 27 | 7-12 |
| 槐树 | Sophora japonica | Leguminosae | 18 | 7-14 |
| 旱莲木 | Camptothecaacuminata | Nyssaceae | 26 | 7-17 |
| 白簕 | Acanthopanax trifoliatus | Araliaceae | 16 | 8-2 |
| 木犀 | Osmanthus fragrans | Oleaceae | 25 | 9-3 |
| 木芙蓉 | Hibiscus mutabilis | Malvaceae | 29 | 9-6 |
| 油茶 | Camellia oleifera | Theaceae | 20 | 9-16 |
| 枇杷 | Eriobotrya japonica | Rosaceae | 16 | 11-3 |
本文所用的贵阳站1980-2014年日平均气温资料下载于中国气象数据网(http://data.cma.cn/)。主要采用的数据产品为“中国近50年均一化历史气温数据集”(覆盖时段1951-2004年)和“中国地面气候资料日值数据集(V3.0)”(覆盖时段1951年至今)。对比这2个数据集发现,两者2000-2004年的气温资料完全一致,而之前不一致。这是因为贵阳站于2000年1月1日迁址,由市区(新华路)迁至郊区(扶风东路),导致原始气温资料存在不均一性(Li et al, 2004)。因此,本文所用的1980-2004年气温资料取自前一数据集,而2005-2014年气温资料取自后一数据集,这样便形成了均一化的气温数据。
图2 1980-2014年贵阳逐年观测的物种数量
Fig.2 The number of species observed for each year in Guiyang City, 1980-2014
为研究贵阳气候与物候变化情况,首先利用月平均气温与年份的线性回归分析,计算了贵阳1980-2014年各月与全年的气温变化趋势。其次,利用不同植物始花期与年份的线性回归分析,计算了不同物种始花期变化趋势。再次,对每个物种的始花期序列减去多年平均值,转换成距平序列,求出每年所有花期距平的中值,得到逐年花期距平中值序列,作为所有植物花期总体变化的代表。此外,为探讨时段选择对物候变化趋势的影响,本文计算了1980-2014年间所有10年及更长时段的始花期距平中值序列变化趋势。
为研究始花期对气温响应的敏感度,首先需要确定影响始花期的最优时段。相关研究表明,始花期通常与前一段时间内的气温显著相关(Bolmgren et al, 2013; Dai et al, 2013; Wang, Ge et al, 2015; 徐韵佳等, 2017)。以多年平均的始花期(EP)为结束日,以15天为步长,分别计算每个[EP-15×i,EP]时段(i=1,2,…,16)平均气温与始花期的相关系数。选择相关系数绝对值最大的那一时段,作为影响始花期的最优时段。其次,对每种植物的始花期与最优时段气温进行回归分析:
式中:其中FFD代表始花期序列;TEM代表最优时段的平均气温;a为截距;e为误差项;b为回归系数,作为衡量始花期温度敏感度的指标。对每个物种,利用所有年份的数据和式(1)估计了始花期的温度敏感度。另外,将每个物种的最优时段平均气温序列减去多年平均值,转换成距平序列,计算每年所有气温距平的中值,得到逐年气温距平中值序列,作为所有植物气温变化的代表。
为研究样本量大小对敏感度估计结果的影响,选择始花期距平中值序列和气温距平中值序列,首先利用式(1)计算了总体的温度敏感度(ball)。其次,利用随机数生成算法(通过Matlab软件实现),生成不同样本量的始花期与对应温度序列。例如,对于5年的样本量,从所有年份的资料中随机选取5个年份,得到相应的温度和始花期数据,并计算敏感度。重复选取1000次,可得到一组5年样本量下的敏感度估计结果。以此类推,本文对不同样本量进行了敏感度模拟,并比较了不同样本量所得敏感度的标准差以及落在ball±1区间内的概率。由于始花期距平序列的总样本量(即观测年数)为27年,且太小的样本量不能满足回归分析的要求,太大的样本量不能实现足够的选取次数,故本文将样本量选取范围定为5~22年。
1980-2014年,贵阳发生了显著的气候变化。年平均气温在波动中以0.36℃/10 a的趋势显著升高(P<0.05,图3b)。具体到月份,2-11月的气温呈升高趋势(图3a),其中2-5月和7-9月的气温升高趋势达到显著水平(P<0.05),尤以2月气温的增幅最大,达到1.02℃/10年。只有12月和1月的气温出现了下降趋势,但均不显著。
60种植物的平均始花期在2月16日(侧柏)-11月3日(枇杷)之间。其中2月开花的植物有9种(15%);3月开花的植物数量最多,达18种(30%);4月开花的植物有12种(20%)。这3个月开花的植物占总植物数量的65%,而其余月份开花的植物数量相对较少(表1)。贵阳植物的始花期有非常强的年际变异,平均标准差为10.87 d(图4a)。年际变异最小的植物为女贞(标准差4.28 d),而最大的为窄叶蚊母树(标准差17.29 d)。总体而言,始花期年际变化的标准差与平均始花期呈负相关关系(R=-0.41, P<0.05),表明开花越早的植物,其始花期的年际变化更强。
图4 1980-2014年贵阳60种木本植物始花期标准差和变化趋势
Fig.4 Temporal trends and standard deviation of first flowering dates for 60 woody plants in Guiyang City, 1980-2014
从图4b可以发现,贵阳植物的始花期以提前趋势为主。60种植物中,有53种植物(88.3%)的始花期在1980-2014年间提前,其中显著提前的有13种(P<0.05)。只有7种植物的始花期呈不显著的推迟趋势。始花期提前趋势最强的物种是木槿(-10.27 d/10a),最弱的为刺槐,趋势仅为-0.27 d/10a。大多数物种的提前趋势在-4~-2 d/10a之间。
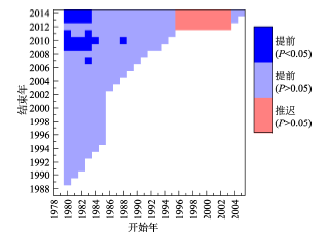
从60种植物始花期距平中值序列来看(图4c),在1995年前,花期距平以偏晚为主(平均距平为3.53 d),仅在1987年出现了极端偏早的始花期(距平-14.48 d)。在2003-2014年,花期距平以偏早为主,12年间有8年的始花期距平为负值,平均距平为-3.15 d。这种先偏晚后偏早的阶段性变化特征,导致始花期在1980-2014年整个时段内呈2.89 d/10a的提前趋势。图5显示了不同时段始花期距平中值的变化。绝大多数长度大于10年的时段始花期都呈提前态势。只有开始于1980-1983年、结束于2009-2014年的时段,始花期提前趋势显著(P<0.05);始花期开始于1996-2003年、结束于2012-2014年的时段,呈不显著推迟趋势。考虑到1996-2002年无观测数据,因此始花期的微弱推迟主要发生在2003年以后。
图5 所有植物花期距平的中值序列在不同时段的变化趋势
Fig.5 Temporal trends of median anomaly of first flowering date for all plant species during different time periods
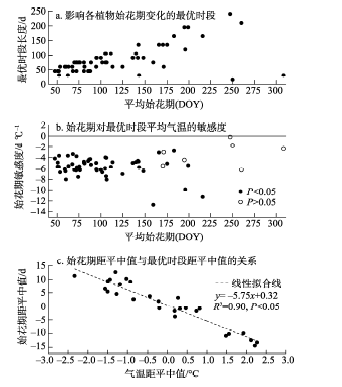
图6a显示了影响各植物始花期的最优时段长度。所有物种最优时段长度平均值为83.5 d,大多数物种(66.7%)的最优时段长度在45~90 d之间。总体而言,开花晚的物种,最优时段的长度倾向于更长。例如夏季开花(平均始花期8月2日)的白簕,其最优时段长度(165 d)在大多数情况下长于其他开花早的物种(图6a)。有2个种明显不符合这一规律:平均始花期在9月6日的木芙蓉,最优时段长度仅为15 d;平均始花期为11月3日的枇杷,最优时段长度仅为30 d。这可能与两种植物始花期同温度的相关关系不显著有关(图6b)。
图6 贵阳60种植物始花期对气温响应的敏感度
Fig. 6 Temperature sensitivity of first flowering dates for 60 plant species in Guiyang City
图6b是根据最优时段气温计算得到的各植物始花期温度敏感度。60种植物中,仅有7种植物(11.7%)的始花期对最优时段的气温响应不显著。这些植物的始花期相对偏晚,均发生在夏季和秋季。而其余53种植物的始花期(88.3%)对气温的响应显著(P<0.05)。其中响应最强的是木槿(-12.76 d/℃);响应最弱的是海州常山,只有-2.73 d/℃。从温度敏感度的频率分布来看,大多数植物(75%)始花期的温度敏感度在-8~-4 d/℃之间。通过所有植物始花期距平中值与最优时段气温距平中值的回归分析,可以发现贵阳60种植物整体的始花期与气温显著相关(R=-0.95, P<0.05)。总体的温度敏感度(ball)为-5.75 d/℃,亦即意味着气温每升高1℃,贵阳花期平均提前5.75 d(图6c)。
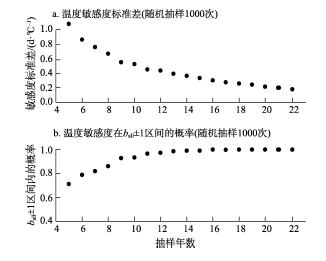
随机抽样结果显示,当样本量只有5年时,抽样1000次得到温度敏感度的标准差为1.08 d/℃,在ball±1区间内的概率是70.5%(图7)。随着样本量的增加,标准差逐渐减小,在ball±1区间内的概率逐渐增加。当样本量到15年时,多次抽样的标准差降低到0.33 d/℃,99%的估计值能落在ball±1区间内。该结果表明,样本量大小对敏感度估计结果的稳定性影响很大。
图7 随机抽样年数对温度敏感度估计结果的影响
Fig.7 Impact of sample size on estimates of temperature sensitivity
本文研究发现,贵阳大多数植物的始花期在1980-2014年呈提前趋势。而之前的研究采用较短的时间序列,发现1978-2007年贵阳始花期呈提前趋势(白洁等, 2009)。这表明近7年相对平稳的气温变化并未影响物候的整体提前趋势(图3b)。通过60种植物始花期距平中值序列,发现贵阳始花期的整体提前趋势为2.89 d/10a。该结果与荟萃分析得到的中国春夏季物候平均变化趋势(-2.75 d/10a)极为接近(Ge et al, 2015)。另外,研究时段对物候变化趋势估计结果的影响很大。只有开始于1980-1983年、结束于2009-2014年时段的植物始花期,才有显著的提前趋势。如果时间序列的时段为2003-2014年,甚至会得到始花期推迟的结果(图5)。通过对长时间历史物候序列的滑动趋势分析,同样发现历史上每30年的物候变化趋势不同(Rutishauser et al, 2008; Ge et al, 2014),这是由于气候存在明显的年际和年代际变化,不同时段的气候变化可能存在明显差异。因此,当集成分析多项研究的物候变化趋势而得出全国或全球尺度的物候变化趋势时,必须考虑研究间时段选择的不同,否则得到的结果可能差别很大(Ge et al, 2015)。
其次,本文发现绝大多数植物的始花期与温度显著相关,所有物种始花期的平均敏感度达-5.75 d/℃。这一数值大于温带地区得到的结论。例如,西安42种植物始花期的平均温度敏感度为-4.34 d/℃(Dai et al, 2013);北京春季开花植物的始花期温度敏感度为-2.7 d/℃(Bai et al, 2011);欧洲21个国家春夏季物候期的平均温度敏感度为-2.5 d/℃(Menzel et al, 2006)。由此,进一步验证了低纬度地区比高纬度地区温度敏感度高的事实(Dai et al, 2014; Wang, Dai et al, 2015)。温度敏感度不仅可反映物候期怎样及在何种程度上响应气候变化,还与植物对气候变化的适应能力有关。物候对气候变化响应不敏感的物种,其生长可能会受到限制,因为有可能错过与共生生物的相互作用(例如依赖虫媒传粉的植物与昆虫)或者生长季相对变短(相对于物候期提前面临更多的竞争者)(Cleland et al, 2012)。观测到的证据表明,过去150年间,物候不响应气候变化的物种在群落中的丰度显著降低(Willis et al, 2008)。外来种始花期的温度敏感度比本地种更高,因而促进了群落尺度的物种入侵(Willis et al, 2010)。Cleland等(2012)综合了24项研究中57个物种的信息,发现对气候变暖响应敏感的物种在生物量、覆盖比例和花数量方面有所增加。这些研究表明,始花期的温度敏感度与植被应对全球变暖的能力有关。因此,敏感度估计结果可为未来气候变化情景下的生态系统管理提供依据。例如,在植树造林或园林绿化中,可优先选择敏感度大的物种以更好地适应未来气候变化。此外,鉴于始花期对温度变化的响应极其敏感,未来气候变化将对贵阳周边地区花卉旅游的最佳时间产生影响。本文涉及的梨、樱花等都是贵阳及周边流行的赏花树种,旅游管理者需根据花期对物候变化的响应选择合理的时间开展花卉旅游活动(例如贵定音寨梨花节、清镇市簸箩农场樱花节等)。
温度敏感度与物种对未来气候变化的适应能力相关,因此需要准确地获得各物种温度敏感度的大小,以便进行物种间的对比。估计温度敏感度有2种方法,包括长期物候观测和控制实验(Wolkovich et al, 2012)。本文采用第一种方法,即利用长时间物候与气象观测数据,估计了贵阳60种木本植物始花期的温度敏感度。研究发现该方法的敏感度估计结果对时间序列的长度较为敏感。只有超过15年的资料才能使温度敏感度的估计值变化范围以99%的概率控制在2d/℃之内。因此在未来对温度敏感度估计时,应尽可能选择更长的时间序列以得到更稳定的敏感度估计结果。另一种敏感度估计方法为通过实验将植物控制在不同的环境温度下,以物候期差异与温度差异的比值确定温度敏感度。2种方法对同一物种同一物候期的敏感度估计结果存在显著差异(Wolkovich et al, 2012),造成这一差异的原因很可能与长期物候观测资料中存在多种环境因子的复杂相互作用有关,但有待今后进一步研究。
本文揭示了1980-2014年贵阳60种植物的始花期变化及对气温响应的敏感度,并评估了样本量大小对敏感度估计结果的影响,得到以下几个主要结论:
(1) 贵阳的年平均气温自1980年以来显著升高,其中对年平均气温增加贡献最大的是2-5月和7-9月的气温升高。
(2) 贵阳60种植物的平均始花期在2月16日—11月3日之间。其中2-4月开花的植物最多(65%)。1980年以来,始花期发生了明显变化,53种植物(88.3%)的始花期在提前,其中显著提前的有13种(P<0.05)。60种植物始花期1980-2014年总体提前趋势为2.89 d/10 a,但2003-2014年始花期略有推迟。
(3) 绝大多数植物(88.3%)始花期的年际变化与最优时段内平均气温显著负相关。大多数植物(75%)始花期温度敏感度在-8~-4 d/℃之间。所有植物总体的敏感度为-5.75 d/℃,这意味着最优时段气温每升高1℃,始花期平均提前5.75 d。
(4) 样本量大小对温度敏感度估计的稳定性有显著影响。如果要对比2个物种始花期敏感度的差异,需要足够长的时间序列以获得稳定的敏感度估计。15年以上的序列能将敏感度估计结果的波动范围以99%的概率控制在2 d/℃之内。
The authors have declared that no competing interests exist.
| [1] |
贵阳市园林植物种类初步调查 [J].https://doi.org/10.3969/j.issn.1008-0457.2014.04.013 URL [本文引用: 1] 摘要
通过对贵阳市主城区园林植物的实地调查和历史资料整理,对园林植物的类型、科的分布型及其在城市绿化中的应用进行了分析。结果表明,贵阳市主城区中用于园林景观的主要植物有244种,隶属于86科147属,其中以乔、灌木类植物配置较多,其它类型较少;引自亚洲、非洲和美洲热带等地的外来植物较多,乡土园林植物较少,建议加强乡土园林植物的筛选和应用。
Preliminary investigation on landscape greening plants in Guiyang City [J].https://doi.org/10.3969/j.issn.1008-0457.2014.04.013 URL [本文引用: 1] 摘要
通过对贵阳市主城区园林植物的实地调查和历史资料整理,对园林植物的类型、科的分布型及其在城市绿化中的应用进行了分析。结果表明,贵阳市主城区中用于园林景观的主要植物有244种,隶属于86科147属,其中以乔、灌木类植物配置较多,其它类型较少;引自亚洲、非洲和美洲热带等地的外来植物较多,乡土园林植物较少,建议加强乡土园林植物的筛选和应用。
|
| [2] |
贵阳木本植物物候对气候变化的响应 [J].https://doi.org/10.11821/yj2009060016 URL Magsci [本文引用: 1] 摘要
<p>根据1978~2007年贵阳站的物候和气象资料,分析了贵阳站71种木本植物春秋季芽膨大期、展叶始期、始花期、叶完全变色期和落叶末期等5个关键物候期的变化趋势及其对气候变化的响应。结果表明:自1978年以来,贵阳年平均气温在振荡中明显下降,其中夏季气温降低最为明显,2月平均气温略有上升;春季芽膨大期、展叶始期和始花期等三种物候期均呈现出提前趋势,而秋季叶完全变色期和落叶末期呈现推迟趋势;春季物候期与物候期发生前若干月月平均气温的相关性较好,特别与当月和上月平均气温的相关关系最为显著。其中,2月月平均气温是影响春季三种物候期的关键指标,除此之外,贵阳站2、3月的日照时数也对春季物候期的提前起到促进作用;秋冬季物候期变化和气温、降水、日照时数的相关关系均不明显,这同秋季物候变化的复杂性和秋季物候期所受的影响因素较多有关。</p>
Response of woody plant phenophases to climate change for recent 30 years in Guiyang [J].https://doi.org/10.11821/yj2009060016 URL Magsci [本文引用: 1] 摘要
<p>根据1978~2007年贵阳站的物候和气象资料,分析了贵阳站71种木本植物春秋季芽膨大期、展叶始期、始花期、叶完全变色期和落叶末期等5个关键物候期的变化趋势及其对气候变化的响应。结果表明:自1978年以来,贵阳年平均气温在振荡中明显下降,其中夏季气温降低最为明显,2月平均气温略有上升;春季芽膨大期、展叶始期和始花期等三种物候期均呈现出提前趋势,而秋季叶完全变色期和落叶末期呈现推迟趋势;春季物候期与物候期发生前若干月月平均气温的相关性较好,特别与当月和上月平均气温的相关关系最为显著。其中,2月月平均气温是影响春季三种物候期的关键指标,除此之外,贵阳站2、3月的日照时数也对春季物候期的提前起到促进作用;秋冬季物候期变化和气温、降水、日照时数的相关关系均不明显,这同秋季物候变化的复杂性和秋季物候期所受的影响因素较多有关。</p>
|
| [3] |
植物物候遥感监测精度影响因素研究综述 [J].Review of influencing factors of accuracy of plant phenology monitoring based on remote sensing data [J]. |
| [4] |
1982-2006年欧亚大陆植被生长季开始时间遥感监测分析 [J].https://doi.org/10.11820/dlkxjz.2012.11.003 URL Magsci 摘要
植被物候是环境条件季节和年际变化最直观、最敏感的生物指示器,物候变化可以反映陆地生态系统对气候变化的快速响应.论文基于1982-2006 年连续25 年的GIMMS AVHRR NDVI数据,采用动态阈值法、延迟滑动平均法,双Logistic 和Savitzky-Golay 方法提取欧亚大陆植被的生长季开始时间,并对不同方法的提取结果进行比较和分析.然后以动态阈值法的物候提取结果,研究了1982-2006 年期间植被物候变化趋势以及物候对温度变化的响应情况.结果表明:动态阈值法在欧亚大陆地区生长季开始时间提取率高,在纬度上的变化趋势稳定;北方森林/针叶林和苔原地区的生长季开始时间提取结果最稳定,低纬度区域的变率最大.1982-2006 年,大部分植被类型的生长季开始时间表现出提早趋势,其中森林覆盖区域提早趋势明显,变化幅度为11.45~15.61 d/25a;除了郁闭式至开放式( > 15%) 灌木丛( < 5 m)植被类型外,植被物候和温度表现出负相关关系,变化幅度为1.32~3.47d/℃,这也验证了近几十年气候变暖的趋势.
Assessment and intercomparison of satellite-derived Start-of-Season (SOS) measures in Eurasia for 1982-2006 [J].https://doi.org/10.11820/dlkxjz.2012.11.003 URL Magsci 摘要
植被物候是环境条件季节和年际变化最直观、最敏感的生物指示器,物候变化可以反映陆地生态系统对气候变化的快速响应.论文基于1982-2006 年连续25 年的GIMMS AVHRR NDVI数据,采用动态阈值法、延迟滑动平均法,双Logistic 和Savitzky-Golay 方法提取欧亚大陆植被的生长季开始时间,并对不同方法的提取结果进行比较和分析.然后以动态阈值法的物候提取结果,研究了1982-2006 年期间植被物候变化趋势以及物候对温度变化的响应情况.结果表明:动态阈值法在欧亚大陆地区生长季开始时间提取率高,在纬度上的变化趋势稳定;北方森林/针叶林和苔原地区的生长季开始时间提取结果最稳定,低纬度区域的变率最大.1982-2006 年,大部分植被类型的生长季开始时间表现出提早趋势,其中森林覆盖区域提早趋势明显,变化幅度为11.45~15.61 d/25a;除了郁闭式至开放式( > 15%) 灌木丛( < 5 m)植被类型外,植被物候和温度表现出负相关关系,变化幅度为1.32~3.47d/℃,这也验证了近几十年气候变暖的趋势.
|
| [5] |
1963-2012年中国主要木本植物花期长度时空变化 [J].Spatiotemporal variations in flowering duration of woody plants in China from 1963 to 2012 [J]. |
| [6] |
|
| [7] |
1978-2014年牡丹江地区植物花期变化及模型模拟 [J].Changes in flowering phenology of plants and their model simulation in Mudanjiang, China [J]. |
| [8] |
近30年北京自然历的主要物候期、物候季节变化及归因 [J].https://doi.org/10.3724/SP.J.1258.2012.01217 URL Magsci [本文引用: 1] 摘要
<p>根据中国物候观测网资料并结合气象观测数据, 重新编制了北京颐和园地区1981–2010年的自然历。通过与原自然历比较, 揭示了北京物候季节变化特征, 分析了1963年以来物候季节变化的可能原因。研究发现: 与原自然历相比, 1981–2010年北京的春、夏季开始时间分别提前了2天和5天, 秋、冬季开始时间分别推迟了1天和4天; 夏、秋季长度分别延长了6天和3天, 春、冬季长度则分别缩短了3天和6天; 各个物候期的平均日期、最早日期、最晚日期在春、夏季以提前为主, 在秋、冬季以推迟为主; 且春、秋、冬季节内部分物候期次序也出现了不同程度的变化。春、夏、冬季开始日期前的气温变化和秋季开始日期前的日照时数变化可能是北京颐和园地区物候季节变化的主要原因; 不同物种、不同物候期对气温变化的响应程度不同, 导致了物候季节内各种物候现象出现的先后顺序发生变化。</p>
Changes of main phenophases of natural calendar and phenological seasons in Beijing for the last 30 years [J].https://doi.org/10.3724/SP.J.1258.2012.01217 URL Magsci [本文引用: 1] 摘要
<p>根据中国物候观测网资料并结合气象观测数据, 重新编制了北京颐和园地区1981–2010年的自然历。通过与原自然历比较, 揭示了北京物候季节变化特征, 分析了1963年以来物候季节变化的可能原因。研究发现: 与原自然历相比, 1981–2010年北京的春、夏季开始时间分别提前了2天和5天, 秋、冬季开始时间分别推迟了1天和4天; 夏、秋季长度分别延长了6天和3天, 春、冬季长度则分别缩短了3天和6天; 各个物候期的平均日期、最早日期、最晚日期在春、夏季以提前为主, 在秋、冬季以推迟为主; 且春、秋、冬季节内部分物候期次序也出现了不同程度的变化。春、夏、冬季开始日期前的气温变化和秋季开始日期前的日照时数变化可能是北京颐和园地区物候季节变化的主要原因; 不同物种、不同物候期对气温变化的响应程度不同, 导致了物候季节内各种物候现象出现的先后顺序发生变化。</p>
|
| [9] |
The response of first flowering dates to abrupt climate change in Beijing [J].https://doi.org/10.1007/s00376-010-9219-8 URL Magsci [本文引用: 3] 摘要
Phenological data on the First Flowering Date (FFD) of woody plants in Beijing from 1963–2007 are analyzed. The correlation between each species’ yearly FFD and the mean monthly temperatures for every year over a 45-year period is used to identify the month in which temperature has the most effect on FFD. Through further analysis, the FFDs of 48 woody plant species are shown to have advanced an average of 5.4 days from 1990–2007 compared to 1963–1989. The results indicate that 70.8% of species flowered significantly earlier (7 days on average) during the period 1990–2007, while only one species (2.1%) flowered significantly later. Moreover, the responses of FFD to climate change are shown to be different in two climatic stages, defined by an abrupt climate change point. Thirty-three species which first flower in March and April are sensitive to temperature are examined. The correlation coefficients between FFD and temperature for 20 species during the latter period (1990–2007) are shown to be larger than during the former period (1963–1989), with a difference of around −0.87 days per 1°C on average. The paper concludes that with the warming of climate, the linear trend of FFD variation, as well as its responsiveness to temperature, became more prominent during 1990–2007 than 1963–1989. The data analyzed in this study present a strong biological indicator of climate change in Beijing, and provide further confirmation of previous results from regional and local studies across the Northern Hemisphere. Phenophase variations indicate that the climate is changing rapidly.
|
| [10] |
Changes in first flowering dates and flowering duration of 232 plant species on the island of Guernsey [J].https://doi.org/10.1111/gcb.12579 URL PMID: 24639048 Magsci [本文引用: 1] 摘要
Climate change has affected plant phenology; increasing temperatures are associated with advancing first flowering dates. The impact on flowering duration, however, has rarely been studied. In this study, we analysed first flowering dates and flowering durations from a 27 year dataset of weekly flower observations on 232 plant species from the island of Guernsey in the English Channel. The aim of this study was to explore variation in trends and relationships between first flowering dates, flowering duration and temperature. We specifically looked for evidence that traits, such as life forms and phylogenetic groups, explained variation in sensitivity of first flowering and flowering duration among species. Overall trends revealed significantly earlier flowering over time, by an average of 5.2daysdecade(-1) since 1985. A highly significant shortening of flowering duration was observed by an average of 10daysdecade(-1). Correlations between first flowering, flowering duration and year varied between different species, traits and flowering periods. Significant differences among traits were observed for first flowering and to a lesser degree for flowering duration. Overall, in comparison to first flowering, more species had significant trends in flowering duration. Temperature relationships revealed large differences in strength and direction of response. 55% of the species revealed a significant negative relationship of first flowering dates and temperature. In contrast, only 19% of flowering durations had a significant negative temperature relationship. The advance in first flowering date together with a shortening of flowering duration suggests potentially serious impacts on pollinators, which might pose a major threat to biodiversity, agriculture and horticulture. Human health, in terms of pollen allergies, however, might benefit from a shortening of specific plant pollen seasons.
|
| [11] |
One man, 73 years, and 25 species. Evaluating phenological responses using a lifelong study of first flowering dates [J].https://doi.org/10.1007/s00484-012-0560-8 URL PMID: 22744801 Magsci [本文引用: 2] 摘要
Phenological shifts linked to global warming reflect the ability of organisms to track changing climatic conditions. However, different organisms track global warming differently and there is an increasing interest in the link between phenological traits and plant abundance and distribution. Long-term data sets are often used to estimate phenological traits to climate change, but so far little has been done to evaluate the quality of these estimates. Here, we use a 73-year long data series of first flowering dates for 25 species from north-temperate Sweden to evaluate (i) correlations between first flowering dates and year for different time periods and (ii) linear regression models between first flowering date and mean monthly temperatures in preceding months. Furthermore, we evaluate the potential of this kind of data to estimate the phenological temperature sensitivities (i.e. number of days phenological change per degree temperature change, beta(60)) in such models. The sign of the correlations between first flowering dates and year were highly inconsistent among different time periods, highlighting that estimates of phenological change are sensitive to the specific time period used. The first flowering dates of all species were correlated with temperature, but with large differences in both the strength of the response and the period(s) of the year that were most strongly associated with phenological variation. Finally, our analyses indicated that legacy data sets need to be relatively long-term to be useful for estimating phenological temperature sensitivities (beta(60)) for inter-specific comparisons. In 10-year long observation series only one out of 24 species reached a parts per thousand yen80 % probability of estimating temperature sensitivity (beta(60)) within a +/- 1 range, and 17 out of 24 species reached a parts per thousand yen80 % probability when observation series were 20 years or shorter. The standard error for beta(60) ranged from 0.6 to 2.0 for 10-year long observation series, and 19 out of 24 species reached SE < 1 after 15 years. In general, late flowering species will require longer time series than early flowering species.
|
| [12] |
Warming, photoperiods, and tree phenology [J].
|
| [13] |
Phenological tracking enables positive species responses to climate change [J].https://doi.org/10.1890/11-1912.1 URL PMID: 22928404 Magsci [本文引用: 1] 摘要
Earlier spring phenology observed in many plant species in recent decades provides compelling evidence that species are already responding to the rising global temperatures associated with anthropogenic climate change. There is great variability among species, however, in their phenological sensitivity to temperature. Species that do not phenologically "track" climate change may be at a disadvantage if their growth becomes limited by missed interactions with mutualists, or a shorter growing season relative to earlier-active competitors. Here, we set out to test the hypothesis that phenological sensitivity could be used to predict species performance in a warming climate, by synthesizing results across terrestrial warming experiments. We assembled data for 57 species across 24 studies where flowering or vegetative phenology was matched with a measure of species performance. Performance metrics included biomass, percent cover, number of flowers, or individual growth. We found that species that advanced their phenology with warming also increased their performance, whereas those that did not advance tended to decline in performance with warming. This indicates that species that cannot phenologically "track" climate may be at increased risk with future climate change, and it suggests that phenological monitoring may provide an important tool for setting future conservation priorities.
|
| [14] |
Shifting plant phenology in response to global change [J].https://doi.org/10.1016/j.tree.2007.04.003 URL PMID: 17478009 摘要
Abstract Plants are finely tuned to the seasonality of their environment, and shifts in the timing of plant activity (i.e. phenology) provide some of the most compelling evidence that species and ecosystems are being influenced by global environmental change. Researchers across disciplines have observed shifting phenology at multiple scales, including earlier spring flowering in individual plants and an earlier spring green-up' of the land surface revealed in satellite images. Experimental and modeling approaches have sought to identify the mechanisms causing these shifts, as well as to make predictions regarding the consequences. Here, we discuss recent advances in several fields that have enabled scaling between species responses to recent climatic changes and shifts in ecosystem productivity, with implications for global carbon cycling.
|
| [15] |
Multiple phenological responses to climate change among 42 plant species in Xi'an, China [J].https://doi.org/10.1007/s00484-012-0602-2 URL PMID: 23114575 Magsci [本文引用: 4] 摘要
Phenological data of 42 woody plants in a temperate deciduous forest from the Chinese Phenological Observation Network (CPON) and the corresponding meteorological data from 1963 to 2011 in Xi'an, Shaanxi Province, China were collected and analyzed. The first leaf date (FLD), leaf coloring date (LCD) and first flower date (FFD) are revealed as strong biological signals of climatic change. The FLD, LCD and FFD of most species are sensitive to average temperature during a certain period before phenophase onset. Regional precipitation also has a significant impact on phenophases of about half of the species investigated. Affected by climate change, the FLD and FFD of these species have advanced by 5.54 days and 10.20 days on average during 2003-2011 compared with the period 1963-1996, respectively. Meanwhile, the LCD has delayed by 10.59 days, and growing season length has extended 16.13 days. Diverse responses of phenology commonly exist among different species and functional groups during the study period. Especially for FFD, the deviations between the above two periods ranged from -20.68 to -2.79 days; biotic pollination species showed a significantly greater advance than abiotic pollination species. These results were conducive to the understanding of possible changes in both the structure of plant communities and interspecific relationships in the context of climate change.
|
| [16] |
The spatial pattern of leaf phenology and its response to climate change in China [J].https://doi.org/10.1007/s00484-013-0679-2 URL PMID: 23732443 Magsci [本文引用: 1] 摘要
Leaf phenology has been shown to be one of the most important indicators of the effects of climate change on biological systems. Few such studies have, however, been published detailing the relationship between phenology and climate change in Asian contexts. With the aim of quantifying species' phenological responsiveness to temperature and deepening understandings of spatial patterns of phenological and climate change in China, this study analyzes the first leaf date (FLD) and the leaf coloring date (LCD) from datasets of four woody plant species, Robinia pseudoacacia, Ulmus pumila, Salix babylonica, and Melia azedarach, collected from 1963 to 2009 at 47 Chinese Phenological Observation Network (CPON) stations spread across China (from 21A degrees to 50A degrees N). The results of this study show that changes in temperatures in the range of 39-43 days preceding the date of FLD of these plants affected annual variations in FLD, while annual variations in temperature in the range of 71-85 days preceding LCD of these plants affected the date of LCD. Average temperature sensitivity of FLD and LCD for these plants was -3.93 to 3.30 days A degrees C-1 and 2.11 to 4.43 days A degrees C-1, respectively. Temperature sensitivity of FLD was found to be stronger at lower latitudes or altitude as well as in more continental climates, while the response of LCD showed no consistent pattern. Within the context of significant warming across China during the study period, FLD was found to have advanced by 5.44 days from 1960 to 2009; over the same period, LCD was found to have been delayed by 4.56 days. These findings indicate that the length of the growing season of the four plant species studied was extended by a total of 10.00 days from 1960 to 2009. They also indicate that phenological response to climate is highly heterogeneous spatially.
|
| [17] |
Response of the Morusbombycis growing season to temperature and its latitudinal pattern in Japan [J].https://doi.org/10.1007/s00484-011-0495-5 URL PMID: 21947335 Magsci 摘要
Changes in leaf phenology lengthen the growing season length (GSL, the days between leaf budburst and leaf fall) under the global warming. GSL and the leaf phenology response to climate change is one of the most important predictors of climate change effect on plants. Empirical evidence of climatic effects on GSL remains scarce, especially at a regional scale and the latitudinal pattern. This study analyzed the datasets of leaf budburst and fall phenology in Morus bombycis (Urticales), which were observed by the agency of the Japan Meteorological Agency (JMA) from 1953 to 2005 over a wide range of latitudes in Japan (31 to 44A degrees N). In the present study, single regression slopes of leaf phenological timing and air temperature across Japan were calculated and their spatial patterns using general linear models were tested. The results showed that the GSL extension was caused mainly by a delay in leaf fall phenology. Relationships between latitude and leaf phenological and GSL responses against air temperature were significantly negative. The response of leaf phenology and GSL to air temperature at lower latitudes was larger than that at higher latitudes. The findings indicate that GSL extension should be considered with regards to latitude and climate change.
|
| [18] |
Record-breaking early flowering in the eastern United States [J].https://doi.org/10.1371/journal.pone.0053788 URL PMID: 3547064 [本文引用: 1] 摘要
Abstract Flowering times are well-documented indicators of the ecological effects of climate change and are linked to numerous ecosystem processes and trophic interactions. Dozens of studies have shown that flowering times for many spring-flowering plants have become earlier as a result of recent climate change, but it is uncertain if flowering times will continue to advance as temperatures rise. Here, we used long-term flowering records initiated by Henry David Thoreau in 1852 and Aldo Leopold in 1935 to investigate this question. Our analyses demonstrate that record-breaking spring temperatures in 2010 and 2012 in Massachusetts, USA, and 2012 in Wisconsin, USA, resulted in the earliest flowering times in recorded history for dozens of spring-flowering plants of the eastern United States. These dramatic advances in spring flowering were successfully predicted by historical relationships between flowering and spring temperature spanning up to 161 years of ecological change. These results demonstrate that numerous temperate plant species have yet to show obvious signs of physiological constraints on phenological advancement in the face of climate change.
|
| [19] |
Rapid changes in flowering time in British plants [J].https://doi.org/10.1126/science.1071617 URL PMID: 12040195 [本文引用: 1] 摘要
Abstract The average first flowering date of 385 British plant species has advanced by 4.5 days during the past decade compared with the previous four decades: 16% of species flowered significantly earlier in the 1990s than previously, with an average advancement of 15 days in a decade. Ten species (3%) flowered significantly later in the 1990s than previously. These data reveal the strongest biological signal yet of climatic change. Flowering is especially sensitive to the temperature in the previous month, and spring-flowering species are most responsive. However, large interspecific differences in this response will affect both the structure of plant communities and gene flow between species as climate warms. Annuals are more likely to flower early than congeneric perennials, and insect-pollinated species more than wind-pollinated ones.
|
| [20] |
Phenological response to climate change in China: A meta-analysis [J].https://doi.org/10.1111/gcb.12648 URL PMID: 24895088 [本文引用: 2] 摘要
Abstract <p>The change in the phenology of plants or animals reflects the response of living systems to climate change. Numerous studies have reported a consistent earlier spring phenophases in many parts of middle and high latitudes reflecting increasing temperatures with the exception of China. A systematic analysis of Chinese phenological response could complement the assessment of climate change impact for the whole Northern Hemisphere. Here, we analyze 1263 phenological time series (1960–2011, with 20+ years data) of 112 species extracted from 48 studies across 145 sites in China. Taxonomic groups include trees, shrubs, herbs, birds, amphibians and insects. Results demonstrate that 90.8% of the spring/summer phenophases time series show earlier trends and 69.0% of the autumn phenophases records show later trends. For spring/summer phenophases, the mean advance across all the taxonomic groups was 2.7502days decade611 ranging between 2.11 and 6.1102days decade611 for insects and amphibians, respectively. Herbs and amphibians show significantly stronger advancement than trees, shrubs and insect. The response of phenophases of different taxonomic groups in autumn is more complex: trees, shrubs, herbs and insects show a delay between 1.93 and 4.8402days decade611, while other groups reveal an advancement ranging from 1.10 to 2.1102days decade611. For woody plants (including trees and shrubs), the stronger shifts toward earlier spring/summer were detected from the data series starting from more recent decades (1980s–2000s). The geographic factors (latitude, longitude and altitude) could only explain 9% and 3% of the overall variance in spring/summer and autumn phenological trends, respectively. The rate of change in spring/summer phenophase of woody plants (1960s–2000s) generally matches measured local warming across 49 sites in China ( R02 = 02 610.33, P
|
| [21] |
A 170 year spring phenology index of plants in Eastern China [J].https://doi.org/10.1002/2013JG002565 URL [本文引用: 1] 摘要
AbstractExtending phenological records into the past is essential for the understanding of past ecological change and evaluating the effects of climate change on ecosystems. A growing body of historical phenological information is now available for Europe, North America, and Asia. In East Asia, long-term phenological series are still relatively scarce. This study extracted plant phenological observations from old diaries in the period 1834–1962. A spring phenology index (SPI) for the modern period (1963–2009) was defined as the mean flowering time of three shrubs (first flowering of Amygdalus davidiana and Cercis chinensis, 50% of full flowering of Paeonia suffruticosa) according to the data availability. Applying calibrated transfer functions from the modern period to the historical data, we reconstructed a continuous SPI time series across eastern China from 1834 to 2009. In the recent 3065years, the SPI is 2.1–6.365days earlier than during any other consecutive 3065year period before 1970. A moving linear trend analysis shows that the advancing trend of SPI over the past three decades reaches upward of 4.165d/decade, which exceeds all previously observed trends in the past 3065year period. In addition, the SPI series correlates significantly with spring (February to April) temperatures in the study area, with an increase in spring temperature of 1°C inducing an earlier SPI by 3.165days. These shifts of SPI provide important information regarding regional vegetation-climate relationships, and they are helpful to assess long term of climate change impacts on biophysical systems and biodiversity.
|
| [22] |
Citizen Science: Linking the recent rapid advances of plant flowering in Canada with climate variability [J].https://doi.org/10.1038/srep02239 URL PMID: 23867863 [本文引用: 1] 摘要
The timing of crucial events in plant life cycles is shifting in response to climate change. We use phenology records from PlantWatch Canada `Citizen Science' networks to study recent rapid shifts of flowering phenology and its relationship with climate. The average first flower bloom day of 19 Canadian plant species has advanced by about 9 days during 2001-2012. 73% of the rapid and unprecedented first bloom day advances are explained by changes in mean annual national temperature, allowing the reconstruction of historic flower phenology records starting from 1948. The overall trends show that plant flowering in Canada is advancing by about 9 days per 掳C. This analysis reveals the strongest biological signal yet of climate warming in Canada. This finding has broad implications for niche differentiation among coexisting species, competitive interactions between species, and the asynchrony between plants and the organisms they interact with.
|
| [23] |
Earlier spring in Seoul, Korea [J].https://doi.org/10.1002/joc.1356 URL [本文引用: 1] 摘要
Abstract In the present study, long-term changes in the first bloom date of shrub and tree species in Seoul (126.56°E, 37.34°N), Korea were examined using historical observational data for the period 1922–2004 (83 years). The study focused on two shrub species, golden-bell ( Forsythia koreana ) and azalea ( Rhododendron mucronulatum ), and three tree species, cherry ( Prunus yedoensis ), peach ( Prunus persica ), and American locust ( Robinia pseudoacacia ). The annual-mean temperature has increased by about 2 °C in Seoul over the 83 years analyzed. The temperature increase is significant during the winter and early spring and becomes less significant during late spring. As a result of this regional warming, all five species showed an advance in the first bloom date over this time period. The advanced date is particularly apparent in early-spring flowering species like golden-bell (612.4 days 10-year 611 ), azalea (612.4 days 10-year 611 ), cherry (611.4 days 10-year 611 ), and peach (611.4 days 10-year 611 ) as compared to late-spring flowering species like American locust (610.5 days 10-year 611 ). The present results have demonstrated that the major factor for the determination of flower blooming is heat accumulation, i.e. a certain threshold of growing degree-days (GDD) index. In particular, early spring flowers were sensitive to the accumulation of warm temperature than late-spring flowers. Copyright 08 2006 Royal Meteorological Society
|
| [24] |
|
| [25] |
Phenology under global warming [J].
|
| [26] |
Detecting and adjusting temporal inhomogeneity in Chinese mean surface air temperature data [J].https://doi.org/10.1007/BF02915712 URL Magsci [本文引用: 1] 摘要
<a name="Abs1"></a>Adopting the Easterling-Peterson (EP) techniques and considering the reality of Chinese meteorological observations, this paper designed several tests and tested for inhomogeneities in all Chinese historical surface air temperature series from 1951 to 2001. The result shows that the time series have been widely impacted by inhomogeneities resulting from the relocation of stations and changes in local environment such as urbanization or some other factors. Among these factors, station relocations caused the largest magnitude of abrupt changes in the time series, and other factors also resulted in inhomogeneities to some extent. According to the amplitude of change of the difference series and the monthly distribution features of surface air temperatures, discontinuities identified by applying both the E-P technique and supported by China’s station history records, or by comparison with other approaches, have been adjusted. Based on the above processing, the most significant temporal inhomogeneities were eliminated, and China’s most homogeneous surface air temperature series has thus been created. Results show that the inhomogeneity testing captured well the most important change of the stations, and the adjusted dataset is more reliable than ever. This suggests that the adjusted temperature dataset has great value of decreasing the uncertaities in the study of observed climate change in China.
|
| [27] |
European phenological response to climate change matches the warming pattern [J].https://doi.org/10.1111/j.1365-2486.2006.01193.x URL [本文引用: 1] 摘要
Abstract Global climate change impacts can already be tracked in many physical and biological systems; in particular, terrestrial ecosystems provide a consistent picture of observed changes. One of the preferred indicators is phenology, the science of natural recurring events, as their recorded dates provide a high-temporal resolution of ongoing changes. Thus, numerous analyses have demonstrated an earlier onset of spring events for mid and higher latitudes and a lengthening of the growing season. However, published single-site or single-species studies are particularly open to suspicion of being biased towards predominantly reporting climate change-induced impacts. No comprehensive study or meta-analysis has so far examined the possible lack of evidence for changes or shifts at sites where no temperature change is observed. We used an enormous systematic phenological network data set of more than 125000 observational series of 542 plant and 19 animal species in 21 European countries (1971–2000). Our results showed that 78% of all leafing, flowering and fruiting records advanced (30% significantly) and only 3% were significantly delayed, whereas the signal of leaf colouring/fall is ambiguous. We conclude that previously published results of phenological changes were not biased by reporting or publication predisposition: the average advance of spring/summer was 2.5 days decade 611 in Europe. Our analysis of 254 mean national time series undoubtedly demonstrates that species' phenology is responsive to temperature of the preceding months (mean advance of spring/summer by 2.5 days°C 611 , delay of leaf colouring and fall by 1.0 day°C 611 ). The pattern of observed change in spring efficiently matches measured national warming across 19 European countries (correlation coefficient r =610.69, P <0.001).
|
| [28] |
Impact of global warming on a group of related species and their hybrids: Cherry tree (Rosaceae) flowering at Mt. Takao, Japan [J].https://doi.org/10.3732/ajb.94.9.1470 URL PMID: 21636514 [本文引用: 1] 摘要
Abstract Climate change is affecting plant phenology worldwide. Phenological responses vary among species, but it is not clear how responses differ among closely related species. We examined a 25-yr record (1981-2005) of flowering times for 97 trees, representing 17 species and hybrids of cherry (Cerasus sp. or Prunus sp.) grown at Mt. Takao, in Tokyo, Japan. The cherry trees flowered earlier over time, by an average of 5.5 d over the 25-yr study. Earlier flowering was explained largely by a 1.8掳C increase in February-March mean monthly temperatures. Most species and hybrids flowered 3-5 d earlier for each 1掳C increase in temperature, but early-flowering taxa flowered as much as 9 d earlier for each 1掳C increase in temperature. Flowering durations and differences in flowering times among species were greater in warm years than in cold years. Species and individual trees also flowered longer in warm years. These results show that the flowering times of closely related species may change similarly in response to climate change, but that early-flowering species may diverge from the overall trend in a predictable way. Such changes in flowering may affect gene flow and pollination as the length of the flowering season increases.
|
| [29] |
Leaf-out phenology of temperate woody plants: From trees to ecosystems [J].https://doi.org/10.1111/j.1469-8137.2011.03803.x URL PMID: 21762163 摘要
Abstract Top of page Abstract I.68Introduction II.68What triggers a plant to leaf-out? III.68Variation in leaf-out among species IV.68Leaf-out and climate change V.68Conclusions Acknowledgements References Contents Summary 926 I. Introduction 927 II. What triggers a plant to leaf-out? 928 III. Variation in leaf-out among species 929 IV. Leaf-out and climate change 932 V. Conclusions 937 Acknowledgements 937 References 937 Summary Leafing-out of woody plants begins the growing season in temperate forests and is one of the most important drivers of ecosystem processes. There is substantial variation in the timing of leaf-out, both within and among species, but the leaf development of almost all temperate tree and shrub species is highly sensitive to temperature. As a result, leaf-out times of temperate forests are valuable for observing the effects of climate change. Analysis of phenology data from around the world indicates that leaf-out is generally earlier in warmer years than in cooler years and that the onset of leaf-out has advanced in many locations. Changes in the timing of leaf-out will affect carbon sequestration, plant–animal interactions, and other essential ecosystem processes. The development of remote sensing methods has expanded the scope of leaf-out monitoring from the level of an individual plant or forest to an entire region. Meanwhile, historical data have informed modeling and experimental studies addressing questions about leaf-out timing. For most species, onset of leaf-out will continue to advance, although advancement may be slowed for some species because of unmet chilling requirements. More information is needed to reduce the uncertainty in predicting the timing of future spring onset.
|
| [30] |
|
| [31] |
Attributing physical and biological impacts to anthropogenic climate change [J]. |
| [32] |
Swiss spring plant phenology 2007: Extremes, a multi-century perspective, and changes in temperature sensitivity [J].https://doi.org/10.1029/2007GL032545 URL [本文引用: 1] 摘要
Spring (March-May) 2007 was characterized by record high temperatures over European land areas. Anomalously high temperatures led to a very early onset of plant phenological spring phases, including 98 record early observations out of a possible total of 302 (32%) for selected phases in Switzerland. In the context of the last 300 years and based on three tree species, 2007 marks the third earliest, after 1961 and 1794, plant phenological spring onset in Switzerland. We show that the temperature sensitivity of Swiss plant phenology to spring temperatures has changed within the last three centuries: sensitivity has generally increased over the record period but also decreased during two periods with warming trends (1890-1950 1970-2007).
|
| [33] |
Flowering phenological changes in relation to climate change in Hungary [J].https://doi.org/10.1007/s00484-015-1128-1 URL PMID: 26768142 [本文引用: 1] 摘要
The importance of long-term plant phenological time series is growing in monitoring of climate change impacts worldwide. To detect trends and assess possible influences of climate in Hungary, we studied flowering phenological records for six species (Convallaria majalis, Taraxacum officinale, Syringa vulgaris, Sambucus nigra, Robinia pseudoacacia, Tilia cordata) based on phenological observations from the Hungarian Meteorological Service recorded between 1952 and 2000. Altogether, four from the six examined plant species showed significant advancement in flowering onset with an average rate of 1.9-4.4 days per decade. We found that it was the mean temperature of the 2-3 months immediately preceding the mean flowering date, which most prominently influenced its timing. In addition, several species were affected by the late winter (January-March) values of the North Atlantic Oscillation (NAO) index. We also detected sporadic long-term effects for all species, where climatic variables from earlier months exerted influence with varying sign and little recognizable pattern: the temperature/NAO of the previous autumn (August-December) seems to influence Convallaria, and the temperature/precipitation of the previous spring (February-April) has some effect on Tilia flowering.
|
| [34] |
Ecological responses to recent climate change [J]. |
| [35] |
Temperature sensitivity of plant phenology in temperate and subtropical regions of China from 1850-2009 [J].https://doi.org/10.1002/joc.4026 URL 摘要
ABSTRACT Phenology can be used to track plant responses to climate change. In China, several studies have found the earlier trends of spring phenophases over the past 50 years. However, few studies put these phenological changes into historical perspective. Based on specific phenophases records from historical diaries and Chinese Phenological Observation Network, we developed spring phenology index (SPI) time series in temperate and subtropical regions of eastern China from 1850 to 2009. We firstly compare the temporal change of SPI and seasonal temperature anomaly. Subsequently, we search for common shifts in phenological and temperature time series by applying the moving t -test method, and discuss temperature sensitivity of SPI by using the moving linear regression method for both regions. Results show that the SPI in temperate region revealed lower interannual variability than in subtropical region, while the seasonal temperature variability was higher in temperate region. In temperate region, the timing of significant shift towards earlier SPI (in 1979) coincides with the timing of shift in spring temperature time series. The temperature sensitivities of SPI differ among the two regions. The mean sensitivity of SPI to spring temperature in subtropical region (613.7 days °C611) is stronger than in temperate region (612.5 days °C611). The temperature sensitivity of SPI varies among consecutive 30-year periods. In recent three decades, temperature sensitivity of spring phenophases became stronger in both regions.
|
| [36] |
Geographical pattern in first bloom variability and its relation to temperature sensitivity in the USA and China [J].https://doi.org/10.1007/s00484-014-0909-2 URL PMID: 25312515 摘要
Advance in spring plant phenology over the last several decades has been found in all continents of the Northern Hemisphere. Compared to the studies detecting phenological trends, the studies investigating the geographical pattern of phenological variability (including mean date and magnitude of variability) are rather limited. In this study, we analyzed spatial pattern of mean date and standard deviation (SD) of first bloom date (FBD) time series (≥1502years) for black locust ( Robinia pseudoacacia ) at 22 stations in China, common lilac ( Syringa vulgaris ) at 79 stations in the Western US and Chinese lilac ( Syringa chinensis ) at 45 stations in the Eastern US. Subsequently, the impact of geographical factors (latitude, longitude, and altitude) on the mean date and SD was quantified by using the multiple regression analysis method. Meanwhile, the relationship between FBD variability and temperature sensitivity of FBD was examined. Results showed that the mean FBD highly depended on geographical factors for all the three species. Compared to the mean date, the dependence of SD of FBD time series on geographical factors was weaker. The geographical factors could only explain 13 to 3102% of spatial variance in SD of FBD. The negative regression coefficients of latitude ( P 65<650.05 except black locust) indicated that FBD is more variable at lower latitude. At most of stations, significant and negative correlations between FBD and preseason temperature on interannual scale were found, but the temperature sensitivity varied among different stations. The magnitude of temperature sensitivity decreased with increasing latitude. In general, the locations at lower latitude had earlier and more variable spring phenophase and showed stronger phenological response to climate change than the locations at higher latitude.
|
| [37] |
The influence of local spring temperature variance on temperature sensitivity of spring phenology [J].https://doi.org/10.1111/gcb.12509 URL PMID: 24357518 Magsci [本文引用: 1] 摘要
The impact of climate warming on the advancement of plant spring phenology has been heavily investigated over the last decade and there exists great variability among plants in their phenological sensitivity to temperature. However, few studies have explicitly linked phenological sensitivity to local climate variance. Here, we set out to test the hypothesis that the strength of phenological sensitivity declines with increased local spring temperature variance, by synthesizing results across ground observations. We assemble ground-based long-term (20-50years) spring phenology database (PEP725 database) and the corresponding climate dataset. We find a prevalent decline in the strength of phenological sensitivity with increasing local spring temperature variance at the species level from ground observations. It suggests that plants might be less likely to track climatic warming at locations with larger local spring temperature variance. This might be related to the possibility that the frost risk could be higher in a larger local spring temperature variance and plants adapt to avoid this risk by relying more on other cues (e.g., high chill requirements, photoperiod) for spring phenology, thus suppressing phenological responses to spring warming. This study illuminates that local spring temperature variance is an understudied source in the study of phenological sensitivity and highlight the necessity of incorporating this factor to improve the predictability of plant responses to anthropogenic climate change in future studies.
|
| [38] |
Photoperiod constraints on tree phenology, performance and migration in a warming world [J].https://doi.org/10.1111/pce.12431 URL PMID: 25142260 摘要
Abstract Increasing temperatures should facilitate the poleward movement of species distributions through a variety of processes, including increasing the growing season length. However, in temperate and boreal latitudes, temperature is not the only cue used by trees to determine seasonality, as changes in photoperiod provide a more consistent, reliable annual signal of seasonality than temperature. Here, we discuss how day length may limit the ability of tree species to respond to climate warming in situ, focusing on the implications of photoperiodic sensing for extending the growing season and affecting plant phenology and growth, as well as the potential role of photoperiod in controlling carbon uptake and water fluxes in forests. We also review whether there are patterns across plant functional types (based on successional strategy, xylem anatomy and leaf morphology) in their sensitivity to photoperiod that we can use to predict which species or groups might be more successful in migrating as the climate warms, or may be more successfully used for forestry and agriculture through assisted migration schemes. 脗漏 2014 John Wiley & Sons Ltd.
|
| [39] |
Phylogenetic patterns of species loss in Thoreau's woods are driven by climate change [J].https://doi.org/10.1073/pnas.0806446105 URL PMID: 18955707 [本文引用: 2] 摘要
Abstract Climate change has led to major changes in the phenology (the timing of seasonal activities, such as flowering) of some species but not others. The extent to which flowering-time response to temperature is shared among closely related species might have important consequences for community-wide patterns of species loss under rapid climate change. Henry David Thoreau initiated a dataset of the Concord, Massachusetts, flora that spans approximately 150 years and provides information on changes in species abundance and flowering time. When these data are analyzed in a phylogenetic context, they indicate that change in abundance is strongly correlated with flowering-time response. Species that do not respond to temperature have decreased greatly in abundance, and include among others anemones and buttercups [Ranunculaceae pro parte (p.p.)], asters and campanulas (Asterales), bluets (Rubiaceae p.p.), bladderworts (Lentibulariaceae), dogwoods (Cornaceae), lilies (Liliales), mints (Lamiaceae p.p.), orchids (Orchidaceae), roses (Rosaceae p.p.), saxifrages (Saxifragales), and violets (Malpighiales). Because flowering-time response traits are shared among closely related species, our findings suggest that climate change has affected and will likely continue to shape the phylogenetically biased pattern of species loss in Thoreau's woods.
|
| [40] |
Favorable climate change response explains non-native species' success in Thoreau's woods [J].https://doi.org/10.1371/journal.pone.0008878 URL PMID: 2811191 [本文引用: 1] 摘要
Invasive species have tremendous detrimental ecological and economic impacts. Climate change may exacerbate species invasions across communities if non-native species are better able to respond to climate changes than native species. Recent evidence indicates that species that respond to climate change by adjusting their phenology (i.e., the timing of seasonal activities, such as flowering) have historically increased in abundance. The extent to which non-native species success is similarly linked to a favorable climate change response, however, remains untested. We analyzed a dataset initiated by the conservationist Henry David Thoreau that documents the long-term phenological response of native and non-native plant species over the last 150 years from Concord, Massachusetts (USA). Our results demonstrate that non-native species, and invasive species in particular, have been far better able to respond to recent climate change by adjusting their flowering time. This demonstrates that climate change has likely played, and may continue to play, an important role in facilitating non-native species naturalization and invasion at the community level.
|
| [41] |
Climate change and shifts in spring phenology of three horticultural woody perennials in northeastern USA [J].https://doi.org/10.1007/s00484-004-0248-9 URL Magsci 摘要
<a name="Abs1"></a>We evaluated spring phenology changes from 1965 to 2001 in northeastern USA utilizing a unique data set from 72 locations with genetically identical lilac plants (<i>Syringa chinensis</i>, clone <img src="/content/DFW7DB58C8PBM4AF/xxlarge8220.gif" alt="ldquo" align="MIDDLE" border="0">Red Rothomagensis<img src="/content/DFW7DB58C8PBM4AF/xxlarge8221.gif" alt="rdquo" align="MIDDLE" border="0">). We also utilized a previously validated lilac-honeysuckle <img src="/content/DFW7DB58C8PBM4AF/xxlarge8220.gif" alt="ldquo" align="MIDDLE" border="0">spring index<img src="/content/DFW7DB58C8PBM4AF/xxlarge8221.gif" alt="rdquo" align="MIDDLE" border="0"> model to reconstruct a more complete record of first leaf date (FLD) and first flower date (FFD) for the region from historical weather data. In addition, we examined mid-bloom dates for apple (<i>Malus domestica</i>) and grape (<i>Vitis vinifera</i>) collected at several sites in the region during approximately the same time period. Almost all lilac sites with significant linear trends for FLD or FFD versus year had negative slopes (advanced development). Regression analysis of pooled data for the 72 sites indicated an advance of –0.092 day/year for FFD (<i>P</i>=0.003). The slope for FLD was also negative (–0.048 day/year), but not significant (<i>P</i>=0.234). The simulated data from the <img src="/content/DFW7DB58C8PBM4AF/xxlarge8220.gif" alt="ldquo" align="MIDDLE" border="0">spring index<img src="/content/DFW7DB58C8PBM4AF/xxlarge8221.gif" alt="rdquo" align="MIDDLE" border="0"> model, which relies on local daily temperature records, indicated highly significant (<i>P</i><0.001) negative="" slopes="" of="" –0.210="" and="" –0.123="" day/year="" for="" fld="" and="" ffd,="" respectively.="" data="" collected="" for="" apple="" and="" grape="" also="" indicated="" advance="" spring="" development,="" with="" slopes="" for="" mid-bloom="" date="" versus="" year="" of="" –0.20="" day/year=""></0.001)><i>P</i>=0.01) and –0.146 (<i>P</i>=0.14), respectively. Collectively, these results indicate an advance in spring phenology ranging from 2 to 8 days for these woody perennials in northeastern USA for the period 1965 to 2001, qualitatively consistent with a warming trend, and consistent with phenology shifts reported for other mid- and high-latitude regions.
|
| [42] |
Warming experiments underpredict plant phenological responses to climate change [J].https://doi.org/10.1038/nature11014 URL PMID: 22622576 [本文引用: 2] 摘要
Abstract Warming experiments are increasingly relied on to estimate plant responses to global climate change. For experiments to provide meaningful predictions of future responses, they should reflect the empirical record of responses to temperature variability and recent warming, including advances in the timing of flowering and leafing. We compared phenology (the timing of recurring life history events) in observational studies and warming experiments spanning four continents and 1,634 plant species using a common measure of temperature sensitivity (change in days per degree Celsius). We show that warming experiments underpredict advances in the timing of flowering and leafing by 8.5-fold and 4.0-fold, respectively, compared with long-term observations. For species that were common to both study types, the experimental results did not match the observational data in sign or magnitude. The observational data also showed that species that flower earliest in the spring have the highest temperature sensitivities, but this trend was not reflected in the experimental data. These significant mismatches seem to be unrelated to the study length or to the degree of manipulated warming in experiments. The discrepancy between experiments and observations, however, could arise from complex interactions among multiple drivers in the observational data, or it could arise from remediable artefacts in the experiments that result in lower irradiance and drier soils, thus dampening the phenological responses to manipulated warming. Our results introduce uncertainty into ecosystem models that are informed solely by experiments and suggest that responses to climate change that are predicted using such models should be re-evaluated.
|

/
| 〈 |
|
〉 |


