刘蛟 , 刘铁, 黄粤
LIU Jiao, LIU Tie, HUANG Yue
通讯作者:
版权声明: 2017 地理科学进展 《地理科学进展》杂志 版权所有
基金资助:
作者简介:
作者简介:刘蛟(1986-),男,四川成都人,博士研究生,主要从事流域水文过程研究,E-mail:liujiao1102@aliyun.com。
展开
摘要
在西北荒漠-绿洲生态系统中,山区水循环对下游水资源管理具有重要作用。为了准确地理解高寒山区水文过程,以降水、温度和潜在蒸散发的遥感数据为模型输入,建立叶尔羌河流域的MIKE SHE模型。根据模型输出,从径流、积雪和蒸散发三方面探讨了流域的水文过程。结果表明:经校正后的遥感产品在叶尔羌河流域的水文模拟中取得了良好的应用效果,出山口卡群站日径流的效率系数达0.71,相关系数达0.85。河道的年平均径流深为146.66 mm,其中稳定的基流补给占21.3%。流域的年平均降雪231 mm,占总降水的74%左右;73.9%的融雪发生在7-9月,积雪主要分布于5000 m以上区域。蒸散发以7-9月中低山区植被覆盖良好的针叶林和草地为主。选用合适的方法对遥感数据进行验证和率定,有助于提高对资料缺失的高寒山区流域水文过程的认识。对不同水文要素进行分析验证,可更准确地理解水资源的转化、储存方式及其时空分布,以便为下游水资源管理提供依据。
关键词:
Abstract
In the desert-oasis ecology system of northwest China, water cycle in the mountain region is very important for the water resources management in downstream regions. To accurately understand the hydrological processes in high altitude and cold mountainous areas, a MIKE SHE model was applied to the Yarkant River Basin based on the remote sensing data of precipitation, temperature, and potential evapotranspiration, and the hydrological processes were analyzed based on the simulated outputs of runoff, snow, and evapotranspiration. The results suggest that the corrected remote sensing data are suitable for hydrological modeling of the Yarkant River Basin. At the Kaqun station, Nash efficiency coefficient and correlation coefficient are 0.71 and 0.85 at the daily scale. The annual mean stream runoff was 146.66 mm, among which base flow was 21.3%. The annual mean snowfall was 231 mm, which accounted for 74% of precipitation; 73.9% of the snowmelt occurred in July to September, and the snow storage is primarily distributed in the elevation zone above 5000 m. The evapotranspiration mainly occurred in the mid-low mountains covered by vegetation in June to September. The satellite data processed by appropriate methods are useful for the hydrological study in high-cold alpine catchments; multiple hydrological components could improve the understanding of water resources’ transition, storage, and distribution, which will contribute to the water resource management in the downstream regions.
Keywords:
中国西北内陆干旱区的河流多为内陆河,产流于山区,耗散于绿洲和荒漠。因此,理解山区水循环过程,把握山区水资源的产生、转化、输移及耗散状况对于山麓经济带的水资源管理决策非常重要(高前兆等, 1992)。流域水文模型是理解流域尺度上水循环过程的重要工具。然而受高海拔山区复杂的地形条件和地理结构影响,流域内的水文参数具有很强的空间异质性,加之水文气象监测站点稀少,使得大尺度山区流域水文过程模拟的难度加大(Marks et al, 1992)。气象卫星、陆地资源卫星和微波技术等遥感手段在水文研究中的广泛应用(傅国斌等, 2001),为理解高寒山区水文机理提供了新的参数源(陈仁升等, 2014)。颜伟等(2014)利用MODIS分析了西昆仑山2000-2013年的积雪变化。Sun等(2012)基于遥感数据对无资料地区的水文模型进行了率定。Liu等(2012)以遥感输入研究了分布式模型在资料缺失山区流域的应用。遥感数据在半干旱及干旱区的水文研究中得到了广泛应用,对于其应用效果,往往是通过某一个水文要素进行评价,而缺乏对整个流域水文过程的关注。同时,由于卫星数据受本身轨道、传感器及反演算法等方面限制,遥感数据在不同流域中,与实际情况存在不同的误差(Prigent, 2010)。直接应用可能导致对水文循环过程的错误判断,因此应用前需根据研究区域的实际情况,对遥感数据进行检验和校正。
在气候变化大背景下,西北地区山区的水资源形成、转化与水循环过程等也发生了变化(陈亚宁等, 2014)。源于喀喇昆仑山脉的叶尔羌河上游流域属于典型的高寒山区流域,河道补给包括降水、融雪和混合补给。目前对该流域的研究主要集中于分析冰川积雪消融上 (Zhang et al, 2009; Chen et al, 2010; 高鑫等, 2010; 牛竞飞等, 2011)。研究结果表明,增温导致冰川退缩,冰雪融水对河道径流的贡献增大,并且由冰川阻塞湖引起的突发性洪水增强。对叶尔羌河流域的研究较少关注其他水文过程,而流域水循环是一个完整的水文过程,忽略或淡化其他水文过程都可能影响对高寒山区水资源的正确理解。
本文选取干旱区高海拔山区的叶尔羌河流域为研究区域,以降水、温度、积雪覆盖面积和潜在蒸散发的遥感数据为支撑,构建流域的MIKE SHE模型。通过模型输出,从流域的水循环出发,分析流域内径流组成、积雪和蒸散发的时空分布,探讨其水文过程。
叶尔羌河发源于喀喇昆仑山北坡,在出山口卡群站形成2.5×10⁴ km2的绿洲区。绿洲区以农业经济为主,灌溉面积5.0×10³ km2,是新疆最大的灌区,全国主要的棉花产地(Tang et al, 2013)。本文选取卡群水文站的控制集水面为研究区(图1),面积为50248 km2,河长约585 km。研究区内群峰耸立,纵向河谷,横向冰川是其主要的地貌特点。流域地形南高北低,高程梯度变化很大,从世界第二高峰乔戈里峰8611 m下降到出山口1446 m,平均高程4450 m。流域内空间降水分布极为不均,5000 m以上高山区域,年降水量可以达到500 mm左右,但3000 m以下区域,年降水量不足100 mm(高鑫等, 2010)。
研究区内只有塔什库尔干一个气象站点(图1),海拔高程3090 m。塔什库尔干站实测的多年平均降水量为96 mm,而蒸发皿测得的年均蒸发量达到1500 mm。流域内冰川丰富,分布有2689条冰川,冰川水储量685 km3(杨惠安等, 1991)。根据2010年Landsat5及Landsat8 TM解译的土地覆盖图,冰川积雪主要覆盖在5000 m以上区域,占流域总面积的26.14%。5000 m以下区域以草甸、裸地和稀疏草地为主要土地利用方式,分别占流域总面积的29%、20%和19.1%。在出山口附近分布有少量的常绿针叶林和灌木林。冰川积雪融水为叶尔羌河流域提供了丰富的水资源,卡群站多年平均径流量为68.75亿m3,其中冰雪融水占70%左右(Chen et al, 2010)。受冰雪融水的季节性影响,卡群站年内各月流量的分布不均,6-9月的径流量占全年总径流量的80%。
MIKE SHE利用质量、能量和动量守恒的偏微分方程描述流域水循环过程,包括截留蒸发、地表径流、河道汇流、非饱和流和饱和带流5个部分。在水平面上流域可划分为结构化的矩形网格,各网格独立输入参数,然后通过水动力学方程描述各网格之间的水力联系;在垂直面上,将土壤划分为几个水平层,计算土壤水运动。叶尔羌河流域以融雪径流为主,实际的融雪一般从雪层内部开始,初期形成的融水具有壤中流特点,随着温度的继续升高,雪层表面才开始融化。融水下渗增加,聚集形成饱和含水带后渗出,部分沿地表汇流补给河道,部分下渗进入土壤层。MIKE SHE模型将降水分为降雨和降雪2种形式,降雨直接参与水循环,重点模拟地表径流和下渗后地下基流对河道的补给作用。降雪通过简单的度日因子溶雪计算后,形成融水再参与水分循环。本文将流域划分为2 km×2 km的网格,利用遥感数据驱动模型,模拟叶尔羌河流域2000-2009年的水文过程,其中2000-2002年为预热期,2003-2007年为率定期,2008-2009年为验证期。
在地形复杂的山区流域,站点对其相应泰森多变形区域的地形代表性较差,即使较为密集的站点插值也较难反映降水的空间分布(许宝荣等, 2015)。而熊喆等(2014)利用观测和遥感数据构建的黑河流域气候模式,在山地区域模拟中取得到了良好的分布式降水结果。受叶尔羌河流域极端地形和实测站点的限制,因此本文采用降水、温度和潜在蒸散发的遥感数据作为气象输入。为准确地描述流域的水文过程,将积雪覆盖的遥感数据用于模型验证。主要利用的数据如表1所示。
表1 叶尔羌河流域MIKE SHE 模型数据
Tab.1 Data used in the MIKE SHE model of the Yarkant River basin
| 数据 | 来源 | 分辨率 | 提供参数 |
|---|---|---|---|
| DEM | SRTM | 90 m×90 m | 地形、流域边界、河网水系 |
| 土地利用 | 基于2010年Landsat TM的解译 | .shp 文件 | 地表的植被覆盖类型 |
| 土壤类型 | HWSD | 500 m×500 m | 土壤类型及其属性 |
| 降水 | TRMM 3B42 V6 | 0.25°×0.25° | 日值的降水量 |
| 温度 | MODIS 11C1 | 0.05°×0.05° | 日值的平均地表温度 |
| 潜在蒸散发 | FEWS NET Data Portal | 0.5°×0.5° | 日值的潜在蒸散发量 |
| 积雪覆盖 | MODIS 10A2 | 500 m×500 m | 8天的最大积雪覆盖面 |
TRMM 3B42 V6数据利用实测站点数据在全球尺度上进行了校正,很大程度上降低了其系统偏差(胡庆芳等, 2013)。但是在叶尔羌河这样的高海拔山区,实测站点稀缺,TRMM数据的精度并不理想,特别是在日尺度上(季漩等, 2013)。根据塔什库尔干及周边皮山2个气象站点在2000-2009年的实测降水数据,对TRMM数据中降水事件(日降水量大于0.01 mm)的准确性进行了检验,如式(1)-(2)所示。
式中:Dr和Dw分别为TRMM测得降水事件的正确率和错误率;TRSBdec为TRMM和站点同时测得降水的天数(days);SBDdec为站点测得降水而TRMM没有测得降水的天数(days);TRMMdec为TRMM测得降水而站点没有测得降水的天数(days)。检验结果如表2所示,表明TRMM数据在叶尔羌河流域的精度并不理想,发生降水事件的频率高于实测站点。进一步分析发现,TRMM多测得的降水事件主要为小强度的降水(日降水量小于0.3 mm),TRMM数据对小强度降水事件的误判率Dw_0.3达到95%以上。
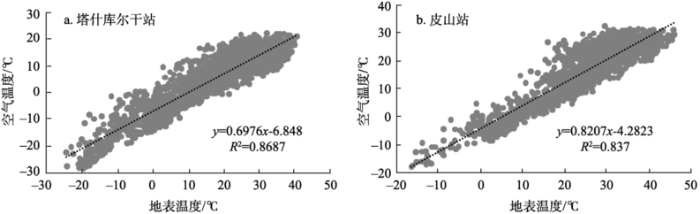
图2 MODIS地表温度与塔什库尔干(a)和皮山(b)站点实测空气温度线性回归图
Fig.2 Regression result of the MODIS surface temperature and air temperature observations at the Tashkurgan (a) and Pishan (b) stations
根据实测站点对TRMM数据的检验情况,本文选用了LOCI(local intensity scaling)(Schmidli et al, 2006)的方法对TRMM数据进行校正。LOCI可消除多余小降水事件,从降水频率和降水量上对原有数据进行修正,如式(3)-(4)所示。
式中:PSD, m和PTRMM.raw, m为站点和原始的TRMM在第m月的降水量(mm);PTRMM.cor, m为校正后TRMM在第m月的降水量(mm);μ(.)表示均值;sm为比例因子;Pthres为临界降水强度(mm)。临界降水强度用于保证降水频率与实测站点的一致性,根据表2的检验结果,本文确定为0.3 mm。通过校正后,TRMM降水数据的精度得到较大提升,在降水频率上与站点基本一致,月尺度上降水量与站点实测数据的相关系数也明显提高(Rraw和Rcor),年均降水量(PRETRMM, PRETRMM.cor)与实测年均降水量(PREOBS)更加接近,(表2)。最终sm和Pthres的修正参数应用到整个叶尔羌河流域上,对全流域内的TRMM降水数据进行修正。
本文选取的地表平均温度为在干旱及半干旱区有更好应用效果的MOD11C1 V4.1(Hulley et al, 2009)。但是MIKE SHE模型中需要输入的是空气温度,大量的研究(Prince et al, 1998; Cristóbal et al, 2008)已经表明,地表温度与空气温度间存在良好的线性关系。图2为 塔什库尔干和皮山站实测日平均空气温度与MODIS地表温度之间的线性回归图,也证明了两者之间良好的线性相关性。根据两个站点的线性回归方程,建立了MOD11C1 V4.1的转化方程式(5),得到MIKE SHE模型的温度数据。
表2 TRMM数据在叶尔羌河流域的精度检验及校正情况
Tab.2 Calibration and correction of the TRMM data in the Yarkant River basin
| 站点 | Dr | Dw | Dw_0.3 | Rraw | Rcor | PRETRMM | PRETRMM.cor | PREOBS |
|---|---|---|---|---|---|---|---|---|
| 塔什库尔干 | 0.54 | 0.75 | 0.95 | 0.26 | 0.56 | 210.95 | 111.03 | 94.57 |
| 皮山 | 0.15 | 0.88 | 0.99 | 0.36 | 0.67 | 40.25 | 49.46 | 54.28 |
式中:Tair为计算的空气温度(℃);LST为MODIS地表温度(℃)。
FEWS NET Data Portal的日潜在蒸散发数据从全球数据同化系统(Global Data Assimilation System)中提取6小时的空气温度、气压、风速、相对湿度和太阳辐射数据,采用经过联合国粮农组织标准化的Penman-Monteith公式计算每6小时的潜在蒸散发量(Reference Evapotranspiration),然后合成覆盖全球的日值数据。FEWS NET Data Portal的潜在蒸散发满足MIKE SHE模型的输入要求。
虽然MIKE SHE模型的参数具有明确的物理意义,理论上不需要进行率定。但现有的数据并不能满足模型完备性的需求,因此本文选定了MIKE SHE模型自动的Auto Calibration模块,采用SCE (Shuffled Complex Evolution)的算法,根据2003-2009年卡群站实测的日径流数据,对模型参数进行优化率定。根据不同水文过程的主要影响参数,选定的率定参数包括:地表水模块中的坡面曼宁系数(MAN),地下水模块中的横向及纵向水力渗透系数(HHC和VHC),积融雪模块中初始融雪温度(TMT)和度日融雪因子(DDF),土地利用模块中的叶面指数(LAI)和根区深度(RD)。由Nash-Sutcliffe系数NSC和相关系数R对率定效果进行评价,其计算表达式如式(6)-(7)所示。
式中:Qobs, i和Qsim, i分别为第i天实测和模拟的径流量(m3/s);
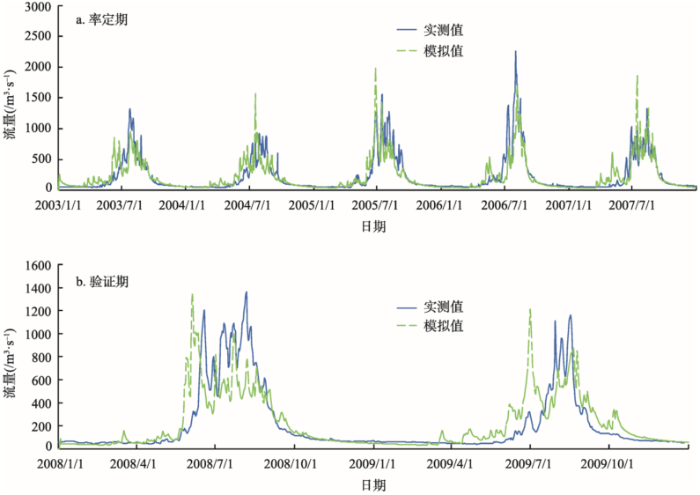
根据率定结果,得到模型参数的最优值DDF为2.01 mm/(d·℃),TMT为-0.98 ℃;MAN因不同的土地利用方式,取值为25~60;水力传导系数因不同的土壤类型而不同,HHC取值为0.0003~0.001 m/s,VHC取值为0.003~0.01 m/s;LAI和RD因不同的植被覆盖方式而不同,同时受植被的生长方式影响在年季间呈现周期性的变化。代入率定的参数值,得到卡群站的日径流模拟量,与实测径流的对比结果如图3所示。结果表明,MIKE SHE模型很好地模拟出了枯水期基流对河道的补给,而洪峰前期的4-5月,模拟值出现了较大的波动。6-9月的洪水期间,模拟值也基本抓住了洪峰的涨落过程,峰现时间都出现在7月底-8月中旬,多年平均相差4.3天。2003-2009年卡群站的多年平均径流量相对误差仅为0.12%,但是4-5月达到了70%,6-9月的相对误差为-7.2%。造成这种现象的原因是叶尔羌河流域以融雪径流补给为主,在MIKE SHE的融雪模块中,融雪因子是一个常数,削弱了不同季节融雪分布的差异,造成春夏交替4-5月融雪偏高。另外MIKE SHE不考虑雪表面的积温影响,融雪量由当天的空气温度决定,这就使得初期融雪随空气温度的波动较大,而不是一条较为平滑的上升曲线(Liu et al, 2016a)。从评价参数上看,率定期和验证期在日尺度上的NSC分别为0.71和0.67,R为0.84和0.85。总体上,经过校正后的TRMM降水数据、MODIS地表温度数据及遥感潜在蒸散发数据在叶尔羌河流域的应用中,对出山口径流的模拟是可行的。
图3 MIKE SHE 模型在率定期(a)和验证期(b)对卡群站的模拟流量与实测流量对比图
Fig.3 Comparison of the simulated and observed daily discharges at the Kaqun station in the calibration (a) and verification (b) periods
在自动率定中,模型通过参数调整来满足率定目标,而不同水文要素相互影响,单一的率定目标过程就会影响到模型对其他相关水文要素的描述(Liu et al, 2016b)。因此本文进一步地从径流、积雪和蒸散发3个方面分析模型对水文过程的描述。表3给出了水平衡控制下MIKE SHE对流域在不同季节对各水文要素的模拟量化值。根据MIKE SHE的模拟结果,叶尔羌河流域年均降水量为309.64 mm,积雪储存、河道径流补给和蒸散发耗散分别占15%、47%和38%左右。本文根据模型对各水文要素的输入,结合已有文献和遥感数据的验证,对叶尔羌河流域径流、融雪和蒸散发3个主要水文过程的时空分布进行分析。
表3 各水文要素在不同季节的模拟值
Tab.3 Simulated values of the hydrological components in different seasons
| 月份 | 总降水/mm | 降雪/mm | 融雪/mm | 储雪变化/mm | 地表径流/mm | 基流/mm | 实际蒸散发/mm |
|---|---|---|---|---|---|---|---|
| 3~5月 | 76.03 | 62.33 | 32.24 | 15.33 | 12.87 | 5.04 | 32.56 |
| 6~8月 | 145.57 | 88.90 | 112.74 | -29.49 | 75.45 | 13.68 | 59.73 |
| 9~11月 | 40.55 | 32.68 | 7.34 | 17.39 | 22.26 | 8.71 | 22.12 |
| 12~次年2月 | 47.49 | 47.03 | 0.24 | 43.41 | 4.73 | 3.94 | 4.32 |
| 年平均 | 309.64 | 230.93 | 152.56 | 46.64 | 115.30 | 31.36 | 118.72 |
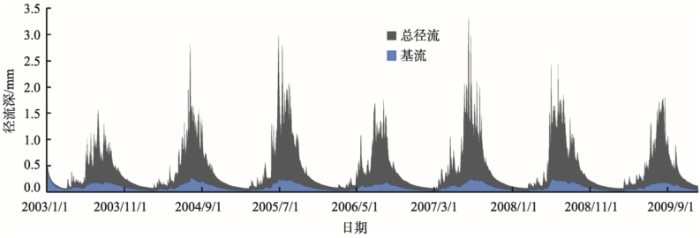
在MIKE SHE 模型中,地表水下渗进入非饱和区后,只考虑垂直方向的运动。进一步下渗到饱和区,通过耦合的MIKE 11,与河道水流发生交换,地下水作为基流补给河道。因此在MIKE SHE模型中,河道总径流包括地表径流和地下基流两部分,其分布如图4所示。图4表明,融雪季的地下基流高于非融雪季,冰雪融水对地下水具有补给作用。地下水基流对河道的补给是常年不间断的,贡献率为21.38%(表3),这保证了枯水期的河道径流。21.38%的基流贡献率也与Fan等(2013) 的研究成果(23%)接近,表明MIKE SHE模型在河道径流补给组成和分布上是可信的。
图4 基流和地表径流对河道补给的时间分布图
Fig.4 Temporal distribution of the base flow and surface flow contribution to stream flow
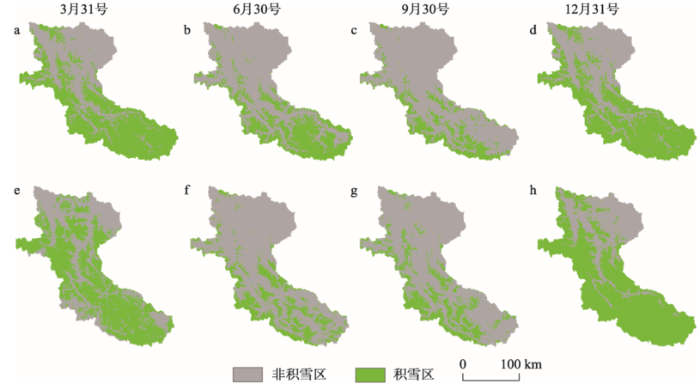
表3表明:6-8月为叶尔羌河流域的主要融雪季节,占全年融雪量的74%,在此期间,流域的储雪量也表现为消退,其他季节均表现为增长。为了尽量减少云层对遥感探测地表积雪分类的影响,结合在北疆地区积雪识别率达到88%的MOD10A2产品(黄晓东等, 2007)对MIKE SHE模拟的积雪输出的空间分布进行分析。由于MODIS产品对薄层积雪的识别能力很差(黄晓东等, 2007),因此本文将MIKE SHE输出的积雪深度在50 mm以上的网格定义为积雪面,其他为非积雪面。
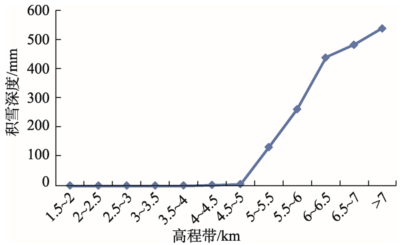
MIKE SHE模型的积雪输出与MOD10A2的对比如图5所示,结果表明,相对MOD10A2的积雪覆盖面积,MIKE SHE在4个不同时间节点上的相对误差分别为-3.1%、43%、-12.9%和-11.6%。根据MIKE SHE的模拟,5000 m以上区域的积雪消融主要发生7-8月,这就造成了6月底MIKE SHE模型在流域东南部5000~6000 m山区输出更多的积雪面(图5b)。图5表明,从总体上来看,MIKE SHE模拟的积雪及消融在时间和空间分布上,基本与遥感监测数据保持了一致的趋势。叶尔羌河流域不同高程带上的多年平均积雪如图6所示:叶尔羌河流域的终年积雪区域发生在5000 m以上高山区,雪线位于5000~5500 m之间,这与之前5400 m处的雪线研究成果一致(高鑫等, 2010)。雪线以上区域,积雪基本呈现直线的增长方式,这可能与MIKE SHE只关注积雪融化,而不关注风吹雪、雪崩等其他运移方式,积雪增长主要与降水增长相关原因有关。
图5 MIKE SHE (a-d)在不同时间节点的积雪覆盖面与MOD10A2(e-f)的对比图
Fig.5 Comparison of the snow covered area by MIKE SHE (a-d) and MOD10A2 (e-f) at the last day of March, June, September, and December
表4 MIKE SHE 模型对叶尔羌河流域不同蒸发类型的多年平均蒸发量模拟值
Tab.4 Simulated values of mean annual evaporation from different sources by the MIKE SHE model
| 蒸发类型 | 积雪升华 | 植被截留蒸发 | 水体蒸发 | 土壤水蒸发 | 植被蒸腾 |
|---|---|---|---|---|---|
| 蒸发量/mm | 31.4 | 17.6 | 37.1 | 13.9 | 18.72 |
图6 MIKE SHE 在不同高程带上的多年平均积雪深度变化图
Fig.6 The mean annual depth of snowpack in different elevation zones by the MIKE SHE model
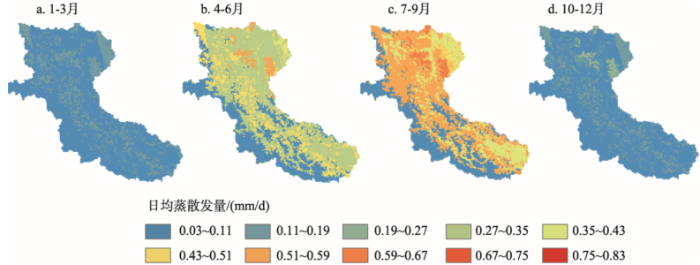
MIKE SHE模型采用Kristensen-Jensen算法,将流域的蒸散发分为积雪升华、植被截留蒸发、水体蒸发、土壤水蒸发、植被蒸腾5类进行模拟。模型输出的各类蒸发量如表4所示。由于模型在坡面汇流计算中,对汇流水体进行了蒸发计算,加之洼地形成,的滞洪区使得水面面积增大,进一步地增强了水体增发量,最终水体蒸发成为最主要的蒸发方式,占总蒸散发量的31.26%。其次,流域内积雪面广,雪面升华强烈,也占到总蒸散发量的26.45%。MIKE SHE模型对流域内不同季节日平均蒸散发量的空间分布如图7所示,从图中可以看出叶尔羌河流域的实际蒸散发量具有明显的季节性,7-9月为主要的蒸散发月份,占全年总量的45.53%,其次4-6月占全年总量的38.5%。从空间分布上看,植被覆盖良好的常绿针叶林为主要的蒸散发区域,年均蒸散发量大约为267 mm,主要以植被截留和蒸腾作用为主;其次为中低覆盖度的草地,年均蒸散发量为140 mm左右,流域东部的永久性积雪覆盖的高寒山脊区域,年均蒸发量仅为32 mm。
图7 MIKE SHE在不同季节对叶尔羌河流域日平均蒸散发量的模拟结果图
Fig.7 Spatial distribution of the simulated daily evaporation by the MIKE SHE model in different periods
本文以遥感数据为支撑,构建了全分布的MIKE SHE模型,对干旱区高海拔山区流域叶尔羌河的水文过程进行了探讨,得到了以下主要结论:(1) 通过校正后的遥感数据,在MIKE SHE模型应用中,很好地模拟出了出山口的流量过程,日尺度上的Nash-Sutcliffe系数在达到071,相关系数在0.85。
(2) 叶尔羌河流域有常年稳定的地下水基流补给,占河道径流的21%左右。
(3) MIKE SHE的积雪输出与MOD10A2在时空变化上基本一致,6-8月为流域的主要融雪季,期间流域积雪表现为消退,5000 m以上为流域的稳定积雪区。
(4) 流域以水体蒸发为主要的蒸发方式,占蒸散发总量的31.26%,空间分布上植被覆盖度良好的针叶林和草地为主要的蒸散发区域,集中在7-9月。
高寒山区流域由于特殊的地理环境,气象和水文要素的空间分布异质性更强,积雪、融雪和雪升华使得水循环过程更加复杂。加之实测站点稀少,使得准确把握流域水文过程的困难更大。空间分布的遥感数据为高寒山区水文模拟研究提供了良好的数据源,但在实际应用中,需要对数据的准确性进行评价,并选用适用的方法进行校正。依托模型输出分析水文过程时,要从多方面对模拟的水文要素进行验证分析,从而准确理解流域内水资源的转化、储存方式及时空分布,为下游水资源的管理提供依据。本文虽然以实测站点为基础,校正了遥感数据,但实测站点稀少,遥感数据的时空分布的精确度有待进一步验证,对于模型结果输出的对比和验证也需要进一步的分析研究。
The authors have declared that no competing interests exist.
| [10] |
黑河流域高分辨率区域气候模式建立及其对降水模拟验证 [J].
以中国科学院大气物理研究所东亚区域气候一环境重点实验室研制的区域环境集成系统模式为基础,采用黑河流域观测和遥感数据对模式中地形高度、植被类型、饱和土壤水势、饱和土壤导水率、田间持水量和萎点含水量、土壤孔隙度和土壤水势参数b等重要参数进行重新率定,进行模式本地化,建立适合黑河流域高分辨率区域气候模式,并且利用该模式对黑河流域进行了2000年连续积分模拟,重点考察了区域气候模式在水平分辨率为3km条件下对黑河流域降水模拟能力.结果表明:模式能够较好地模拟出黑河流域降水的年、季节空间分布特征和不同区域降水年变化.对于不同区域来说,上游地区模式模拟降水较观测偏多,中游和下游地区较观测偏少,降水偏差在-39.9%~9.06%之间,与IPCC2001报告中在区域尺度105~106km2上降水偏差为±50%较为一致;模式模拟黑河流域上游、中游和下游地区平均降水与观测之间对应的相关系数分别为0.8123,0.5064和0.7033,都通过99%置信度检验.其中黑河流域上游地区模拟最好,相关系数达到0.8123;该研究表明采用黑河流域高分辨率区域气候模式进行动力降尺度后,弥补了黑河流域观测站点少的缺陷,为水文模型评估与实现对流域水资源精细化管理和决策支持提供科学数据.
Building a high-resolution regional climate model for the Heihe River Basin and simulating precipitation over this region [J].
以中国科学院大气物理研究所东亚区域气候一环境重点实验室研制的区域环境集成系统模式为基础,采用黑河流域观测和遥感数据对模式中地形高度、植被类型、饱和土壤水势、饱和土壤导水率、田间持水量和萎点含水量、土壤孔隙度和土壤水势参数b等重要参数进行重新率定,进行模式本地化,建立适合黑河流域高分辨率区域气候模式,并且利用该模式对黑河流域进行了2000年连续积分模拟,重点考察了区域气候模式在水平分辨率为3km条件下对黑河流域降水模拟能力.结果表明:模式能够较好地模拟出黑河流域降水的年、季节空间分布特征和不同区域降水年变化.对于不同区域来说,上游地区模式模拟降水较观测偏多,中游和下游地区较观测偏少,降水偏差在-39.9%~9.06%之间,与IPCC2001报告中在区域尺度105~106km2上降水偏差为±50%较为一致;模式模拟黑河流域上游、中游和下游地区平均降水与观测之间对应的相关系数分别为0.8123,0.5064和0.7033,都通过99%置信度检验.其中黑河流域上游地区模拟最好,相关系数达到0.8123;该研究表明采用黑河流域高分辨率区域气候模式进行动力降尺度后,弥补了黑河流域观测站点少的缺陷,为水文模型评估与实现对流域水资源精细化管理和决策支持提供科学数据.
|
| [11] |
GIS支持下黑河流域降水台站的地形代表性 [J].Terrain representation for the precipitation stations in Heihe River Basin based on GIS [J]. |
| [12] |
基于MODIS数据的2000-2013年西昆仑山玉龙喀什河流域积雪面积变化 [J].https://doi.org/10.11820/dlkxjz.2014.03.003 Magsci 摘要
利用两种卫星影像合成并引入冰川积雪区的方法,对西昆仑山玉龙喀什河流域2000-2013 年MOD10A2积雪数据进行去云处理,分析不同海拔高度积雪的年内和年际变化特征及趋势,结合气象要素,分析其分布变化原因。结果表明:① 低山区(1650-4000 m)积雪年内变化为单峰型,补给期为冬季,而高山区(4000~6000 m)存在“平缓型”春季补给期和“尖峰型”秋季补给期两个峰值;② 就年际变化而言,低、高山区平均、最大积雪面积呈微弱增加趋势,高山区最小积雪面积显著增加,倾向率为65.877 km2/a;③ 就季节变化而言,春、夏、冬三季低、高山区积雪面积年际变化呈“增加—减少—增加”趋势,秋季高山区积雪面积则呈“增加—减少”趋势,而低山区积雪面积在2009 和2010 年异常偏大,其他年份面积变化不大;④ 在低山区,气温是影响春、夏两季积雪面积变化的主因,气温和降水对秋季积雪面积变化的影响相当,而冬季积雪面积变化对降水更敏感;在高山区,夏季积雪面积变化对气温更敏感,而冬、春季积雪面积变化主要受降水影响。
Snow cover area changes in the Yurungkax River Basin of West Kunlun Mountains during 2000-2013 using MODIS data [J].https://doi.org/10.11820/dlkxjz.2014.03.003 Magsci 摘要
利用两种卫星影像合成并引入冰川积雪区的方法,对西昆仑山玉龙喀什河流域2000-2013 年MOD10A2积雪数据进行去云处理,分析不同海拔高度积雪的年内和年际变化特征及趋势,结合气象要素,分析其分布变化原因。结果表明:① 低山区(1650-4000 m)积雪年内变化为单峰型,补给期为冬季,而高山区(4000~6000 m)存在“平缓型”春季补给期和“尖峰型”秋季补给期两个峰值;② 就年际变化而言,低、高山区平均、最大积雪面积呈微弱增加趋势,高山区最小积雪面积显著增加,倾向率为65.877 km2/a;③ 就季节变化而言,春、夏、冬三季低、高山区积雪面积年际变化呈“增加—减少—增加”趋势,秋季高山区积雪面积则呈“增加—减少”趋势,而低山区积雪面积在2009 和2010 年异常偏大,其他年份面积变化不大;④ 在低山区,气温是影响春、夏两季积雪面积变化的主因,气温和降水对秋季积雪面积变化的影响相当,而冬季积雪面积变化对降水更敏感;在高山区,夏季积雪面积变化对气温更敏感,而冬、春季积雪面积变化主要受降水影响。
|
| [13] |
|
| [14] |
Response of glacial-lake outburst floods to climate change in the Yarkant River Basin on northern slope of Karakoram Mountains, China [J].https://doi.org/10.1016/j.quaint.2010.01.003 URL 摘要
Based on the glacial flood events and climate change in the Yarkant River basin during the past 50 years, the study investigated the long-term change of temperature and precipitation, the characteristics of glacial floods, the origin of sudden flood release, the suggested flood mechanism of glacial lakes and the relationship between glacial floods and climate change. Results showed that there was an obvious increase in the temperature of the basin since 1987. Specifically in the mountainous area, the significantly increasing temperature in the summer and autumn seasons accelerated the melting rate of glaciers and caused glacial-lake burst. Sudden flood release occurred frequently. The frequency of glacial-lake outburst floods was 0.4 times/a during the period 1959–1986 and increased to 0.7 times/a during 1997–2006. Peak discharge also increased. There were seven floods with peak discharge over 400002m 3 /s from 1959–2006, and three occurred after 1997. The increasing frequency and magnitude of glacial outburst floods mirrored the effect of climate warming on glaciers.
|
| [15] |
Modeling air temperature through a combination of remote sensing and GIS data [J].https://doi.org/10.1029/2007JD009318 URL [本文引用: 1] 摘要
Air temperature is involved in many environmental processes such as actual and potential evapotranspiration, net radiation and species distribution. Ground meteorological stations provide important local data of air temperature, but a continuous surface for large and heterogeneous areas is also needed. In this paper we present a hybrid methodology between Remote Sensing and Geographical Information Systems to retrieve daily instantaneous, mean, maximum and minimum air temperatures (2002-2004) as well as monthly and annual mean, maximum and minimum air temperatures (2000-2005) on a regional scale (Catalonia, northeast of the Iberian Peninsula) by means of multiple regression analysis and spatial interpolation techniques. To perform multiple regression analysis we have used geographical and multiresolution remotely sensed variables as predictors. The geographical variables we have included are altitude, latitude, continentality and solar radiation. As remote sensing predictors, we have selected those variables that are most closely related with air temperature such as albedo, land surface temperature (LST) and NDVI obtained from Landsat-5 (TM), Landsat-7 (ETM+), NOAA (AVHRR) and TERRA (MODIS) satellites. The best air temperature models are obtained when remote sensing variables are combined with geographical variables: averaged R= 0.60 and averaged root mean square error (RMSE) = 1.75掳C for daily temperatures, and averaged R= 0.86 and averaged RMSE = 1.00掳C for monthly and annual temperatures. The results also show that combined models appear in a higher frequency than only geographical or only remote sensing models (87%, 11% and 2% respectively) and that LST and NDVI are the most powerful remote sensing predictors in air temperature modeling.
|
| [16] |
Variation of baseflows in the headstreams of the Tarim River Basin during 1960-2007 [J].https://doi.org/10.1016/j.jhydrol.2013.02.037 URL 摘要
The Tarim River is the largest inland river of China and a major water resource to the vast arid region in northwest China. For its four major headstreams, which contribute 98% of the Tarim River’s streamflow, we investigated the dynamics of baseflow in the past 5002years. The digital filtering method was used to separate baseflow from surface flow, after which the baseflow index (BFI) was calculated and analyzed. The major findings of this study include (1) Baseflows of the four headstreams have increased considerably over the past 5002years. The large baseflow index (BFI) usually occurred in the wet years but the change rate was irregular, because of the increasing recharge from snow and glacial meltwater. (2) The annual baseflow variation of the four headstreams appeared to have cycles of 3–502years, 10–1402years, and 2502years. (3) The baseflow and BFI showed obvious seasonal variation: The lowest baseflow and BFI typically occurred in December and January, and both increased gradually until the maximums reached in August or July. (4) The responses of runoff and baseflow to climatic factors were different. Precipitation possessed a great impact on runoff, whereas temperature possessed a great impact on baseflow. Baseflow is an important source to the Tarim River, and is affected by the increasing snow and glaciers melt as a result of temperature rise. For the four headstreams, we identified temperature thresholds in the time series of BFI and calculated regression relationships between temperature and BFI in the past 5002years. The thresholds and the regression relationships would help to assess and predict the impact of climate change on headwater inflow to the Tarim River.
|
| [17] |
Intercomparison of versions 4, 4.1 and 5 of the MODIS Land Surface Temperature and Emissivity products and validation with laboratory measurements of sand samples from the Namib desert, Namibia [J].https://doi.org/10.1016/j.rse.2009.02.018 URL [本文引用: 1] 摘要
Eight new refinements were implemented in the MODIS Land Surface Temperature and Emissivity (LST&E) product suite when transitioning from version 4 (V4) to version 5 (V5). The refinements were designed to improve the spatial coverage, stability, and accuracy of the product suite. Version 4.1 (V4.1) is an interim collection which uses V5 input products (MOD02, MOD03, MOD07, MOD10, and MOD35), but the LST&E retrieval algorithm is unchanged from V4 in which the split-window and day/night temperature retrieval algorithms are only partially incorporated, and not fully incorporated as in V5. A test dataset for the V4.1 product was produced by MODAPS for a 3-month period from July through September 2004, and after an initial evaluation period, it was decided to generate the V4.1 product from mission period 2007001 onwards as a continuation of previous years of V4 data. This paper compares MODIS retrieved surface emissivities between V4, V4.1 and V5 using the level-3 MODIS daily LST&E product, MOD11B1.Comparisons of MOD11B1 retrieved surface emissivity during the Jul鈥揝ep 2004 test period with lab measurements of sand samples collected at the Namib desert, Namibia result in a combined mean absolute emissivity difference for bands 29 (8.55碌m), 31 (11碌m) and 32 (12碌m) of 1.06%, 0.65% and 1.93% for V4, V4.1 and V5 respectively. Maximum band 29 emissivity differences with the lab results were 4.10%, 2.96% and 8.64% for V4, V4.1 and V5 respectively. These results indicate that over arid and semi-arid areas, users should consider using MODIS V4 or V4.1 data instead of V5. Furthermore, users should be careful not to develop time series from a mixture of product versions that could introduce artifacts at version boundaries.
|
| [18] |
a. Assessment of different modelling studies on the spatial hydrological processes in an arid alpine catchment [J].https://doi.org/10.1007/s11269-016-1249-2 URL [本文引用: 1] 摘要
To assess the model description of spatial hydrological processes in the arid alpine catchment, SWAT and MIKE SHE were jointly applied in Yarkant River basin located in northwest China. Not only the s
|
| [19] |
b. Response of hydrological processes to input data in high alpine catchment: An assessment of the Yarkant River Basin in China [J].https://doi.org/10.3390/w8050181 URL [本文引用: 1] 摘要
Most studies of input data used in hydrological models have focused on flow; however, point discharge data negligibly reflect deviations in spatial input data. To study the effects of different input data sources on hydrological processes at the catchment scale, eight MIKE SHE models driven by station-based data (SBD) and remote sensing data (RSD) were implemented. The significant influences of input variables on water components were examined using an analysis of the variance model (ANOVA) with the hydrologic catchment response quantified based on different water components. The results suggest that compared with SBD, RSD precipitation resulted in greater differences in snow storage in the different elevation bands and RSD temperatures led to more snowpack areas with thinner depths. These changes in snowpack provided an appropriate interpretation of precipitation and temperature distinctions between RSD and SBD. For potential evapotranspiration (PET), the larger RSD value caused less plant transpiration because parameters were adjusted to satisfy the outflow. At the catchment scale, the spatiotemporal distributions of sensitive water components, which can be defined by the ANOVA model, indicate that this approach is rational for assessing the impacts of input data on hydrological processes.
|
| [1] |
中国高寒区水文学中的一些认识和参数 [J].
针对中国高寒区水文数据和参数缺乏、机理不清的现状,应用祁连山葫芦沟寒区水文小流域观测数据及相关研究成果,率定并获取了高寒区水文模拟中的几个关键参数:①降水观测误差校正系数及公式;②固液态降水分离的临界气温;③高寒灌丛降水截留参数;④土壤完全冻结温度;⑤积雪消融的临界气温。认识到若全球变暖引起植被带上移,则山区流域蒸散/降水比例增大、径流系数必然减小;现有降水数据难以满足高寒区水文模拟的需要,降水截留模拟有待改进,冰川、积雪消融缺乏高精度简单估算方法;长时间水文模拟中必须考虑风吹雪、冻土类型演替及冻结深度变化,以及冰川运动和体积变化;需加强冻结层下水、积雪升华和冰川汇流观测试验研究。
Some knowledge on and parameters of China's alpine hydrology [J].
针对中国高寒区水文数据和参数缺乏、机理不清的现状,应用祁连山葫芦沟寒区水文小流域观测数据及相关研究成果,率定并获取了高寒区水文模拟中的几个关键参数:①降水观测误差校正系数及公式;②固液态降水分离的临界气温;③高寒灌丛降水截留参数;④土壤完全冻结温度;⑤积雪消融的临界气温。认识到若全球变暖引起植被带上移,则山区流域蒸散/降水比例增大、径流系数必然减小;现有降水数据难以满足高寒区水文模拟的需要,降水截留模拟有待改进,冰川、积雪消融缺乏高精度简单估算方法;长时间水文模拟中必须考虑风吹雪、冻土类型演替及冻结深度变化,以及冰川运动和体积变化;需加强冻结层下水、积雪升华和冰川汇流观测试验研究。
|
| [20] |
On the usefulness of remote sensing input data for spatially dis-tributed hydrological modelling: Case of the Tarim River Basin in China [J].https://doi.org/10.1002/hyp.8129 URL Magsci 摘要
The ecological situation of the Tarim River basin in China seriously declined since the early 1950s, mainly due to a strong increase in water abstraction for irrigation purposes. To restore the ecological system and support sustainable development of the Tarim River basin region in China, more hydrological studies are demanded to properly understand the processes of the watershed and efficiently manage the water resources. Such studies are, however, complicated due to the limited data availability, especially in the mountainous headwater regions of the Tarim River basin. This study investigated the usefulness of remote sensing (RS) data to overcome that lack of data in the spatially distributed hydrological modelling of the basin. Complementary to the conventional station-based (SB) data, the RS products that are directly used in this study include precipitation, evapotranspiration and leaf area index. They are derived from raw image data of the Chinese Fengyun meteorological satellite and from the Moderate Resolution Imaging Spectroradiometer (MODIS). The MODIS land surface temperature was used to calculate the atmospheric temperature lapse rate to describe the temperature dependency on topographical variations. Moreover, MODIS-based snow cover images were used to obtain model initial conditions and as validation reference for the snow model component. Comparison of model results based on RS input versus conventional SB input exhibited similar results in terms of high and low river runoff extremes, cumulative runoff volumes in both runoff and snow melting seasons and spatial and temporal variability of snow cover. During summer time, when the snow cover shrinks in the permanent glacier region, it was found that the model resolution influences the model results dramatically, hence, showing the importance of detailed (RS based) spatially distributed input data. Copyright 漏 2011 John Wiley & Sons, Ltd.
|
| [21] |
Climate and energy exchange at the snow surface in the alpine region of the sierra Nevada: 1. Meteorological measurements and monitoring [J]. |
| [2] |
西北干旱区气候变化对水文水资源影响研究进展 [J].https://doi.org/10.11821/dlxb201409005 URL Magsci 摘要
西北干旱区是对全球变化响应最敏感地区之一,研究分析全球变暖背景下的西北干旱区水资源问题,对应对和适应未来气候变化带来的影响具有重要意义.本文通过对西北干旱区气候变暖影响下的水资源形成、转化与水循环等关键问题最新研究成果的总结分析,得出如下结论:(1) 西北干旱区温度、降水在过去的50 年出现过"突变型"升高,但进入21 世纪,温度和降水均处于高位震荡,升高趋势减弱;(2) 西北干旱区冬季温度的大幅升高是拉动年均温度抬升的重要原因,而西伯利亚高压活动和二氧化碳排放是引起冬季升温的重要影响因素;(3) 西北干旱区蒸发潜力在1993 年出现了一个明显的转折变化,由显著下降逆转为显著上升的趋势.气候变暖、蒸发水平增大对西北干旱区生态效应的负作用已经凸显;(4) 西北干旱区冰川变化对水资源量及年内分配产生了重要影响,部分河流已经出现冰川消融拐点.在塔里木河流域,冰川融水份额较大(50%),可能在未来一段时期,河川径流还将处在高位状态波动.全球气候变暖在加大极端气候水文事件发生频率和强度的同时,加剧了西北干旱区内陆河流域的水文波动和水资源的不确定性.
Research progress on the impact of climate change on water resources in the arid region of Northwest China [J].https://doi.org/10.11821/dlxb201409005 URL Magsci 摘要
西北干旱区是对全球变化响应最敏感地区之一,研究分析全球变暖背景下的西北干旱区水资源问题,对应对和适应未来气候变化带来的影响具有重要意义.本文通过对西北干旱区气候变暖影响下的水资源形成、转化与水循环等关键问题最新研究成果的总结分析,得出如下结论:(1) 西北干旱区温度、降水在过去的50 年出现过"突变型"升高,但进入21 世纪,温度和降水均处于高位震荡,升高趋势减弱;(2) 西北干旱区冬季温度的大幅升高是拉动年均温度抬升的重要原因,而西伯利亚高压活动和二氧化碳排放是引起冬季升温的重要影响因素;(3) 西北干旱区蒸发潜力在1993 年出现了一个明显的转折变化,由显著下降逆转为显著上升的趋势.气候变暖、蒸发水平增大对西北干旱区生态效应的负作用已经凸显;(4) 西北干旱区冰川变化对水资源量及年内分配产生了重要影响,部分河流已经出现冰川消融拐点.在塔里木河流域,冰川融水份额较大(50%),可能在未来一段时期,河川径流还将处在高位状态波动.全球气候变暖在加大极端气候水文事件发生频率和强度的同时,加剧了西北干旱区内陆河流域的水文波动和水资源的不确定性.
|
| [22] |
Precipitation retrieval from space: An overview [J].https://doi.org/10.1016/j.crte.2010.01.004 URL 摘要
During the last decade, satellite observations have allowed significant advances in quantifying precipitation, especially with the contribution of the TRMM mission. Observations at different wavelengths (visible, infrared, and microwaves), in both active and passive microwave modes, are analyzed, and eventually coupled to produce records of precipitation estimates over the globe, with up to hourly time sampling. This article provides an overview of the techniques, the results and the perspectives.
|
| [23] |
Inference of surface and air temperature, atmospheric precipitable water and vapor pressure deficit using advanced very high-resolution radiometer satellite observations: Comparison with field observations [J].
|
| [24] |
Downscaling from GCM precipitation: A benchmark for dynamical and statistical downscaling methods [J].https://doi.org/10.1002/joc.1287 URL 摘要
Abstract A precipitation downscaling method is presented using precipitation from a general circulation model (GCM) as predictor. The method extends a previous method from monthly to daily temporal resolution. The simplest form of the method corrects for biases in wet-day frequency and intensity. A more sophisticated variant also takes account of flow-dependent biases in the GCM. The method is flexible and simple to implement. It is proposed here as a correction of GCM output for applications where sophisticated methods are not available, or as a benchmark for the evaluation of other downscaling methods. Applied to output from reanalyses (ECMWF, NCEP) in the region of the European Alps, the method is capable of reducing large biases in the precipitation frequency distribution, even for high quantiles. The two variants exhibit similar performances, but the ideal choice of method can depend on the GCM/reanalysis and it is recommended to test the methods in each case. Limitations of the method are found in small areas with unresolved topographic detail that influence higher-order statistics (e.g. high quantiles). When used as benchmark for three regional climate models (RCMs), the corrected reanalysis and the RCMs perform similarly in many regions, but the added value of the latter is evident for high quantiles in some small regions. Copyright 漏 2006 Royal Meteorological Society.
|
| [25] |
Calibration of hydrological models in ungauged basins based on satellite radar altimetry observations of river water level [J].https://doi.org/10.1002/hyp.8429 URL [本文引用: 1] 摘要
This paper proposes a new orientation to address the problem of hydrological model calibration in ungauged basin. Satellite radar altimetric observations of river water level at basin outlet are used to calibrate the model, as a surrogate of streamflow data. To shift the calibration objective, the hydrological model is coupled with a hydraulic model describing the relation between streamflow and water stage. The methodology is illustrated by a case study in the Upper Mississippi Basin using TOPEX/Poseidon (T/P) satellite data. The generalized likelihood uncertainty estimation (GLUE) is employed for model calibration and uncertainty analysis. We found that even without any streamflow information for regulating model behavior, the calibrated hydrological model can make fairly reasonable streamflow estimation. In order to illustrate the degree of additional uncertainty associated with shifting calibration objective and identifying its sources, the posterior distributions of hydrological parameters derived from calibration based on T/P data, streamflow data and T/P data with fixed hydraulic parameters are compared. The results show that the main source is the model parameter uncertainty. And the contribution of remote sensing data uncertainty is minor. Furthermore, the influence of removing high error satellite observations on streamflow estimation is also examined. Under the precondition of sufficient temporal coverage of calibration data, such data screening can eliminate some unrealistic parameter sets from the behavioral group. The study contributes to improve streamflow estimation in ungauged basin and evaluate the value of remote sensing in hydrological modeling. Copyright 漏 2011 John Wiley & Sons, Ltd.
|
| [3] |
遥感技术在水文学中的应用于研究进展 [J].https://doi.org/10.3321/j.issn:1001-6791.2001.04.020 URL Magsci [本文引用: 1] 摘要
从遥感技术在水文学中的直接和间接应用两个方面,详细阐述了遥感技术在洪水过程实时动态监测、水域面积、冰川/积雪水文、降水、区域蒸发、土壤水分、径流和水文模型、水质等领域的应用和研究进展,继而对遥感和地理信息系统在水文学中的联合应用问题进行了讨论.
Advances in Applications of remote sensing data to hydrology [J].https://doi.org/10.3321/j.issn:1001-6791.2001.04.020 URL Magsci [本文引用: 1] 摘要
从遥感技术在水文学中的直接和间接应用两个方面,详细阐述了遥感技术在洪水过程实时动态监测、水域面积、冰川/积雪水文、降水、区域蒸发、土壤水分、径流和水文模型、水质等领域的应用和研究进展,继而对遥感和地理信息系统在水文学中的联合应用问题进行了讨论.
|
| [26] |
Food security and agricultural structural adjustment in Yarkant River Basin, Northwest China [J].URL 摘要
Abstract This paper presents an analysis of the cultivated pressure and the benefit of cultivated land in Yarkant River Basin. Minimum area and deficits/ surplus of cultivated land are used to describe the cultivated pressure, and reasonable range of agricultural structural adjustment is discussed under food security baseline. The results show that the cultivated land area of the Yarkant River Basin increased in 1978-2009, following per capita cultivated land area declined, while it showed an icreased warily of cultivated surplus in this basin, which is varied in different counties. The structure of land use affects its benefit, that the higher the percentage of grain crops sown area, the lower the per capita agricultural gross output value and annual per capita net income of rural households. It is effectively increasing agricultural output to adjust the agricultural structure and reduce the percentage of grain crops sown area. Considering the control of cultivated land and the requirement of stock consumption ratio in more than 30%, the minimum percentage of grain crops sown area of this basin in 2015 and 2020 is predicted, which are both lower than that in 2009. The differences among counties lead to the rationally readjust of the predicted values. The implementation of grain growing subsidies policy should strengthen to improve the enthusiasm of farmers to expand the area of grain crops.
|
| [27] |
Climate changes and their impacts on water resources in the arid regions: A case study of the Tarim River Basin, China [J].https://doi.org/10.1007/s00477-009-0324-0 URL [本文引用: 2] 摘要
Streamflow series of five hydrological stations were analyzed with aim to indicate variability of water resources in the Tarim River basin. Besides, impacts of climate changes on water resources were investigated by analyzing daily precipitation and temperature data of 23 meteorological stations covering 1960鈥2005. Some interesting and important results were obtained: (1) the study region is characterized by increasing temperature, however, only temperature in autumn is in significant increasing trend; (2) precipitation changes present different properties. Generally, increasing precipitation can be detected. However, only the precipitation in the Tienshan mountain area is in significant increasing trend. Annual streamflow of major rivers of the Tarim River basin are not in significant trends, except that of the Akesu River which is in significantly increasing trend. Due to the geomorphologic properties of the Tienshan mountain area, precipitation in this area demonstrates significant increasing trend and which in turn leads to increasing streamflow of the Akesu River. Due to the fact that the sources of streamflow of the rivers in the Tarim River basin are precipitation and melting glacial, both increasing precipitation and accelerating melting ice has the potential to cause increasing streamflow. These results are of practical and scientific merits in basin-scale water resource management in the arid regions in China under the changing environment.
|
| [4] |
中国西北干旱地区的水资源 [J].Magsci 摘要
据统计,在中国西北干旱地区供开发利用的河川径流资源约为140KM3,山前平原地区还有与地表水不重复的地下水资源11KM3,流出境外的河川径流资源为56.5KM3,目前状况区内总用水量已达62.6KM3。从现状分析,水资源利用已进入紧缺状态,因此从现在起,水资源利用不仅要促进区域经济发展、而且还要保护和改善环境。为此建议采取协调水资源利用的经济效益和生态环境效益,开展以流域为单元的水资源合理利用和管理,建设和优化绿洲生态系统,开展节水,保障区内生态林草和人工造林用。
Water resources in the arid zone of Northwest China [J].Magsci 摘要
据统计,在中国西北干旱地区供开发利用的河川径流资源约为140KM3,山前平原地区还有与地表水不重复的地下水资源11KM3,流出境外的河川径流资源为56.5KM3,目前状况区内总用水量已达62.6KM3。从现状分析,水资源利用已进入紧缺状态,因此从现在起,水资源利用不仅要促进区域经济发展、而且还要保护和改善环境。为此建议采取协调水资源利用的经济效益和生态环境效益,开展以流域为单元的水资源合理利用和管理,建设和优化绿洲生态系统,开展节水,保障区内生态林草和人工造林用。
|
| [5] |
1961-2006年叶尔羌河上游流域冰川融水变化及其对径流的影响 [J].
叶尔羌河是塔里木河的主源之一,发源于喀喇昆仑山北坡,冰川融水是其主要补给.以叶尔羌河流域库鲁克栏杆水文站以上流域国家气象台站的月降水与月气温资料、90 m分辨率的数字高程模型(DEM)以及1970年代的冰川分布矢量数据为基础,利用冰川度日因子融水径流模型重建了叶尔羌河上游流域平均冰川物质平衡、冰川融水径流序列,分析了叶尔羌河上游流域冰川融水径流变化的特征、趋势及其对河流径流的影响.结果表明:1961—2006年流域冰川平均年物质平衡为-163.1 mm,累积物质平衡为-7.5 m,平衡线平均海拔为5 395.7 m.1991年之后流域冰川物质平衡呈显著负平衡,平均年物质平衡为-301.2 mm,1991—2006年与1961—1990年相比平衡线平均高度上升了64.2 m.1961—2006年流域年平均冰川融水径流深为807.7 mm,冰川融水对河流径流的补给比重为51.3%;2000年之后冰川融水对河流径流的补给比重增大到63.3%,与多年平均值相比冰川融水对河流径流的贡献在2000年后明显增大.
Glacier runoff change in the upper stream of Yarkant River and its impact on river runoff during 1961-2006 [J].
叶尔羌河是塔里木河的主源之一,发源于喀喇昆仑山北坡,冰川融水是其主要补给.以叶尔羌河流域库鲁克栏杆水文站以上流域国家气象台站的月降水与月气温资料、90 m分辨率的数字高程模型(DEM)以及1970年代的冰川分布矢量数据为基础,利用冰川度日因子融水径流模型重建了叶尔羌河上游流域平均冰川物质平衡、冰川融水径流序列,分析了叶尔羌河上游流域冰川融水径流变化的特征、趋势及其对河流径流的影响.结果表明:1961—2006年流域冰川平均年物质平衡为-163.1 mm,累积物质平衡为-7.5 m,平衡线平均海拔为5 395.7 m.1991年之后流域冰川物质平衡呈显著负平衡,平均年物质平衡为-301.2 mm,1991—2006年与1961—1990年相比平衡线平均高度上升了64.2 m.1961—2006年流域年平均冰川融水径流深为807.7 mm,冰川融水对河流径流的补给比重为51.3%;2000年之后冰川融水对河流径流的补给比重增大到63.3%,与多年平均值相比冰川融水对河流径流的贡献在2000年后明显增大.
|
| [6] |
赣江流域TRMM降水数据的误差特征与成因 [J].
阐明TRMM 3 B42V6(Tropical rainfall measuring mission 3 B42 version 6)的误差特征及成因,对于合理使用该卫星降水数据,并完善其降水反演算法具有重要意义.在赣江流域0.25°×0.25°空间尺度上,对比了TRMM 3B42V6、TRMM 3B42RTV6和CMORPH的精度特征.结果表明,3B42V6的系统偏差远低于3B42RTV6、CMORPH,但平均绝对值偏差、效率系数和探测率均明显劣于CMORPH.TRMM 3B42V6的系统偏差较低的原因主要在于该数据采用地面月降水量进行了校准,而其绝对值偏差、效率系数和探测率明显劣于CMORPH的主要原因在于所采用的热红外/被动微波降水联合反演算法不及后者有效.今后有必要对TRMM 3B42的精度进行全面评估,并改进该数据的热红外/微波降水反演算法及与地面降水信息的融合算法.
Characteristics and sources of errors in daily TRMM precipitation product over Ganjiang River Basin in China [J].
阐明TRMM 3 B42V6(Tropical rainfall measuring mission 3 B42 version 6)的误差特征及成因,对于合理使用该卫星降水数据,并完善其降水反演算法具有重要意义.在赣江流域0.25°×0.25°空间尺度上,对比了TRMM 3B42V6、TRMM 3B42RTV6和CMORPH的精度特征.结果表明,3B42V6的系统偏差远低于3B42RTV6、CMORPH,但平均绝对值偏差、效率系数和探测率均明显劣于CMORPH.TRMM 3B42V6的系统偏差较低的原因主要在于该数据采用地面月降水量进行了校准,而其绝对值偏差、效率系数和探测率明显劣于CMORPH的主要原因在于所采用的热红外/被动微波降水联合反演算法不及后者有效.今后有必要对TRMM 3B42的精度进行全面评估,并改进该数据的热红外/微波降水反演算法及与地面降水信息的融合算法.
|
| [7] |
北疆牧区MODIS积雪产品MOD10A1和MOD10A2的精度分析与评价 [J].
以北疆为研究区,结合气象台站记录的雪情数据,利用地理信息系统方法分析了2004年12月1日至2005年2月28日期间北疆地区90个时相的MODIS每日积雪产品MOD10A1和8日合成产品MOD10A2的积雪分类精度.研究表明:1)当积雪深度≤3 cm时,MOD10A1对积雪的识别率非常低,仅为7.5%;积雪深度为4~6 cm时,积雪识别率达到29.3%;积雪深度为15~20 cm,平均积雪识别率达到45.6%.当积雪深度>20 cm时,平均积雪识别率为32.2%;2)MOD10A1产品的积雪分类精度受天气状况的严重影响.在晴空状况下,该产品的最大积雪识别率达到58.2%;但是在多云或阴天时,平均积雪识别率仅为17.8%;3)下垫面对MOD10A1的分类结果也会造成影响,在荒漠区MOD10A1的积雪识别率为39.8%,在草原和稀树草原区的积雪识别率为37.2%,农业用地的积雪识别率最低,为29.1%;4)MOD10A2产品可较好的消除云层对地表积雪分类精度的影响,平均积雪识别率达87.5%,可较好的反映地表积雪的分布状况.
Accuracy analysis for MODIS snow products of MOD10A1 and MOD10A2 in Northern Xinjiang Area [J].
以北疆为研究区,结合气象台站记录的雪情数据,利用地理信息系统方法分析了2004年12月1日至2005年2月28日期间北疆地区90个时相的MODIS每日积雪产品MOD10A1和8日合成产品MOD10A2的积雪分类精度.研究表明:1)当积雪深度≤3 cm时,MOD10A1对积雪的识别率非常低,仅为7.5%;积雪深度为4~6 cm时,积雪识别率达到29.3%;积雪深度为15~20 cm,平均积雪识别率达到45.6%.当积雪深度>20 cm时,平均积雪识别率为32.2%;2)MOD10A1产品的积雪分类精度受天气状况的严重影响.在晴空状况下,该产品的最大积雪识别率达到58.2%;但是在多云或阴天时,平均积雪识别率仅为17.8%;3)下垫面对MOD10A1的分类结果也会造成影响,在荒漠区MOD10A1的积雪识别率为39.8%,在草原和稀树草原区的积雪识别率为37.2%,农业用地的积雪识别率最低,为29.1%;4)MOD10A2产品可较好的消除云层对地表积雪分类精度的影响,平均积雪识别率达87.5%,可较好的反映地表积雪的分布状况.
|
| [8] |
TRMM降水数据在中天山区域的精度评估分析 [J].Magsci 摘要
遥感降水产品能反映降水的时空分布变化,对于资料稀缺的西北干旱区生态水文研究有重大意义。TRMM卫星降水资料在热带湿润地区有大量应用,但要将其用于我国西北干旱半干旱气候地区,还需对该数据产品在质量进行评估。选择干旱区内陆的新疆天山中部为研究区,并以周边15个台站的实测数据为依据对TRMM3B42降水数据质量进行评价。结果表明:(1)TRMM3B42数据对日降水事件的估计准确率较低,但是总体上暖季好于冷季,相对于较大的降水,对发生量小的降水估计更为准确;在暖季高估量小降水,低估量大降水,冷季则相反;(2)月降水情况来看,天山南坡两站与北坡的规律不符;对北坡山区降水估计的精度好于平原区,并且精度与海拔呈抛物线分布,降水越大的区域精度越高;偏差量的年内分布在各海拔区域之内一致性较好,但区域之间规律各有特点;(3)从年降水量来看,TRMM降水整体低于站点观测值,并且差量随着高程具有抛物线分布的特征。总之,该降水产品的质量总体上不高,但是其偏差在时间和空间上具有一定的规律性,该数据在干旱区的应用需要进一步校准处理。
Quality assessment of the TRMM precipitation data in Mid Tianshan Mountains [J].Magsci 摘要
遥感降水产品能反映降水的时空分布变化,对于资料稀缺的西北干旱区生态水文研究有重大意义。TRMM卫星降水资料在热带湿润地区有大量应用,但要将其用于我国西北干旱半干旱气候地区,还需对该数据产品在质量进行评估。选择干旱区内陆的新疆天山中部为研究区,并以周边15个台站的实测数据为依据对TRMM3B42降水数据质量进行评价。结果表明:(1)TRMM3B42数据对日降水事件的估计准确率较低,但是总体上暖季好于冷季,相对于较大的降水,对发生量小的降水估计更为准确;在暖季高估量小降水,低估量大降水,冷季则相反;(2)月降水情况来看,天山南坡两站与北坡的规律不符;对北坡山区降水估计的精度好于平原区,并且精度与海拔呈抛物线分布,降水越大的区域精度越高;偏差量的年内分布在各海拔区域之内一致性较好,但区域之间规律各有特点;(3)从年降水量来看,TRMM降水整体低于站点观测值,并且差量随着高程具有抛物线分布的特征。总之,该降水产品的质量总体上不高,但是其偏差在时间和空间上具有一定的规律性,该数据在干旱区的应用需要进一步校准处理。
|
| [9] |
2009年喀喇昆仑山叶尔羌河冰川阻塞湖及冰川跃动监测 [J].Monitoring on ice-dammed lake and related surging glaciers in Yarkant River, Karakorum in 2009 [J]. |

/
| 〈 |
|
〉 |
