刘飞 , 郑新奇, 黄晴
中国地质大学(北京)信息工程学院,北京100083
LIU Fei, ZHENG Xinqi, HUANG Qing
通讯作者:
版权声明: 2017 地理科学进展 《地理科学进展》杂志 版权所有
基金资助:
作者简介:
作者简介:刘飞(1989- ),男,博士生,主要研究方向为地理分形与自组织, E-mail:liufei@escience.cn。
展开
摘要
城市群是城市地理学的重要研究领域,对城市群的实体空间进行界定识别是研究城市群的前提和基础。城市群作为众多城镇的集群,前人对城市群的空间识别主要是以城市为单元进行的,缺少对识别单元空间形态的考虑。城市群实体空间的形态具有自相似性,空间分形特征可作为自相似性的表征工具,通过对空间分形特征的分析、识别及提取,可以实现对空间对象基于形态的客观测度。本文借鉴单个城市其边界的相关识别方法,从不同尺度的空间最小可识别单元出发,测度城市群城镇空间形态的分形特征,并据此提出了城市群城镇的客观识别方法。该方法利用城镇的空间分形特征识别归属于城市群的城镇,通过空间最小可识别单元的变化得到不同的城镇规模并获取城市群城镇的空间分形特征,再以此为基础对空间分形特征的存在范围进行识别,将其映射于空间最终实现对城市群城镇的识别,进而得到城市群在空间上的分布状况。本文将该方法应用于京津冀城市群,基于2016年Landsat卫星遥感影像,实现了对京津冀城市群构成城镇的识别,为界定城市群的实体空间提供了一次有益尝试。
关键词:
Abstract
Urban system study is an important field of urban geography. Identification of the physical space of urban systems is a precondition and basis for the research on urban systems. Existing research on urban system identification primarily took city as the minimum unit since urban systems are aggregations of towns and cities. They determine whether a city belong to an urban system through the comparison between values of selected indicators and the criteria set by subjective estimates, which unfortunately lacks consideration of spatial morphology. The morphology of the physical space of urban systems has self-similarity, which can be expressed by the feature of fractal. Through the analysis, identification, and extraction of fractals we can describe the spatial objects objectively based on morphology. In this study, by referencing the experience in identifying boundary of individual cities by fractal, we measured the spatial fractal feature of towns of urban systems from the perspective of spatially identifiable minimum unit at different scales, and proposed a method to identify the towns of urban systems. Through the change of identifiable minimum unit we obtained different scales of towns by which we derive their spatial fractal feature. Then, the range of spatial fractal features was identified, and the identification of urban systems that is the spatial distribution of urban systems was achieved by mapping the range to the space. Finally, this study applied the method to the Beijing-Tianjin-Hebei urban system and achieved the identification of the system based on Landsat images in 2016.
Keywords:
城市群是城镇间的空间联系发展到一定阶段而形成的城镇体系,其实体空间可以看作是由城镇构成的集群,是城市群的客观存在,只有有效地界定城市群的实体空间并获取其空间分布状况,才能对城市群开展有效的统计并进行研究,因此明确城市群的实体空间是开展城市群研究的前提和基础。然而,城市群的复杂性和开放性,使得其实体空间具有模糊性界定困难(姚士谋等, 2006),如何实现城市群的空间识别是目前城市地理学中面临的问题之一。
在城市地理学领域,有关实体空间识别的研究已有众多成果,但大多是针对单个城市的边界识别,对于城市群实体空间的识别并不太多。已有研究对城市群实体空间的识别大体可分为三类:一是直接以行政区域作为城市群的空间,因而划定的城市群空间与城市群的实际存在范围并不相符(陈群元等, 2010),且忽视了邻接城镇作为城市群组成部分的可能(潘竟虎等, 2014; 王成龙等, 2016);二是设定判别指标及判别标准,分别计算并判断各城市的对应指标是否符合城市群成员的标准(方创琳, 2009; 黄金川等, 2014)。虽然这一方法较为成熟,但却忽视了城市部分空间构成城市群的可能,且指标的选择及标准的设定带有主观色彩;三是先遴选城市群中心城市,再采用模型计算周围城市与中心城市的联系强弱,以此判断周边城市是否构成城市群,主要代表模型有引力模型、断裂点模型、场强模型、Voronoi图模型等(Martin, 1998; Mu et al, 2006; 李震等, 2006; Fragkias et al, 2009; 陈群元等, 2010),虽然考虑了城市的空间分布及城市间的相互作用,结果较贴近实际,但应用于模型计算的指标及判定依据的选择同样无法避免主观因素的干扰,同时模型的理论依托、测度方法缺乏科学依据,难以得到普遍认可。由此不难看出,已有的城市群空间识别研究均以城市为研究单元,将城市群的空间识别等同于对城市是否归属城市群的判别,界线过于生硬,忽视了研究单元部分空间归属城市群的可能;同时,识别方法大都属于基于各项统计指标计算后的判别,统计指标的选择、判别标准的制定都具有较强的主观片面性和随意性,更无法真实地获得在空间上连续的指标,不能客观地刻画城市群实体空间。
与传统的离散型统计指标不同,分形作为贴近自然的描述语言逐渐为越来越多的人所关注,空间分形特征是连续型地理空间对象自相似形态的有效表征,通过对空间分形特征的分析、识别及提取,可实现对空间对象基于形态的客观测度。就单一城市的空间识别而言,近年来有学者进行了一些从城市形态学的角度出发,利用城市形态的空间分形特征划定城市空间边界的尝试。Rozenfeld等(2008, 2011)提出了城市集群算法;Tannier等(2011)提出了基于城市分形特征,利用多项式拟合,寻找最大偏离点的城市边界识别方法;Tannier等(2013)基于城市内部集群(组成城市的集群而非城市组成的集群)的识别方法,同时选取不同分形和非分形指征,分别对城市的不同理论形态和实际形态进行分析;谭兴业等(2015)在Tannier的基础上融入了邻域扩展的思想,基于栅格数据,利用多期曲线对比确定城市的边界;Chen(2016)则利用多重分形奇异谱曲线对城市和乡村区域特征进行了定量测定;更早期,Openshaw等(1987, 1988)开发了地理分析机,基于点的空间分布利用变化的搜索圆对其聚集区进行研究。这些尝试虽未以城市群的实体空间为识别目标,但为利用空间形态对实体空间进行识别提供了很好的借鉴。同时,城市群是因城镇间发生空间联系而形成的城镇体系,其实体空间可看作由城镇聚集而成,因而实现对构成城市群空间的城镇的识别,是在空间上识别城市群实体的有效途径。
针对上述研究中城市群实体空间识别方法的局限性,本文将利用空间分形特征表征空间自相似形态的思想引入城市群空间识别研究,不再以逐个城市作为城市群的识别单元,打破城市硬边界的束缚,将城镇群体作为城市群实体空间的识别对象,基于序列变化的空间可识别单元测度城市群城镇的自相似形态及其分形特征,并进行分析、识别及提取,由此建立对城镇的客观识别方法,以确定城市群实体空间的分布。该方法采用自上而下的识别视角,打破了以城市为研究单元的地域限定;运用分形语言客观描述城市群城镇的空间形态,无需选取统计指标对各城市进行判别,更加贴近实际,且避免了指标选择的片面性和随意性,使得对空间的识别更具客观性。最后,以京津冀城市群为例,实现了对其构成城镇的识别,进而得到城市群在空间上的分布状况,并对此法进行了验证。
若某一空间现象规模随尺度以某种规则的方式变化,并可在这一规则对应的维度上测度这一现象,则这一规则的方式即为该现象表现出的分形特征,而寻找这样的规则即为分形特征的测度,此规则对应的维度即分形维数。对于空间分形特征的测度,已有很多研究,最常用的分形特征的测度方法当属改变尺度的方法,即用不同刻度的尺子去测量同一空间形态会测得不同的量,把尺子的度记作r,把相应于尺子测得的量记作N(r),随着尺子的度不断变化,会得到一组相应的量,如果这组度与这组量满足如下关系便可认为该空间形态存在分形特征。
式中的D即为分形维数。
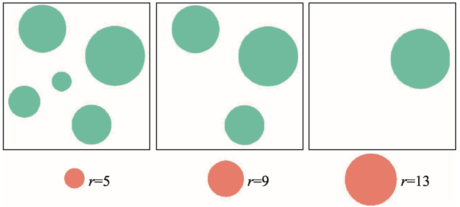
城市群是由城镇组成的集群,在空间分布上呈离散状态,既可视为成规模的整体,又可看作彼此独立的个体。本文基于可识别单元构成城市群城镇集合的思想,通过改变最小可识别单元测度城镇规模及城市群的空间形态,实现城市群城镇空间形态分形特征的测度。基于空间最小可识别单元空间形态测度城市群城镇的空间分形特征,就是将最小可识别单元当作不同尺子的度,当最小可识别单元发生变化时,可识别单元的数量、面积及空间分布等都会发生变化,因而通过最小可识别单元的变化可得出不同的可识别单元集合,即构成城市群城镇的不同规模,通过不同的城镇规模即可形成不同的空间分布形态,如图1所示。而得到的不同城镇规模,也即用不同尺子测度空间分形特征所得到的不同量。
图1 最小可识别单元与空间形态关系示意图
Fig.1 Schematic diagram for the relationship between identifiable minimum unit and spatial morphology
因此,本文进行空间分形特征测度的主要思路如下:以研究区城镇建成区矢量图斑为基础,设定序列变化的最小可识别单元r,分别对空间大于不同最小可识别单元的图斑进行提取,得到空间可识别单元即城镇集合,对数量及面积进行测算,最终得到不同测度r下的两组不同量Nnum(r)、Narea(r),如果二者满足:
则可认为该城市群空间可识别单元即城镇的空间形态存在分形特征,其中的Dnum、Darea为分形维数,本文将Nnum(r)、Narea(r)统称为城镇规模。
本文所述的城市群城镇是指由空间可识别单元构成的城镇集合。若改变最小的空间可识别单元,城市群中可识别的空间单元就会发生变化,构成的城镇集合也就发生了变化,城镇的数量及面积也会随之相应改变。如果城市群城镇的空间形态具有分形特征,则空间最小可识别单元r与城市群城镇规模N(r)会具有良好的幂函数关系,而幂函数关系可等价为双对数线性关系,即:
式中:D为分形维数,c为常数。
因此,基于上述方法所得数据可绘制出空间最小可识别单元r与城市群城镇规模N(r)的双对数曲线,而实际曲线往往仅在有限范围可表现出分形特征,这一有限范围即无标度区,因而可通过无标度区的识别来确定空间分形特征的存在范围。若城市群中空间可识别单元的空间形态具有分形特征,则通过空间分形特征存在范围即可确定城市群中可识别的空间单元,进而得到城市群城镇的集合。
本文对于无标度区的识别主要是获取上述双对数曲线的线性区域。所谓线性区域,就是曲线在某一区域呈现出直线或是近似直线的形态。根据曲线斜率(即曲线拟合函数的一阶导数)的数学意义可知,曲线各点的斜率即曲线的变化趋势,因此该区域内曲线各点的斜率应显示出相同的特征,故理论上通过曲线的斜率变化可准确地确定曲线的线性区域。但在实际中,曲线是根据对数样本点绘制而得,空间数据往往存在误差,样本点可能并非位于真实曲线之上,曲线无法呈绝对直线形态。因此,线性区域的斜率将围绕某一数值波动,单纯通过曲线斜率无法清晰地识别线性区域的边界。而线性拟合则可获得两组变量间的线性变化直线,故可借助同一样本的线性拟合比照出变化曲线的线性区域。本文将依据对双对数的线性拟合来识别曲线的线性区域,进而确定分形特征的存在范围。
最后,通过将空间分形特征的存在范围映射于空间最小可识别单元及城镇的规模,即可确定城市群中可识别的空间单元,由其斑块构成的城镇集合即本文所识别的城市群城镇,进而得到城市群的实体空间。
本文以2016年北京、天津、河北的行政管辖区域为研究区,以美国Landsat系列陆地资源卫星的遥感影像为基础数据,利用监督分类,从多景遥感影像上共选取7153个训练样本,分景将用地类型分为建设用地、农用地、山地、水体四类。从各景影像上分别提取研究区的现状建设用地矢量图斑并完成拼接,最后得到研究区当期的建设用地矢量数据。通过分类结果与遥感影像的目视对比,可判定分类精度较高,基本可满足研究区空间分形特征识别的需求。
基于可识别单元构成城市群城镇集合的思想,本实验将研究区内建设用地图斑视为城镇的建成区,每一图斑即为一个待识别单元,以等间隔的空间最小可识别单元序列作为尺子,通过不同的尺子对待识别单元一一测度,得到可识别的单元即城镇集合并对城镇规模(数量及面积)进行测算。基于上述方法共得到727896组2016年京津冀城市群空间最小可识别单元与城市群城镇规模数据,见表1(因数据量过大此处仅列出序列中首尾各5条数据)。
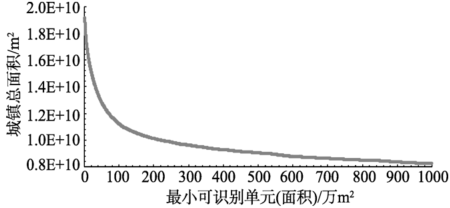
从测算数据中可以看出,随着最小可识别单元的不断扩大,城镇规模呈递减趋势,即城市群城镇的数量及面积均不断减少。
将空间最小可识别单元与城镇规模作为坐标对标绘在坐标图中。由于数十万条数据量过于庞大,坐标值相对于坐标轴的长度过小,使得数据点过于贴近坐标轴,为提高图表的可读性,本文仅对原始数据的前5000对进行展示,所得散点图见 图2-3,二者均呈幂律变化关系,研究区内构成城镇集合的空间可识别单元表现出典型的分形特征,满足式(2)-(3),因此,可认为城市群城镇的空间形态存在分形特征。
表1 空间最小可识别单元与城镇规模统计表
Tab.1 Statistics of identifiable minimum units and corresponding counts and areas of towns
| 最小可识别单元(面积)/m2 | 城镇数量/个 | 城镇总面积/m2 |
|---|---|---|
| 2000 | 127448 | 19182219429 |
| 4000 | 126204 | 19178354882 |
| 6000 | 124706 | 19170842330 |
| 8000 | 122453 | 19155247742 |
| 10000 | 108958 | 19030279736 |
| …… | …… | …… |
| 1455784000 | 1 | 1455790901 |
| 1455786000 | 1 | 1455790901 |
| 1455788000 | 1 | 1455790901 |
| 1455790000 | 1 | 1455790901 |
| 1455792000 | 0 | 0 |
图2 空间最小可识别单元与城镇数量变化关系图
Fig.2 Relationship between identifiable minimum units and corresponding counts of towns
图3 空间最小可识别单元与城镇总面积变化关系图
Fig.3 Relationship between identifiable minimum units and corresponding areas of towns
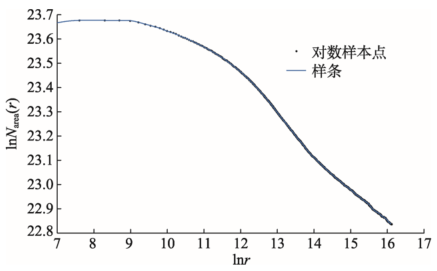
在此基础上,为了识别城市群城镇需要进一步确定分形特征的存在范围,以确定其对应的最小可识别单元。空间最小可识别单元与城镇规模表现出典型的分形特征,二者的对数应呈良好的线性关系,故二者双对数曲线的线性无标度区即为分形特征的存在范围。为此,首先应获取空间最小可识别单元与城镇规模的双对数曲线,本文所测得的每一对空间最小可识别单元与城镇规模的对数均可视作一个样本点,因此可通过对这些样本点插值的方式获取二者的变化曲线,故采用对二者分别取对数后作曲线插值的方法获取双对数曲线。常用的插值方法主要有拉格朗日插值、分段插值、样条插值等,其中拉格朗日插值在曲线两端常常会出现异常波动;分段插值虽在曲线两端不会出现波动,但其折线相交处棱角分明;样条插值则是在此基础上利用其导数值使得折线相交处更加平滑,故样条插值是曲线插值方法中最为普遍的插值方法,在曲线形态上更贴近本文样本点所在的双对数曲线。由插值效果可得,曲线平滑且可靠性和复杂性相对适中,插值曲线见图4-5。
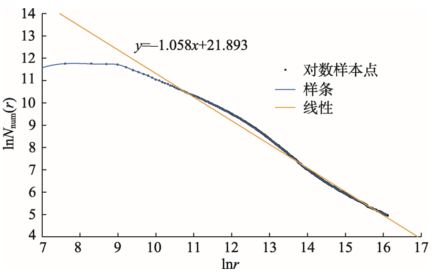
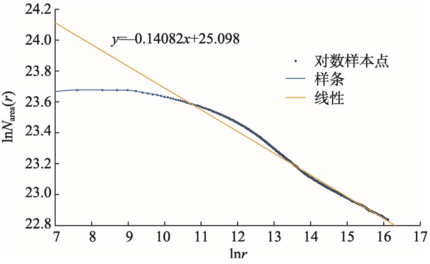
从图4-5中可以看出,城市群空间最小可识别单元与城镇规模的双对数曲线在有限区间内呈现出近似线性关系。基于无标度区的识别方法,在此基础上对双对数曲线样本点再次作线性拟合,见图6-7。
图4 空间最小可识别单元与城镇数量双对数样条插值曲线
Fig.4 Curve of spline function for the logarithm of identifiable minimum units and counts of towns
图5 空间最小可识别单元与城镇总面积双对数样条插值曲线
Fig.5 Curve of spline function for the logarithm of identifiable minimum units and areas of towns
图6 空间最小可识别单元与城镇数量双对数线性拟合曲线
Fig.6 Curves of the linear fitting function for the logarithm of identifiable minimum units and counts of towns
图7 空间最小可识别单元与城镇总面积双对数线性拟合曲线
Fig.7 Curves of the linear fitting function for the logarithm of identifiable minimum units and areas of towns
通过对线性拟合曲线与双对数曲线的比照分析可以得到,当空间最小可识别单元的对数值大于10.58时,双对数曲线虽未呈严格的线性变化,但近似与线性拟合曲线重合,其微幅波动在有限范围内且幅度极小,可以认为双对数曲线呈近似线性变化;而当小于该值时,双对数曲线偏离线性拟合曲线相对于整体较多,斜率变化剧烈,空间最小可识别单元与城镇规模(数量及面积)的双对数均呈现出非线性关系的趋势,而非空间分形特征应显示出的线性关系。通过数量及面积两种不同测度的双对数样条插值曲线及其线性拟合曲线的对比可以看出,虽然二者存在不一致区域,但其线性区域基本重合,可作为线性区域基本可靠的印证。因此本文认为,该点为研究区空间可识别单元分形特征存在的范围界限。故可借助曲线的直线拟合比照出双对数曲线变化的线性区域,本文将依据对曲线的直线拟合来识别双对数曲线的线性区域,进而确定分形特征的存在范围。
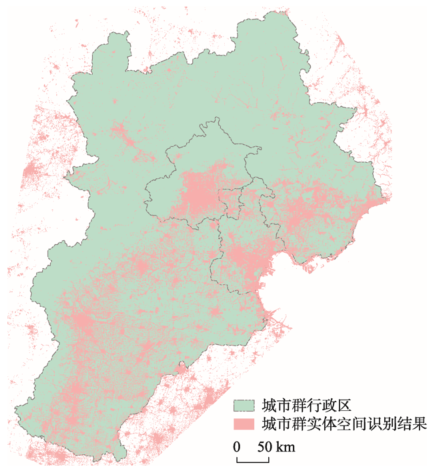
最后,通过该界限反推空间最小可识别单元,并得出39340.11 m2为所识别的该城市群的空间最小可识别单元。在此基础上,再次以研究区建设用地矢量图班为基础,识别大于所得的最小可识别单元的图斑,得到空间可识别单元集合并进行融合,最终形成京津冀城市群城镇集合,即城市群的实体空间,见图8。
图8 城市群实体空间识别结果
Fig.8 Identification of the physical space of the Beijing-Tianjin-Hebei urban systems
从所识别的构成京津冀城市群实体空间的城镇集合可以看出,城市群实体空间打破了城市行政区域的束缚,既包括现有的城市主城区,更包括了城市间的次一级中心,这种空间形态可运用中心地理论(Christaller, 1933)进行解释,亦符合现有对京津冀城市群城镇实际空间分布的普遍认知;同时,识别结果并未覆盖全部建成区,剔除了不属于城市群实体空间的零散居民点图斑,与以行政区域作为城市群空间的组份相比,提高了对实体空间认知的科学性,使识别结果更加贴近客观实际;识别的实体空间多集中于东部和南部地区,西部和北部分布较少,呈现出空间分异规律,同时也与京津冀地区西、北部多山地致使城市的发展存在自然阻碍相一致,验证了结果的科学性和可靠性;而分布于聚集中心周围呈放射状的触角形态在表征城市辐射及其扩张范围的同时,通道状分布亦是城镇间的相互作用及要素流的集中体现,符合地理学第一定律。总体上看,识别结果贴近实际,效果较好。因此,实验的结果有效验证了基于空间分形特征的城市群城镇识别方法的可行性和有效性。
本文基于空间可识别单元测度城市群城镇的形态及其分形特征,实现了城市群实体空间的客观识别。与传统的城市群空间范围相比,本文识别的城市群实体空间是一体化的城市群作为单一的行为主体有能力触及的空间,而非城市群内城市行政边界的简单集合,体现了城市群相异于城市集合的整体性;城市群实体空间中的城镇是城市群生存空间的客观存在,亦符合城市群城镇间相互联系的特征;而城市群实体空间城镇构成的不规则形态体现了对上述相互作用的合理限制,故城市群实体空间是对地域不被城市割裂的城市群空间范围的合理识别。同时,城市群实体空间中的城镇呈等级规模结构,符合中心地理论等经典城市地理学的相关理论。
表2 新旧城市群识别方法对比
Tab.2 Comparison of the identification methods for the space of urban systems
| 对比内容 | 传统据指标判别方法 | 基于空间分形特征的识别方法 |
|---|---|---|
| 识别角度 | 自下而上 | 自上而下 |
| 识别目标 | 城市 | 实体空间 |
| 行政边界 | 需要 | 不需要 |
| 行政单元分拆性 | 不可分 | 可分 |
| 贴近客观存在 | 否 | 是 |
| 空间形态 | 未充分考虑 | 已考虑 |
| 捕捉影响因素 | 需要 | 不需要 |
| 空间相互作用及要素流 | 需要但未考虑 | 无需单独考虑 |
| 评价指标体系 | 需要 | 不需要 |
| 判别标准 | 需要 | 不需要 |
| 城市双分形特征 | 未考虑 | 已体现 |
与传统的城市群识别方法相比(表2),本文所采用的识别方法具有如下特点:
首先,本文对城市群实体空间的识别是从宏观角度出发,将所有城镇单元作为整体的判别,研究单元不再受城市的制约,打破了以城市为研究单元的束缚,满足了研究区部分城镇归属城市群的可能,实现了对城市群空间范围的客观测度,避免了识别过程中由于对空间的一刀切而对识别结果的影响。
其次,本文采用的识别方法是基于城市群实体空间自相似形态的,在无需单独考虑城市群内部的复杂相互作用及要素流的同时,亦符合Tobler提出的地理学第二定律(引自Goodchild, 2004)即区域外部性,在城市群实体空间的识别过程中无需捕捉影响空间的因素即可得到识别结果,避免了影响因素捕捉的不完整性对识别结果的影响。
第三,本文所使用的方法规避了对城市中心性的测定,从而避免了指标的选取;测度分形特征的方法为客观的统计学方法;对分形存在范围的识别则是采用非指标方法计算其分段点;无标度区在空间上的映射则是以客观手段设定的界定标准。识别过程未掺杂主观因素,是一种客观的城市群识别方法。
第四,城市形态存在双分形特征已为目前的部分研究所证实(White et al, 1993, 1994; Haag, 1994; Frankhauser, 1998; 刘继生等, 2003; Chen et al, 2004; Ariza-Villaverde et al, 2013; Chen et al, 2013),这种特征正是城市与非城市区域的体现。而本文的识别方法并不违背对这一双分形特征的已有认知,可从规模层面直接将非城市群区域从整个区域剔除,避免了在非城市区域中对城市群的识别,是在城市群层面对双分形特征的利用尝试。
城市群是由城镇组成的集群,与传统的城市群空间识别模型相比,本文将提取空间分形特征进行挖掘的思想引入城市群空间范围识别的研究,从城市群自相似性的角度出发,从组成城市的最小可识别单元入手,通过对空间可识别单元空间分形特征突变的识别,从全部空间可识别单元排除非城市群的单元,其实质是对空间分形特征存在范围的测度,从而实现对城市群城镇的识别,避免了城市对城市群空间的割裂,规避了指标的选取,因而不需对相互作用规律进行深究。并以京津冀城市群为例,进行了实体空间的识别,为城市群的空间识别研究提供了一次有益的尝试。
目前,学界对于城市群的定义仍有许多争议(周一星等, 1995; Scott, 2001; 张京祥等, 2001; Ferreira et al, 2010; 方创琳, 2011; 江曼琦, 2013),本文虽实现了对城市群的识别,但并不是一种普适的识别方法,遵循不同的理论依据会得到不同的尺度序列及识别结果。因此,相应于不同的城市群概念该方法的可行性仍有待考究。同时,样条插值并不能等同于真实曲线,曲线两端的数据断崖使得两端曲线非线性程度较高,影响对无标度区的直观识别,亦会造成误判,且本文采用的曲线插值及拟合方法亦不能完全体现样本点的真实状态,如何更趋近地获取真实曲线仍有待探索。
此外,本文虽实现了对城市群实体空间的识别,但由于缺少时空数据,未能实现识别结果时空分异特征的对比,有待在后续研究中进一步完善。
The authors have declared that no competing interests exist.
| [1] |
城市群空间范围的综合界定方法研究: 以长株潭城市群为例 [J].
以城市综合实力代替城市人口或城市经济总量,结合主成分分析法,对传统的引力模型进行改进,得出了基于引力模型的长株潭城市群空间范围界定,并对引力模型本身的局限性进行了分析。针对城市群系统的本质特征是内部存在密切的生产要素流,进一步得出了基于要素流分析法的长株潭城市群空间范围界定。最后,综合这两种界定方法,得出了理论上的长株潭城市群空间范围,并与政府划定的长株潭城市群空间范围进行对比,发现政府划定的城市群空间范围要大于理论计算的城市群空间范围。考虑到城市群的地域邻近性特征,以及政府对城市群发展的推动作用,对长株潭城市群中远期的空间范围进行了预测。
Methods of dividing the boundary of urban agglomerations: Chang-Zhu-Tan Urban Agglomeration as a case [J].
以城市综合实力代替城市人口或城市经济总量,结合主成分分析法,对传统的引力模型进行改进,得出了基于引力模型的长株潭城市群空间范围界定,并对引力模型本身的局限性进行了分析。针对城市群系统的本质特征是内部存在密切的生产要素流,进一步得出了基于要素流分析法的长株潭城市群空间范围界定。最后,综合这两种界定方法,得出了理论上的长株潭城市群空间范围,并与政府划定的长株潭城市群空间范围进行对比,发现政府划定的城市群空间范围要大于理论计算的城市群空间范围。考虑到城市群的地域邻近性特征,以及政府对城市群发展的推动作用,对长株潭城市群中远期的空间范围进行了预测。
|
| [2] |
城市群空间范围识别标准的研究进展与基本判断 [J].
Research progress and general definition about identification standards of urban agglomeration space [J].
|
| [3] |
中国城市群形成发育的新格局及新趋向 [J].https://doi.org/10.1007/s12182-011-0124-2 URL [本文引用: 1] 摘要
通过对中国城市群识别标准与现状格局的基本判断,提出了城市群形成发育的现状格局是由15个达到发育标准的城市群和8个未达到发育标准的城市群组成的"15+8"的空间格局,分析了中国城市群形成发育中呈现出的高密度集聚、高速度成长、高强度运转的"三高"特点,认为中国城市群形成发育中存在"四低"问题(发育程度低,投入产出效率低,紧凑度低,资源环境保障程度低)、"四争"问题(不顾条件盲目跟风争相纳入国家战略、争建国家试验区,不顾红线争相扩权强势、引发大规模的变相圈地造城运动,不顾深度合作争相重复建设、出现徒有虚名的高度一体化,不顾资源环境承载力争相提出高目标、滋生区域剥夺行为)、"四过"问题(过多的政府主导与行政干预、过高的发展前景估计、过密的集聚负效应和过大的发展差距)和"五缺失"问题(缺失统一的城市群识别标准、缺失规范的统计数据、缺失明确的归口管理机关、缺失公认的规划编制办法与执业制度、缺失权威的城市群规划法律地位);进而提出了中国城市群的总体发展战略与建设目标,认为未来中国城市群将形成由23大城市群、6大城市群集聚区和"π"字型城市群连绵带组成的国家城市群空间结构体系。最后提出了城市群建设的政策保障机制与对策建议。建议组建国家级城市群协调发展管理委员会和地方级城市群协调发展管理委员会,建立城市群公共财政机制和公共财政储备制度;修订《城乡规划法》或出台《区域规划法》,增补城市群规划的内容,制定城市群合作公约,出台《城市群规划编制审批办法》和《城市群规划实施管理条例》,建立城市群规划执业制度;出台城市群规划技术导则,引导城市群科学规划,加强城市群资源环境保障能力和可持续发展能力建设;依托快速国土轴,加快建设国家高速公路的7918网和以四纵四横为干线的国家高速铁路网,完善城市群快速交通系统;规范统计标准数据,编制并出版中国城市群统计年鉴。
New structure and new trend of formation and development of urban agglomerations in China [J].https://doi.org/10.1007/s12182-011-0124-2 URL [本文引用: 1] 摘要
通过对中国城市群识别标准与现状格局的基本判断,提出了城市群形成发育的现状格局是由15个达到发育标准的城市群和8个未达到发育标准的城市群组成的"15+8"的空间格局,分析了中国城市群形成发育中呈现出的高密度集聚、高速度成长、高强度运转的"三高"特点,认为中国城市群形成发育中存在"四低"问题(发育程度低,投入产出效率低,紧凑度低,资源环境保障程度低)、"四争"问题(不顾条件盲目跟风争相纳入国家战略、争建国家试验区,不顾红线争相扩权强势、引发大规模的变相圈地造城运动,不顾深度合作争相重复建设、出现徒有虚名的高度一体化,不顾资源环境承载力争相提出高目标、滋生区域剥夺行为)、"四过"问题(过多的政府主导与行政干预、过高的发展前景估计、过密的集聚负效应和过大的发展差距)和"五缺失"问题(缺失统一的城市群识别标准、缺失规范的统计数据、缺失明确的归口管理机关、缺失公认的规划编制办法与执业制度、缺失权威的城市群规划法律地位);进而提出了中国城市群的总体发展战略与建设目标,认为未来中国城市群将形成由23大城市群、6大城市群集聚区和"π"字型城市群连绵带组成的国家城市群空间结构体系。最后提出了城市群建设的政策保障机制与对策建议。建议组建国家级城市群协调发展管理委员会和地方级城市群协调发展管理委员会,建立城市群公共财政机制和公共财政储备制度;修订《城乡规划法》或出台《区域规划法》,增补城市群规划的内容,制定城市群合作公约,出台《城市群规划编制审批办法》和《城市群规划实施管理条例》,建立城市群规划执业制度;出台城市群规划技术导则,引导城市群科学规划,加强城市群资源环境保障能力和可持续发展能力建设;依托快速国土轴,加快建设国家高速公路的7918网和以四纵四横为干线的国家高速铁路网,完善城市群快速交通系统;规范统计标准数据,编制并出版中国城市群统计年鉴。
|
| [4] |
基于GIS的中国城市群发育格局识别研究 [J].
The identification of urban agglomeration distribution in China based on GIS analysis [J].
|
| [5] |
对城市群及其相关概念的重新认识 [J].Rein-terpret urban agglomeration and related concepts [J]. |
| [6] |
当代中国城镇体系地域空间结构类型定量研究 [J].https://doi.org/10.3969/j.issn.1000-0690.2006.05.005 URL 摘要
当代中国城市的地域空间分布并不具有随机性分布特征,过去运用?白松方程规定的随机分布模型对城镇体系地域空间结构定量划分存在一定的局限性。借助牛顿引力学方程对随机分布模型进行改进,构建城市空间分布的引力模型,利用2002年数据,以省级行政区为基本空间单元,对中国城镇体系地域空间结构类型进行定量研究,得出6个块状组团式城市聚集区、10个条状组团式城市聚集区和8个以大城市为核心的城市群的结构特征,其中东部省区以多核心多组团式的城市块状聚集区为主,中部省区以单中心单组团式的条状聚集区为主,西部省区以大城市为核心的城市群为主。东、中、西三大地带城市发育水平差别较大,梯度现象较为明显。
A quantitative study on regional spatial structure of urban system in con-temporary China [J].https://doi.org/10.3969/j.issn.1000-0690.2006.05.005 URL 摘要
当代中国城市的地域空间分布并不具有随机性分布特征,过去运用?白松方程规定的随机分布模型对城镇体系地域空间结构定量划分存在一定的局限性。借助牛顿引力学方程对随机分布模型进行改进,构建城市空间分布的引力模型,利用2002年数据,以省级行政区为基本空间单元,对中国城镇体系地域空间结构类型进行定量研究,得出6个块状组团式城市聚集区、10个条状组团式城市聚集区和8个以大城市为核心的城市群的结构特征,其中东部省区以多核心多组团式的城市块状聚集区为主,中部省区以单中心单组团式的条状聚集区为主,西部省区以大城市为核心的城市群为主。东、中、西三大地带城市发育水平差别较大,梯度现象较为明显。
|
| [7] |
河南省城镇体系空间结构的多分形特征及其与水系分布的关系探讨 [J].https://doi.org/10.3969/j.issn.1000-0690.2003.06.012 URL [本文引用: 1] 摘要
基于河南省城镇体系空间结构的多分形性质及其与水系的分维关系的 实证探讨发现如下地理规律:①在较大标度范围内,河南省城市体系的空间结构为简单分形,但在较小标度范围内,系统已经具有明确的多重分形特征;②多分维谱 在参数q≈-4处出现标度间断,从而城市体系的空间结构发生对称破缺.③城市体系空间结构的分维小于水系空间结构的分维.由此证明:第一,多分形是由单分 形演化而来,城镇体系的多分形结构是基于地球表面的分形支体由测度集中区向测度疏散区渐近发育的.第二,城市体系的分形发育与水系的分维结构具有一定的数 理关系,城市体系的分维理当小于水系维数.
Multifractal measures based on man-land relationships of the spatial structure of the urban system in Henan [J].https://doi.org/10.3969/j.issn.1000-0690.2003.06.012 URL [本文引用: 1] 摘要
基于河南省城镇体系空间结构的多分形性质及其与水系的分维关系的 实证探讨发现如下地理规律:①在较大标度范围内,河南省城市体系的空间结构为简单分形,但在较小标度范围内,系统已经具有明确的多重分形特征;②多分维谱 在参数q≈-4处出现标度间断,从而城市体系的空间结构发生对称破缺.③城市体系空间结构的分维小于水系空间结构的分维.由此证明:第一,多分形是由单分 形演化而来,城镇体系的多分形结构是基于地球表面的分形支体由测度集中区向测度疏散区渐近发育的.第二,城市体系的分形发育与水系的分维结构具有一定的数 理关系,城市体系的分维理当小于水系维数.
|
| [8] |
基于腹地划分的中国城市群空间影响范围识别 [J].https://doi.org/10.11867/j.issn.1001-8166.2014.03.0352 Magsci 摘要
<p>城市群空间影响范围的界定是认清城市群内中心城市与腹地、城市与城市间相互关联的基础。采用主成分分析法计算中国287个地级及以上城市的结节性指数,利用累积耗费距离法和<em>k</em>阶数据场,综合测度了交通可达性与空间场能,根据场强“取大”原则对城市腹地进行了划分,依据城市腹地范围界定了城市群的空间影响范围。结果表明:①中国地级以上城市最大和最小结节性指数相差157.53倍,城市平均可达时间为193.43 min,场能平均值为5 412,最大和最小城市腹地相差3 751倍;② 23个城市群中,空间影响范围最大的是北疆城市群,空间平均场强最大的是中原城市群;③城市群在空间上呈现为发育程度不同的“11+9+3”的分布格局和逆时针90°旋转的“β”型城市群连绵带发展格局;④基于腹地划分的城市群空间影响范围充分考虑了现实的交通网络和地形地貌特点,实现了对广域空间范围内城市腹地范围和城市群空间影响范围的定量测度。</p>
Identification of spatial influence sphere of urban agglomerations in China based on urban hinter-land delimitation [J].https://doi.org/10.11867/j.issn.1001-8166.2014.03.0352 Magsci 摘要
<p>城市群空间影响范围的界定是认清城市群内中心城市与腹地、城市与城市间相互关联的基础。采用主成分分析法计算中国287个地级及以上城市的结节性指数,利用累积耗费距离法和<em>k</em>阶数据场,综合测度了交通可达性与空间场能,根据场强“取大”原则对城市腹地进行了划分,依据城市腹地范围界定了城市群的空间影响范围。结果表明:①中国地级以上城市最大和最小结节性指数相差157.53倍,城市平均可达时间为193.43 min,场能平均值为5 412,最大和最小城市腹地相差3 751倍;② 23个城市群中,空间影响范围最大的是北疆城市群,空间平均场强最大的是中原城市群;③城市群在空间上呈现为发育程度不同的“11+9+3”的分布格局和逆时针90°旋转的“β”型城市群连绵带发展格局;④基于腹地划分的城市群空间影响范围充分考虑了现实的交通网络和地形地貌特点,实现了对广域空间范围内城市腹地范围和城市群空间影响范围的定量测度。</p>
|
| [9] |
基于邻域扩展量化法的城市边界识别 [J].Urban boundary identification based on neighborhood dilation [J]. |
| [10] |
行政边界对城市群城市用地空间扩张的影响: 基于京津冀城市群的实证研究 [J].https://doi.org/10.11821/dlyj201601015 URL 摘要
作为静态的抽象地理要素,行政边界如何影响城市用地的空间扩张过程?以城市群为研究对象,从理论的角度出发,构造符合中国城市群发展历程的行政边界效应阶段模型,并根据城市群发育过程中行政边界对城市用地空间扩张的影响,将其分为四个阶段:隐形阶段、异化阶段、疏导阶段和消融阶段,分析不同阶段城市群城市用地扩张的空间特征和动力机制.研究以京津冀城市群为实证案例,采用趋同分析和β回归方程测度不同类型行政边界对城市用地扩张的边界效应.研究表明:行政级别跨度越大,边界效应越大,城市间城市用地扩张规模的差距也越大;行政边界对城市用地空间扩张的影响具有长期性和累积性的特点,时间越长,边界对城市用地扩张的影响效应越显著.为突破行政边界制约、合理划定城市开发边界、实现城市群城市用地理性扩张提供理论支撑和政策建议.
The influence of administrative boundary on the spatial expansion of urban land: A case study of Beijing-Tianjin-Hebei urban agglomeration [J].https://doi.org/10.11821/dlyj201601015 URL 摘要
作为静态的抽象地理要素,行政边界如何影响城市用地的空间扩张过程?以城市群为研究对象,从理论的角度出发,构造符合中国城市群发展历程的行政边界效应阶段模型,并根据城市群发育过程中行政边界对城市用地空间扩张的影响,将其分为四个阶段:隐形阶段、异化阶段、疏导阶段和消融阶段,分析不同阶段城市群城市用地扩张的空间特征和动力机制.研究以京津冀城市群为实证案例,采用趋同分析和β回归方程测度不同类型行政边界对城市用地扩张的边界效应.研究表明:行政级别跨度越大,边界效应越大,城市间城市用地扩张规模的差距也越大;行政边界对城市用地空间扩张的影响具有长期性和累积性的特点,时间越长,边界对城市用地扩张的影响效应越显著.为突破行政边界制约、合理划定城市开发边界、实现城市群城市用地理性扩张提供理论支撑和政策建议.
|
| [11] |
|
| [12] |
论都市圈地域空间的组织 [J].https://doi.org/10.3321/j.issn:1002-1329.2001.05.006 URL 摘要
都市圈是国际上对现代城镇群体发展地区空间组织的基本模式 ,在中国也具有重要的现实应用价值。对都市圈的有关基本概念、空间演化规律、职能与空间规划组织等有关内容进行了论述 ,并结合国情对我国都市圈地区的行政管理模式提出了设想。
On the spatial organization of the metropolitan area [J].https://doi.org/10.3321/j.issn:1002-1329.2001.05.006 URL 摘要
都市圈是国际上对现代城镇群体发展地区空间组织的基本模式 ,在中国也具有重要的现实应用价值。对都市圈的有关基本概念、空间演化规律、职能与空间规划组织等有关内容进行了论述 ,并结合国情对我国都市圈地区的行政管理模式提出了设想。
|
| [13] |
建立中国城市的实体地域概念 [J].https://doi.org/10.11821/xb199504001 URL [本文引用: 1] 摘要
本文总结了我国在城市的行政地域与景观地域严重背离的情况下,继续使用行政地域区分城乡的种种弊端,认为解决这一问题的关键在于建立适合中国特点又具有国际可比性的城市实体地域概念,以此作为城乡划分及统计的地域基础,文章提出以下限人口规模、非农化水平和人口密度三个指标定义城市实体地域,并在大量实证研究的基础上,通过对中国城市空间形态的分类,提出了一套完整的划分实体地域的方法和工作程序。
Toward establishing the concept of physical urban area in China [J].https://doi.org/10.11821/xb199504001 URL [本文引用: 1] 摘要
本文总结了我国在城市的行政地域与景观地域严重背离的情况下,继续使用行政地域区分城乡的种种弊端,认为解决这一问题的关键在于建立适合中国特点又具有国际可比性的城市实体地域概念,以此作为城乡划分及统计的地域基础,文章提出以下限人口规模、非农化水平和人口密度三个指标定义城市实体地域,并在大量实证研究的基础上,通过对中国城市空间形态的分类,提出了一套完整的划分实体地域的方法和工作程序。
|
| [14] |
Multifractal analysis of axial maps applied to the study of urban morphology [J].https://doi.org/10.1016/j.compenvurbsys.2012.11.001 URL 摘要
Street layout is an important element of urban morphology that informs on urban patterns influenced by city growing through the years under different planning regulations and different socio-economic contexts. It is assumed by several authors that urban morphology has a fractal or monofractal nature. However, not all the urban patterns can be considered as monofractal because of the presence of different morphologies. Therefore, a single fractal dimension may not always be enough to describe urban morphology. In this sense, a multifractal approach serves to tackle this problem by describing urban areas in terms of a set of fractal dimensions. With this aim in mind, two different neighbourhoods of the city of Cordoba, in Andalusia (Spain), are analysed by using the Sandbox multifractal method and lacunarity. We analyse the street patterns represented by axial maps and obtained from the Space Syntax algorithm. The results suggest that the R茅nyi dimension spectrum is superior to a single fractal dimension to describe the urban morphology of Cordoba, given the presence of regular and irregular street layouts established under different planning and socio-economic regimes.
|
| [15] |
Defining urban and rural regions by multifractal spectrums of urbanization [J].https://doi.org/10.1142/S0218348X16500043 URL [本文引用: 2] 摘要
The spatial pattern of urban-rural regional system is associated with the dynamic process of urbanization. How to characterize the urban-rural terrain using quantitative measurement is a difficult problem remaining to be solved. This paper is devoted to defining urban and rural regions using ideas from fractals. A basic postulate is that human geographical systems are of self-similar patterns associated with recursive processes. Then multifractal geometry can be employed to describe or define the urban and rural terrain with the level of urbanization. A space-filling index of urban-rural region based on the generalized correlation dimension is presented to reflect the degree of geo-spatial utilization in terms of urbanization. The census data of America and China are adopted to show how to make empirical analyses of urban-rural multifractals. This work is not so much a positive analysis as a normative study, but it proposes a new way of investigating urban and rural regional systems using fractal theory.
|
| [16] |
Multifractal characterization of urban form and growth: The case of Beijing [J].https://doi.org/10.1068/b36155 URL 摘要
Urban form takes on properties similar to random growing fractals and can be described in terms of fractal geometry. However, a model of simple fractals is not effectual enough to characterize both the global and local features of urban patterns. In this paper multifractal measurements are employed to model urban form and analyze urban growth. The capacity dimension D-0, information dimension D-1, and correlation dimension D-2 of a city's pattern can be estimated utilizing the box-counting method. If D-0 > D-1 > D-2 significantly, the city can be treated as a system of multifractals, and two sets of fractal parameters, including global and local parameters, can be used to spatially analyze urban growth. In this case study, multifractal geometry was applied to Beijing city, China. The results based on the remote-sensing images taken in 1988, 1992, 1999, 2006, and 2009 show that the urban landscape of Beijing bears multiscaling fractal attributes. The dimension spectrum curves show several abnormal aspects, especially the upper limit of the global dimension breaks through the Euclidean dimension of embedding space and the local dimension fails to converge in a proper way. The geographical features of Beijing's spatiotemporal evolution are discussed, and the conclusions may be instructive for spatial optimization and city planning in the future.
|
| [17] |
Multi-fractal measures of city-size distributions based on the three parameter Zipf model [J].https://doi.org/10.1016/j.chaos.2004.02.059 URL 摘要
A multi-fractal framework of urban hierarchies is presented to address the rank-size distribution of cities. The three-parameter Zipf model based on a pair of exponential-type scaling laws is generalized to multi-scale fractal measures. Then according to the equivalent relationship between Zipf's law and Pareto distribution, a set of multi-fractal equations are derived using dual conversion and the Legendre transform. The US city population data coming from the 2000 census are employed to verify the multi-fractal models and the results are satisfying. The multi-fractal measures reveal some strange symmetry regularity of urban systems. While explaining partially the remains of the hierarchical step-like frequency distribution of city sizes suggested by central place theory, the mathematical framework can be interpreted with the entropy-maximizing principle and some related ideas from self-organization.
|
| [18] |
Die zentralen orte in suddeutschland [M].
|
| [19] |
Urban settlements delimitation in low-density are-as-An application to the municipality of Tomar (Portugal) [J].https://doi.org/10.1016/j.landurbplan.2010.05.007 URL Magsci [本文引用: 1] 摘要
One of the major issues in land-use planning is how to contain urban sprawl. To this effect, plans integrate new regulations and mechanisms that severely limit construction outside urban perimeters and restrict the areas available for expansion within the settlements. Before enforcing these restrictions, a review and correction of existing delimitation of settlements was necessary. The new limits were established through the identification of effectively consolidated urban areas. In the absence of official criteria defining them, this paper presents a methodology establishing the limits of these consolidated areas. Based on the identification, in a Geographical Information System (GIS) of existing buildings, and incorporating the analysis of road network, social facilities, and physiographic constraints (such as floodplains or steep slopes), several criteria were defined so as to delimit the urban settlements. A review of other methodologies is presented as a contextualization of the proposed one, but it is not the focus of the paper to specifically contrast or appreciate them. The study area is the municipality of Tomar, in Central Portugal, a territory with very disperse human occupation. Having achieved an accurate delimitation of the settlements鈥 current extent that reflects the purposes of rational land-use, the settlement delimitation was successfully revised so as to mirror the current occupation. Also, the objectivity and clarity of the adopted criteria, and its applicability to the whole municipality, allowed the methodology to be unanimously well received by the Municipal Government and Parish Councils, even if it deals with a somewhat politically delicate subject.
|
| [20] |
Evolving rank-size distributions of intra-metropolitan urban clusters in South China [J].https://doi.org/10.1016/j.compenvurbsys.2008.08.005 URL 摘要
Cities are the dominant form of human settlements and their interaction with the global environment presents great challenges for sustainability. This paper analyzes the evolution of urban form in three rapidly-growing Chinese metropolitan areas in the Pearl River Delta: Shenzhen, Foshan and Guangzhou. It is the first study to utilize a combination of time-series satellite imagery, GIS, and a time-series of spatial pattern statistics based on rank-size distributions to evaluate the evolving nature of urban clusters in Chinese cities. Defining the urban clusters – contiguous urban built-up areas – as the unit of our analysis, we estimate exponents of rank-size distributions for each city’s clusters for the years between 1988 and 1999. We observe substantial variation in the evolution of urban form across time. For all three metropolitan areas, the rank-size distribution exponents evolve in an oscillatory fashion within the 11-year period as the metropolitan areas grow through a process of cluster birth and coalescence. The analysis sheds light on the evolving nature of urban clusters that can help us better understand urban phenomena, and make inferences on how socioeconomic processes influence urban form which in turn has considerable effects on the ecology of the urban system and the local and regional environment. We show that a time-series analysis of rank-size distributions of urban clusters reveals trends in spatial patterns of urban form that can aid in the design of cities and help achieve more sustainable land-uses.
|
| [21] |
The fractal approach. A new tool for the spatial analysis of urban agglomerations [J].https://doi.org/10.2307/1534622 URL [本文引用: 1] 摘要
Fractal geometry is a new approach for the study of spatial distributions....The methods of fractal analysis can be used to study the spatial organization of human activities across scales. The regularities and the discontinuities in the distributions can then be identified. These discontinuities can be spatially situated. Applying this concept to urbanized areas has shown that districts can be defined and classified according to their scaling relations thereby allowing development of a typology of locational patterns....An examination of time series shows that despite the apparent fragmentation of these urban tissues urbanization is often accompanied by structured development. (EXCERPT) (SUMMARY IN ENG AND SPA)
|
| [22] |
The validity and usefulness of laws in geographic information science and geography [J].https://doi.org/10.1111/j.1467-8306.2004.09402008.x URL 摘要
My contribution to the session at the New Orleans meetings of the Assocation of American Geographers at which the ideas that appear in this forum were initially aired was as discussant, following the three main presentations by Barnes, Miller, and Smith. This paper expands on the comments I made during the session, and include reactions to
|
| [23] |
The rank-size distribution of settlements as a dynamic multifractal phenomenon [J].https://doi.org/10.1016/0960-0779(94)90063-9 URL [本文引用: 1] 摘要
Abstract The rank-size distribution in a system of settlements is considered as a multifractal phenomenon. The occurence and temporal stability of the rank-size distribution is obtained as the result of a dynamic self-organization process in the nested system of settlements. The inherent time scale of this self-organization process and the obtained hierarchical structure are related to low intersettlement mobility of urban population, a tendency of the population to agglomerate, as well as distance and preference effects. A well-known migration model is used with three different approaches for the attractivity of a settlement for comparative purposes.
|
| [24] |
Automatic neighbourhood identification from population surfaces [J].
|
| [25] |
Population landscape: A geometric approach to studying spatial patterns of the US urban hierarchy [J].https://doi.org/10.1080/13658810600661342 URL [本文引用: 1] 摘要
We present a geometric and graphic approach to studying spatial patterns of urban hierarchy in the US. The multiplicatively weighted Voronoi diagram is found to be effective for visualizing theoretical regions delineated by socio‐economic variables. The population landscape of the continental US demonstrates overall and stepwise patterns reflecting population, neighborhood and distance, with overwhelming influence from huge metropolitan areas. Stepwise exploration and cluster analysis of the spatial pattern reveal an urban hierarchy. Attributes and arrangement are the two important factors of urban hierarchy, with attribute having a stronger local influence and arrangement having a stronger global influence. The study also presents a variation of Zipf's law to visualize the rank‐size distribution from tabular and statistical space to map space.
|
| [26] |
Investigation of leukaemia clusters by use of a geographical analysis machine [J].https://doi.org/10.1016/S0140-6736(88)90352-2 URL PMID: 2893085 摘要
A new spatial analysis device called a Geographical Analysis Machine detects deviations from the Poisson distribution of rare events. Application to childhood leukaemia data from the north of England identified five clusters, only one of which had been noted by previous methods.
|
| [27] |
A mark 1 geographical analysis machine for the automated analysis of point data sets [J]. |
| [28] |
Laws of population growth [J].
|
| [29] |
The area and population of cities: New insights from a dif-ferent perspective on cities [J].https://doi.org/10.1257/aer.101.5.2205 Magsci [本文引用: 1] |
| [30] |
|
| [31] |
Defining and characterizing urban boundaries: A fractal analysis of theoretical cities and Belgian cities [J].https://doi.org/10.1016/j.compenvurbsys.2013.07.003 URL [本文引用: 2] 摘要
In this paper we extract the morphological boundaries of urban agglomerations and characterize boundary shapes using eight fractal and nonfractal spatial indexes. Analyses were first performed on six archetypal theoretical cities, and then on Belgium鈥檚 18 largest towns. The results show that: (1) the relationship between the shape of the urban boundary (fractal dimension, dendricity, and compactness) and the built morphology within the urban agglomeration (fractal dimension, proportion of buildings close to the urban boundary) is not straightforward; (2) each city is a unique combination of the morphological characteristics considered here; (3) due to their different morphological characteristics, the planning potential of Flemish and Walloon cities seems to be very different.
|
| [32] |
A fractal approach to identifying urban boundaries [J].https://doi.org/10.1111/j.1538-4632.2011.00814.x URL Magsci [本文引用: 1] 摘要
Fractal geometry can be used for determining the morphological boundaries of metropolitan areas. A two-step method is proposed here: (1) Minkowski's dilation is applied to detect any multiscale spatial discontinuity and (2) a distance threshold is located on the dilation curve corresponding to a major change in its behavior. We therefore measure the maximum curvature of the dilation curve. The method is tested on theoretical urban patterns and on several European cities to identify their morphological boundaries and to track boundary changes over space and time. Results obtained show that cities characterized by comparable global densities may exhibit different distance thresholds. The less the distances separating buildings differ between an urban agglomeration and its surrounding built landscape, the greater the distance threshold. The fewer the buildings that are connected across scales, the greater the distance threshold.La geometría fractal puede ser utilizada para determinar los límites morfológicos de áreas metropolitanas. El método que aquí se propone tiene dos pasos: (1) la aplicación de la dilatación (o suma) de Minkowski (Minkowski's dilation) para detectar cualquier discontinuidad espacial a múltiples escalas; y, (2) la identificación de un umbral de distancia en la curva de dilatación que corresponde a un cambio importante en su comportamiento. En otras palabras, se busca medir la curvatura máxima de la curva de dilatación. El método propuesto es puesto a prueba haciendo uso de patrones urbanos teóricos así como varias ciudades europeas con el fin de identificar sus límites morfológicos y para hacer el seguimiento de los cambios de límites en el espacio y tiempo. Los resultados obtenidos muestran que ciudades con densidades globales comparables pueden presentar diferentes umbrales de distancia. A menos diferenciación de distancias que separan los edificios entre una aglomeración urbana y el paisaje construido que lo rodea, mayor es el umbral de distancia identificado. A menor número de edificios conectados a través de varias escalas espaciales, mayor umbrales de distancia.
|
| [33] |
Cellular automata and fractal urban form: A cellular modelling approach to the evolution of urban land-use patterns [J].
CiteSeerX - Scientific documents that cite the following paper: Cellular automata and fractal urban form: A Cellular modelling approach to the evolution of urban land-use patterns. Environment and Planning
|
| [34] |
Urban systems dynamics and cellular automata: Fractal structures between order and chaos [J].https://doi.org/10.1016/0960-0779(94)90066-3 URL [本文引用: 1] 摘要
ABSTRACT Two-dimensional cellular automata with rules defined on a large neighbourhood are used to simulate the evolution of urban land-use patterns. Both the simulated urban areas and actual cities are shown to be fractal objects characterized by very similar dimensions. But the fractality (and hence realism) of the cellular cities appears only when the degree of stochasticity is within a relatively narrow band; otherwise the city is too uniform or too random. The same phenomenon appears in a conventional dynamic model of the evolution of a system of cities: the size distribution of urban centres assumes a fractal form (one observed in many real systems) only with a ‘fine tuning’ of the relevant parameters. Otherwise the system either evolves toward a uniform state or collapses to a single large centre. The tendency to observe such poised behaviour in both the cellular and the urban system models for realistic calibrations may be a manifestation of a phase-transition phenomenon observed in simpler deterministic cellular automata, and may represent a requirement for evolvability in real systems.
|

/
| 〈 |
|
〉 |

