李斌 , 王慧敏, 张鹏岩
LI Bin, WANG Huimin, ZHANG Pengyan
通讯作者:
收稿日期: 2016-06-20
网络出版日期: 2017-05-20
版权声明: 2017 地理科学进展 《地理科学进展》杂志 版权所有
基金资助:
作者简介:
作者简介:李斌(1974-),河南汝州人,高级实验师,博士研究生,主要从事GIS与环境地理研究,E-mail:libin@henu.edu.cn。
展开
摘要
通过研究归一化植被指数(NDVI)、归一化水汽指数(NDMI)与地表温度(LST)的相关关系,对比NDVI和NDMI定量分析LST的适宜程度。以Landsat 8遥感影像为数据源,以郑汴都市区为例,反演LST,计算NDVI和NDMI。从整体、分区、像元等不同层面分析NDVI和NDMI与LST的相关关系,并利用GEO-Da软件,分析150 m、300 m、450 m三种不同采样间隔数据的NDVI、NDMI与LST的空间相关性。主要结论为:①NDVI与LST的线性拟合度较差,而NDMI与LST具有很强的线性关系,剖面分析显示NDMI与LST呈显著负相关关系。②缓冲区分析结果表明,随着距城市中心距离的增加,用地类型增多,LST和NDMI之间的相关性逐渐增强。③在Moran's I空间相关性分析中,不同采样间隔下两指数与LST的负相关关系均比较明显,但由于水体在2个指数中数值的差异,使NDMI与LST表现出更强的空间负相关性,而NDVI与LST空间相关性则相对较弱。因此,总的来说NDMI是热环境研究的有效指标,与NDVI相比,NDMI与LST的负相关关系更强、更稳定,也更适宜于对LST的定量分析。
关键词:
Abstract
Through the comparative study of the correlations between the normalized difference vegetation index (NDVI), normalized difference moisture index (NDMI) and land surface temperature (LST), the suitability to research LST using NDVI and NDMI was verified. Based on Landsat 8 remote sensing imagery in the Zhengzhou-Kaifeng metropolitan area, LST was retrieved, and both NDVI and NDMI were calculated. At the overall, regional, and pixel levels, the correlations between LST and NDVI, NDMI were analyzed. Using GEO-Da, the spatial correlations between LST and NDVI, NDMI were simulated with the data of three sampling intervals of 150 m, 300 m and 450 m. The conclusions are as follows. First, there is a stronger linear negative correlation between LST and NDMI, and sectional analysis shows that NDMI resembles a mirror image of LST, whereas the correlation between LST and NDVI is much weaker. Second, buffer analysis shows that with the increase of distance from the down town and increase of the number of land use types, the correlation between NDMI and LST also increases gradually. Third, in the analysis of Moran's I spatial correlation, the negative correlations between LST and the two indices were significant, but because of the great difference between the values of water body in the two indices, NDMI and LST show stronger negative correlation, while the correlation between NDVI and LST is relatively weak. In general, compared with NDVI, NDMI is more suitable as an effective indicator for quantitative analysis of LST.
Keywords:
地表温度(Land Surface Temperature, LST)是地球资源、环境问题的重要影响因素之一,在全球农业、水文、生态、环境、气候、地球生物化学等领域具有重要研究意义(朱怀松等, 2007)。地表覆被是影响地表温度的主要因素,植被、不透水面率等与地表温度的相互关系是目前该领域研究的热点(张小飞等, 2006; 马伟等, 2010; 王敏等, 2013)。与传统气象站点观测方法比较,遥感监测地表温度具有观测范围广、空间连续性强等优点,因而在热环境研究中发展较快(白洁等, 2008; 谢苗苗等, 2011; 夏浪等, 2014)。
早期的热环境遥感研究中,归一化植被指数(NDVI)一直是研究地表温度的重要指标(Yuan et al, 2007; Raynolds et al, 2008)。大量研究表明,NDVI与LST之间存在明显的负相关关系(Wan et al, 2004; Sun et al, 2007; 宫阿都等, 2007),但在研究两者关系时往往先用水体做掩膜处理,因为水体的NDVI为0或负值,而它的地表温度往往最低。这说明用NDVI作为地表热特征指标表达的并不是连续的区域表面,具有一定的局限性(钱乐祥等, 2008)。地表温度的决定因素主要有地表土壤水分含量和地表植被覆盖状况(Weng et al, 2004),表明水分含量和地表植被是研究地表温度的很好载体,植被的降温作用一定程度上是因为叶面的水分含量,干枯的植被并不具有对地表的降温作用。研究表明,城市非渗透表面和裸土具有较高的地表温度,一方面是因为地表的物理特性,另一方面是因为地表水分含量低,缺乏有效的蒸腾作用,因此有必要将水分作为影响LST的因素进行深入研究。
对NDVI与LST的关系研究较充分,但水分含量对LST的影响研究却相对较少。遥感数据的近红外波段上绿色植被具有最大反射率,而短红外波段上反射率则较低,对水分有一定的吸收作用(Hunt et al, 1987)。归一化水汽指数(Normalized Different Moisture Index, NDMI)就是利用这一特征构建的,用来估算植被叶面的水分含量(Hardisky et al, 1983; Gao, 1996)。钱乐祥等(2008)研究表明,与NDVI作为指标来定量分析地表温度相比,NDMI提供了一种互补的、甚至更加有效的衡量指标。历华等(2009)和Zhang等(2009)采取不同数据源,利用转化的指标间接证明NDMI与LST存在明显的线性关系,并指出NDMI可以作为城市地表温度空间分布特征的量化因子。Mallick等(2012)利用Landsat TM数据研究表明,NDMI与LST具有显著负相关的线性关系,并认为表面温度可通过NDMI进行预测。Essa等(2012)研究了地表温度与遥感指数相关性,表明NDMI与LST均具有较强的相关性。上述研究表明,NDMI和LST存在着较强的相关关系,但所做工作多集中在统计分析上,而空间相关性分析则相对不足,且NDMI的空间分布规律也有待深入。本文选取NDMI作为地表温度参量指标时,增加了空间相关性分析,同时为增加与传统研究的对比,将NDVI和NDMI一并量化LST的空间分布特征,从多角度剖析两指数与LST的定量关系,综合分析NDMI量化研究LST的适宜性。
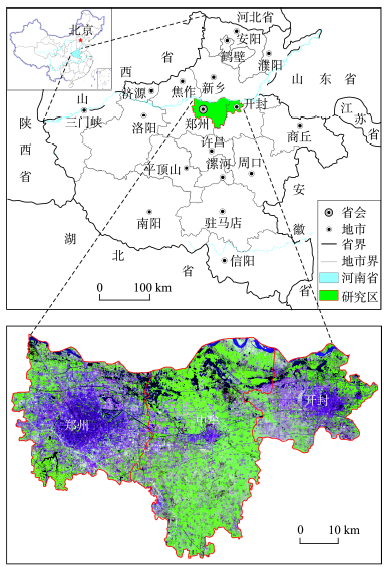
本文选取郑汴都市区为研究区域,该区域位于河南省中部偏北,包括郑州市区和开封市区以及 两者之间的中牟县。研究区范围为113°27'~114°30'E,34°26'~34°58'N,土地面积2994.76 km2。郑汴都市区位于黄河下游大冲积扇南翼,属黄、淮河冲积平原,地势较平坦,整体上西南高,东北低。区域大部分面积为海拔在60~120 m的平原,郑州市区西南部地形稍有起伏,海拔在200~300 m之间。黄河到开封地段因泥沙淤积使河床不断抬高,形成了河高于城的“地上悬河”。中牟县地表岗、洼相间,地形复杂,地貌多变。
本文所用数据是从美国地质勘探局(USGS)网站获取的2014年5月6日的Landsat 8遥感影像。郑汴都市区位于行列号为124/36的单幅遥感影像中,无需拼接处理。遥感影像的地图投影为UTM-WGS84,产品类型为L1T。L1T数据产品经系统辐射校正和地面控制点几何校正,并通过DEM进行了地形校正。Landsat 8遥感影像的可见光波段分辨率为30 m,热红外波段分辨率为100 m,下载时已重采样至30 m。用研究区的矢量边界对影像图进行裁剪处理,结果见图1。
图1 研究区区位及Landsat 8遥感影像图
Fig.1 Location and Landsat 8 remote sensing imagery of the study area
研究区选取时主要考虑以下因素:首先,该区域地貌类型以平原为主,包含小部分丘陵,覆盖范围广;用地类型包括建设用地、农地、林地、水体、裸露地、未利用地等,类型多样。其次,考虑到研究区完全位于行列号124/36的单幅遥感影像中,无需拼接处理,数据一致性好。研究区具有一定的地域代表性,研究结果具有实际价值。
覃志豪等(2001)根据地表热辐射传导方程,推导出利用Landsat TM第6波段反演地表温度的单窗算法。与其他地表温度反演算法相比,单窗算法无需精确的实时大气剖面数据,仅需用地表比辐射率、大气透射率和大气平均温度3个参数即可进行地表温度的演算,可操作性强,精度较高,因此得到广泛应用。根据USGS的建议,目前Landsat 8第11波段值存在很大的不稳定性,建议用户把第10波段作为单波段热红外数据进行使用(胡菊旸等, 2014)。Landsat 8第10波段的波谱范围为10.60~11.19 μm,而Landsat TM/ETM+第6波段波谱范围为10.45~12.50 μm,因此单窗算法的参数需作出相应的调整。本文参照蒋大林等(2015)的研究成果,对参数作了相应的修正。单窗算法的计算方法如下:
式(1)中:Ts代表地表温度(K);a、b为常量,调整后的取值分别为:-62.735657、0.434036;C和D是中间变量,通过式(2)-(3)求得,其中ε是地表辐射率,τ是大气透射率;T10是卫星传感器探测到的像元亮度温度(K),通过式(4)求得;Lλ为Landsat 8第10波段的反射率,可根据像元DN值计算;Ta为大气平均作用温度(K),通过式(5)计算,其中T0为卫星过境时的气温。
地表辐射率ε计算利用覃志豪等(2003)提出的混合像元分离法。该方法将地表覆被类型分为水面、自然表面和城镇3种,城镇像元是由建筑和植被组成的混合像元,自然表面像元则为由不同比例的植被和裸土组成的混合像元。水面的典型比辐射率为0.995,自然表面和城镇的比辐射率则根据植被覆盖度分别计算,具体计算方法参见覃志豪等(2003)。
大气透射率τ的获取,在NASA网站http://atmcorr.gsfc.nasa.gov/中输入卫星过境时的GMT Time、影像的中心经纬度、地表高程、地表气压和相对湿度,然后根据提供的中纬度夏季标准大气模型模拟得到。
Landsat 8遥感影像数据下载后,经过裁剪、辐射定标、Flaash大气校正处理,然后计算NDVI和NDMI。NDVI定义为近红外波段(NIR)与可见光红波段(R)的反射率之差除以两个波段的反射率之和(Lyon et al, 1998),对于 Landsat 8 OLI数据,其计算公式为:
式(6)中:b4和b5分别为Landsat 8 OLI第4和第5波段的反射率。NDVI的值在[-1,1]范围内,通常非植被区(裸地、水体等)的NDVI值很低或为负值,城镇值也较小,植被覆盖度大的耕地和林地NDVI值较大。Landsat 8中NDMI的计算公式为:
式(7)中:b5和b6分别为OLI的第5、第6波段的反射率,即近红外和短波红外的反射率。
根据式(1)-(7),计算得到LST、NDVI与NDMI。利用散点图分别模拟LST与NDVI、NDMI的对应关系,研究其形状及分布特征。为进一步分析它们间的相互关系,将研究区以地表温度为标准划分多个区域,计算各分区不同地表温度对应的NDVI和NDMI的均值,然后利用统计分析工具对NDVI-LST、NDMI-LST进行回归分析。
为研究LST与NDMI的区域变化特征,在ArcGIS中,分别以郑州市、中牟县、开封市建成区的核心为原点、以0.5 km间隔为半径建立多重缓冲区,以覆盖整个城市区域。在每个缓冲区中,分析LST和NDMI的线性关系,然后得到该缓冲区回归方程的决定系数和斜率,从而分析其与距核心距离的关系。
为了进一步研究LST和NDVI、NDMI的空间相关关系,将研究区数据以150 m、300 m、450 m等3个不同间隔进行点采样,在GEO-Da软件中作空间相关分析。为此,首先要建立权重矩阵,然后计算双变量的全局Moran's I及局部Moran's I。空间权重矩阵表明不同空间对象之间的空间布局,如拓扑、邻接关系等。Moran's I的取值范围在[-1,1]之间,小于0为负相关,等于0为不相关,大于0为正相关。通过分析LST与NDVI、NDMI的空间相关关系,进一步判断NDVI、NDMI表征LST的适宜性。
对遥感反演的地表温度进行验证比较困难,由于很难获取卫星过境时刻的地表观测温度,因此本文利用从国家气象信息中心获取的0 cm地温与反演LST进行对比。卫星过境时刻为11:00左右,因此用获取的郑州、开封2个国家台站8:00和14:00的0 cm地温均值近似表示卫星过境时刻地表温度。对比验证发现,反演LST与台站观测均值误差在2.2℃以内。根据本文的研究目的,误差在合理的范围之内,能够满足研究需要。
统计表明,2014年5月6日研究区地表温度在14.21~46.51℃之间,平均31.61 ℃,标准差3.94 ℃。NDVI指数范围在[-0.498, 0.642]之间,均值为0.346。5月初由于植被还没有完全生长,尤其是作物的覆盖度尚未达到最大值,平均NDVI指数较小。NDMI指数均为正值,变化范围在[0.015,0.906]之间,均值为0.673,标准差较小,仅为0.083。说明NDMI表达地表特征时,变化较小,较为稳定。
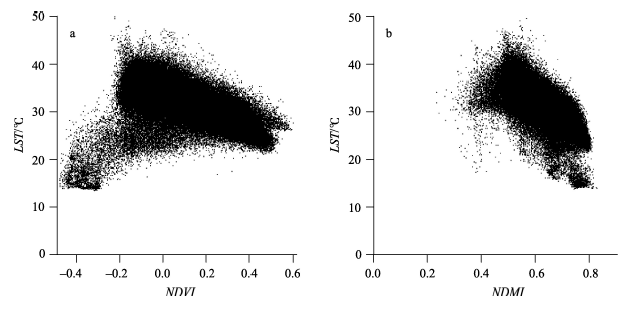
从图2可以发现,NDVI-LST的散点分布大体呈三角形,这一现象印证了以前的研究成果(Gillies et al, 1997)。三角形左下角的像元NDVI值为负值,地表温度较低,大多应为水体像元。右边的像元植被指数高,地表温度较水体略高,为植被覆盖度高的区域。三角形上边的区域为覆盖度较低的城市和裸地。三角形的散点图各顶点的解释相对容易,但很难用合理的单一模型来表达。研究表明(钱乐祥等,2008),不同时相的NDVI-LST散点图,整体形状变化较大,规律性不明显。因此用NDVI来解释LST的空间分布规律性有一定的难度。相比NDVI-LST散点图,NDMI与地表温度的散点图中,散点的分布更加集中,外形接近长方形,比较规则。从图中能明显地看出,LST随NDMI的升高而降低,表现出较强的负相关关系。
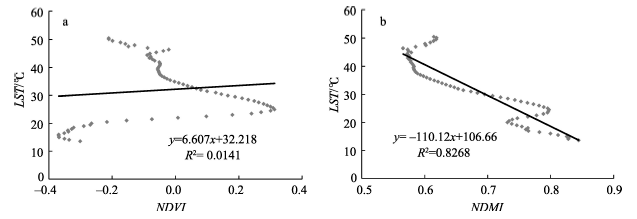
为定量表达LST与NDVI、NDMI之间的相互关系,在研究区内,对地表温度按照0.5 ℃的间隔划分为多个区域,在每个分区中分别计算LST、NDVI、NDMI等3个变量平均值。拟合NDVI-LST、NDMI-LST的线性关系,见图3。
图3 NDVI-LST(a)、NDMI-LST(b)的线性拟合
Fig.3 Linear regressions of NDVI-LST and NDMI-LST
图3a表明,LST与NDVI的关系线性拟合度很差,用单一模型较不适宜,只能用分段进行拟合。在高温区间,LST和NDVI的负相关非常明显,但低温区间则更多地表现为正相关关系,且关系不稳定。总的来说,NDVI-LST并不具有线性相关关系。
图3b趋势线说明LST和NDMI具有很强的负相关关系,决定系数为0.8268。由此可见用水汽指数来表征地表温度比用植被指数表征地表温度更加直观有效。但是我们也发现在高温区和低温区,NDMI-LST坐标点相对较不稳定,数据外部形态趋于复杂,容易出现异常情况。说明影响地表热环境的形成因素除不同水分含量的覆被类型,如建筑、裸地、植被、水体等外,还受到不同地表热辐射性质的影响。
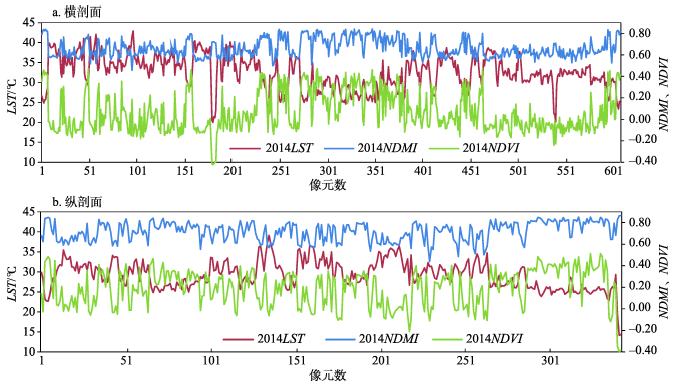
整体关系分析了散点的外部特征和温度分区特征,而样点的具体分析更能表达研究区内部变量之间的关系。因此,在靠近研究区中部随机选取了纵横2个剖面进行逐像元调查分析。为简化数据,按照150 m的间隔采样,提取像元的LST、NDVI、NDMI值。横剖面从西到东依次经过郑州市、中牟县和开封市,共609个像元;纵剖面南北贯穿中牟县,共344个像元。
图4清晰地表达了纵横剖面三者之间的关系。图中可以看出,总体上NDMI、NDVI与LST都存在镜像关系,且NDMI与LST的镜像关系更加明显。纵横剖面图中亦可看出NDMI和NDVI存在较一致的变化趋势。西部郑州市和东部开封市的地表温度相对较高,中部中牟县则相对较低;相应地,水汽指数和植被指数则表现为两端低、中间高的态势。仔细观察剖面图发现,在LST极低的几处区域均出现NDMI-LST呈镜像关系,而NDVI-LST呈一致趋势的现象,说明该处的地表覆被类型为水体。
为进行定量分析,本文计算了3个参数在两个剖面上的Pearson相关系数(表1)。表1显示,NDMI-NDVI的正相关性最强,因此两者均与LST表现出一致的负相关关系。非常明显,NDMI-LST的相关系数相比NDVI-LST更加接近于-1,体现出更加显著的负相关性。因此,在LST的相关性研究中,NDMI比NDVI更为有效,更适宜于定量表达LST的空间及动态变化规律。
表1 NDMI、NDVI、LST之间的相关系数
Tab. 1 Correlation coefficients between NDMI, NDVI and LST
| NDMI-LST | NDVI-LST | NDMI-NDVI | |
|---|---|---|---|
| 横剖面 | -0.7677 | -0.5619 | 0.8523 |
| 纵剖面 | -0.7903 | -0.5540 | 0.8400 |
在整个区域范围内,不同温度区间的均值分析和剖面分析,LST和NDMI均呈现较强的负相关关系,但是不同地表覆被类型区域两者的相关程度如何(即NDMI解释LST的适用程度),仍需作进一步分析。为突出城市建设用地在整个区域热环境中的作用,在郑州市、中牟县、开封市3个城市建成区中以0.5 km为半径间隔建立34、18、14个多重缓冲区。在每个缓冲区中,逐个像元分析LST和NDMI的关系,然后得到该缓冲区线性回归方程的决定系数和斜率,从而分析其与距中心点距离的关系。
表2列出了上述3个城市所有缓冲区NDMI和LST的线性回归方程,除中牟县和开封市的0.5 km缓冲区外,其他缓冲区两组数据均通过了P<0.01的显著性检验,说明总体上LST和NDMI在区域表现上具有高度相关性。
表2 缓冲区NDMI-LST的线性回归分析
Tab.2 Linear regression analysis of NDMI-LST in buffer zones
| 区域 | 缓冲区半径/km | R2 | 回归方程 | 自由度 | 区域 | 缓冲区半径/km | R2 | 回归方程 | 自由度 |
|---|---|---|---|---|---|---|---|---|---|
| 郑州市 | 0.5 | 0.243 | y = -20.849x + 49.209 | 928 | 中牟县 | 0.5 | 0.033 | y = -4.084x + 35.724 | 925 |
| 1.0 | 0.209 | y = -19.815x + 48.136 | 2664 | 1.0 | 0.178 | y = -8.180x + 37.840 | 2661 | ||
| 1.5 | 0.311 | y = -22.342x + 49.152 | 4396 | 1.5 | 0.401 | y = -17.166x + 43.225 | 4408 | ||
| 2.0 | 0.417 | y = -29.190x + 53.907 | 6160 | 2.0 | 0.301 | y = -18.166x + 44.008 | 6145 | ||
| 2.5 | 0.298 | y = -28.433x + 53.888 | 7910 | 2.5 | 0.461 | y = -25.607x + 48.666 | 7925 | ||
| 3.0 | 0.354 | y = -25.252x + 51.525 | 9647 | 3.0 | 0.474 | y = -29.608x + 50.836 | 9645 | ||
| 3.5 | 0.234 | y = -22.235x + 49.628 | 11407 | 3.5 | 0.505 | y = -25.396x + 47.723 | 11426 | ||
| 4.0 | 0.270 | y = -26.600x + 52.205 | 13168 | 4.0 | 0.546 | y = -26.417x + 48.295 | 13097 | ||
| 4.5 | 0.171 | y = -20.423x + 48.116 | 14882 | 5.0 | 0.579 | y = -26.752x + 48.306 | 16654 | ||
| 5.0 | 0.195 | y = -23.178x + 49.911 | 16636 | 5.5 | 0.628 | y = -30.059x + 50.703 | 18346 | ||
| 5.5 | 0.326 | y = -30.130x + 54.403 | 18369 | 6.0 | 0.607 | y = -28.380x + 49.686 | 20138 | ||
| 6.0 | 0.350 | y = -29.325x + 53.308 | 20129 | 6.5 | 0.623 | y = -29.759x + 50.838 | 21815 | ||
| 6.5 | 0.399 | y = -29.839x + 53.812 | 21835 | 7.0 | 0.568 | y = -26.586x + 48.513 | 23608 | ||
| 7.0 | 0.366 | y = -29.070x + 53.401 | 23616 | 7.5 | 0.576 | y = -25.094x + 47.324 | 25370 | ||
| 7.5 | 0.367 | y = -27.477x + 52.335 | 25287 | 8.0 | 0.584 | y = -28.452x + 49.986 | 27039 | ||
| 8.0 | 0.356 | y = -25.619x + 51.066 | 27104 | 8.5 | 0.610 | y = -30.197x + 51.334 | 28823 | ||
| 8.5 | 0.407 | y = -29.332x + 53.511 | 28842 | 9.0 | 0.630 | y = -31.872x + 52.685 | 30638 | ||
| 9.0 | 0.398 | y = -32.580x + 55.542 | 30525 | 开封市 | 0.5 | 0.009 | y = -2.313x + 33.926 | 925 | |
| 9.5 | 0.413 | y = -35.210x + 57.236 | 32347 | 1.0 | 0.260 | y = -17.877x + 42.875 | 2667 | ||
| 10.0 | 0.402 | y = -32.520x + 55.566 | 34074 | 1.5 | 0.446 | y = -47.803x + 60.906 | 4391 | ||
| 10.5 | 0.399 | y = -30.274x + 54.014 | 35794 | 2.0 | 0.319 | y = -40.069x + 56.520 | 6154 | ||
| 11.0 | 0.323 | y = -30.914x + 54.005 | 37546 | 2.5 | 0.362 | y = -34.108x + 52.790 | 7918 | ||
| 11.5 | 0.318 | y = -27.295x + 51.801 | 39631 | 3.0 | 0.316 | y = -21.770x + 45.261 | 9646 | ||
| 12.0 | 0.372 | y = -27.668x + 52.344 | 41009 | 3.5 | 0.295 | y = -22.519x + 45.753 | 11421 | ||
| 12.5 | 0.429 | y = -29.299x + 53.172 | 42844 | 4.0 | 0.459 | y = -24.834x + 47.320 | 13125 | ||
| 13.0 | 0.496 | y = -32.015x + 54.758 | 44149 | 4.5 | 0.547 | y = -25.370x + 47.443 | 14885 | ||
| 13.5 | 0.470 | y = -29.711x + 53.287 | 43346 | 5.0 | 0.566 | y = -25.419x + 47.248 | 16651 | ||
| 14.0 | 0.528 | y = -33.138x + 55.629 | 43118 | 5.5 | 0.522 | y = -25.170x + 47.163 | 18374 | ||
| 14.5 | 0.551 | y = -35.129x + 56.732 | 43307 | 6.0 | 0.609 | y = -27.567x + 48.530 | 20084 | ||
| 15.0 | 0.466 | y = -30.534x + 53.455 | 43318 | 6.5 | 0.642 | y = -28.850x + 49.537 | 20669 | ||
| 15.5 | 0.534 | y = -30.042x + 52.985 | 43960 | 7.0 | 0.681 | y = -30.975x + 50.972 | 21169 | ||
| 16.0 | 0.531 | y = -34.612x + 55.691 | 42313 | ||||||
| 16.5 | 0.500 | y = -30.932x + 53.374 | 42435 | ||||||
| 17.0 | 0.532 | y = -34.884x + 55.999 | 39269 |
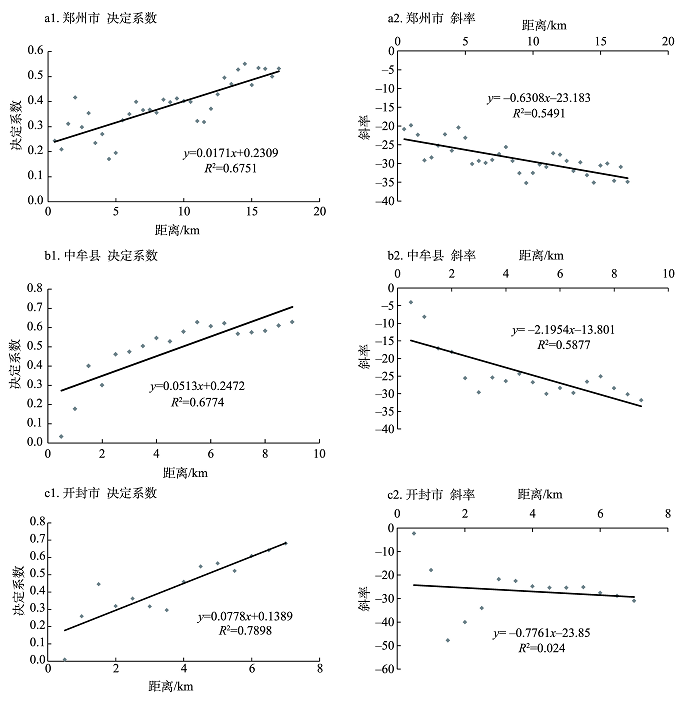
对缓冲区NDMI-LST线性回归方程的决定系数和距中心质点的距离再次进行线性拟合发现(图5),决定系数的变化规律性明显。如图5(a1、b1、c1)所示,郑州市、中牟县、开封市三地的回归方程决定系数R2和距中心质点距离具有显著相关性,均通过0.01的显著性检验。说明随着距中心的距离增加,即从市中心到郊区,NDMI-LST线性方程决定系数增加的规律更加明显,LST和NDMI之间的相关性则逐渐增强。这种现象产生的原因可能是城市中心区域的用地类型比较单一,多以建设用地为主,地表水汽指数变化较小,削弱了NDMI对LST作用程度。从城市中心到郊区,用地类型增多,随着植被、水体的加入使水汽指数取值不断增大,NDMI-LST的决定系数同时趋于增大。
图5 缓冲区线性回归方程的决定系数和斜率的变化规律
Fig.5 Variation of the coefficients and the slopes of the linear regression equations in buffer zones
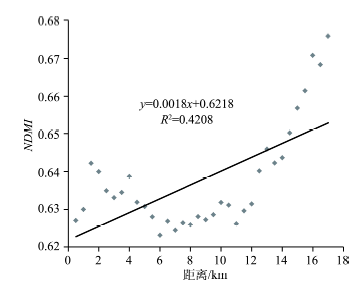
图6显示了2014年郑州市的水汽指数均值距中心距离的变化情况,总的趋势是距中心距离越远,水汽指数就越高。7 km后,水汽指数与距中心距离的线性关系更加明显,决定系数R2达到0.8以上。这说明距离城市中心渐远,地表覆被的景观类型比例发生变化,城市建筑用地的比例在不断下降,同时水汽指数增加,对地表温度的增加起到一定的抑制作用。因此NDMI与LST的相关系数在增大。
图6 郑州市缓冲区NDMI变化规律
Fig.6 Variation tendency of NDMI in buffer zones of Zhengzhou City
缓冲区半径越大,两者的相关性越显著,但不同区域达到同一相关性水平时,距中心的距离不同。表2显示,NDMI-LST相关系数达到0.5时,郑州市在14.0 km处,开封市在4.5 km处,而中牟县在3.5 km处。这说明城市建设规模对NDMI-LST相关性的影响十分明显,建成区面积越大,达到同样相关性水平的区域距中心的距离就越远。
图5(a2、b2、c2)反映了缓冲区回归方程斜率随距离的变化情况,郑州市和中牟县均通过了0.01显著性检验,开封市则没有,这主要是因为开封市中心水域面积较大,市区内水系发达,湖泊的降温效应在前几个缓冲区中增大了斜率的绝对值。总的来说,随距离增加,缓冲区回归方程斜率的绝对值在增加,即LST随NDMI的变化率在增加,再次印证了随着距中心距离的增加,城市地表覆被类型比例发生变化,NDMI对LST的降温效应趋于明显。
研究区像元的空间分辨率为30 m,全区共有像元3327849个,数据量较大。考虑到热红外波段的空间分辨率为100 m,选取了150 m、300 m、450 m等3个不同的间隔进行采样,然后对数据做空间相关分析。具体方法用ArcGIS在样区内生成3种不同间隔的点数据,接着按照空间位置关系,把LST、NDVI、NDMI的属性赋值给样点。通过GEO-Da软件读取点数据,建立权重矩阵,计算双变量全局Moran's I和局部Moran's I。
Moran's I散点图中横坐标为各数据点标准化后的属性值,纵坐标为空间连接矩阵相邻单元属性的均值。散点图中一、三象限的区域为空间正相关,即高值对应高值(High-High)、低值对应低值(Low-low),表示空间单元和周围单元的属性值比较一致,表现为均质性。二、四象限的区域则表现为空间负相关,即低值对应高值(Low-High)、高值对应低值(High-Low),表示空间单元和周围单元的属性值趋势相反,即异质性特征(万鲁河等, 2011)。
3.4.1 双变量全局空间相关分析
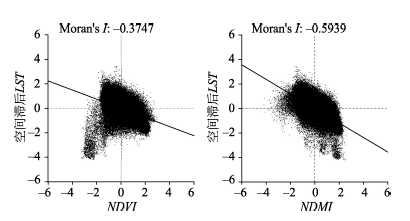
为检验NDVI、NDMI和LST间的空间相关性水平,在GeoDa中,设定相关性参数后,分别用NDVI-LST、NDMI-LST做双变量全局Moran's I空间相关分析。分析结果表明:在150 m样点下,NDVI-LST的Moran's I为-0.3747,NDMI-LST的Moran's I为-0.5939(图7)。随着采样间隔的增大,NDVI-LST的Moran's I变化为:-0.3747→-0.3291→-0.2910;NDMI-LST的Moran's I变化则表现为:-0.5939→ -0.4951→-0.4376。
图7 150 m采样间隔下双变量Moran散点图
Fig.7 Scatter plots of bivariate Moran's I under 150m sampling interval
从数据上看,双变量的全局Moran's I随空间采样间隔的增大均呈现下降趋势。但与NDVI-LST的相关系数相比,NDMI-LST的Moran's I呈现出更强的负相关性。在150 m采样间距下两组变量的负相关系数相差0.2192,随采样间距增至300 m、450 m,相关系数差距变为0.1660、0.1466,数值逐渐变小。由此推断,若采样间距变小,则两组数据Moran's I绝对值均增大,且NDMI-LST的负相关性会更强于NDVI-LST的负相关性。
3.4.2 双变量局部空间相关分析
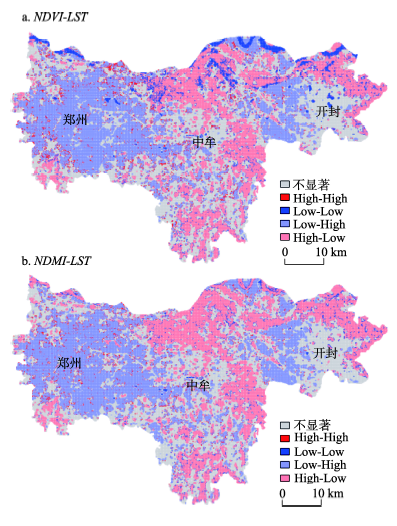
全局相关系数反映的是总体空间相关情况,局部变量空间分析则能直观地反映相关性在区域空间位置的表现。利用GeoDa 1.6.7,对两组双变量分别进行Local Moran's I分析,生成了Moran's I 集聚图(图8),统计结果见表3。
图8 150 m采样间隔的Moran's I 集聚图
Fig.8 Moran's I cluster map under 150m sampling interval
表3 双变量局部Moran's I 集聚图统计
Tab.3 Statistical results of the bivariate local Moran's I cluster map
| 采样间隔/m | 变 量 | 不显著点数 (占比/%) | 第一象限High-High 点数(占比/%) | 第三象限Low-Low 点数(占比/%) | 第二象限Low-High 点数(占比/%) | 第四象限High-Low 点数(占比/%) |
|---|---|---|---|---|---|---|
| 150 | NDVI-LST | 82199(61.8) | 3483(2.6) | 6068(4.6) | 23635(17.8) | 17671(13.3) |
| NDMI-LST | 82189(61.8) | 2522(1.9) | 2496(1.9) | 24612(18.5) | 21237(16.0) | |
| 300 | NDVI-LST | 21630(65.0) | 952(2.9) | 1578(4.7) | 5239(15.7) | 3874(11.6) |
| NDMI-LST | 21621(65.0) | 815(2.4) | 830(2.5) | 5381(16.2) | 4626(13.9) | |
| 450 | NDVI-LST | 9901(67.0) | 457(3.1) | 728(4.9) | 2124(14.4) | 1572(10.6) |
| NDMI-LST | 9944(67.3) | 410(2.8) | 419(2.8) | 2134(14.4) | 1875(12.7) |
在局部的Moran's I 集聚图(图8)中,2个双变量空间相关图总体上非常一致。值得注意的是,郑州市区范围都表现出Low-High的空间分布,说明低值NDVI和NDMI均对应较高的LST现象,该区域双变量负相关表现明显;而在中牟和开封建成区,2个属性则更多地表现为非空间相关性。原因有两:一是中开封、中牟城市规模小,更易于与周围环境进行热交换;二是开封市内部有面积较大的水体,从而影响了整体的空间相关性。
在图8的NDVI-LST相关性分析中,研究区北部的黄河水域部分及其城市较大的湖面位于Low-Low象限,显示出正相关;而在NDMI-LST相关性分析图中,均显示出负相关,位于High-Low象限。这种现象的出现是NDMI-LST的全局Moran's I绝对值明显大于NDVI-LST的全局Moran's I的主要原因,即水体区域在NDVI-LST相关性分析中表现出的正相关与整体趋势相反,而NDMI-LST表现出负相关则使整体的相关性更强。
表3中,可清晰地看出,随采样间隔增加相关性不显著区域面积在增加,NDMI-LST的相关性不显著区域,从150 m采样间隔的61.8%增加到450 m采样间隔的67.3%,相应地,相关性显著区域的面积在减少。由于双变量Moran's I 集聚图分布图表征的是某一变量值与其邻域另一变量均值间的高低关系,因此采样间隔增大,会影响样点LST与相邻样点NDVI、NDWI均值的关系。采样间隔越大,双变量的相关性越小,不显著相关区域的面积就越大。但在3个采样间隔数据中,2个变量和地表温度的相关性仍表现为较强的负相关,在High-High和Low-Low 2个象限散点分布的比例较小;在Low-High、High-Low 2个象限的比例则明显较大。虽然不同采样间隔的NDVI-LST和NDMI-LST相关性区域的比例几乎相当,但在不同象限显著性表现出很大的差异。比较NDVI-LST和NDMI-LST的相关性,在High-High和Low-Low 2个象限,前者散点分布的比例明显高于后者,而在Low-High、High-Low 2个象限,后者比例则明显高于前者。因此,NDMI-LST的空间负相关关系要明显强于NDVI-LST的负相关关系。可见,用NDMI来解释LST的空间变化规律,要比NDVI更为适宜。
本文以Landsat 8为数据源,选取郑汴都市区为研究对象,从整体、分区、像元等不同层面分析了NDVI-LST、NDMI-LST的相关关系,并利用GEO-Da软件,分析了150 m、300 m、450 m三种不同采样间隔NDVI-LST、NDMI-LST的空间相关性,基本结论为:
(1) 散点图、分区统计、剖面分析均得出了一致的结果,即NDMI和LST具有很强的负相关关系。水体在NDVI和LST中均表现为低值,而NDMI则为高值,正由于此差异,使得NDVI和LST的关系表现为散点图呈三角形、线性模型无法表达、相关性差等特点。
(2) NDMI-LST的地域缓冲区分析表明,从市中心到郊区,LST和NDMI之间的相关性逐渐增强。随着距中心距离增加,地表覆被类型比例发生变化,植被、水体等自然特征覆被类型的增加使水汽指数取值范围增大,NDMI-LST的相关系数也同时增大。
(3) Moran's I双变量空间相关性分析中,NDVI-LST、NDMI-LST的全局Moran's I随采样间距的增大均呈现减小趋势,总体上两变量的空间负相关性均比较明显,但相关系数表明NDMI-LST的负相性更强。局部的Moran's I显示,水体区域在NDVI-LST相关性分析中表现出的正相关与整体趋势相反,而NDMI-LST则表现出负相关,与整体趋势一致,增强了整个区域的负相关性。
本文多个角度的分析表明,相比NDVI-LST,NDMI-LST的负相关性更强。由于水体在2个指数与地表温度相关性中表现差异,使得NDMI作为有效参量更适合分析LST,且物理意义上解释也比较合理。但利用NDMI表征LST所存在的不确定性仍需深入研究,不同研究区(如城镇、乡村),不同覆被类型的地表NDMI与LST相关性存在明显差异,因此有必要在不同样区对两者关系开展相关验证。本文仅采用了Landsat 8数据且为单一时间断面,尚未进行其他传感器遥感数据的多时段分析验证,有待于今后进一步开展工作。
The authors have declared that no competing interests exist.
| [1] |
针对TM/ETM+遥感数据的地表温度反演与验证 [J].Inversion and verification of land surface temperature with remote sensing TM/ETM+ data [J]. |
| [2] |
北京市城市热岛与土地利用/覆盖变化的关系研究 [J].https://doi.org/10.3969/j.issn.1006-8961.2007.08.028 URL [本文引用: 1] 摘要
本文以北京市为例,在遥感和GIS技术的支持下,以TM热红外遥感影像定量反演的城市地表温度为基础,分析了城市热岛效应与城市土地利用/覆盖变化的关系,以期为缓解城市热岛效应提供科学依据.
Study on relationship between urban heat island and urban land use and cover change in Beijing [J].https://doi.org/10.3969/j.issn.1006-8961.2007.08.028 URL [本文引用: 1] 摘要
本文以北京市为例,在遥感和GIS技术的支持下,以TM热红外遥感影像定量反演的城市地表温度为基础,分析了城市热岛效应与城市土地利用/覆盖变化的关系,以期为缓解城市热岛效应提供科学依据.
|
| [3] |
FY3A/MERSI地表温度反演 [J].Land surface temperature retrieval from FY3A/MERSI [J]. |
| [4] |
基于Landsat 8的地表温度反演算法研究: 以滇池流域为例 [J].Study of land surface temperature retrieval based on Landsat 8: With the sample of Dianchi Lake basin [J]. |
| [5] |
基于MODIS数据的长株潭地区NDBI和NDVI与地表温度的关系研究 [J].Relationships of LST to NDBI and NDVI in Changsha-Zhuzhou-Xiangtan area based on MODIS data [J]. |
| [6] |
植被指数与地表温度定量关系遥感分析: 以北京市TM数据为例 [J].https://doi.org/10.6046/gtzyyg.2010.04.22 URL [本文引用: 1] 摘要
?以北京市为研究区,在对Landsat-5TM数据大气校正基础上,利用TM单窗算法定量反演地表温度,并估算了5种植被参数:归一化差值植被指数(NDVI)、比值植被指数(RVI)、绿度植被指数(GVI)、土壤调节植被指数(MSAVI)和植被覆盖度(fg)。结合地表温度(LST)空间分布,对比分析5种植被参数与地表温度的相关程度。分析结果显示,相对于上述4种植被指数,fg与地表温度有更好的负相关性,对地表温度空间分布的指示能力更佳。利用fg与地表温度关系定量分析了植被覆盖程度对热岛效应的影响,发现北京市区平均地表温度比近郊区和远郊区分别高1.6K和5.3K。
A quantitative analysis of the relationship between vegetation indices and land surface temperature based on remote sensing: A case study of TM data for Beijing [J].https://doi.org/10.6046/gtzyyg.2010.04.22 URL [本文引用: 1] 摘要
?以北京市为研究区,在对Landsat-5TM数据大气校正基础上,利用TM单窗算法定量反演地表温度,并估算了5种植被参数:归一化差值植被指数(NDVI)、比值植被指数(RVI)、绿度植被指数(GVI)、土壤调节植被指数(MSAVI)和植被覆盖度(fg)。结合地表温度(LST)空间分布,对比分析5种植被参数与地表温度的相关程度。分析结果显示,相对于上述4种植被指数,fg与地表温度有更好的负相关性,对地表温度空间分布的指示能力更佳。利用fg与地表温度关系定量分析了植被覆盖程度对热岛效应的影响,发现北京市区平均地表温度比近郊区和远郊区分别高1.6K和5.3K。
|
| [7] |
归一化水汽指数与地表温度的关系 [J].Relationship between normalized difference moisture index and land surface temperature [J]. |
| [8] |
单窗算法的大气参数估计方法 [J].https://doi.org/10.3969/j.issn.1001-070X.2003.02.010 URL [本文引用: 1] 摘要
根据地表热辐射传导方程,提出了一个简单可行且精度较高的专门用于从TM6数据中演算地表温度的方法--单窗算法.这一算法把大气和地表状态对地表热传导的影响直接包括在演算公式中.该方法需要两个大气参数进行地表温度的演算,即大气平均作用温度和大气透射率.本文论述这两个大气参数的估计方法:根据大气水分含量或地表附近空气湿度来估计大气透射率; 通过分析标准大气剖面资料,尤其是大气水分和气温随高程的变化规律,根据地表温度推算大气平均作用温度.
Estimating of the essential atmospheric parameters of mono-window algorithm for land surface temperature retrieval from Landsat TM6 [J].https://doi.org/10.3969/j.issn.1001-070X.2003.02.010 URL [本文引用: 1] 摘要
根据地表热辐射传导方程,提出了一个简单可行且精度较高的专门用于从TM6数据中演算地表温度的方法--单窗算法.这一算法把大气和地表状态对地表热传导的影响直接包括在演算公式中.该方法需要两个大气参数进行地表温度的演算,即大气平均作用温度和大气透射率.本文论述这两个大气参数的估计方法:根据大气水分含量或地表附近空气湿度来估计大气透射率; 通过分析标准大气剖面资料,尤其是大气水分和气温随高程的变化规律,根据地表温度推算大气平均作用温度.
|
| [9] |
用陆地卫星TM6数据演算地表温度的单窗算法 [J].Mono-window algorithm for retrieving land surface temperature from Landsat TM6 data [J]. |
| [10] |
基于GeoDA的哈大齐工业走廊GDP空间关联性 [J].https://doi.org/10.11821/yj2011060002 URL [本文引用: 1] 摘要
利用地理空间分析方法和空间分析软件,分析了哈大齐工业走廊2008年各县GDP空间分布状况,包括各县之间GDP水平的空间关联性、各县GDP水平与人口的空间关联性。研究发现:该时期内哈大齐工业走廊各县GDP水平在空间关联性上成正相关,相关系数较小,GDP空间分布并非表现出完全随机性,而是表现出空间相似值之间的空间聚集。GDP在空间上对人口的影响也成正相关。进一步对哈大齐各县GDP与普通中学毕业人数进行相关分析,发现两者成负相关,现有教育状况不能很好的满足经济发展需求。哈大齐工业走廊显示出了"劳动力密集型、资源密集型企业与低知识水平劳力集聚相适宜;技术密集型企业、资本密集型企业与高技术水平劳力密集相关"的规律。哈大齐工业走廊仍然处于工业化初期较高阶段。
GeoDA-based spatial correlation analysis of GDP in Hadaqi industrial corridor [J].https://doi.org/10.11821/yj2011060002 URL [本文引用: 1] 摘要
利用地理空间分析方法和空间分析软件,分析了哈大齐工业走廊2008年各县GDP空间分布状况,包括各县之间GDP水平的空间关联性、各县GDP水平与人口的空间关联性。研究发现:该时期内哈大齐工业走廊各县GDP水平在空间关联性上成正相关,相关系数较小,GDP空间分布并非表现出完全随机性,而是表现出空间相似值之间的空间聚集。GDP在空间上对人口的影响也成正相关。进一步对哈大齐各县GDP与普通中学毕业人数进行相关分析,发现两者成负相关,现有教育状况不能很好的满足经济发展需求。哈大齐工业走廊显示出了"劳动力密集型、资源密集型企业与低知识水平劳力集聚相适宜;技术密集型企业、资本密集型企业与高技术水平劳力密集相关"的规律。哈大齐工业走廊仍然处于工业化初期较高阶段。
|
| [11] |
上海市土地利用空间格局与地表温度关系研究 [J].Relationships between landscapes spatial pattern and land surface temperature in Shanghai [J]. |
| [12] |
基于可见光红外成像辐射仪数据的地表温度反演 [J].https://doi.org/10.3969/j.issn.1002-6819.2014.08.013 URL [本文引用: 1] 摘要
地表温度是农业旱灾和作物估产模型的重要参数。该文针对可见光红外成像辐射仪(visible infrared imager radiometer suite , VIIRS )传感器缺乏水汽通道的特点,联合 Aqua 卫星搭载的中分辨率成像光谱仪(moderate-resolution imaging spectroradiometer,MODIS)数据提出了基于分裂窗算法的VIIRS地表温度反演方法。对地表发射率和大气透过率这2个关键参数的获取进行了详细分析,选取了处于作物生长期的2013年6月4日VIIRS数据进行实例验证分析。结果表明,与全国气象数据比较该文算法在大尺度上能够较好地获取中国地表温度;与MODIS数据温度产品在高温产粮区比较,该文算法与MODIS温度产品精度较一致,两者差值小于1 K。使用MODTRAN(moderate resolution transmission)软件对算法的精度进行了模拟评价验证,分析表明:在一定的水汽和地表发射率条件下,算法反演精度一般保持在1 K内,平均误差为0.431 K,误差标准偏差为0.247 K。能够为农业干旱、作物长势等农情信息监测提供所需的地表温度数据。
Retrieval land surface temperature from visible infrared imager radiometer suite data [J].https://doi.org/10.3969/j.issn.1002-6819.2014.08.013 URL [本文引用: 1] 摘要
地表温度是农业旱灾和作物估产模型的重要参数。该文针对可见光红外成像辐射仪(visible infrared imager radiometer suite , VIIRS )传感器缺乏水汽通道的特点,联合 Aqua 卫星搭载的中分辨率成像光谱仪(moderate-resolution imaging spectroradiometer,MODIS)数据提出了基于分裂窗算法的VIIRS地表温度反演方法。对地表发射率和大气透过率这2个关键参数的获取进行了详细分析,选取了处于作物生长期的2013年6月4日VIIRS数据进行实例验证分析。结果表明,与全国气象数据比较该文算法在大尺度上能够较好地获取中国地表温度;与MODIS数据温度产品在高温产粮区比较,该文算法与MODIS温度产品精度较一致,两者差值小于1 K。使用MODTRAN(moderate resolution transmission)软件对算法的精度进行了模拟评价验证,分析表明:在一定的水汽和地表发射率条件下,算法反演精度一般保持在1 K内,平均误差为0.431 K,误差标准偏差为0.247 K。能够为农业干旱、作物长势等农情信息监测提供所需的地表温度数据。
|
| [13] |
城市地表温度热岛影响因素研究进展 [J].An overview and perspective about causative factors of surface urban heat island effects [J]. |
| [14] |
城市地域地表温度-植被覆盖定量关系分析: 以深圳市为例 [J].https://doi.org/10.3321/j.issn:1000-0585.2006.03.001 URL [本文引用: 1] 摘要
地表温度-植被覆盖间的关系一直是城市热岛研究的热点之一,两者均为描述生态系统特征的重要参数。本文利用深圳市2004年的ETM+影像,基于遥感技术提取相关的下垫面类型、地表温度和植被覆盖等信息,探讨不同下垫面类型对地表温度-植被覆盖关系的影响,并结合分形维度计算方法,比较不同分辨率下地表温度、植被覆盖及其相关关系的变化。研究结果表明,植被覆盖程度与地表温度之间存在明显的负相关,并且在不同的植被覆盖程度下,地表温度-植被覆盖关系呈现分段线性关系。下垫面类型及其组合主要通过植被覆盖的分布对地表温度产生影响。而在不同空间分辨率下(30m至960m),地表温度和植被覆盖的空间变异程度均表现为先升后降,在120m的分辨率下,两者的相关程度达到最高。结果证实区域植被覆盖状况可直接影响辐射、热动力以及土壤水分等多种地表特征,从而导致地表温度分异等。
Study on land surface temperature vegetation cover relationship in urban region: A case in Shenzhen City [J].https://doi.org/10.3321/j.issn:1000-0585.2006.03.001 URL [本文引用: 1] 摘要
地表温度-植被覆盖间的关系一直是城市热岛研究的热点之一,两者均为描述生态系统特征的重要参数。本文利用深圳市2004年的ETM+影像,基于遥感技术提取相关的下垫面类型、地表温度和植被覆盖等信息,探讨不同下垫面类型对地表温度-植被覆盖关系的影响,并结合分形维度计算方法,比较不同分辨率下地表温度、植被覆盖及其相关关系的变化。研究结果表明,植被覆盖程度与地表温度之间存在明显的负相关,并且在不同的植被覆盖程度下,地表温度-植被覆盖关系呈现分段线性关系。下垫面类型及其组合主要通过植被覆盖的分布对地表温度产生影响。而在不同空间分辨率下(30m至960m),地表温度和植被覆盖的空间变异程度均表现为先升后降,在120m的分辨率下,两者的相关程度达到最高。结果证实区域植被覆盖状况可直接影响辐射、热动力以及土壤水分等多种地表特征,从而导致地表温度分异等。
|
| [15] |
热红外遥感反演地表温度研究现状 [J].https://doi.org/10.3969/j.issn.1006-7639.2007.02.004 URL [本文引用: 1] 摘要
地球表面温度是一个重要的水文、气象参数,它影响着大气、海、陆之间的感热和潜热交换,是诸多研究领域不可或缺的基础资料,精确定量反演陆面温度的成果将推动旱灾预报和作物缺水研究、农作物产量估算、数值天气预报、全球气候变化和全球碳平衡等领域研究的进展.因此,利用卫星遥感资料进行地表温度的反演已成为目前遥感定量研究中的重要任务之一.本文阐述了遥感反演地表温度的原理及各种方法,对各种方法所要解决的关键问题及优缺点做了评述,最后展望了遥感反演地表温度的发展趋势.
Summary on retrieval of land surface temperature using thermal infrared remote sensing [J].https://doi.org/10.3969/j.issn.1006-7639.2007.02.004 URL [本文引用: 1] 摘要
地球表面温度是一个重要的水文、气象参数,它影响着大气、海、陆之间的感热和潜热交换,是诸多研究领域不可或缺的基础资料,精确定量反演陆面温度的成果将推动旱灾预报和作物缺水研究、农作物产量估算、数值天气预报、全球气候变化和全球碳平衡等领域研究的进展.因此,利用卫星遥感资料进行地表温度的反演已成为目前遥感定量研究中的重要任务之一.本文阐述了遥感反演地表温度的原理及各种方法,对各种方法所要解决的关键问题及优缺点做了评述,最后展望了遥感反演地表温度的发展趋势.
|
| [16] |
Evaluation of the DisTrad thermal sharpening methodology for urban areas [J].https://doi.org/10.1016/j.jag.2012.05.010 URL 摘要
The goal of this paper is to evaluate the DisTrad sharpening technique for deriving land surface temperatures over urban areas. While the original DisTrad technique is based on the correlation between land surface temperature and NDVI, this study evaluates the performance of DisTrad over different land covers by analysing the correlation between land surface temperature and 15 different indices: BASVI, R, B, NDWI, NDBaI, SVI, SAVI, NDBI, NDSI, UI, FC, VC, V, IBI, NDVI. In addition, we have analysed the correlation between land surface temperature and impervious percentage. These indices and land surface temperature were derived from a Landsat 7 ETM+ image of 2001 covering the city of Dublin. It is concluded that for most indices selecting 25% of the pixels with the lowest coefficient of variance increases the correlation between the index and the land surface temperature. Results show that the DisTrad technique in combination with impervious percentage sharpens urban areas at 30 m resolution most successfully. Although vegetation cover was high during acquisition of the image, the use of impervious percentage showed improved results compared to NDVI. This allows an improved estimation of spatial patterns of urban heat islands.
|
| [17] |
NDWI: A normalized difference water index for remote sensing of vegetation liquid water from space [J].https://doi.org/10.1016/S0034-4257(96)00067-3 URL [本文引用: 1] 摘要
The normalized difference vegetation index (NDVI), which is equal to (NIR- RED)/(NIR+RED), has been widely used for remote sensing of vegetation for many years. One weakness of this index is that the reflectance of RED channel has no sensitivity to changes in lead area index changes when the leaf area index is equal to 1 or greater due to strong chlorophyll absorption near 0.67 micron. In this paper, another index, namely the normalized difference water index (NDWI), is proposed for remote sensing of vegetation liquid water from space. NDWI is equal to [R(0.86 micrometers ) - R(1.24 micrometers )]/[R(0.86 micrometers ) + R(1.24 micrometers )], where R represents the apparent reflectance. At 0.86 micrometers and 1.24 micrometers , vegetation canopies have similar scattering properties, but slightly different liquid water absorption. The scattering by vegetation canopies enhances the weak liquid water absorption at 1.24 micrometers . As a result, NDWI is sensitive to changes in liquid water content of vegetation canopies. Spectral imaging data acquired with Airborne Visible Infrared Imaging Spectrometer (AVIRIS) over Jasper Ridge, California and Holland, Maine are used to demostrate the usefulness of NDWI. Comparisons between NDWI and NDVI images are also given. Because aerosol scattering effects in the 0.86-1.24 micrometers region are weak, NDWI is less sensitive to atmospheric effects that NDVI.
|
| [18] |
A verification of the 'triangle' method for obtaining surface soil water content and energy fluxes from remote measurements of the Normalized Difference Vegetation Index (NDVI) and surface e [J].https://doi.org/10.1080/014311697217026 URL [本文引用: 1] 摘要
An inversion procedure is presented for estimating surface soil water content (as surface moisture availability, M
|
| [19] |
The influence of soil salinity, growth form, and leaf moisture on the spectral radiance of Spartina alterniflora canopies [J].
ABSTRACT Spectra of Spartina alterniflora were measure under different salinity, growth form and moisture conditions.
|
| [20] |
Measurement of leaf relative water content by infrared reflectance [J].https://doi.org/10.1016/0034-4257(87)90094-0 URL [本文引用: 1] 摘要
From basic considerations and Beer's law, a leaf water content index incorporating reflectances of wavelengths from 0.76 to 0.90 渭m and from 1.55 to 1.75 渭m (Landsat Thematic Mapper Bands TM4 and TM5, respectively) was developed that relates leaf reflectance to leaf relative water content. For the leaf succulent, Agave deserti, the leaf water content index was not significantly different from the relative water content for either individual leaves or an entire plant. Also, the relative water contents of intact plants of Encelia farinosa and Hilaria rigida in the field were estimated by the leaf water content index; variations in the proportion of living to dead leaf area could cause large errors in the estimate of relative water content. Thus, the leaf water content index may be able to estimate average relative water content of canopies when TM4 and TM5 are measured at a known relative water content and fraction of dead leaf material.
|
| [21] |
A change detection experiment using vegetation indices [J].https://doi.org/10.1144/petgeo.4.1.95 URL [本文引用: 1] 摘要
Abstract Vegetation indices [m) have long been used in remote sens-ing for monitoring temporal changes associated with vegeta-tion. In this study, seven vegetation indices were compared for their value in vegetation and land-cover change detection in part of the State of Chiapas, Mexico. VI values were devel-oped from three different dates of Landsat Multispectral Scanner [MSS) data. The study suggested that (1) if normali-zation techniques were used, then all seven vegetation indi-ces could be grouped into three categories according to their computational procedures; (2) vegetation indices in different categories had significantly different statistical characteris-tics, and only NDVI showed normal distribution histograms; and [3), of the three vegetation index groups, the NDVI group was least affected b y topographic factors i n this study. Com-parisons of these techniques found that the NDVI difference technique demonstrated the best vegetation change detection as judged b y laboratory and field results.
|
| [22] |
Land surface emissivity retrieval based on moisture index from LANDSAT TM satellite data over heterogeneous surfaces of Delhi city [J].https://doi.org/10.1016/j.jag.2012.06.002 URL 摘要
Emissivity and surface temperature enables better understanding of the overall urban land use/land cover classes and in turn helps in understanding the energy budget issues. In the present study it has been demonstrated that the notion of the assumed spectral emissivity (i.e. 1) induces errors in modeling the surface energy budget and urban climatology (micro-climate), especially over heterogeneous surface areas (urban) where emissivity is far smaller than unity. An attempt has been made to derive emissivity by using normalized difference moisture index (NDMI). The emissivity per pixel has been retrieved directly from satellite data and has been estimated as narrow band emissivity at the satellite sensor channel in order to have least error in the surface temperature estimation. The estimated emissivity values over few land use/land cover (LULC) classes of LANDSAT TM have been compared with the literature values and field measurement emissivity data using infrared thermometer. A strong correlation is observed between surface temperatures with NDMI over different LULC classes. A regression relation between these parameters has been estimated (Pearson's correlation of 0.938), indicating that surface temperatures can be predicted if NDMI values are known. The error in field data (in situ) and satellite derived surface temperature is within the range of 2-3 掳C. The correlation coefficient between the satellite derived and field observed surface temperature is very high 鈮0.942 (significant at p value = 0.01). The results suggest that the methodology is feasible to estimate NDMI, surface emissivity and surface temperature with reasonable accuracy over heterogeneous urban areas.
|
| [23] |
Relationship between satellite-derived land surface temperatures, arctic vegetation types, and NDVI [J].https://doi.org/10.1016/j.rse.2007.09.008 URL [本文引用: 1] 摘要
Arctic vegetation distribution is largely controlled by climate, particularly summer temperatures. Summer temperatures have been increasing in the Arctic and this trend is expected to continue. Arctic vegetation has been shown to change in response to increases in summer temperatures, which in turn affects arctic fauna, human communities and industries. An understanding of the relationship of existing plant communities to temperature is important in order to monitor change effectively. In addition, variation along existing climate gradients can help predict where and how vegetation changes may occur as climate warming continues. In this study we described the spatial relationship between satellite-derived land surface temperature (LST), circumpolar arctic vegetation, and normalized difference vegetation index (NDVI). LST, mapped as summer warmth index (SWI), accurately portrayed temperature gradients due to latitude, elevation and distance from the coast. The SWI maps also reflected NDVI patterns, though NDVI patterns were more complex due to the effects of lakes, different substrates and different-aged glacial surfaces. We found that for the whole Arctic, a 5掳C increase in SWI along the climate gradient corresponded to an increase in NDVI of approximately 0.07. This result supports and is of similar magnitude as temporal studies showing increases of arctic NDVI corresponding to increases in growing season temperatures over the length of the satellite record. The strongest positive relationship between NDVI and SWI occurred in partially vegetated and graminoid vegetation types. Recently deglaciated areas, areas with many water bodies, carbonate soil areas, and high mountains had lower NDVI values than predicted by SWI. Plant growth in these areas was limited by substrate factors as well as temperature, and thus is likely to respond less to climate warming than other areas.
|
| [24] |
Note on the NDVI-LST relationship and the use of temperature-related drought indices over North America [J].https://doi.org/10.1029/2007GL031485 URL [本文引用: 1] 摘要
A comprehensive evaluation of the relationship between vegetation and Land Surface Temperature (LST) over the North America is presented. It is found that the correlations between LST and Normalized Difference Vegetation Index (NDVI) depend on the season-of-year and time-of-day. For winter, the correlation between NDVI and LST is positive. The strong negative correlations between LST and NDVI are only found during the warm seasons. Thus temperature-related drought indices may only be used in the warm seasons from May to October, and should be used with caution during cold seasons in North America. The cooling effect of vegetation on LST is stronger during daytime than nighttime. Moreover, the negative correlations between NDVI and LST are much stronger than those between NDVI and the brightness temperature. Therefore using daytime LST for drought monitoring should be more reasonable than using brightness temperature or nighttime LST.
|
| [25] |
Using MODIS Land Surface Temperature and Normalized Difference Vegetation Index products for monitoring drought in the southern Great Plains, USA [J].https://doi.org/10.1080/0143116031000115328 URL [本文引用: 1] 摘要
A near-real time drought monitoring approach is developed using Terra-Moderate Resolution Imaging Spectoradiometer (MODIS) Normalized Difference Vegetation Index (NDVI) and Land Surface Temperature (LST) products. The approach is called Vegetation Temperature Condition Index (VTCI), which integrates land surface reflectance and thermal properties. VTCI is defined as the ratio of LST differences among pixels with a specific NDVI value in a sufficiently large study area; the numerator is the difference between maximum LST of the pixels and LST of one pixel; and the denominator is the difference between maximum and minimum LSTs of the pixels. VTCI is lower for drought and higher for wet conditions. The ground-measured precipitation data from a study area covering parts of the states of Texas and Oklahoma in the southern Great Plains, USA, are used to validate the drought monitoring approach. Linear correlation analysis between VTCI, and total monthly precipitation and departure from normal monthly precipitation shows that VTCI is not only closely related to recent rainfall events but also related to past rainfall amounts, and indicates that VTCI might be a better and a near-real time drought monitoring approach.
|
| [26] |
Estimation of land surface temperature-vegetation abundance relationship for urban heat island studies [J].https://doi.org/10.1016/j.rse.2003.11.005 URL [本文引用: 1] 摘要
Remote sensing of urban heat islands (UHIs) has traditionally used the Normalized Difference Vegetation Index (NDVI) as the indicator of vegetation abundance to estimate the land surface temperature (LST)鈥搗egetation relationship. This study investigates the applicability of vegetation fraction derived from a spectral mixture model as an alternative indicator of vegetation abundance. This is based on examination of a Landsat Enhanced Thematic Mapper Plus (ETM+) image of Indianapolis City, IN, USA, acquired on June 22, 2002. The transformed ETM+ image was unmixed into three fraction images (green vegetation, dry soil, and shade) with a constrained least-square solution. These fraction images were then used for land cover classification based on a hybrid classification procedure that combined maximum likelihood and decision tree algorithms. Results demonstrate that LST possessed a slightly stronger negative correlation with the unmixed vegetation fraction than with NDVI for all land cover types across the spatial resolution (30 to 960 m). Correlations reached their strongest at the 120-m resolution, which is believed to be the operational scale of LST, NDVI, and vegetation fraction images. Fractal analysis of image texture shows that the complexity of these images increased initially with pixel aggregation and peaked around 120 m, but decreased with further aggregation. The spatial variability of texture in LST was positively correlated with those in NDVI and in vegetation fraction. The interplay between thermal and vegetation dynamics in the context of different land cover types leads to the variations in spectral radiance and texture in LST. These variations are also present in the other imagery, and are responsible for the spatial patterns of urban heat islands. It is suggested that the areal measure of vegetation abundance by unmixed vegetation fraction has a more direct correspondence with the radiative, thermal, and moisture properties of the Earth's surface that determine LST.
|
| [27] |
Comparison of impervious surface area and normalized difference vegetation index as indicators of surface urban heat island effects in Landsat imagery [J].https://doi.org/10.1016/j.rse.2006.09.003 URL [本文引用: 1] 摘要
This paper compares the normalized difference vegetation index (NDVI) and percent impervious surface as indicators of surface urban heat island effects in Landsat imagery by investigating the relationships between the land surface temperature (LST), percent impervious surface area (%ISA), and the NDVI. Landsat Thematic Mapper (TM) and Enhanced Thematic Mapper Plus (ETM+) data were used to estimate the LST from four different seasons for the Twin Cities, Minnesota, metropolitan area. A map of percent impervious surface with a standard error of 7.95% was generated using a normalized spectral mixture analysis of July 2002 Landsat TM imagery. Our analysis indicates there is a strong linear relationship between LST and percent impervious surface for all seasons, whereas the relationship between LST and NDVI is much less strong and varies by season. This result suggests percent impervious surface provides a complementary metric to the traditionally applied NDVI for analyzing LST quantitatively over the seasons for surface urban heat island studies using thermal infrared remote sensing in an urbanized environment.
|
| [28] |
Bi-temporal characterization of land surface temperature in relation to impervious surface area, NDVI and NDBI, using a sub-pixel image analysis [J].https://doi.org/10.1016/j.jag.2009.03.001 URL 摘要
As more than 50% of the human population are situated in cities of the world, urbanization has become an important contributor to global warming due to remarkable urban heat island (UHI) effect. UHI effect has been linked to the regional climate, environment, and socio-economic development. In this study, Landsat Thematic Mapper (TM) and Enhanced Thematic Mapper Plus (ETM+) imagery, respectively acquired in 1989 and 2001, were utilized to assess urban area thermal characteristics in Fuzhou, the capital city of Fujian province in south-eastern China. As a key indicator for the assessment of urban environments, sub-pixel impervious surface area (ISA) was mapped to quantitatively determine urban land-use extents and urban surface thermal patterns. In order to accurately estimate urban surface types, high-resolution imagery was utilized to generate the proportion of impervious surface areas. Urban thermal characteristics was further analysed by investigating the relationships between the land surface temperature (LST), percent impervious surface area, and two indices, the Normalized Difference Vegetation Index (NDVI) and Normalized Difference Built-up Index (NDBI). The results show that correlations between NDVI and LST are rather weak, but there is a strong positive correlation between percent ISA, NDBI and LST. This suggests that percent ISA, combined with LST, and NDBI, can quantitatively describe the spatial distribution and temporal variation of urban thermal patterns and associated land-use/land-cover (LULC) conditions.
|

/
| 〈 |
|
〉 |