袁玉娟 , 尹云鹤, 戴尔阜
YUAN Yujuan, YIN Yunhe, DAI Erfu
通讯作者:
接受日期: 2015-05-27
网络出版日期: 2016-05-27
版权声明: 2016 地理科学进展 《地理科学进展》杂志 版权所有
基金资助:
作者简介:
作者简介:袁玉娟(1989-),女,河北衡水人,硕士生,主要从事植被遥感研究,E-mail: yuanyj.12s@igsnrr.ac.cn。
展开
摘要
全球变化背景下,准确获取森林覆盖是监测森林资源动态、实现林业可持续发展的重要基础。为将省级尺度森林资源清查面积资料空间化,以黑龙江省为例,利用1999-2003年该省森林资源清查面积数据,结合2000年500 m分辨率的MODIS数据,构建了基于阈值分割的森林类型遥感识别方法。该方法利用不同地表覆被类型归一化植被指数时间序列的季节分异特征,以森林资源清查面积为标准,设定森林类型的划分阈值,识别了黑龙江省森林类型的空间分布。最后,基于分层随机抽样和精度评价方法,表明森林类型识别结果与地面参考数据具有较高的一致性,总体分类精度为78.1%;特别是季节特征明显的落叶林,精度可达80%以上。本文所构建的方法可将森林清查统计数据进行准确的空间定位,同时结合多期森林资源连续清查资料和遥感信息,可为识别并量化区域生态系统生物量和碳库变化等提供科技支撑。
关键词:
Abstract
Accurately identifying spatial distribution of forest is critically important for dynamic monitoring and sustainable management of forest resources. In this article, in order to acquire a spatially explicit forest cover classification based on the national forest inventory (NFI) statistics at the provincial scale, we developed an identification method using threshold values based on forest area from NFI statistics in 1999-2003 and the Moderate Resolution Imaging Spectroradiometer (MODIS) surface reflectance data in 2000 with a spatial resolution of 500 m for Heilongjiang Province. Based on the seasonal difference of Normalized Difference Vegetation Index (NDVI) of various forest types, threshold values between different forest types in satellite data were set using the NFI statistical data as criteria. Four forest types were differentiated: evergreen needleleaf, deciduous broadleaf, deciduous needleleaf, and mixed forests. Due to the stratified random sampling method used in this study and reliable threshold identification, the accuracy assessment result shows that the spatial pattern of forest cover classifications is highly consistent with the ground reference map, with an overall classification accuracy of 78.1%. Specifically, the applied method resulted in higher classification accuracy for deciduous forests that have distinct seasonal variations of NDVI (with user accuracy above 80%). The study provides a practical method for spatially explicit forest coverage estimation, and for quantifying changes in biomass and carbon stock in the ecosystem at the regional scale based on several periods of NFI statistics and remote sensing data.
Keywords:
森林是陆地生态系统的关键组成部分,不仅能提供重要资源和栖息地,而且在调节全球及区域水循环和碳循环中起着关键作用(FAO, 2010; Pan et al, 2011; Fang et al, 2014)。森林空间分布可反映区域中的森林重要性,其变化通常由植树造林或砍伐毁林等导致(Shi et al, 2011)。陆地表层森林覆盖信息的准确识别是评估森林资源变化、辨识人类活动影响的重要基础(Erb et al, 2007; Hansen et al, 2013)。因此,准确获取森林类型空间分布是全球变化研究的热点问题之一。
森林资源清查是基于地面调查数据获得森林资源信息的传统方法(肖兴威, 2005)。中国森林资源清查始于20世纪70年代,每五年开展一次,通常以行政区为统计单元发布森林面积、蓄积量及结构统计数据,为及时准确掌握森林资源现状和变化提供了科学依据(中国森林编辑委员会, 1997)。森林资源清查统计数据已广泛应用于估算森林生物碳储量和物种分布等研究(Schroeder et al, 1997; Fang et al, 2001; Guo et al, 2010; Pan et al, 2011; Hernández et al, 2014)。然而,目前可获取的森林清查数据通常以行政区为统计单元,但当前研究对空间精度要求越来越高。
遥感作为一种先进的对地观测手段得到普遍应用,可提供大范围、较高时空分辨率的森林空间分布(Myneni et al, 2001; 李虎等, 2003; Jia et al, 2014; 夏浩铭等, 2015)。植被遥感指数,例如归一化植被指数(NDVI),可有效地反映植物生长状况和生物量等,在土地覆盖分类中具有重要作用(Tucker, 1979; Defries et al, 1994; Viana et al, 2012)。为充分利用森林清查资料,将其与遥感数据相结合进行空间格局研究具有重要意义。一方面可发挥遥感数据的空间定位准确的优势,另一方面能体现出地面详查资料定量准确的优势(刘双娜等, 2012)。
近年来,森林清查资料与遥感数据相结合的技术在森林植被类型覆盖识别和森林植被碳源/汇的空间分布定量估算等方面得到较广泛应用(Päivinen et al, 2001; Kennedy et al, 2002; 刘双娜等, 2012)。目前,常见研究大致可分为以下两类:一是根据现有森林分布图和资源清查统计两者面积之间的比例关系,利用迭代算法调整森林分布,从而使森林面积与区域清查统计数据相一致或误差最小(Päivinen et al, 2001, 2003; Schuck et al, 2003; Tröltzsch et al, 2009);二是融合土地利用图和统计资料,揭示区域或全球土地利用变化,具体算法包括最大似然估计和优度拟合(Hurtt et al, 2006)、误差最小分配算法(Erb et al, 2007)以及二分迭代法(Liu et al, 2010)等。总体上,目前研究多基于已有植被空间格局信息,而较少直接利用遥感影像数据进行基于两类数据结合的森林类型识别。
本文主要基于2000年MODIS遥感数据和1999-2003年省级尺度森林清查统计数据,利用NDVI时间序列的季节分异特征,明确森林类型划分阈值,识别森林类型的空间分布,并将本文结果与植被图和MODIS土地覆盖产品进行对比分析和精度评价。本文主要目的是利用多时相遥感数据将森林清查面积数据进行空间化,进而为准确辨识人类活动对森林生态系统影响,监测森林资源动态,实现林业可持续发展及适应气候变化提供科技支撑。
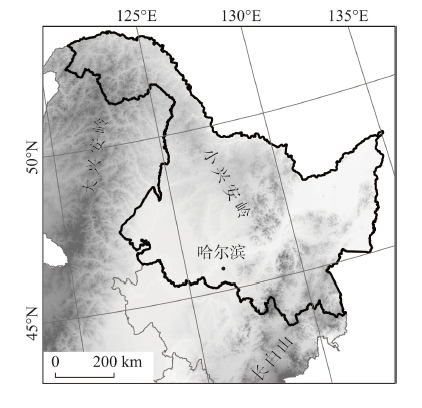
本文以位于中国东北部温带气候区的黑龙江省为研究区(43°26′~53°33′N,121°11′~135°05′E),土地总面积为4540万 hm2(图1)。该区属东亚季风气候,水热条件的季节变化和空间分布差异明显,年平均气温约为-4~5℃,年降水量约为400~650 mm。黑龙江省植被类型主要为森林、草原和农田,其中森林资源丰富,森林面积达1962万hm2,森林覆盖率达43.16%(国家林业局, 2010)。由于黑龙江省位于中高纬度地区,气候和植被的季节差异特征尤为明显,因此是进行森林类型遥感识别研究的理想 区域。
天然林资源是黑龙江省森林资源的主体,主要分布在大兴安岭、小兴安岭、以及张广才岭和老爷岭等东部山地。大兴安岭山地北部属寒温带落叶针叶林区,以兴安落叶松(Larix gmelinii)为优势树种,乔木层结构较为简单,还分布有樟子松(Pinus sylvestris)和红皮云杉(Picea koraiensisi),但面积不大,伴生有白桦(Betula platyphylla)和山杨(Populus davidiana)等。小兴安岭和东部山地属中温带针阔叶林区,针叶树种以红松(Pinus koraiensis)为主,阔叶树种有蒙古栎(Quercus mongolica)、紫椴(Tilia amurensis)、色木槭(Acer mono)等。人类活动的不断加剧及火灾活动的频发导致樟子松逐渐减少,而且随着白桦等阔叶次生林的生长,逐步形成了针阔混交林(中国科学院中国植被图编辑委员会, 2007)。
2.2.1 森林资源清查数据
本文采用的黑龙江省森林面积数据来自《全国森林资源统计》(1999-2003年)(国家林业局森林资源管理司, 2005)。参考《国家森林资源清查主要技术规定》(国家林业局, 2014)和《中国森林》(中国森林编辑委员会, 1997),将森林资源统计中的各乔木优势树种划分为4种类型,即常绿针叶林(ENF)、落叶针叶林(DNF)、落叶阔叶林(DBF)和混交林(MF),其面积分别为83.82万hm2、394.89万hm2、1198.28万hm2和115.19万hm2。
2.2.2 MODIS NDVI数据
研究区2000年的MODIS地表反射率数据(MOD09A1)为500 m空间分辨率,8 d合成的三级产品,通过NASA Land Processes Distributed Active Archive Center(LPDAAC)获取。MOD09A1产品已经进行了云和气溶胶等校正(Vermote et al, 2015)。NDVI由红外反射率(ρRed)和近红外反射率(ρNIR)通过式(1)计算得到:
数据经过云检测、插值和统计,得到NDVI及近红外波段反射率的年最小值(NDVIn,NIRn)、NDVI最大值(NDVIx)、生长旺季(NDVI达最大值前后96 d时段)NDVI均值(NDVIa)(Liu et al, 2013)。
2.2.3 MODIS土地覆盖数据
本文采用2001年MODIS土地覆盖数据进行森林类型遥感识别结果的对比分析。MODIS土地覆盖数据(MCD12Q1)空间分辨率为500 m,同样来自NASA LPDAAC。MCD12Q1是基于大量高精度训练数据,采用监督分类方法形成的,包括自2001年至今逐年土地覆盖数据(Friedl et al, 2010)。MCD12Q1的森林分类与植被图分类体系一致。
2.2.4 中国植被图
本文以1:100万中国植被图作为地面参考数据来评价森林类型遥感识别精度。数据来自中国科学院资源环境科学数据中心(http://www.resdc.cn/data.aspx?DATAID=122)。该植被图基于大量野外调查,反映了20世纪90年代中国主要植被类型及其分布格局(中国科学院中国植被图编辑委员会, 2007),与本文所识别的2000年森林类型时段相近。本文将植被图中的森林分为常绿针叶林(ENF)、常绿阔叶林(EBF)、落叶针叶林(DNF)、落叶阔叶林(DBF)及混交林(MF),并进行投影转换和栅格化,使之与MODIS空间分辨率相匹配。
2.3.1 阈值分割方法
阈值分割方法是遥感识别土地覆盖类型的常用方法之一。该方法首先选择不同类型之间存在显著差异的指标,再确定相关指标的阈值,进而达到识别土地覆盖类型空间信息的目的(王志慧等, 2013; DeVries et al, 2015)。在较大空间尺度上,遥感植被结构特征(如NDVI)在不同覆盖类型间存在显著差异 (Running et al, 1995; Nemani et al, 1997)。通常草地NDVI在生长季明显低于森林;相对于常绿林,落叶林的NDVI则具有明显的季节分异性。近年来,基于NDVI季节特征进行土地覆盖类型识别的研究越来广泛(贾明明等, 2014; 杨存建等, 2014)。阈值分割方法的难点和关键在于阈值的准确选取(吴健生等, 2013; 姜洋等, 2014; 雷光斌等, 2014)。本文利用遥感NDVI的季节特征,依据森林资源清查数据确定阈值,进行森林类型遥感识别。
首先,根据NDVIa区分森林与其他土地覆盖类型。多年生森林与一年生农作物和草地的最显著区别是非生长季地上活动生物量能否存在(Running et al, 1995)。一般情况下,NDVI高值代表高度植被覆盖,并具有较高地上生物量。因此,生长季森林相比其他植被类型通常具有较高的NDVIa。
其次,利用NDVIx-n(年内NDVIx与NDVIn的差值)区分落叶林和常绿林。遥感植被指数的时相变化可表征高纬度地区植被物候变化(Zhang et al, 2003),这是一个区别落叶林和常绿林的重要特征(Nemani et al, 1997)。一般情况下,落叶林NDVI年内变化较为明显,而常绿林NDVI年内变化相对不明显。混交林的NDVI变化则为落叶林和常绿林特征(Olofsson et al, 2014)的平均值。此处,利用上一过程提取的森林作为掩膜,在森林分布区以NDVIx-n为分类指标。
最后,采用近红外地表反射率区分针叶林和阔叶林。由于叶片结构的差异,针叶林和阔叶林反射率差别较大,阔叶林的反射率高于针叶林,尤其是在近红外波段反射率差异更为明显(Nemani et al, 1997)。因此,本文以NIRn作为进一步区分针叶林和落叶林的指标。
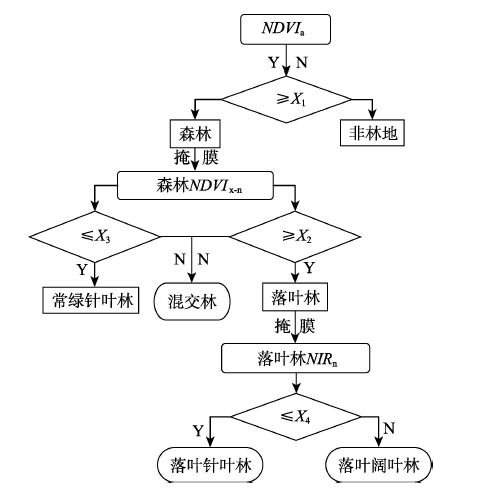
基于阈值分割的森林类型遥感识别方法的具体过程如图2所示。在第一级分类中,所有栅格中像元特征值NDVIa大于等于阈值(X1)的分类为森林。第二级分类中,森林栅格像元特征值NDVIx-n大于等于阈值(X2)的分类为落叶林,小于等于阈值(X3)的分类为常绿林,其余的森林栅格分类为混交林。研究区内不存在常绿阔叶林,因而常绿林即为常绿针叶林。在第三级分类中,落叶林栅格像元特征值NIRn大于阈值(X4)的分类为落叶阔叶林,其余的落叶林栅格分类为落叶针叶林。
图2 基于阈值分割的森林类型遥感识别方法流程图
Fig.2 Flowchart of remote sensing forest cover classification based on threshold values consistent with statistics
确定阈值的具体方法是,首先将待分类栅格按像元特征值大小排序,设定某一像元特征值为阈值进行分类,并计算基于该阈值分割后的栅格面积,然后统计其与相应森林类型的清查面积之间的误差,不断调整优化阈值直至面积间误差最小。基于此,本文阈值X1、X2、X3和X4分别为0.7692、0.3561、0.3077和0.2765。
2.3.2 精度评价方法
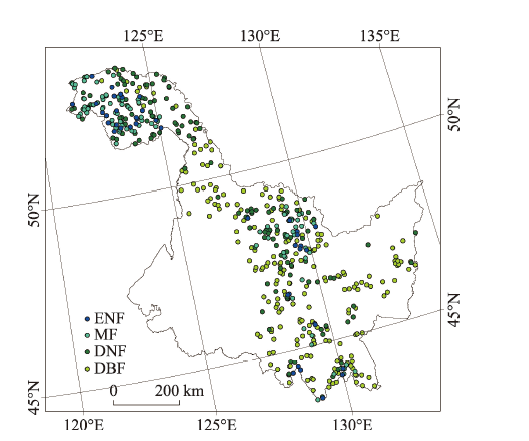
利用植被图作为参照数据是目前进行精度评价的主要且可靠的方法(李俊祥等, 2005; 顾娟等, 2010)。本文采用1:100万中国植被图作为地面参考数据,并结合基于概率的分层随机抽样方法,对森林类型遥感识别结果开展精度评价。随机抽样方法中采用分层设计,允许指定每个层的样本量,以确保每层获得一个精确的估计(Olofsson et al, 2014)。基于森林类型识别结果,设计4层抽样,随机选择489个样本(图3),同时确保每层样本量与该层的面积成正比(常绿针叶林41个,混交林87个,落叶针叶林145个和落叶阔叶林216个)。研究区内的样点分布如图3所示。参考Olofsson等(2014)的方法计算混淆矩阵,以制图精度和总体精度来评估本文的分类精度。其中某类型的制图精度以划分为某类森林面积占参考植被图中该类森林面积的比例来表征,总体精度表示分类类型一致的栅格面积占总采样点面积的比例。
图3 分层随机抽样选取的样点分布
Fig.3 Distribution of samples using probability-based stratified random sampling method in Heilongjiang Province
以黑龙江省为例,基于MODIS数据和森林资源清查数据,采用阈值法识别森林类型。黑龙江省2000年森林类型空间分布如图4a所示。总体上,本文构建的方法所得的结果不仅能有效反映森林空间分布,而且各森林类型面积与清查统计面积相近,相对误差小于1‰。分类结果能基本反映黑龙江省森林植被的覆盖状况,其中落叶阔叶林分布最广,主要分布在研究区长白山和小兴安岭大部地区,面积为1198.22万hm2,占森林总面积的66.86%。落叶针叶林面积为394.87万hm2,占森林总面积的22.03%,主要分布在大兴安岭北部。混交林和常绿针叶林面积相对较小,分别为115.13万hm2和83.82万hm2,主要分布于小兴安岭中部和东部山地部分地区。
为检验森林类型遥感识别的精度,参考1:100万植被图进行评价。对比本文结果(图4a)与植被图(图4b)发现,总体上两者在森林类型整体分布上吻合程度较高,斑块形状基本与植被图中对应类型相近,而且本文结果可反映较多细节信息。
表1给出了基于分层随机抽样产生的489个样点的混淆矩阵和精度评价结果。可以看出,本文识别方法的总体分类精度可达78.1%。其中,具有明显季节特征的落叶林精度相对较高,落叶阔叶林和落叶针叶林的制图精度分别为81.5%和80.0%。常绿针叶林和混交林精度相对较低,分别为70.7%和70.1%,这可能是由于两种森林面积相对较小,分布相对破碎造成的。
表1 森林类型的遥感识别结果与地面参照数据的混淆矩阵和精度评价
Tab.1 Confusion matrix and accuracy assessment of the present forest cover classification compared to the ground reference for Heilongjiang Province
| 遥感识别结果 | 地面参照(栅格数) | 总计(栅格数) | 制图精度/% | |||
|---|---|---|---|---|---|---|
| 落叶阔叶林 | 落叶针叶林 | 常绿针叶林 | 混交林 | |||
| 落叶阔叶林 | 176 | 18 | 4 | 18 | 216 | 81.5 |
| 落叶针叶林 | 21 | 116 | 6 | 2 | 145 | 80.0 |
| 常绿针叶林 | 2 | 4 | 29 | 6 | 41 | 70.7 |
| 混交林 | 18 | 6 | 2 | 61 | 87 | 70.1 |
| 总计 | 217 | 144 | 41 | 87 | 489 | 78.1 |
从空间上看,研究区中部和西北部遥感识别结果和植被图相比差异较大,且分布范围相对有所扩大。这与两者数据源的空间分辨率以及所代表时段不同有关,此外也反映出20世纪90年代以来黑龙江省森林覆盖率的提高。
另外,将本文结果与MCD12Q1土地覆盖产品进行对比(图4a和图4c),具体是计算MCD12Q1各森林覆盖类型的面积,并将其与本文遥感识别结果相应类型面积进行比较。结果表明,两者的森林面积相近,分别为1792.0万hm2、1709.3万hm2,但不同森林类型的具体分布存在明显差异。表2给出了本文和MCD12Q1土地覆盖产品的森林面积对比结果。结果表明:黑龙江省森林类型以落叶阔叶林为主,占森林总面积的66.86%。根据MCD12Q1,落叶阔叶林仅占森林总面积的28.84%;混交林为研究区主要森林类型,分布比例为64.03%,与本文结果和森林资源清查统计数据相比差异明显。相对MCD12Q1而言,本文结果与地面参照数据更为相近,说明本文方法可更为客观地表征研究区森林类型的实际分布状况。
表2 本文结果和MCD12Q1产品森林覆盖面积对比
Tab.2 Comparison of forest areas between the present forest cover classification and MCD12Q1 for Heilongjiang Province
| 森林分类 | 本文结果 | MCD12Q1 | |||
|---|---|---|---|---|---|
| 面积/万hm2 | 比例/% | 面积/万hm2 | 比例/% | ||
| 落叶阔叶林(DBF) | 1198.22 | 66.86 | 493.06 | 28.84 | |
| 落叶针叶林 (DNF) | 394.87 | 22.04 | 113.50 | 6.64 | |
| 常绿针叶林 (ENF) | 83.82 | 4.68 | 8.19 | 0.48 | |
| 混交林(MF) | 115.13 | 6.42 | 1094.36 | 64.03 | |
| 常绿阔叶林 (EBF) | 0.00 | 0.00 | 0.10 | 0.01 | |
本文主要利用MODIS植被遥感NDVI时间序列的季节分异特征,以森林资源清查面积资料为依据,确定森林类型划分阈值,进行森林清查统计资料空间化方法研究。本文方法的优势在于对森林清查统计数据进行准确空间定位,解决了当前研究中森林遥感识别结果与清查统计资料之间存在明显差异的问题。
通过以黑龙江省为例,利用2000年MODIS NDVI生长旺季均值,NDVI年内差值及最小近红外反射率作为识别指标,并利用1999-2003年该省森林资源清查中的乔木优势种面积统计资料来设定森林类型划分阈值,以此为基础识别出黑龙江省常绿针叶林、落叶针叶林、落叶阔叶林和混交林的空间分布格局。进一步以植被图作为地面参考数据,通过分层随机抽样方法选取489个样点开展了定量化的精度评价。分析表明,森林类型遥感识别结果的总体分类精度较高(78.1%),其中落叶林分类精度可达80%以上。总体上,基于阈值分割的森林类型遥感识别方法具有较高精度,但仍存在不确定性。不确定性主要源于数据和识别方法,主要包括遥感植被指数代表性、遥感影像空间分辨率及不同分类体系中森林定义的差异。
本文综合利用森林资源清查统计数据和遥感数据,建立森林类型遥感识别的指标和阈值,构建了基于阈值分割的森林类型遥感识别方法。通过与地面参照数据和MODIS土地覆盖产品对比,表明本文建立的识别方法具有较高精度,识别的森林类型面积与森林清查统计面积差异最小,并且能准确反映空间信息,这也是该方法的优势。
该方法对森林类型的判别阈值较为敏感,结果的不确定性主要来自遥感数据。NDVI是常用来表征植被覆盖和生长状况的植被指数(Myneni et al, 1997; Walker et al, 2012),国内外众多学者从不同尺度开展的研究表明,利用MODIS NDVI时间序列数据可获得的土地覆盖分类结果精度较高(Lunetta et al, 2006; 付安民等, 2010; 顾娟等, 2010; Zhao et al, 2013; Lin et al, 2016; Shao et al, 2016)。然而NDVI的局限性也不可忽视,例如它对高水平的生物量和叶绿素浓度易饱和(Huete et al, 2002),易受水汽和气溶胶的污染(Jeganathan et al, 2010)。此外,病虫害和森林火灾等也可能会对NDVI产生影响(George et al, 2006)。
遥感影像的分辨率问题是另一个不确定性来源,特别是在土地覆盖类型较破碎的地区。采用500 m分辨率的MODIS数据,混合像元可能会在一定程度上影响植被遥感识别的精度(Chen et al, 2013)。本文基于MODIS遥感数据进行了方法探索,主要目的是解决目前植被遥感识别研究中,森林识别面积与国家森林清查公布的统计数据间存在较大差异的问题。未来研究将借助更高空间分辨率的遥感影像,以提高对区域尺度森林类型空间分布的识别能力。
森林资源清查数据的精度也是影响研究结果的主要因素之一。尽管本文中黑龙江省森林资源清查的样地设计精度可达95%(肖兴威, 2005),然而外业调查的抽样方案、调查手段与工具,调查结果的统计方法及其他主观因素仍会影响森林清查数据的精度,从而在一定程度上影响本文识别结果精度。此外,不同分类体系中的森林定义不同,也可能影响精度评价结果。例如在MCD12Q1产品中,混交林定义为阔叶林和针叶林均不超过60%(Friedl et al, 2010);而在森林资源清查中,混交林定义为针叶树种或阔叶树种总蓄积量占35%~65%(国家林业局, 2014)。
The authors have declared that no competing interests exist.
| [1] |
基于MODIS数据的东北亚森林时序变化分析 [J].Forest changes detection in the Northeastern Asia using MODIS imagery [J]. |
| [2] |
基于时序MODIS NDVI的黑河流域土地覆盖分类研究 [J].
<p> 归一化植被指数(NDVI)是植被生长状态及植被覆盖度的最佳指示因子,其时序数据也已成为基于生物气候特征开展大区域植被和土地覆盖分类的基本手段。基于时序NDVI数据的土地覆盖分类,即通过提取NDVI时间信号所包含的植被生物学参数,构建起一个包含植被生物学信息的分类特征空间。利用2006年重建得到的MODIS NDVI 16天合成时间序列数据,并结合1 km分辨率的DEM数据、野外实地调查资料等辅助数据,综合分析了不同土地覆盖类型对应的时序NDVI谱线及其第一、二谐波的特征阈值,建立决策树对黑河流域的土地覆盖开展分类研究。结果表明,基于时序MODIS NDVI谱线特征的决策树分类精度为78%,Kappa系数为0.74。利用1 km时序MODIS NDVI时间序列获得较为准确的黑河流域土地覆盖类型是可行的。</p>
Land cover classification based on time-series MODIS NDVI data in Heihe River Basin [J].
<p> 归一化植被指数(NDVI)是植被生长状态及植被覆盖度的最佳指示因子,其时序数据也已成为基于生物气候特征开展大区域植被和土地覆盖分类的基本手段。基于时序NDVI数据的土地覆盖分类,即通过提取NDVI时间信号所包含的植被生物学参数,构建起一个包含植被生物学信息的分类特征空间。利用2006年重建得到的MODIS NDVI 16天合成时间序列数据,并结合1 km分辨率的DEM数据、野外实地调查资料等辅助数据,综合分析了不同土地覆盖类型对应的时序NDVI谱线及其第一、二谐波的特征阈值,建立决策树对黑河流域的土地覆盖开展分类研究。结果表明,基于时序MODIS NDVI谱线特征的决策树分类精度为78%,Kappa系数为0.74。利用1 km时序MODIS NDVI时间序列获得较为准确的黑河流域土地覆盖类型是可行的。</p>
|
| [3] |
第八次森林资源清查数据: 七省(区)主要结果 [R].Dibaci senlin ziyuan qingcha shuju: Qi sheng (qu) zhuyao jieguo [R]. |
| [4] |
|
| [5] |
全国森林资源统计数据(1999-2003) [R].Forest resources statistics of China (1999-2003) [R]. |
| [6] |
基于环境星与MODIS时序数据的面向对象森林植被分类 [J].https://doi.org/10.5846/stxb201310112438 Magsci [本文引用: 2] 摘要
林区地形复杂、植被分布无序,且森林植被光谱信息相近,因而森林二级类型边界的确定成为土地覆盖遥感分类的难点.选择吉林省东部山区为研究区,以环境星影像(HJ-1 CCD)和中等分辨率成像光谱仪(MODIS)时序数据为基础,采用面向对象的分类方法进行森林植被类型的提取.分类特征参数主要选取了HJ-1 CCD的光谱和纹理特征,以及MODIS时序数据的物候特征.研究区总体分类精度为91.5%,Kappa系数为0.88,森林二级类型的分类精度均较高,其中落叶阔叶林的制图精度达到了97.1%.所用的面向对象分类方法与未加入物候特征的面向对象分类方法相比,森林二级类型的分类精度得到大幅度提高.
Object-oriented forest classification based on combination of HJ-1 CCD and MODIS-NDVI data [J].https://doi.org/10.5846/stxb201310112438 Magsci [本文引用: 2] 摘要
林区地形复杂、植被分布无序,且森林植被光谱信息相近,因而森林二级类型边界的确定成为土地覆盖遥感分类的难点.选择吉林省东部山区为研究区,以环境星影像(HJ-1 CCD)和中等分辨率成像光谱仪(MODIS)时序数据为基础,采用面向对象的分类方法进行森林植被类型的提取.分类特征参数主要选取了HJ-1 CCD的光谱和纹理特征,以及MODIS时序数据的物候特征.研究区总体分类精度为91.5%,Kappa系数为0.88,森林二级类型的分类精度均较高,其中落叶阔叶林的制图精度达到了97.1%.所用的面向对象分类方法与未加入物候特征的面向对象分类方法相比,森林二级类型的分类精度得到大幅度提高.
|
| [7] |
浙江省森林信息提取及其变化的空间分布 [J].https://doi.org/10.5846/stxb201310172506 Magsci [本文引用: 1] 摘要
如何利用遥感技术提取森林信息是遥感应用的重要领域之一.以不同时相的Landsat TM/ETM+为数据源,采用面向对象和基于多级决策树的分类方法得到浙江省2000年、2005年以及2010年的森林植被覆被图.经实地采样点验证,2010年分类精度达到92.76%,精度满足要求.介绍了浙江森林信息的快速提取方法,即统计不同森林类型的Landsat TM影像原始波段和LBV变换值以及各种植被指数在各时相上的差异,经过C5决策树训练,选取合适的规则和阈值实现森林信息的提取.结果表明,面向对象分割与决策树算法结合可以作为森林信息提取的有效方法.最后,通过对3期森林专题图进行空间叠加分析,得到了森林资源动态变化的空间分布,并以此为基础对林地变化的类型及原因进行分析,结果显示浙江省森林资源变化主要分布在浙西北山区、浙中南山区以及沿海地带,这一结果可以为有关部门的决策提供依据.
The extraction of forest information and the spatial distribution of its change in Zhejiang Province [J].https://doi.org/10.5846/stxb201310172506 Magsci [本文引用: 1] 摘要
如何利用遥感技术提取森林信息是遥感应用的重要领域之一.以不同时相的Landsat TM/ETM+为数据源,采用面向对象和基于多级决策树的分类方法得到浙江省2000年、2005年以及2010年的森林植被覆被图.经实地采样点验证,2010年分类精度达到92.76%,精度满足要求.介绍了浙江森林信息的快速提取方法,即统计不同森林类型的Landsat TM影像原始波段和LBV变换值以及各种植被指数在各时相上的差异,经过C5决策树训练,选取合适的规则和阈值实现森林信息的提取.结果表明,面向对象分割与决策树算法结合可以作为森林信息提取的有效方法.最后,通过对3期森林专题图进行空间叠加分析,得到了森林资源动态变化的空间分布,并以此为基础对林地变化的类型及原因进行分析,结果显示浙江省森林资源变化主要分布在浙西北山区、浙中南山区以及沿海地带,这一结果可以为有关部门的决策提供依据.
|
| [8] |
基于阈值法的山区森林常绿、落叶特征遥感自动识别方法: 以贡嘎山地区为例 [J].https://doi.org/10.5846/stxb201310112440 Magsci [本文引用: 1] 摘要
森林的常绿、落叶特征是土地覆被产品的重要属性.由于山区地形复杂,地表遥感辐射信号地形效应明显,导致山区森林常绿、落叶特征遥感自动识别一直是难点.提出了一种基于阈值法的山区森林常绿、落叶特征遥感自动识别简单实用方法.该方法利用多源、多时相遥感影像,选择归一化植被指数(NDVI)为指标,通过统计参考样本的NDVI在生长季和非生长季的差异,自动找出区分常绿、落叶特征的阈值,基于判别规则识别山区森林常绿、落叶特征.以贡嘎山地区为例,分别以多时相Landsat TM影像(简称TM)、多时相环境减灾卫星影像(简称HJ)为单源数据,多时相的HJ、TM组合影像为多源数据,验证该方法的有效性.实验结果表明,该方法能够有效识别山区森林常绿、落叶特征,总体精度达到93.87%,Kappa系数为0.87.该方法适用于山区大面积森林常绿、落叶特征遥感自动提取,已被成功应用于"生态十年"专项西南地区土地覆被数据的生产.
An practical method for automatically identifying the evergreen and deciduous characteristic of forests at mountainous areas: A case study in Mt.Gongga Region [J].https://doi.org/10.5846/stxb201310112440 Magsci [本文引用: 1] 摘要
森林的常绿、落叶特征是土地覆被产品的重要属性.由于山区地形复杂,地表遥感辐射信号地形效应明显,导致山区森林常绿、落叶特征遥感自动识别一直是难点.提出了一种基于阈值法的山区森林常绿、落叶特征遥感自动识别简单实用方法.该方法利用多源、多时相遥感影像,选择归一化植被指数(NDVI)为指标,通过统计参考样本的NDVI在生长季和非生长季的差异,自动找出区分常绿、落叶特征的阈值,基于判别规则识别山区森林常绿、落叶特征.以贡嘎山地区为例,分别以多时相Landsat TM影像(简称TM)、多时相环境减灾卫星影像(简称HJ)为单源数据,多时相的HJ、TM组合影像为多源数据,验证该方法的有效性.实验结果表明,该方法能够有效识别山区森林常绿、落叶特征,总体精度达到93.87%,Kappa系数为0.87.该方法适用于山区大面积森林常绿、落叶特征遥感自动提取,已被成功应用于"生态十年"专项西南地区土地覆被数据的生产.
|
| [9] |
新疆森林资源动态分析: 基于RS与GIS的森林资源动态研究 [J].
<p>利用RS与GIS技术对新疆境内的森林资源进行调查分析,以新疆全区为控制总体,采取卫星数据解译结合现地调查及抽样方法获取全疆森林资源数据。在GIS支持下,对1996、2001年两期卫星遥感调查数据进行对比。研究了新疆各类森林资源的动态变化。近五年森林资源变化的总趋势是林业用地、有林地、疏林地、苗圃、宜林地面积均有增加,森林覆盖率提高,活立木总蓄积量增加,实现了森林资源面积和蓄积双增长。全疆有林地面积由17331 km<sup>2</sup>增加到17837 km<sup>2</sup>,年均增加101 km<sup>2</sup>。森林覆盖率由原来的1.05 %上升到现在的1.08 %,提高了0.03 %。全疆活立木总蓄积由262416000 m<sup>3</sup>增加到289985200 m<sup>3</sup>,共增加27569200 m<sup>3</sup>,年均增加5514000 m<sup>3</sup>,年均净增率为2.00 %。分析结果表明;新疆森林资源总体呈上升趋势。但仍存在着天然林稀少、森林覆盖率低、林分年龄结构失调、树种单一等问题。</p>
Dynamic analysis and evaluation of Xinjiang forest resources: based on Remote Sensing and GIS [J].
<p>利用RS与GIS技术对新疆境内的森林资源进行调查分析,以新疆全区为控制总体,采取卫星数据解译结合现地调查及抽样方法获取全疆森林资源数据。在GIS支持下,对1996、2001年两期卫星遥感调查数据进行对比。研究了新疆各类森林资源的动态变化。近五年森林资源变化的总趋势是林业用地、有林地、疏林地、苗圃、宜林地面积均有增加,森林覆盖率提高,活立木总蓄积量增加,实现了森林资源面积和蓄积双增长。全疆有林地面积由17331 km<sup>2</sup>增加到17837 km<sup>2</sup>,年均增加101 km<sup>2</sup>。森林覆盖率由原来的1.05 %上升到现在的1.08 %,提高了0.03 %。全疆活立木总蓄积由262416000 m<sup>3</sup>增加到289985200 m<sup>3</sup>,共增加27569200 m<sup>3</sup>,年均增加5514000 m<sup>3</sup>,年均净增率为2.00 %。分析结果表明;新疆森林资源总体呈上升趋势。但仍存在着天然林稀少、森林覆盖率低、林分年龄结构失调、树种单一等问题。</p>
|
| [10] |
基于NOAA-AVHRR数据的中国东部地区植被遥感分类研究 [J].
该文采用19幅(时间跨8个月)时间序列的NOAA-AVHRR的归一化植被指数(NDVI)最大值合成影像遥感数据,经过主分量分析(Principle component analysis, PCA)处理后,用非监督分类方法的ISODATA算法,对中国东部地区的(五省一市)植被进行分类,结果可以分出28种土地覆盖类型,除了两种类型为水体和城市或裸地外,其余26种类型均为植被类型,根据中国植被分类系统,这26类可以归并为6大植被类型:1)常绿阔叶林;2)针叶林;3)竹林;4)灌草丛;5)水生植被;6)农业植被。用1∶1 000 000数字化《中国植被图集》的植被类型检验遥感分类结果表明,针叶林、灌草丛、常绿阔叶林和农业植被的分类具有较高的位置精度和面积精度,位置精度分别为79.2%、91.3%、68.2%和95.9%,面积精度分别达到92.1%、95.9%、63.8%和90.5%。这6大植被类型在地理空间上的分布规律与中国东部常绿阔叶林区植被的地带性分布基本一致。
Vegetation classification of East China using multi-temporal NOAA-AVHRR data [J].
该文采用19幅(时间跨8个月)时间序列的NOAA-AVHRR的归一化植被指数(NDVI)最大值合成影像遥感数据,经过主分量分析(Principle component analysis, PCA)处理后,用非监督分类方法的ISODATA算法,对中国东部地区的(五省一市)植被进行分类,结果可以分出28种土地覆盖类型,除了两种类型为水体和城市或裸地外,其余26种类型均为植被类型,根据中国植被分类系统,这26类可以归并为6大植被类型:1)常绿阔叶林;2)针叶林;3)竹林;4)灌草丛;5)水生植被;6)农业植被。用1∶1 000 000数字化《中国植被图集》的植被类型检验遥感分类结果表明,针叶林、灌草丛、常绿阔叶林和农业植被的分类具有较高的位置精度和面积精度,位置精度分别为79.2%、91.3%、68.2%和95.9%,面积精度分别达到92.1%、95.9%、63.8%和90.5%。这6大植被类型在地理空间上的分布规律与中国东部常绿阔叶林区植被的地带性分布基本一致。
|
| [11] |
中国森林植被的碳汇/源空间分布格局 [J].https://doi.org/10.1007/s11434-012-4998-1 URL [本文引用: 2] 摘要
利用1984~1988年和1999~2003年间2次森林详查资料,结合1:100万森林植被图及同期基于CASA模型模拟的NPP空间分布,采用空间降尺度技术,定量估算了1km分辨率下1984~2003年间我国森林植被碳源/汇的空间分布.结果表明:(1)在1984~2003年间我国森林植被是大气的碳汇,碳储量增加了0.77PgC,年均增加约为51.0Tga?1.其中,碳的吸收量为0.88PgC,释放量为0.11PgC.(2)我国森林植被碳汇/源分布存在明显的空间分布规律,碳汇面积主要集中在亚热带和温带地区,高值区集中在海南地区、横断山脉地区、吉林境内的长白山脉,大兴安岭南部和西北山地;碳源主要分布在以东北至西南一带上,高值区主要集中在云南南部、大兴安岭北部和四川盆地中部.(3)碳汇强度与NPP的增长存在明显关联性,统计模型表明东北、华北、西北以及中南4个地区的碳汇量80%以上的变化能够由NPP增长驱动来解释.(4)碳汇强度的空间分布与森林林龄分布存在着明显的对应关系,碳汇强度整体上随着林龄的增加而降低.
The spatial distribution of forest carbon sinks and sources in China [J].https://doi.org/10.1007/s11434-012-4998-1 URL [本文引用: 2] 摘要
利用1984~1988年和1999~2003年间2次森林详查资料,结合1:100万森林植被图及同期基于CASA模型模拟的NPP空间分布,采用空间降尺度技术,定量估算了1km分辨率下1984~2003年间我国森林植被碳源/汇的空间分布.结果表明:(1)在1984~2003年间我国森林植被是大气的碳汇,碳储量增加了0.77PgC,年均增加约为51.0Tga?1.其中,碳的吸收量为0.88PgC,释放量为0.11PgC.(2)我国森林植被碳汇/源分布存在明显的空间分布规律,碳汇面积主要集中在亚热带和温带地区,高值区集中在海南地区、横断山脉地区、吉林境内的长白山脉,大兴安岭南部和西北山地;碳源主要分布在以东北至西南一带上,高值区主要集中在云南南部、大兴安岭北部和四川盆地中部.(3)碳汇强度与NPP的增长存在明显关联性,统计模型表明东北、华北、西北以及中南4个地区的碳汇量80%以上的变化能够由NPP增长驱动来解释.(4)碳汇强度的空间分布与森林林龄分布存在着明显的对应关系,碳汇强度整体上随着林龄的增加而降低.
|
| [12] |
基于MODIS NDVI时间序列的土地覆盖分层分类方法研究 [J].
以时间分辨率为16 d、空间分辨率为250 m的MODIS NDVI时间序列数据为主要数据源,利用两种滤波方法对NDVI时间序列进行滤波处理,并基于J-M距离比较了两种方法的类别可分性,同时结合短波红外光谱反射率数据、DEM数据,采用分层分类的方法,对中国东北3省进行了土地覆盖制图研究。在分类过程中,遵循逐级分类、先利用单一特征波段后结合多种特征波段的原则,综合使用阈值法、支持向量机(SVM)、人工神经网络(ANN)、C5.0决策树分类法对研究区内的土地覆盖类别进行逐层分类细化。根据已有的土地覆盖数据和高分辨率遥感影像对最终分类结果进行精度评价,总体分类精度为84.61%,Kappa系数为0.8262。
Hierarchical land cover classification based on MODIS NDVI time-series [J].
以时间分辨率为16 d、空间分辨率为250 m的MODIS NDVI时间序列数据为主要数据源,利用两种滤波方法对NDVI时间序列进行滤波处理,并基于J-M距离比较了两种方法的类别可分性,同时结合短波红外光谱反射率数据、DEM数据,采用分层分类的方法,对中国东北3省进行了土地覆盖制图研究。在分类过程中,遵循逐级分类、先利用单一特征波段后结合多种特征波段的原则,综合使用阈值法、支持向量机(SVM)、人工神经网络(ANN)、C5.0决策树分类法对研究区内的土地覆盖类别进行逐层分类细化。根据已有的土地覆盖数据和高分辨率遥感影像对最终分类结果进行精度评价,总体分类精度为84.61%,Kappa系数为0.8262。
|
| [13] |
基于图像阈值法的森林雪灾损失遥感估测: 以云南省为例 [J].https://doi.org/10.11820/dlkxjz.2013.06.008 Magsci [本文引用: 1] 摘要
雪灾是森林生态系统的严重生态干扰之一, 会严重影响林木生长并降低生态系统功能。利用2000-2011年SPOT <i>NDVI</i>长时间序列影像数据, 基于SG滤波函数进行时序重建, 采用灾后同期影像的图像阈值法, 以常年多灾的云南省2008 年雪灾为例, 进行雪灾森林植被受损评估。评估结果与全国灾情月报中的云南省雪灾范围基本一致, 全省森林雪灾受损面积达12.09%, 主要分布在滇西北的迪庆州、怒江州。对森林雪灾受损程度分析表明, 全省重度受灾县7 个, 中度受灾县13 个, 轻度受灾县45 个。对海拔、坡度、坡向、坡位等地形条件的叠加分析表明, 海拔3300~4000 m、坡度5~15°、处于东坡或东北坡中坡位的森林植被受损最严重。本研究有助于实现森林雪灾损失的快速评估, 对有效规避次生灾害、开展灾后恢复重建规划具有重要意义。
Assessment of forest damage due to ice storm using image thresholding techniques: A case study of Yunnan Province [J].https://doi.org/10.11820/dlkxjz.2013.06.008 Magsci [本文引用: 1] 摘要
雪灾是森林生态系统的严重生态干扰之一, 会严重影响林木生长并降低生态系统功能。利用2000-2011年SPOT <i>NDVI</i>长时间序列影像数据, 基于SG滤波函数进行时序重建, 采用灾后同期影像的图像阈值法, 以常年多灾的云南省2008 年雪灾为例, 进行雪灾森林植被受损评估。评估结果与全国灾情月报中的云南省雪灾范围基本一致, 全省森林雪灾受损面积达12.09%, 主要分布在滇西北的迪庆州、怒江州。对森林雪灾受损程度分析表明, 全省重度受灾县7 个, 中度受灾县13 个, 轻度受灾县45 个。对海拔、坡度、坡向、坡位等地形条件的叠加分析表明, 海拔3300~4000 m、坡度5~15°、处于东坡或东北坡中坡位的森林植被受损最严重。本研究有助于实现森林雪灾损失的快速评估, 对有效规避次生灾害、开展灾后恢复重建规划具有重要意义。
|
| [14] |
2001-2010年秦岭森林物候时空变化遥感监测 [J].https://doi.org/10.18306/dlkxjz.2015.10.010 URL [本文引用: 1] 摘要
植被物候是陆地生态系统对全球 气候变化响应的最佳指示器,研究其时空变化对深入理解陆面水热过程、碳循环过程及预测陆地生态系统的时空变化具有重要意义。本文采用2001-2010年 MODIS MOD09A1产品,通过引入MOD09A1的时间控制层DOY(Day of Year)提高EVI的时间精度;采用最大变化速率法和阈值法相结合提取秦岭森林物候期。结果表明,随着水热条件变化,由低海拔至高海拔,东南向西北,生 长季始期(Start of Growth Season,SOG)逐渐推迟,集中在第81~120 d(即从3月下旬-4月末);生长季末期(End of Growth Season,EOG)逐渐提前,集中在第270~311 d(10月初-11月上旬);生长季长度(Length of Growth Season,LOG)逐渐缩短,集中在150~230 d。秦岭森林物候期与海拔关系密切,海拔每升高100 m,SOG推迟2 d,EOG提前1.9 d,LOG缩短3.9 d。2001-2010年,森林SOG提前、EOG延后和LOG延长主要分布于秦岭中高海拔区;SOG延后、EOG提前和LOG缩短主要分布在海拔 1000 m以下部分区域。高海拔区物候的年际变化要比低海拔区复杂,2000 m以上区域SOG提前、EOG提前、LOG缩短。上述研究结果量化了不同海拔梯度森林的物候差异,揭示了近10年秦岭森林物候的时空格局,可为秦岭地区生 态环境评价和保护提供科学依据。
Spatiotemporal variations of forest phenology in the Qinling zone based on remote sensing monitoring, 2001-2010 [J].https://doi.org/10.18306/dlkxjz.2015.10.010 URL [本文引用: 1] 摘要
植被物候是陆地生态系统对全球 气候变化响应的最佳指示器,研究其时空变化对深入理解陆面水热过程、碳循环过程及预测陆地生态系统的时空变化具有重要意义。本文采用2001-2010年 MODIS MOD09A1产品,通过引入MOD09A1的时间控制层DOY(Day of Year)提高EVI的时间精度;采用最大变化速率法和阈值法相结合提取秦岭森林物候期。结果表明,随着水热条件变化,由低海拔至高海拔,东南向西北,生 长季始期(Start of Growth Season,SOG)逐渐推迟,集中在第81~120 d(即从3月下旬-4月末);生长季末期(End of Growth Season,EOG)逐渐提前,集中在第270~311 d(10月初-11月上旬);生长季长度(Length of Growth Season,LOG)逐渐缩短,集中在150~230 d。秦岭森林物候期与海拔关系密切,海拔每升高100 m,SOG推迟2 d,EOG提前1.9 d,LOG缩短3.9 d。2001-2010年,森林SOG提前、EOG延后和LOG延长主要分布于秦岭中高海拔区;SOG延后、EOG提前和LOG缩短主要分布在海拔 1000 m以下部分区域。高海拔区物候的年际变化要比低海拔区复杂,2000 m以上区域SOG提前、EOG提前、LOG缩短。上述研究结果量化了不同海拔梯度森林的物候差异,揭示了近10年秦岭森林物候的时空格局,可为秦岭地区生 态环境评价和保护提供科学依据。
|
| [15] |
|
| [16] |
基于多时相MODIS数据的四川省森林植被类型信息提取 [J].https://doi.org/10.11849/zrzyxb.2014.03.014 URL [本文引用: 1] 摘要
森林植被类型信息对于生态的保护、规划和建设具有重要的意义。论文针对单一时相遥感数据在提取森林植被类型信息方面的局限性,探讨了基于多时相MODIS遥感数据实现提取主要森林植被类型信息的方法。将四川省的森林植被划分为常绿落叶混交林、常绿阔叶林、常绿针叶林、落叶阔叶林、落叶针叶林5种类型。通过对其年内生长差异的分析,选取多时相(2005年1月9日、2月26日、4月22日、7月19日和10月23日)特征数据,利用光谱和时相特征知识建立了常绿林、落叶林和针叶林的提取模型;通过特征组合与逻辑判断,实现了5种植被类型信息的提取,提取精度总体达到84%,植被类型最低精度达到76%。研究表明,该方法可以节约大量的人力、物力和财力,在大范围的植被类型调查与监测方面具有较大的应用价值。该研究表明,四川省2005年的森林覆盖率为28.43%。各类型按所占百分比由高到低的排序为落叶阔叶林、常绿针叶林、常绿阔叶林、落叶针叶林和常绿落叶混交林。该数据对四川省森林植被的保护和利用具有重要的应用价值。
Extracting forest vegetation types from multi-temporal MODIS imagery in Sichuan Province [J].https://doi.org/10.11849/zrzyxb.2014.03.014 URL [本文引用: 1] 摘要
森林植被类型信息对于生态的保护、规划和建设具有重要的意义。论文针对单一时相遥感数据在提取森林植被类型信息方面的局限性,探讨了基于多时相MODIS遥感数据实现提取主要森林植被类型信息的方法。将四川省的森林植被划分为常绿落叶混交林、常绿阔叶林、常绿针叶林、落叶阔叶林、落叶针叶林5种类型。通过对其年内生长差异的分析,选取多时相(2005年1月9日、2月26日、4月22日、7月19日和10月23日)特征数据,利用光谱和时相特征知识建立了常绿林、落叶林和针叶林的提取模型;通过特征组合与逻辑判断,实现了5种植被类型信息的提取,提取精度总体达到84%,植被类型最低精度达到76%。研究表明,该方法可以节约大量的人力、物力和财力,在大范围的植被类型调查与监测方面具有较大的应用价值。该研究表明,四川省2005年的森林覆盖率为28.43%。各类型按所占百分比由高到低的排序为落叶阔叶林、常绿针叶林、常绿阔叶林、落叶针叶林和常绿落叶混交林。该数据对四川省森林植被的保护和利用具有重要的应用价值。
|
| [17] |
|
| [18] |
|
| [19] |
Analyzing land-cover change and corresponding impacts on carbon budget in a fast developing sub-tropical region by integrating MODIS and Landsat TM/ETM+ images [J].https://doi.org/10.1016/j.apgeog.2013.08.002 URL Magsci [本文引用: 1] 摘要
Land-cover change has significant impacts on regional carbon dynamics. Understanding the carbon consequences of land-cover change is necessary for decision makers to address the issues of carbon reduction and climate change mitigation. Optical remote sensing images have been widely used for detecting regional land-cover change. However, it is difficult to acquire desirable images for regions that are frequently affected by cloudy and rainy weather. In this study, we proposed an approach to deal with this problem by integrating moderate-resolution imaging spectroradiometer (MODIS) and Landsat images based on the mixed-label analysis (MLA) model. We tested this model in Guangdong Province, a fast developing sub-tropical region in China, to derive the provincial land-cover data for the analysis of landcover change between 2000 and 2009 and its impacts on regional carbon dynamics. Results show that forest land decreased by 3.03%, while built-up area rapidly expanded by 73.01% from 2000 to 2009. The regional vegetation carbon sink declined by 2.6%, whereas the regional carbon emissions increased by more than 100% due to the fast urbanization and economic development. The regional vegetation carbon sink can only offset 4.1% of total carbon emissions in 2009, far below the national level (about 7.0-7.7%) at the same period. Future efforts to improve the regional carbon budget should focus more on the control of land development and the advance of energy efficiency. (C) 2013 Elsevier Ltd. All rights reserved.
|
| [20] |
NDVI-derived land cover classifications at a global scale [J]. |
| [21] |
Tracking disturbance-regrowth dynamics in tropical forests using structural change detection and Landsat time series [J].https://doi.org/10.1016/j.rse.2015.08.020 URL [本文引用: 1] 摘要
Increasing attention on tropical deforestation and forest degradation has necessitated more detailed knowledge of forest change dynamics in the tropics. With an increasing amount of satellite data being released to the public free of charge, understanding forest change dynamics in the tropics is gradually becoming a reality. Methods to track forest changes using dense satellite time series allow for description of forest changes at unprecedented spatial, temporal and thematic resolution. We developed a data-driven approach based on structural change monitoring methods to track disturbance-regrowth dynamics using dense Landsat Time Series (LTS) in a tropical forest landscape in Madre de Dios, southern Peru. Whereas most existing post-disturbance regrowth monitoring methods rely on annual or near-annual time series, our method uses all available Landsat data. Using our disturbance-regrowth method, we detected annual disturbance from 1999 to 2013 with a total area-weighted accuracy of 91 卤 2.3%. Accuracies of the regrowth results were strongly dependent on the timing of the original disturbance. We estimated a total area-weighted regrowth accuracy of 61 卤 3.9% for pixels where original disturbances were predicted earlier than 2006. While the user's accuracy of the regrowth class for these pixels was high (84 卤 8.1%), the producer's accuracy was low (56 卤 9.4%), with markedly lower producer's accuracies when later disturbances were also included. These accuracies indicate that a significant amount of regrowth identified in the reference data was not captured with our method. Most of these omission errors arose from disturbances late in the time series or a lack of sensitivity to long-term regrowth due to lower data densities near the end of the time series. Omission errors notwithstanding, our study represents the first demonstration of a purely data-driven algorithm designed to detect disturbances and post-disturbance regrowth together using all available LTS data. With this method, we propose a continuous disturbance-regrowth monitoring framework, where LTS data are continually monitored for disturbances, post-disturbance regrowth, repeat disturbances, and so on.
|
| [22] |
A comprehensive global 5 min resolution land-use data set for the year 2000 consistent with national census data [J]. |
| [23] |
Changes in forest biomass carbon storage in China between 1949 and 1998 [J].https://doi.org/10.1126/science.1058629 URL PMID: 11423660 [本文引用: 1] 摘要
The location and mechanisms responsible for the carbon sink in northern mid-latitude are uncertain. Here, we used an improved estimation method of forest biomass and a 50-year national forest resource inventory in China to estimate changes in the storage of living biomass between 1949 and 1998. Our results suggest that Chinese forests released about 0.68 petagram of carbon between 1949 and 1980, for an annual emission rate of 0.022 petagram of carbon. Carbon storage increased significantly after the late 1970s from 4.38 to 4.75 petagram of carbon by 1998, for a mean accumulation rate of 0.021 petagram of carbon per year, mainly due to forest expansion and regrowth. Since the mid-1970s, planted forests (afforestation and reforestation) have sequestered 0.45 petagram of carbon, and their average carbon density increased from 15.3 to 31.1 megagrams per hectare, while natural forests have lost an additional 0.14 petagram of carbon, suggesting that carbon sequestration through forest management practices addressed in the Kyoto Protocol could help offset industrial carbon dioxide emissions.
|
| [24] |
Evidence for environmentally enhanced forest growth [J].https://doi.org/10.1073/pnas.1402333111 URL PMID: 24979781 [本文引用: 1] 摘要
Forests in the middle and high latitudes of the northern hemisphere function as a significant sink for atmospheric carbon dioxide (CO2). This carbon (C) sink has been attributed to two processes: age-related growth after land use change and growth enhancement due to environmental changes, such as elevated CO2, nitrogen deposition, and climate change. However, attribution between these two processes is largely controversial. Here, using a unique time series of an age-class dataset from six national forest inventories in Japan and a new approach developed in this study (i.e., examining changes in biomass density at each age class over the inventory periods), we quantify the growth enhancement due to environmental changes and its contribution to biomass C sink in Japan's forests. We show that the growth enhancement for four major plantations was 4.0 7.7 Mg Ca(-1) from 1980 to 2005, being 8.4-21.6% of biomass C sequestration per hectare and 4.1-35.5% of the country's total net biomass increase of each forest type. The growth enhancement differs among forest types, age classes, and regions. Our results provide, to our knowledge, the first ground-based evidence that global environmental changes can increase C sequestration in forests on a broad geographic scale and imply that both the traits and age of trees regulate the responses of forest growth to environmental changes. These findings should be incorporated into the prediction of forest C cycling under a changing climate.
|
| [25] |
Global forest resources assessment 2010 [R].
|
| [26] |
MODIS Collection 5 global land cover: Algorithm refinements and characterization of new datasets [J].https://doi.org/10.1016/j.rse.2009.08.016 URL [本文引用: 2] 摘要
Information related to land cover is immensely important to global change science. In the past decade, data sources and methodologies for creating global land cover maps from remote sensing have evolved rapidly. Here we describe the datasets and algorithms used to create the Collection 5 MODIS Global Land Cover Type product, which is substantially changed relative to Collection 4. In addition to using updated input data, the algorithm and ancillary datasets used to produce the product have been refined. Most importantly, the Collection 5 product is generated at 500-m spatial resolution, providing a four-fold increase in spatial resolution relative to the previous version. In addition, many components of the classification algorithm have been changed. The training site database has been revised, land surface temperature is now included as an input feature, and ancillary datasets used in post-processing of ensemble decision tree results have been updated. Further, methods used to correct classifier results for bias imposed by training data properties have been refined, techniques used to fuse ancillary data based on spatially varying prior probabilities have been revised, and a variety of methods have been developed to address limitations of the algorithm for the urban, wetland, and deciduous needleleaf classes. Finally, techniques used to stabilize classification results across years have been developed and implemented to reduce year-to-year variation in land cover labels not associated with land cover change. Results from a cross-validation analysis indicate that the overall accuracy of the product is about 75% correctly classified, but that the range in class-specific accuracies is large. Comparison of Collection 5 maps with Collection 4 results show substantial differences arising from increased spatial resolution and changes in the input data and classification algorithm.
|
| [27] |
Retrospective mapping of burnt areas in Central Siberia using a modification of the normalised difference water index [J].https://doi.org/10.1016/j.rse.2006.05.015 URL [本文引用: 1] 摘要
The boreal forest contains almost half the total carbon pool of world forest ecosystems, and so has a very significant role in global biogeochemical cycles. The flux of greenhouse gases in and out of these forests is influenced strongly by disturbances such as diseases, logging and predominantly fire. It is important to quantify these disturbances to enable the modelling of major greenhouse gases. However, because of the remoteness and vastness of the boreal forest, little data is available on the type, extent, frequency and severity of these disturbances in Siberia. For burnt areas, two of the more responsive wavelengths are the short wave infra-red (SWIR) and the near infra-red (NIR). These produce a vegetation index, the normalised difference SWIR (NDSWIR) capable of detecting retrospective disturbances. Here we combine the NDSWIR from MODIS imagery acquired in the summer of 2003 with thermal anomaly data from 1992 to 2003 to detect and date areas which burnt at some point between 1992 and 2003. The semi-automated method is called SWIR and Thermal ANomalies for Detecting Disturbances (STANDD) and is complemented by an Normalised Difference Vegetation Index (NDVI) differencing method using MODIS 2002 and 2003 imagery to ensure reliable detection of area burnt in the year of image acquisition (i.e. 2003). The area of this study covers approximately 3million km 2 stretching from Lake Baikal in the south to the Laptev Sea in the north, above the Arctic Circle. Landsat ETM+ images were used to validate the shape and areal extent of the burnt areas resulting in an 81% overall accuracy with a kappa coefficient of agreement of 0.63.
|
| [28] |
Inventory-based estimates of forest biomass carbon stocks in China: A comparison of three methods [J].https://doi.org/10.1016/j.foreco.2009.09.047 URL [本文引用: 1] 摘要
Several studies have reported different estimates for forest biomass carbon (C) stocks in China. The discrepancy among these estimates may be largely attributed to the methods used. In this study, we used three methods [mean biomass density method (MBM), mean ratio method (MRM), and continuous biomass expansion factor (BEF) method (abbreviated as CBM)] applied to forest inventory data to estimate China's forest biomass C stocks and their changes from 1984 to 2003. The three methods generated various estimates of the biomass C stocks: the lowest (4.0–5.902Pg02C) from CBM and the highest (5.7–7.702Pg02C) from MBM, with an intermediate estimate (4.2–6.202Pg02C) from MRM. Forest age class is a major factor responsible for these method-induced differences. MBM overestimates biomass for young-aged forests, but underestimates biomass for old-aged forests; while the reverse is true for MRM. Further, the three methods resulted in different estimates of biomass C stocks for different forest types. For temperate/subtropical mixed forests, MBM generated a 92% higher estimate than CBM and MRM generated a 14% lower than CBM. The degree of the overestimates is closely related with the proportion of young-aged forest within total area of each forest type.
|
| [29] |
High-resolution global maps of 21st-century forest cover change [J].https://doi.org/10.1126/science.1244693 URL PMID: 24233722 [本文引用: 1] 摘要
Quantification of global forest change has been lacking despite the recognized importance of forest ecosystem services. In this study, Earth observation satellite data were used to map global forest loss (2.3 million square kilometers) and gain (0.8 million square kilometers) from 2000 to 2012 at a spatial resolution of 30 meters. The tropics were the only climate domain to exhibit a trend, with forest loss increasing by 2101 square kilometers per year. Brazil's well-documented reduction in deforestation was offset by increasing forest loss in Indonesia, Malaysia, Paraguay, Bolivia, Zambia, Angola, and elsewhere. Intensive forestry practiced within subtropical forests resulted in the highest rates of forest change globally. Boreal forest loss due largely to fire and forestry was second to that in the tropics in absolute and proportional terms. These results depict a globally consistent and locally relevant record of forest change.
|
| [30] |
Assessing changes in species distribution from sequential large-scale forest inventories [J].https://doi.org/10.1007/s13595-013-0308-6 URL [本文引用: 1] 摘要
61 Context It is assumed that global change is already affecting the composition, structure and distribution of forest ecosystems; however, detailed evidences of altitudinal and latitudinal shifts are still scarce. 61 Aims To develop a method based on National Forest Inventory (NFI) to assess spatio-temporal changes in species distributions. 61 Methods We develop an approach based on universal kriging to compare species distribution models from the different NFI cycles and regardless of the differences in the sampling schemes used. Furthermore, a confidence interval approach is used to assess significant changes in species distribution. The approach is applied to some of the southernmost populations of Pinus sylvestris and Fagus sylvatica in the Western Pyrenees over the last 4002years. 61 Results An increase of the presence of the two species in the region was observed. Scots pine distribution has shifted about 1.502km northwards over recent decades, whereas the European beech has extended its distribution southwards by about 202km. Furthermore, the optimum altitude for both species has risen by about 20002m. As a result, the zone in which the two species coexist has been enlarged. 61 Conclusions This approach provides a useful tool to compare NFI data from different sampling schemes, quantifying and testing significant shifts in tree species distribution over recent decades across geographical gradients.
|
| [31] |
Overview of the radiometric and biophysical performance of the MODIS vegetation indices [J].https://doi.org/10.1016/S0034-4257(02)00096-2 URL [本文引用: 1] 摘要
We evaluated the initial 12 months of vegetation index product availability from the Moderate Resolution Imaging Spectroradiometer (MODIS) on board the Earth Observing System-Terra platform. Two MODIS vegetation indices (VI), the normalized difference vegetation index (NDVI) and enhanced vegetation index (EVI), are produced at 1-km and 500-m resolutions and 16-day compositing periods. This paper presents an initial analysis of the MODIS NDVI and EVI performance from both radiometric and biophysical perspectives. We utilize a combination of site-intensive and regionally extensive approaches to demonstrate the performance and validity of the two indices. Our results showed a good correspondence between airborne-measured, top-of-canopy reflectances and VI values with those from the MODIS sensor at four intensively measured test sites representing semi-arid grass/shrub, savanna, and tropical forest biomes. Simultaneously derived field biophysical measures also demonstrated the scientific utility of the MODIS VI. Multitemporal profiles of the MODIS VIs over numerous biome types in North and South America well represented their seasonal phenologies. Comparisons of the MODIS-NDVI with the NOAA-14, 1-km AVHRR-NDVI temporal profiles showed that the MODIS-based index performed with higher fidelity. The dynamic range of the MODIS VIs are presented and their sensitivities in discriminating vegetation differences are evaluated in sparse and dense vegetation areas. We found the NDVI to asymptotically saturate in high biomass regions such as in the Amazon while the EVI remained sensitive to canopy variations.
|
| [32] |
The underpinnings of land-use history: Three centuries of global gridded land-use transitions, wood-harvest activity, and resulting secondary lands [J].https://doi.org/10.1111/j.1365-2486.2006.01150.x URL [本文引用: 1] 摘要
Abstract To accurately assess the impacts of human land use on the Earth system, information is needed on the current and historical patterns of land-use activities. Previous global studies have focused on developing reconstructions of the spatial patterns of agriculture. Here, we provide the first global gridded estimates of the underlying land conversions (land-use transitions), wood harvesting, and resulting secondary lands annually, for the period 1700–2000. Using data-based historical cases, our results suggest that 42–68% of the land surface was impacted by land-use activities (crop, pasture, wood harvest) during this period, some multiple times. Secondary land area increased 10–44 × 10 6 65km 2 ; about half of this was forested. Wood harvest and shifting cultivation generated 70–90% of the secondary land by 2000; permanent abandonment and relocation of agricultural land accounted for the rest. This study provides important new estimates of globally gridded land-use activities for studies attempting to assess the consequences of anthropogenic changes to the Earth's surface over time.
|
| [33] |
Mapping the phenology of natural vegetation in India using a remote sensing-derived chlorophyll index [J].https://doi.org/10.1080/01431161.2010.512303 URL [本文引用: 1] 摘要
ABSTRACT Time series of MEdium Resolution Imaging Spectrometer (MERIS) Terrestrial Chlorophyll Index (MTCI) level-3 data product, with a spatial resolution of 4.6 km composited at 8-day intervals for the years 2003 to 2007, were used to map the phenology of natural vegetation in India. Initial dropouts and noise in the MTCI data were corrected using a temporal moving window filter, Fourier-based smoothing using the first four harmonics was applied and then the phenological variables were extracted through a temporal iterative search of peaks and valleys in the time series for each pixel. The approach was fine-tuned to extract reliable phenological variables from the complex and multiple phenology cycles. A global land cover map (GLC2000) was used as a reference to extract the spatial locations of the vegetation types to infer their phenology. The median of each phenological variable was derived and a spatial majority filter was applied to the 1 × 1 grids (representing 1:250 000 Survey of India toposheet) covering the whole of India. This study presents the results derived for the evergreen, semi-evergreen, moist deciduous and dry deciduous vegetation types of India. A general trend of earlier onset of greenness at lower latitudes than at higher latitudes was observed for the natural vegetation in India.
|
| [34] |
Forest cover classification using Landsat ETM+ data and time series MODIS NDVI data [J]. |
| [35] |
Mapping sub-pixel forest cover in Europe using AVHRR data and national and regional statistics [J].https://doi.org/10.5589/m02-015 URL [本文引用: 1] 摘要
Not Available
|
| [36] |
A simple method to extract tropical monsoon forests using NDVI based on MODIS data: A case study in South Asia and Peninsula Southeast Asia [J].https://doi.org/10.1007/s11769-015-0789-3 URL [本文引用: 1] |
| [37] |
China’s land cover and land use change from 1700 to 2005: Estimations from high-resolution satellite data and historical archives [J]. |
| [38] |
Generation of new cloud masks from MODIS land surface reflectance products [J].https://doi.org/10.1016/j.rse.2013.01.019 URL Magsci [本文引用: 1] 摘要
MODIS land surface reflectance product (MOD09) is one of the most popular data sources for characterizing land surface environments. Because those cloudy observations should be excluded from further analysis, the reliable cloud screening is important for downstream applications. In this paper, an approach is proposed to generate cloud masks from time series of MOD09 products. It is found that an inflexion point exists between the clear-sky and cloudy observations if time series of reflectances assembled from the same location are sorted. The maximum surface reflectance can be composited from these inflexions and those observations with reflectance values larger than the inflexion are identified as cloudy. To the best of our knowledge, this is the first method to composite the maximum snow-free surface reflectance. And a new method is proposed to objectively compare cloud detection results derived from different approaches. Comparisons show that this inflexion-based cloud detection algorithm performs generally better than the cloud masks accompanying with the MOD09 products. The new cloud masks are valuable for those applications relying on the MOD09 products as input and for analysis of the uncertainty of the MODIS cloud mask products. (c) 2013 Elsevier Inc. All rights reserved.
|
| [39] |
Land-cover change detection using multi-temporal MODIS NDVI data [J].https://doi.org/10.1016/j.rse.2006.06.018 URL [本文引用: 1] 摘要
Monitoring the locations and distributions of land-cover changes is important for establishing links between policy decisions, regulatory actions and subsequent land-use activities. Past studies incorporating two-date change detection using Landsat data have tended to be performance limited for applications in biologically complex systems. This study explored the use of 250m multi-temporal MODIS NDVI 16-day composite data to provide an automated change detection and alarm capability on a 1year time-step for the Albemarle amlico Estuary System (APES) region of the US. Detection accuracy was assessed for 2002 at 88%, with a reasonable balance between change commission errors (21.9%), change omission errors (27.5%), and Kappa coefficient of 0.67. Annual change detection rates across the APES over the study period (2002-2005) were estimated at 0.7% per annum and varied from 0.4% (2003) to 0.9% (2004). Regional variations were also readily apparent ranging from 1.6% to 0.1% per annum for the tidal water and mountain ecological zones, respectfully. This research included the application of an automated protocol to first filter the MODIS NDVI data to remove poor (corrupted) data values and then estimate the missing data values using a discrete Fourier transformation technique to provide high-quality uninterrupted data to support the change detection analysis. The methods and results detailed in this article apply only to non-agricultural areas. Additional limitations attributed to the coarse resolution of the NDVI data included the overestimation of change area that necessitated the application of a change area correction factor.
|
| [40] |
A large carbon sink in the woody biomass of northern forests [J].https://doi.org/10.1073/pnas.261555198 URL PMID: 11742094 [本文引用: 1] 摘要
The terrestrial carbon sink, as of yet unidentified, represents 15-30% of annual global emissions of carbon from fossil fuels and industrial activities. Some of the missing carbon is sequestered in vegetation biomass and, under the Kyoto Protocol of the United Nations Framework Convention on Climate Change, industrialized nations can use certain forest biomass sinks to meet their greenhouse gas emissions reduction commitments. Therefore, we analyzed 19 years of data from remote-sensing spacecraft and forest inventories to identify the size and location of such sinks. The results, which cover the years 1981-1999, reveal a picture of biomass carbon gains in Eurasian boreal and North American temperate forests and losses in some Canadian boreal forests. For the 1.42 billion hectares of Northern forests, roughly above the 30th parallel, we estimate the biomass sink to be 0.68 +/- 0.34 billion tons carbon per year, of which nearly 70% is in Eurasia, in proportion to its forest area and in disproportion to its biomass carbon pool. The relatively high spatial resolution of these estimates permits direct validation with ground data and contributes to a monitoring program of forest biomass sinks under the Kyoto protocol.
|
| [41] |
Increased plant growth in the northern high latitudes from 1981 to 1991 [J]. |
| [42] |
Land cover characterization using multitemporal red, near-IR, and thermal-IR data from NOAA/AVHRR [J].https://doi.org/10.2307/2269408 URL [本文引用: 3] 摘要
A simple land cover classification scheme is proposed based on energy absorption and exchange properties of various land cover types, observable from remote sensing. Seasonal trajectories of the Normalized Difference Vegetation Index (NDVI) and surface temperature (T-s), routinely available from NOAA/AVHRR (National Oceanic and Atmospheric Administration/Advanced Very High Resolution Radiometer), are used to characterize different land cover types into four groups: water limited (shrub, grass), energy limited (wetlands, boreal forests, snow, ice, and water), atmospherically coupled (aerodynamically rough canopies, forests), and atmospherically decoupled (aerodynamically smooth canopies, crops). Further separation is achieved using growing-season average NDVI for shrub and grass, seasonal NDVI amplitude for deciduous vs. evergreen, and near-infrared (NIR) reflectance for broadleaf vs. needleleaf vegetation. The methodology using threshold-based rules is completely remote sensing based; classification rules are simple and easily modifiable. A first test of this logic over the continental United States, when compared with existing maps, showed that the methodology adequately captures the spatial distribution of various land cover types. The logic is also useful for monitoring seasonal dynamics of land cover, evapotranspiration, and disturbances due to fire, floods, insects/disease, and other anthropogenic processes. Future improvements needed to deal with mixed landscapes and global implementation details are discussed.
|
| [43] |
Good practices for estimating area and assessing accuracy of land change [J].https://doi.org/10.1016/j.rse.2014.02.015 URL [本文引用: 2] 摘要
The remote sensing science and application communities have developed increasingly reliable, consistent, and robust approaches for capturing land dynamics to meet a range of information needs. Statistically robust and transparent approaches for assessing accuracy and estimating area of change are critical to ensure the integrity of land change information. We provide practitioners with a set of “good practice” recommendations for designing and implementing an accuracy assessment of a change map and estimating area based on the reference sample data. The good practice recommendations address the three major components: sampling design, response design and analysis. The primary good practice recommendations for assessing accuracy and estimating area are: (i) implement a probability sampling design that is chosen to achieve the priority objectives of accuracy and area estimation while also satisfying practical constraints such as cost and available sources of reference data; (ii) implement a response design protocol that is based on reference data sources that provide sufficient spatial and temporal representation to accurately label each unit in the sample (i.e., the “reference classification” will be considerably more accurate than the map classification being evaluated); (iii) implement an analysis that is consistent with the sampling design and response design protocols; (iv) summarize the accuracy assessment by reporting the estimated error matrix in terms of proportion of area and estimates of overall accuracy, user's accuracy (or commission error), and producer's accuracy (or omission error); (v) estimate area of classes (e.g., types of change such as wetland loss or types of persistence such as stable forest) based on the reference classification of the sample units; (vi) quantify uncertainty by reporting confidence intervals for accuracy and area parameters; (vii) evaluate variability and potential error in the reference classification; and (viii) document deviations from good practice that may substantially affect the results. An example application is provided to illustrate the recommended process.
|
| [44] |
Combining earth observation data and forest statistics[R]. Research Report 14. Joensuu, Finland: |
| [45] |
Mapping forest in Europe by combining earth observation data and forest statistics [M]
|
| [46] |
A large and persistent carbon sink in the world’s forests [J]. |
| [47] |
A remote sensing based vegetation classification logic for global land cover analysis [J].https://doi.org/10.1016/0034-4257(94)00063-S URL [本文引用: 2] 摘要
This article proposes a simple new logic for classifying global vegetation. The critical features of this classification are that (1) it is based on simple, observable, unambiguous characteristics of vegetation structure that are important to ecosystem biogeochemistry and can be measured in the field for validation, (2) the structural characteristics are remotely sensible so that repeatable and efficient global reclassifications of existing vegetation will be possible, and (3) the defined vegetation classes directly translate into the biophysical parameters of interest by global climate and biogeochemical models. A first test of this logic for the continental United States is presented based on an existing 1 km AVHRR normalized difference vegetation index database. Procedures for solving critical remote sensing problems needed to implement the classification are discussed. Also, some inferences from this classification to advanced vegetation biophysical variables such as specific leaf area and photosynthetic capacity useful to global biogeochemical modeling are suggested.
|
| [48] |
Biomass estimation for temperate broadleaf forests of the United States using inventory data [J].https://doi.org/10.1016/S0016-0032(22)90174-7 URL [本文引用: 1] 摘要
A potentially valuable data source for estimating forest biomass is forest volume inventory data that are widely collected and available throughout the world. In this paper we present a general methodology for using such data to reliably estimate aboveground biomass density (AGBD) and to develop expansion factors for converting volume directly to AGBD from USDA Forest Service Forest Inventory and Analysis (FIA) data. Growing stock volume inventory data and stand tables were combined with independently developed biomass regression equations to estimate AGBD and to calculate biomass expansion factors (: factors that convert volume to mass, accounting for noncommercial components) for the extensive oak-hickory and maple-beech-birch forest types of the eastern United States. Estimated aboveground biomass for both forest types ranged between 28 and 200 Mg ha-1. Expansion factors decreased from more than 4.0 at low growing stock volume to nearly 1.0 when growing stock volume was as high as 190 m3 ha-1. consistent with theoretical expectations. In stands with low AGBD ( 175 Mg ha-1. The similarity of our results for two major forest types suggests that they may be generally applicable for estimating AGBD from inventory data for other temperate broadleaf forests. Further, the pattern between and stand volume was similar to that obtained for tropical broadleaf forests, except that tropical forests generally had larger than temperate forests at a given volume. The implications of these results suggest that a recent assessment of forest biomass in developed countries is too low.
|
| [49] |
Compilation of a European forest map from Portugal to the Ural mountains based on earth observation data and forest statistics [J].https://doi.org/10.1016/S1389-9341(03)00024-8 Magsci [本文引用: 1] 摘要
<h2 class="secHeading" id="section_abstract">Abstract</h2><p id="">This article focuses on the approach of combining the information from both remote sensing and forest inventory statistics in order to produce a European forest proportion map covering the area from Portugal to the Ural mountains. For this purpose, a calibration method was developed, tested and applied to the pan-European area. The resulting forest map was analysed on a pixel-by-pixel basis and given to inventory and remote sensing experts for consultation. When comparing both the result of the calibrated forest map with that of the original AVHRR mosaic of the area it was found that the satellite-derived estimates of forest area closely matched the ground inventory statistics indicating the high accuracy obtained from the AVHRR mosaic alone. Most visible discrepancies were found in northern Europe where the inventory data showed less forest than the image data. In southern Europe, the inventory data displayed more forest than the AVHRR image. This project was carried out for the European Commission, Joint Research Centre in 1999/2000 (contract no. 17223-2000-12 F1SC ISP FI) mainly by the European Forest Institute and VTT Information Technology.</p>
|
| [50] |
An evaluation of time-series smoothing algorithms for land-cover classifications using MODIS-NDVI multi-temporal data [J].https://doi.org/10.1016/j.rse.2015.12.023 URL [本文引用: 1] 摘要
61Four smoothing algorithms were examined for MODIS land-cover classification.61All smoothing algorithms can significantly reduce intra-class variability.61Smoothed data resulted in large inconsistencies of Jeffries–Matusita (JM) measures.61Fourier smoothing algorithm performed best in improving classification accuracy.
|
| [51] |
The changes in China’s forests: An analysis using the forest identity [J]. |
| [52] |
Spatial occurrence of major tree species groups in Europe derived from multiple data sources [J].https://doi.org/10.1016/j.foreco.2008.09.012 URL [本文引用: 1] 摘要
Pan-European distribution maps have been compiled for six main species groups in Europe. The aim was to combine detailed tree species information from plot data of the International Co-operative Programme on Assessment and Monitoring of Air Pollution Effects on Forests (Forests) with other existing spatial and statistical information on forests. The applied method involves the interpolation of the plot data using the geo-statistical interpolation method kriging and a scaling and calibration procedure which makes the maps correspond both to the Forest map of Europe on pixel level and to national forest inventory statistics at regional or national level. Output is a set of European-wide maps with a resolution of 1km, showing the proportion of the main tree species groups as a percent of the total land area. The maps are considered to be potentially valuable input for various applications in the forestry and biodiversity field at a pan-European scale.
|
| [53] |
Red and photographic infrared linear combinations for monitoring vegetation [J].https://doi.org/10.1016/0034-4257(79)90013-0 URL [本文引用: 1] 摘要
The vegetation index, transformed vegetation index, and square root of the IR/red ratio were the most significant, followed closely by the IR/red ratio. Less than a 6% difference separated the highest and lowest of these four ER and red linear combinations. The use of these linear combinations was shown to be sensitive primarily to the green leaf area or green leaf biomass. As such, these linear combinations of the red and photographic IR radiances can be employed to monitor the photosynthetically active biomass of plant canopies.
|
| [54] |
2015. MODIS surface reflectance user's guide [R/OL]. |
| [55] |
Estimation of crown biomass of Pinus pinaster stands and shrubland above-ground biomass using forest inventory data, remotely sensed imagery and spatial prediction models [J]. |
| [56] |
Environment, vegetation and greenness (NDVI) along the North America and Eurasia Arctic transects [J]. |
| [57] |
Monitoring vegetation phenology using MODIS [J].https://doi.org/10.1016/S0034-4257(02)00135-9 URL [本文引用: 1] 摘要
Accurate measurements of regional to global scale vegetation dynamics (phenology) are required to improve models and understanding of inter-annual variability in terrestrial ecosystem carbon exchange and climateiosphere interactions. Since the mid-1980s, satellite data have been used to study these processes. In this paper, a new methodology to monitor global vegetation phenology from time series of satellite data is presented. The method uses series of piecewise logistic functions, which are fit to remotely sensed vegetation index (VI) data, to represent intra-annual vegetation dynamics. Using this approach, transition dates for vegetation activity within annual time series of VI data can be determined from satellite data. The method allows vegetation dynamics to be monitored at large scales in a fashion that it is ecologically meaningful and does not require pre-smoothing of data or the use of user-defined thresholds. Preliminary results based on an annual time series of Moderate Resolution Imaging Spectroradiometer (MODIS) data for the northeastern United States demonstrate that the method is able to monitor vegetation phenology with good success.
|
| [58] |
Distribution and variation of forests in China from 2001 to 2011: A study based on remotely sensed data [J].https://doi.org/10.3390/f4030632 Magsci [本文引用: 1] 摘要
Forests are one of the most important components of the global biosphere and have critical influences on the Earth's ecological balance. Regularly updated forest cover information is necessary for various forest management applications as well as climate modeling studies. However, map products are not widely updated at continental or national scales because the current land cover products have overly coarse spatial resolution or insufficiently large training data sets. This study presents the results of forests distribution and variation information over China using Moderate Resolution Imaging Spectroradiometer (MODIS) Normalized Difference Vegetation Index (NDVI) time series data with the first layer of MODIS Land Cover Type product (MODIS LC-1). The NDVI time series histogram characteristic curves for forestland were estimated from MODIS LC-1 and MODIS NDVI time series data. Based on the differences of histograms among different forests, we obtained the 2001-2011 forests distribution for China at a spatial resolution of 500-m x 500-m. The overall accuracy of validation was 80.4%, an increase of 12.8% relative to that obtained using MODIS LC-1 data. The 2001-2011 forestland pure and mixed pixels of China accounted for an average of 33.72% of all pixels. There is a gradual increase in China's forestland coverage during 2001-2011; however, the relationship is not statistically significant.
|

/
| 〈 |
|
〉 |
