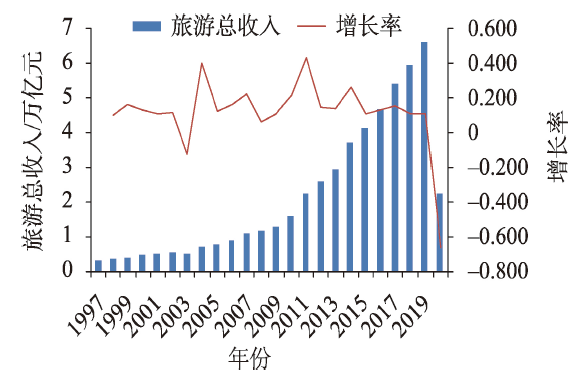
Tourism economic resilience involves high-quality development of tourism. By using the relevant data of tourism development in the Chinese mainland from 1998 to 2020 and based on the quantitative measurement of provincial tourism economic resilience, this study analyzed the temporal and spatial evolution characteristics of tourism economic resilience and revealed the mechanism of impact. The main conclusions of the study are as follows: China's tourism economy has strong resilience from 1998 to 2020, and the special events in individual years have not fundamentally changed the long-term positive trend. The temporal and spatial evolution of China's tourism economic resilience has the characteristics of instability and spatial agglomeration. The results of the spatial Markov chain model show that the probability of evolution of tourism economic resilience to high-value areas is high, and the tourism economic resilience at different levels generally presents agglomeration distribution. The mechanism of impact of regional tourism economic resilience was analyzed by using geographical detectors. The value of interactive leading factor q is generally greater than the maximum value of a single influencing factor, and this reflects that the impact on tourism economic resilience is generally from "resultant force". In general, the tourism economic resilience of the eastern region is closely related to the internal factors of the tourism industry, which indicates an endogenous driving type. The tourism economic resilience of the central and western regions is closely related to the external socioeconomic factors, which belongs to an exogenous driving type. Promoting the internal and external circulations of the economy plays an important role in improving the regional economic resilience. The research on the temporal and spatial evolution mechanism of tourism economic resilience provides a theoretical basis and decision-making reference for an objective understanding of the high-quality development of tourism and the risks and challenges faced by regional tourism.
Knowledge production is widely recognized as a critical source of long-term economic growth. However, the increasing complexity of contemporary knowledge production requires inputs exceeding that of the individual. This knowledge burden is dampened to some degree by collaboration. Yet, there is little empirical evidence on the relationship between complexity and collaboration, especially in China. By using the data of more than 3.0 million Chinese patents from the China National Intellectual Property Administration on 297 prefecture-level cities and above in China during the period from 1985 to 2019, this study explored the spatial and temporal evolution of patent complexity and examined the relationship between knowledge complexity and innovation collaboration in Chinese cities. The empirical analysis revealed that: 1) complexity was increasing and was spatially unevenly distributed during this period with an overall trend of high in the east and low in the west, and high in the south and low in the north; 2) there was a robust positive relationship between complexity and collaboration, suggesting that the increase of complexity can contribute to innovation collaboration; and 3) there was a negative and significant relationship between complexity and inter-city collaboration, indicating that complex knowledge is "stickier" than less complex knowledge, and increasing complexity is associated with local rather than nonlocal collaboration.
With the vigorous development of Beijing's headquarters economy and continuous promotion of the relief of noncapital core functions, capital flows between Beijing and other cities in China have received increasingly attention. Using the data of Beijing's outward investment and inward investment at prefecture-level and above cities from 2000 to 2019, this study examined the temporal and spatial characteristics of Beijing's outward investment and inward investment, and analyzed the spatial differentiation characteristics of investment influencing factors using a geographically weighted regression (GWR) model. The research found that: 1) Beijing's outward investment and inward investment first increased and then decreased, outward investment had always been greater than inward investment, and Beijing was a net capital export area. Beijing's outward investment and inward investment were mainly in the service sector, and the total amount and proportion of manufacturing in outward investment were greater than that of inward investment. 2) The spatial scope of Beijing's outward investment and inward investment continued to expand, the spatial distribution of destinations of outward investment was wider than inward investment, and the stratification phenomenon was more obvious. Beijing's outward investment was mainly in eastern coastal cities and provincial capital cities. Recently, more attention had been paid to the investment in central and western cities and cities around Beijing. The origin city of inward investment was stable, mainly provincial capital cities, eastern coastal cities, and cities around Beijing. The key cities of outward investment and inward investment were similar. 3) Beijing had a high degree of spatial concentration of outward investment and inward investment but showed a downward trend, and the degree of spatial concentration of inward investment was even higher. Recently, Beijing's outward investment had shown a positive spatial association, and inward investment had shown a random distribution. The high-high agglomeration areas of outward investment were the Beijing-Tianjin-Hebei, Yangtze River Delta, and Shandong Peninsula regions, and the high-high agglomeration areas of inward investment were the Yangtze River Delta and Pearl River Delta regions. 4) Beijing's outward investment and inward investment were both affected by differences in economic development scale and industrial structure, but there was an obvious spatial heterogeneity in the effects of influence. Outward investment was also affected by differences in transportation accessibility and labor costs, and inward investment was also affected by differences in economic openness. The research has improved the comparative study of outward investment destinations and inward investment sources, and enriched the study of investment geography.
In the new era, research on China's population aggregation and decentralization in different types of regions is of great reference value for the implementation of strategies for the new-type urbanization and rural revitalization. Therefore, we studied the spatiotemporal variations of population in China and its different types of regions (for example, urban agglomerations, original contiguous destitute areas, and border areas) at the county level based on the data of three censuses from 2000 to 2020. The results show that: 1) The pattern of China's population distribution, which is dense in the east and sparse in the west, had not fundamentally changed, and the population ratio of the southeast side to the northwest side of the Hu line is still 94∶6. Furthermore, the Chinese population had entered a period of negative growth, and more than half of the counties had negative population growth from 2010 to 2020. 2) The urban agglomeration areas were the main areas carrying China's population, accounting for nearly 90% of China's total population in 2020. From 2010 to 2020, among the 19 urban agglomerations of China, the Pearl River Delta and the Yangtze River Delta had the most significant population growth, while the Harbin-Changchun and central-southern Liaoning urban agglomerations experienced negative population growth. 3) The population of original contiguous destitute areas dropped continuously from 2000 to 2020, and the total population decreased by more than 11 million during the 20 years. But the population growth of three prefectures of southern Xinjiang and the Tibet area inhabited by ethnic minorities exceeded 15% from 2010 to 2020. 4) The population of border areas had been basically stable, but the population agglomeration index and population density decreased slightly from 2000 to 2020. In particular, the population of the northeastern and northern border areas declined significantly, both with a decrease of 15% from 2010 to 2020. The implications of this study are that the government should attach greater importance to the actual status of population change for carrying out targeted policies—such as the new-type of urbanization, rural revitalization, and national defense and security—under the new situation.
Intercity floating population is a key factor that affects the evolution of migration and mobility patterns and the high-quality development of urbanization in China. Based on the data from the 2017 China migrant population dynamic monitoring survey, this study improved the statistical criteria of intercity floating population, and analyzed their sizes, socioeconomic characteristics, spatial distribution, and the determinants and mechanism of their intercity mobility under the new criteria. The results show that: 1) The intercity floating population by the new criteria accounted for 42.92% of the total floating population, much higher than the 18.85% by the original criteria. 2) Compared with those by the original criteria, members of the intercity floating population by the new caliber had a slightly higher proportion of males and married people, a younger age at the time of first migration, a longer migration duration, a lower level of education, income, housing condition, social security, occupational status, and willingness to settle down in the current city. 3) Compared with rural-urban migrants, the urban-urban migrants were more capable of long-distance migration, and were more likely to have migration experiences in cities at high levels in the urban hierarchy and migrate to coastal prosperous cities in their subsequent migration. In contrast, rural-urban migrants who came to coastal areas were more likely to return to central and western areas. 4) The characteristics of individual migrants, their mobility and families, and the first destination cities of migration had significant impacts on the intercity migration of the floating population. The probability of subsequent migration between cities was higher among business and service sector workers and people with younger age and higher educational level, being married, having longer migration duration and higher family income, but lower for those with accompanying family members and an increased number of children. The characteristics of the city also affected the subsequent urban-urban mobility, with lower average wage level and green space coverage and higher per capita GDP and financial expenditure promoting subsequent migration of the floating population in cities. These results corrected some problems in the statistical criteria for intercity floating population and misunderstandings on them based on such criteria, and promoted research of this relatively weak field.
The identification and depiction of the externality of urban facilities has been a hot and difficult topic in human geography and urban planning. Focusing on the identification of the connotation of the externality of cultural facilities, this study analyzed the spatial coupling of the micro-location of cultural facilities and cultural enterprises in the central urban area of Ningbo City in different time periods and the mechanism of influence of cultural facilities on the development of cultural industry from the perspective of agglomeration and industrial format of cultural industry. The results are as follows: 1) The agglomeration pattern of cultural facilities changed from "dual-cores and multi-points" to "cluster-like three-cores and multi-points" from 2010 to 2020. The original agglomeration cores kept growing, and new agglomeration points also emerged. 2) From 2010 to 2020, the agglomeration pattern of cultural enterprises changed from "cluster-like single-core and multi-points" to "cluster-like three-cores and multi-points", while the abundance of cultural enterprises industrial format gradually decreased from the Sanjiangkou Old City and Eastern New City to the periphery. 3) The spatial pattern evolutions of the agglomeration of cultural facilities and cultural enterprises were basically the same, from single-core or dual-cores and multi-points to three-cores and multi-points. The evolution of clustering pattern of cultural facilities was also similar to the evolution of the abundance of cultural enterprises industrial format. 4) The externality of cultural facilities was mainly manifested in promoting the quantitative growth of cultural industry such as agglomeration scale and the qualitative development such as industrial format structural change, and the mechanism included the improvement of cultural atmosphere, the combination of cultural and commercial functions, and the development of cultural consumption and cultural productivity. These results provide a new perspective for the research on the externality of urban facilities and a theoretical basis for the layout of urban cultural facilities and the formulation of incentive policies for the development of cultural industries.
The increasing aged population poses new challenges to urban transportation, and the provision of age-friendly metro services is an effective measure to cope with population aging. Existing studies have emphasized the influence of the built environment on residents' metro travel behavior. The special physiological characteristics of the elderly make them more easily affected by the built environment, and it is unclear whether the findings of existing studies are applicable to the elderly people. Taking Wuhan City as an example, this study explored the influence of the built environment of the stations on older people's weekday and weekend metro travel behavior based on multi-source big data such as metro smart card data and using a gradient boosting decision tree model in machine learning. The results indicate that: 1) Elderly people's metro travel distance showed a significant increase from weekdays to weekends, but their travel frequency was lower on weekends than on weekdays. 2) The travel length of the elderly was concentrated within 45 minutes. The cross-river travel of elderly was less, and the destination of this group was concentrated in the areas with better public service facilities along the riverfront in the same district, and the travel time showed obvious temporal mismatch with the urban commuting peak. 3) Building floor area ratio and the number of shopping centers were the most important variables, and they showed similar trends on weekdays and weekends. 4) All built environment variables showed significant non-linear effects on elderly's ridership, with the highest effect occurring when the floor area ratio reached 2.0 and the number of shopping centers was 18. 5) Unlike other studies, the effects of density of bus stops and land use mixture on the ridership of the elderly were not significant. The results of the study can help better understand the spatiotemporal characteristics of metro travel for the elderly and the impact of the built environment, which has a very positive effect on coping with population aging.
China is becoming a country with both outflow and inflow of population. Under the background of cross-border migration, as an international tourist destination, Sanya City's international population mobility has shaped its Russian language landscape and attracted immigrants from Russian-speaking countries to migrate to the city. Through field research and in-depth interviews, this study analyzed the connection between immigrants and urban space in the Russian-speaking areas in Sanya from the perspective of mobility, and discussed the mobility characteristics of immigrants, the significance of their everyday practice, and how to produce and construct urban space. Under the new paradigm of mobility, this study tried to understand the characteristics of migration in Russian-speaking countries from the perspective of mobility and moorings dialectic and revealed the structure and significance of the moorings formed by the spatial agglomeration of immigrants from everyday mobility practice, as well as the identity behind them. The study found that group identities can be created and identified through social networks and organizations. While the residence and social identity of Russian-speaking immigrants in Sanya are characterized by mobility and precariousness, they are given special place significance through spatially constructed infrastructures that act as moorings for their everyday mobility. The moorings guide the everyday mobility of the group through spatially constructed placeness and initiate the reconstruction of social networks. In this process, the shaping and experience of placeness by the Russian-speaking population produces the creation and identification of group identity through linguistic culture, as well as the social construction of the group by the others, forming a Russian-speaking social network. As an important mooring space for migrants' mobility trajectories, their everyday spatial practice of mobility and social interactions interact and depend on each other, and the migrants' spatial practice and identities constitute important elements of new social networks under the interaction of people and places. Based on this, we hope to promote the construction of Sanya as a multicultural city, attract more international population to work and live in Sanya, and further promote the construction of Hainan as an international tourism island and a free trade port.
In the context of China's increasing mobility, modernity, and urbanization, the meaning and experiences of place and space are continuously reconstructed in migrants' everyday lives. The perspective of "home" helps to unravel the complex socio-spatial interactions between migrants and places. Based on the investigation in Shuhe Old Town, a part of Old Town of Lijiang, a World Cultural Heritage site, this study developed a home-city geographies theoretical framework to explore the processes of lifestyle migrants' home making and place negotiation. The study found that: 1) The materiality and imagination of "home" help lifestyle migrants refresh their memories and emotions in different places. They utilize the material culture, spatial form, and embodied experience to construct their familiarity with "home" and then internalize it as an identity. The interaction between place meanings and personal expressions is the intrinsic motivation of domestic material practices. 2) The lifestyle migrants come to take the city as "home" and develop the interwoven experiences of home and city. Their social interactions based on kinship, homeland, and interest promote the domestication of public space and (re)shape the place identities. 3) There are tensions in the overlapping territory of home and city. Multiple actors' continuous conflicts around the economic interests, material spaces, and symbolic boundaries of home demonstrate the unequal power relations between lifestyle migrants and city places. This article depicts the everyday lives of lifestyle migrants to address the intersections between their urban dwellings and constant mobility on multiple scales. We provide an in-depth understanding of the migrant-place interaction mechanism, research the impact of migrants on local society from a micro perspective, and contribute to the mobility governance of urban and rural China.
A reasonable assessment of the risk of extreme precipitation in the future and its changes relative to the past is conducive to the scientific formulation of risk prevention measures. Based on the future daily precipitation simulation data of 24 global climate models of the Shared Socioeconomic Pathways (SSP) 2-4.5 in the sixth phase of the Coupled Model Intercomparison Program (CMIP6), the reanalysis precipitation data of ERA5, and the prediction of population and gross domestic product (GDP), this study evaluated the socioeconomic risk of future global rainstorms at four return periods (5 years, 10 years, 20 years, 50 years) and their changes relative to historical periods. The main conclusions are as follows: 1) Under the future scenarios, the rainstorm intensity in Oceania is the highest and that in Europe is the lowest. With the increase of the return period, the areas where rainstorms occur continue to expand, and the intensity of rainstorms is also projected to increase. 2) At different return periods, the rainstorm risk in Europe and Oceania are the lowest, and that in Asia and Africa are the highest. 3) The regions with the most obvious increase of rainstorm risk in the future are concentrated in the southern and eastern coastal areas of Asia, the central, northern, and southeastern areas of Africa, and the eastern, western, and southern coastal areas of North America. The regions with the most obvious risk reduction are mainly distributed in central and southern Europe, northwestern and eastern Africa, and northern South America. With the increase of the return period, the proportion of the grids with increased risk is projected to increase. 4) The factors that are most related to risk changes at the four return periods differ in the 10 countries with significant changes in risk. The risk change of Russia has the greatest correlation with the change of rainstorm intensity. The risk changes of the United States, Brazil, India, Mexico, the Democratic Republic of the Congo, Argentina, and Australia have the greatest correlation with the change of population. The risk changes of Canada and China have the greatest correlation with the change of GDP. The study can provide a certain theoretical support for disaster prevention and mitigation in areas affected by extreme precipitation.
Lakes are significant freshwater sources. Due to climate change and human activities, freshwater resources provided by lakes are getting increasingly more limited, which makes lake water volume calculation important to estimate the total available volume of freshwater at both the global and the regional scales. In the Lake Erhai Basin, there was no measurement of daily or monthly inflows and only the values of total annual inflow volume for some years can be found in the literature, which makes it difficult to accurately calculate the inflow volume from each inflow river and the total inflow volume at daily or monthly scales. In this study, the DYnamic REservoir Simulation Model (DYRESM) was used to calculate the daily inflows and outflows in 2000-2020 at Lake Erhai based on the measured water levels, water level-storage capacity relationship curve, and a water balancing approach. In order to test the suitability of a catchment model (the Xin'anjiang Model) in the plateau area, the model was set up to simulate the daily inflows for the same period. The DYRESM and the Xin'anjiang Model outputs were compared with the yearly measurements for 2000-2020. The results show that: 1) The multi-year average volumes of inflow and outflow of Lake Erhai in 2000-2020 was 6.88×10⁸ m3 and 6.08×10⁸ m3 from DYRESM simulations. The correlation coefficient between the simulated yearly inflow values and the measured values was 0.97, and the correlation coefficient between the simulated yearly outflows and the measurements was 0.99. 2) The Xin'anjiang Model was set up and calibrated with the DYRESM-generated daily inflows. Comparison between simulated daily inflows by the two models for 2000-2020 at Lake Erhai shows that the Nash-Sutcliffe Efficiency (NSE) is 0.68 in calibration for 1 January 2000 to 31 December 2020 and 0.55 in validation for 1 January 2000 to 31 December 2020. The correlation coefficient for this time period was 0.94. Comparison of the optimized parameters of the Xin'anjiang Model at Lake Erhai with those in other areas of China demonstrates that the surface runoff retreat coefficient (Cs) and free water capacity (Sm) were area-sensitive. The values of Sm at Lake Erhai was larger than those at plain areas. 3) The correlation coefficient between the simulated yearly inflows by the DYRESM outputs with the yearly measurements for 2000-2020 was 0.97 and the Xin'anjiang Model outputs with the yearly measurements for the same period was 0.92, indicating that DYRESM had better model performance than the Xin'anjiang Model in simulating inflows and outflows of Lake Erhai.
Technological relatedness is a key perspective for understanding regional industry dynamics in contemporary evolutionary economic geography (EEG), mainly focusing on the final outputs of industries or products. Skill relatedness is introduced on the basis of technological relatedness. It also combines with the research on labor mobility and occupational skills in labor geography, and attempts to reveal knowledge structure and regional capabilities from the perspective of labor force. Systematically reviewing the research of technological relatedness and skill relatedness is of great significance for the development of China's economic geography and the exploration of regional high-quality development pathways. This article first reviewed and summarized the concepts and measurements, micro mechanisms, and empirical research of technological relatedness and skill relatedness in China and internationally. Then, it discussed the main differences and connections between technological relatedness and skill relatedness. On the whole, technological relatedness and skill relatedness reveal different aspects of regional economic space evolution, and both can reflect the quantity and quality of regional knowledge bases. The perspective of skill relatedness helps explain the evolution patterns of skill structure of employment, and reflects the source of relatedness from the perspective of labor skills, which is a good supplement and expansion of existing technological relatedness research. Because skill relatedness research is still in its infancy and has excellent potential, this article put forward prospects for future research on skill relatedness based on existing research.
Urban residential differentiation is a multidimensional process and complex system. It is increasingly more challenging to describe cities' multi-heterogeneous socio-spatial differentiation patterns by traditional single-dimensional and large-scale analysis. Based on the logics of the multidimensional attributes and scale effect of residential differentiation and referring to the thoughts of Western residential differentiation research, combined with the characteristics of urban residential differentiation in the new period of China, this study constructed a theoretical framework of the dialectical unity of "society-material-information" ternary space of residential differentiation. This study focused on the multidimensional turn and method innovation of residential differentiation research under the intervention of information elements and digital capital, and improved the recognition of urban residential differentiation patterns in the digital era. It pointed out that the study of residential differentiation needs to transform from a single dimension to multidimensional dialectical unity, from differentiation index to structure detection, and from spatial-temporal relationship to interaction mechanism. This study expanded the theoretical depth of residential differentiation research in China by reviewing and reflecting on the progress of Chinese and international research. It provides a reference for promoting high-quality and balanced development of urban social space.
In recent years, the frequent extreme weather and climate events have attracted wide attention. Their disastrous process often stems from the interaction of multiple factors, which brings many challenges to regional security and risk prevention. Starting from a bibliometric analysis, this article systematically reviewed the progress of research on compound extreme events by focusing on the conceptual features, classification, and driving factors of such events, and summarizing the main methods for the spatial-temporal dependance analysis and hazard assessment of compound events. The review found that: 1) The research on compound extreme events has developed rapidly in recent years, and the types of events studied have become increasingly rich and diverse. 2) The research system has been established and increasingly improved, with significant advance in the research on the conceptual characteristics, dependance, causative mechanism, and risk assessment. 3) The research techniques were constantly evolving. Statistical modeling for joint probability based on Copula has developed from two-dimensional to multidimensional, and from static to dynamic; the precision of numerical simulations represented by the coupled hydrological-hydrodynamic and ocean models has been continuously improved. But further in-depth studies are still needed, especially for some key and difficult problems, such as diagnosing and modeling the complex dependance structure of temporally and spatially compounding events, the synthetic effect of weather system, large-scale circulation and human activity impact on the formation of compound events, hazard scenarios and multidimensional joint probability analysis of compound events, and so on. In addition, it is urgent to explore the non-stationary changes of the marginal distribution and dependance structure of compound events under climate change and their impact on the risk of compound events in the future.
Since the 1990s, a new branch discipline, health geography, has developed from Western medical geography. Under this new disciplinary framework, the focus of geographic research has gradually shifted from disease and medical services to health and well-being in a broad sense, and related studies have had a significant impact in the fields of geography and social sciences. These studies on healing share a common theoretical foundation—the concept of "therapeutic landscape" proposed by Gesler in 1992—and gradually developed a set of influential theories in the subsequent development, becoming a well-deserved important theoretical contribution to health geography. As a core theoretical framework of health geography, the study of therapeutic landscapes is rarely mentioned in geographic research in China. This article reviewed the theoretical development process and current research progress on the use of therapeutic landscapes since the 1990s. The therapeutic landscape concept draws on structuralist and humanistic theories of new cultural geography. Influenced by the relational turn of geography in the later period, it gradually developed into the most influential theoretical framework of health geography. Therapeutic landscape research from a relational perspective has been deeply influenced by theories such as non-representational theory, actor network theory, and the mobility turn, and has gradually developed branch theories such as therapeutic assemblage, enabling place, therapeutic mobility, and therapeutic "taskscapes". Finally, the article summarized some challenges in the current research on therapeutic landscapes, and put forward suggestions for the development of health geography under the framework of therapeutic landscapes in the future.