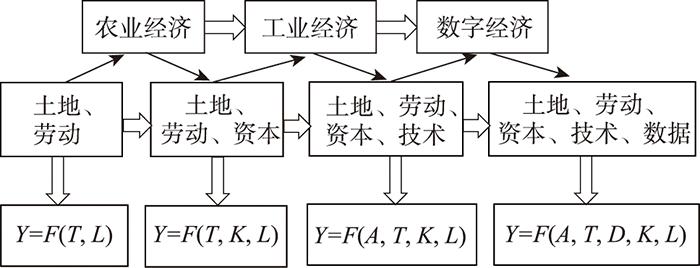
Based on the external conditions of technological progress and market demand upgrading in the process of high-quality development and the evolution of production factors, the factors of production in a digital economy are no longer limited to the traditional factors of production of labor, land, and capital. As knowledge and information, data have become the new core factor of production. However, data do not spontaneously generate economic value, and their impact on the economy does not break away from the framework of the traditional endogenous growth theory. They integrate technology flow, material flow, capital flow, and talent flow effectively, which render many factors in the traditional economic growth theory with new meanings. Therefore, it is necessary to appropriately expand the existing theoretical system. Based on the evolution of the endogenous growth model, this study constructed an input-output indicator system including data factor to measure the total factor productivity of marine economy in 11 coastal provinces of Chinese mainland (excluding Hong Kong, Macao and Taiwan) and the productivity changes of each factor from 2006 to 2018 using the directional distance function (DDF)-Luenberger index and its decomposition model. The results show that: 1) The performance of data factor in all coastal areas of Chinese mainland increased to different degrees, but the digital divide between these areas during the study period still cannot be ignored. 2) The measurement results of the DDF-Luenberger index show that since 2006, the total factor productivity of marine economy in all coastal areas has increased, and the stage characteristics are obvious. 3) The results of single factor performance measurement show that: with regard to the data factor, having large amounts of data only indicate the potential to transform them into real productivity, and the change of total factor data productivity still depends more on the change of digital technology. With regard to the labor factor, the development of digital economy shows the Matthew effect in the improvement of labor skills. During the study period, the total factor labor productivity in all coastal areas showed an upward trend. With regard to the capital factor, the change of total factor capital productivity shows obvious temporal and spatial differentiation characteristics. With regard to the resource factor, in general, the total factor resource productivity of coastal provinces shows positive changes with obvious stage characteristics.
This study selected 1897 county-level cities in China as the research unit to examine the spatial distribution pattern of carbon emissions and the effects of population, economy, and multi-dimensional urbanization levels on carbon emissions. The data sources are CHRED-online carbon emission public database and social and economic statistics of counties and county-level cities. Spatial autocorrelation and geographic detector methods were used in the empirical research. The results show that: 1) County-level cities of China are relatively highly different in carbon emissions, and the number of areas with high carbon emissions is relatively small, but the emission value is relatively large. The carbon emissions per unit of GDP are higher than the national average. 2) The spatial distribution of total carbon emissions mainly presents a pattern of high in the east and low in the west. The high-value areas of total carbon emissions are mainly concentrated in the east, the periphery of large cities in central China, and the central and northern regions of Inner Mongolia, showing a clustered distribution structure. Per capita carbon emissions and carbon intensity show a pattern of high in the north and low in the south, mainly concentrated in the central and northern parts of Inner Mongolia and the border areas of Xinjiang and Qinghai. 3) The spatial heterogeneity of the level of economic and land urbanization has a strong explanatory power for the difference in the total carbon emissions of county-level cities, and the impact of population urbanization on the total carbon emissions is not obvious. The interaction between economic urbanization and land urbanization has the most dramatic impact on carbon emissions, and shows a nonlinear enhancement effect. 4) With regard to regional differences, the level of urbanization has the most dramatic effect on the underdeveloped areas in the west. The eastern, central, and western regions also show different spatial characteristics in terms of the explanatory power of the same indicators and the key influencing factors.
In 2015, China proposed the coordinated development strategy of the Beijing-Tianjin-Hebei region. Industrial coordination is the first area to promote this strategy. Therefore, the agglomeration and dispersion of industries in this area have received extensive attention from academia. This study used the Duranton and Overman (DO) index to examine the spatiotemporal change characteristics of manufacturing industry agglomeration in the Beijing-Tianjin-Hebei region from 2004 to 2013, and compared the differences by sub-region, industry, and firm, based on the data with the spatial location of the firms from three economic censuses. First, the agglomeration ratio of manufacturing industry in the Beijing-Tianjin-Hebei region increased from 69.0% to 82.8%, and agglomeration mostly occurred in the short-distance range of 0-50 km. As the scope of agglomeration gradually expanded, the intensity of agglomeration gradually weakened with a decrease of 25.9%. Second, at the regional level, agglomeration was more likely to occur in Beijing and Tianjin with higher level of economic development; at the industry level, agglomeration was more likely to occur in technology-intensive and labor-intensive manufacturing industries; at the firm level, agglomeration was more likely to occur in small firms while large firms were also prone to agglomerate in extremely short distance (0-25 km). Third, there was a trend of the manufacturing industry spreading from Beijing and Tianjin to Hebei Province in this period, especially some manufacturing industries with low technological level and great labor demand. Therefore, it was appropriate to propose a coordinated development strategy at the time. In the process of industrial deconstruction and transfer, differentiated policies considering differences in industry and scale should be formulated.
Under the background of information technology progress, urban and regional research has begun the shift to the relationship between network organization function and structure, which is formed by the factor flows. Numerous studies indicate that it is feasible for urban network to simulate the urban region system relationships with the abstract pattern of regional structure. The networked urban region system serves as the precondition to explore the compactness of regions and provides a feasible quantitative research approach for the analysis of the compactness characteristic of regions and the mechanism. This research established the concept of network compactness, which means the manifestation of region compactness in the spatial structure of the urban network. In the context of urban network organization, it refers to the collaborative and complementary relationship among cities of all levels in the network space. With the purpose to explore the influencing factors of this relationship, empirical research was conducted by taking districts and county-level cities in Jiangsu Province as the research unit. The first-level fuzzy comprehensive evaluation method was adopted to measure the compactness of the traffic flow, investment flow, and innovation flow networks, based on which the spatial correlation map of the network compactness was constructed. Taking these as the explained variables, the exponential random graph model was introduced to form an estimation model from four aspects (including network endogenous mechanism, optimization mechanism, proximity mechanism, and coordination mechanism) to quantitatively analyze the formation mechanism of the urban network compactness in Jiangsu Province. The study revealed that the network compactness of Jiangsu Province is of a significant closed triangular structure in which local clustering is conspicuous, and there is relatively significant local compactness, while the improvement of the compactness level does not depend on the organization or coordination of third-party cities. Network compactness demonstrates a feature of powerful scale orientation, where cities with higher economic scale tend to build compact relationships. Network compactness comes into formation under the action of multi-city spatial clustering. The complex spatial relationship arising from geographical proximity is the premise of formation of the network compactness. However, the factor flow restrictions incurred by regional division in the province have restricted the establishment of the compactness relationship among cities, and then the network compactness at the region level demonstrates the phenomenon of abnormal clustering.
Based on the big data of car-sharing operation and urban point of interest (POI) data of Shanghai in 2018, the spatial, temporal, and frequency characteristics of car-sharing users' travel were studied, and the K-mean clustering of users' travel patterns was carried out to explore typical travel patterns. The research shows that: 1) There is a significant difference in car-sharing behavior between working days and weekends. Car-sharing trips on working days are more concentrated in the mixed functional areas in the central urban area, and the use volume is large in the morning and evening rush hours. The distribution of car-sharing travel space on weekends is scattered, with higher usage, shorter average single use time, and only a peak in the evening. 2) In Shanghai, car-sharing travel behavior can be divided into 10 modes: working day commuting in medium-high frequency mode, working day nocturnal high frequency mode, working day occassional dinner and home trip, occassional long-distance commuting and home trip over long distance at night low frequency mode, weekend daytime recreational activity high frequency mode, weekend away from home in the evening recreational activity and medium-long-haul low frequency mode, weekend evening recreational long-distance travel low frequency mode, weekend overtime work-related low frequency mode, and so on. 3) Medium and high frequency users mainly used shared cars to realize long-distance commuting and long-distance recreational activities on weekends, and the spatial area is mainly concentrated in the central city and sub-central areas; Low-frequency users used shared cars mostly in situations where public transportation cannot meet the demand and taxi costs are too high, such as night, long-distance, and weekend overtime work-related trips, and the spatial distribution is relatively scattered. It can promote the development of car sharing market in megacities by providing users with differentiated vehicle plans and optimizing vehicle spatial scheduling.
As a space with farmers' characteristics and reshaped by mixed classes, urban villages provide a guarantee for the vulnerable groups to integrate into the urbanization system and realize the anti-capital but not anti-market urbanization process. Exploring the impact mechanism of the built environment on residents' commuting mode choices and carrying out inclusive renovation of the built environment of urban villages will be of great significance for addressing the commuting and employment difficulties of vulnerable groups. Based on the location based services (LBS) data of Wuhan City in 2018 and taking the choice of commuting mode as binary dependent variable, this study used the gradient boosting decision tree to explore the nonlinear relationship between the built environment and commuting mode choices of urban village residents and threshold effect. The results show that the residents of urban villages who commute for a long distance generally depend on the public transport system, and the nonlinear influence and threshold effect of the built environment are obvious, which make up for the insufficient interpretability of the traditional linear model. The contribution of bus station accessibility is the largest (19.89%) in prediction, and the thresholds are about 300 m and 1000 m respectively. In urban village reconstruction, bus station within a Euclidean distance of 300 m should be satisfied as far as possible, there must be bus lines within 1000 m, and other variables have similar interpretability. The impact priority level and the most effective spatial attribute range of the built environment obtained from this study will provide a reference for improving the employment and commuting equity of urban village residents and for realizing regional inclusive and coordinated urbanization.
Due to the lack of enough in-situ observation data, there are uncertainties in geoscience research and climate research. Since the 1990s, several sets of reanalysis data have been developed, such as the NCEP/NCAR reanalysis data, ECMWF reanalysis data, and so on. These reanalysis data can effectively make up for the shortcomings of the uneven spatial and temporal distribution of observation data. However, different reanalysis data have different quality and inconsistent performance in different regions. Therefore it is of great significance to carry out the regional suitability assessment of reanalysis data for the study of geo-atmospheric process and climate analysis. Based on the monthly average temperature of 24 meteorological stations in Ningxia Hui Autonomous Region (Ningxia), the reanalysis data of GHCN-CAMS (Global Historical Climatology Network and the Climate Anomaly Monitoring System) and CMFD (China Meteorological Forcing Dataset) were evaluated for the ability to reflect the surface temperature at two spatial scales of 0.5° × 0.5° and 0.1° × 0.1° and two temporal scales of annual and monthly, using statistical indices of bias, absolute bias, root-mean-square error, and correlation coefficient. The results show that: 1) The reanalysis data of GHCN-CAMS and CMFD all have strong ability to reflect the temperature in Ningxia as a whole, the former slightly overestimates the temperature in Ningxia, and the latter slightly underestimates the temperature. 2) The reanalysis data of the two spatial scales have periodic positive and negative deviations at the annual and monthly scales, and the correlation at the annual scale is better than that at the monthly scale. 3) GHCN-CAMS and CMFD show different ability to reflect the temperature under different underlying surfaces. The temperature of farmland (gravel-mulched field) is overestimated in the cold season and underestimated in the warm season. For urban land, its temperature is overall underestimated. The temperature of grassland is underestimated by CMFD in cold season and slightly overestimated in warm season; while overestimated by GHCN-CAMS in cold season and underestimated in warm season. On the whole, CMFD have a better ability to reflect the surface temperature in Ningxia.
Located on the southeast edge of the Qinghai-Tibet Plateau, the Nyainqêntanglha Mountains are an important area of mountain paleoglaciers. Affected by the monsoon, the glacier change characteristics in each region are obviously different. Based on Landsat TM/ETM+/OLI data, ASRTMGDEM and meteorological data, using the method of threshold ratio, visual interpretation, VOLTA model and combined with field investigations, this study analyzed the advance and retreat conditions, area changes, ice reserves changes, and glacier changes deal with climate change of modern glaciers in the middle Nyainqêntanglha Mountains from 1990 to 2020. The results show that: 1) During the period 1990-2020, the elevation of the five studied glaciers (G094383E30581N, G094574E30563, G094637E30633N, G094770E30626N and G094928E30607N) gradually increased. The glacier area and ice reserves decreased by 30.38 km2 and 64 km3 respectively. 2) The ice reserve of each glacier decreased by 0.14-1.92 km3, with an overall change rate of 0.40%·a-1. By 2020, the reserves of the above glaciers will account for 0.70, 0.99, 0.98, 0.91 and 0.82 in 1990 respectively, which shows that the larger the scale of the glacier, the smaller the change is in a short time. 3) Through the analysis of meteorological data, during 1990-2020, the average temperature change rate of the study area was 0.51 ℃, which shows that the overall glacier change was dominated by the temperature rise. It is predicted that the glacier change in the future will be controlled by the temperature and show a trend of accelerated retreat. 4) The regional comparative study showed that the glacier area change in the Nyainqêntanglha Mountains is generally in a state of retreat, but the characteristics of glacier change in different regions are obviously different. The research on glacier ice reserves in the region is relatively weak, and the simulation results of different research methods for the same glacier ice reserves have large errors, with the relative error range of 34.45%-115.49%.
Water use efficiency (WUE) is an important indicator of terrestrial ecosystem response to climate change, and underlying surface factors affect WUE by influencing local climate. Ecological water shortage in the karst area is serious and the underlying surface is complex, but the comprehensive influence of multiple underlying surface factors on WUE is still unclear. In this study, MODIS gross primary productivity (GPP) and evapotranspiration (ET) data sets were used to calculate WUE in the karst area of Southwest China. Coupled with lithology combination, soil type, land use type, and surface roughness, the generalized linear model was used to reveal the comprehensive influence of underlying surface factors on WUE. The results show that: the WUE of the study area is affected by altitude and karst development degree, and increases from southeast to northwest. Among the underlying surface factors, the impact of lithology combination on WUE shows a difference between karst and non-karst areas. The lithology combination of carbonate rock in the karst area has a negative impact on WUE, and the negative impact of pure karst lithology combination is stronger than that of non-pure karst lithology combination; the impact of soil type on WUE is affected by the difference of distribution altitude, soil organic matter difference, and karst and non-karst landform difference; the impact of land use types generally shows a trend that more densely vegetated land use types have a stronger positive impact on the WUE; the increase of surface roughness first has a positive impact on the WUE, and then tends to have a negative impact. Carbonate rocks affect soil properties, and soil properties and surface roughness jointly affect vegetation.
Economic complexity is one of the important topics in evolutionary economic geography in recent years. Its attention to the transformation of industrial structure and the path of endogenous growth plays an important role in deepening the theories of economic geography and development economics, and helps to understand the transformation process of regional economic structure. This article reviewed the theoretical background of economic complexity, and examined the connotation, concept, and theoretical framework of economic complexity from the perspective of evolutionary economic geography. Then it reviewed the mainstream measurement methods of economic complexity. Based on the theory of diversification and product space, this article explored the mechanism of economic complexity on regional economic development, and then reviewed the progress of empirical research of economic complexity on regional economic growth, regional income disparity, and innovation. We found that most of the literature has proved the positive effect of economic complexity on regional economic development. Based on the idea of improving the product space density, regional economic complexity can be promoted by improving the industrial capacity and innovation ability. China's economic complexity is higher than that of other countries at the same income level, and its development path has unique characteristics, which provides a case for the theoretical study of economic complexity and has strong policy implications.
Livestock snow disaster is one of the most serious natural hazard-related disasters with long duration and wide influences in pastoral regions during winter and spring, which can cause a large number of livestock deaths and injuries. It has seriously threatened and restricted the production and high-quality development of animal husbandry in pastoral regions, with increasing uncertainties in its risk under climate change. Based on the natural disaster system theory, this study examined the theoretical framework of livestock snow disaster formation mechanism and risk assessment, and systematically summarized the progress of relevant research and methods in view of hazard, disaster formative environment, exposure, and risk assessment, along with identifying existing questions. Finally, future research directions of livestock snow disaster are proposed as follows: 1) Enhance the study on the estimation of grass height and the accuracy of retrieving snow depth. 2) Deepen the research on the physical process and mechanism of snow distribution and the coupling risk analysis of multi-hazards and disaster formative environment. 3) Strengthen the study on the spatiotemporal changes of livestock exposure. 4) Strengthen the study on the role of hypoxia environment on the formation mechanism of livestock snow disaster. 5) Promote the cost-benefit analysis of mitigation measures of livestock snow disaster. 6) Improve the study on quantitatively assessing livestock snow disaster risk in the context of climate change, as well as interdisciplinary research.
As an important aspect of coastal dune system research, the vulnerability assessment of coastal dune systems not only reveals the basic characteristics of the vulnerability of coastal dune systems, but also provides some references for the protection and utilization of coastal dunes, and has received extensive attention recently. Based on the review of relevant concepts, development process, evaluation indicator system, and technical methods of the vulnerability assessment of coastal dune systems in China and internationally, this article summarized the main progress in deepening the concept connotation, improving the evaluation indicator system, identifying vulnerability factors, optimizing technical methods, and applying assessment results. It also identified that there are still some deficiencies in the current research, such as the lack of consensus on the definition of concepts, controversy in developing the indicator system, limitations in the assessment methods, and the lack of very strong theoretical basis. Therefore, the research of vulnerability assessment of coastal dune systems in the future should focus on clarifying the concept of vulnerability of coastal dune systems, improving the indicator system and assessment methods, strengthening the mechanism research, and predicting the development trend of vulnerability.
As an important part of hydrological process, sediment transport is closely related to regional water resources, soil management, and even the healthy operation of ecosystem. Therefore, quantifying the relative contribution rate of climate change and human activities to sediment transport variation has become a hot issue in hydrology research. In this study, nine methods of attribution analysis of sediment discharge change, including simple linear regression analysis, double cumulative curve method, sediment attribution diagnosis analysis method, dam-sedimentation based method, sediment delivery distributed (SEDD) model, soil & water assessment tool (SWAT) model, elastic coefficient method, similar weather conditions method, and soil and water conservation method were systematically summarized. The calculation process and applicability of each method were elaborated, and the attribution analysis of sediment discharge change in the future was also discussed. Specifically, future work should try to enhance the application of new methods to explore a more appropriate new method for sediment discharge prediction. The impact of extreme rainfall events on sediment transport changes should be considered as well so that the accuracy of the results can be improved. Additionally, the limitations and differences of each attribution analysis method should be clarified, and hence the integration of existing evaluation methods and their mutual verification can improve the precision of the prediction. The results from this study can provide a scientific basis for the comprehensive management of ecological hydrology and land resources management in watersheds.
With the increasing severity of global environmental problems, scholars found that apolitical studies could not work on the environmental crises effectively, so they tended to seek for a more profound perspective to fix the environmental problems. Thus, political ecology has gradually become a critical field of environmental research in different disciplines. The core theme of political ecology is to trace political factors influencing environmental issues. Based on this theme, geography, a key discipline on human-environment relation studies, enhances the spatial and political perspectives in political ecology studies. It uses its professional strength, such as scale, region, and landscape to study political ecology. Summarizing theories and topics about political ecology from the perspective of geography has practical and theoretical meanings for the construction of Chinese ecological civilization. This study first mapped the theoretical timeline of political ecology and pointed out that the theories of political ecology are rooted in early environmental criticism, cultural ecology, Marxism, poststructuralism, and posthumanism, in line with the history of geographical thoughts. Political ecology claims that the understanding of environmental issues needs to be placed on broader social circumstances, uncovering the spatial conflicts among various actors including human and nonhuman in the consequence of conversation from physical nature to social nature. Second, this study analyzed nearly 30 years of literature on political ecology research in geography in the Web of Science core database, drawing a conclusion that relevant studies mainly focus on four topics: 1) ecological economics and green-development, focusing on spatial accumulation and flow of green capital; 2) environmental governance and conservation, revealing discourses producing various spatial forms in conservation; 3) environmental identity and micropolitics, demonstrating the negative and positive effects on micro environmental practices; 4) the object of ecology and agency, paying attention to how nonhuman's agency disturbing and cooperating with human politics. Finally, we conclude that the ultimate goals of political ecology from the perspective of geography are to reveal the inequality of social relations behind environmental space and to seek social improvement programs. Furthermore, based on the topics of political ecology research in geography, we put forward four future directions of political ecology research in China from the perspective of geography.