

植被物候是指植被受环境和其他因子的影响而产生的以年为周期的自然现象[1⇓-3]。植被物候不仅因环境变化的影响而发生变化[4],也可以通过物候期的一系列变化来影响陆地与大气之间能量、水分以及碳循环的过程[5]。近年来,在全球气候持续变暖背景下,遥感观测技术的快速发展为区域乃至全球尺度植被物候研究提供了重要数据源和技术手段[6⇓-8]。尤其,多种时空分辨率遥感归一化植被指数(normalized difference vegetation index, NDVI)和增强型植被指数(enhanced vegetation index, EVI)等产品的研发,大区域尺度长时间序列植被多种物候指标及其气候变化的响应被广泛报道,并有多种物候识别方法提出[9⇓-11]。其中,植被春季返青期和秋季枯黄期的研究已得到更多的重视,并在不同区域尺度上(如高原、国家和半球尺度)揭示了气候变化对返青期和枯黄期影响过程和强度[12-13]。例如,丛楠等[14]采用GIMMS (global inventory modeling and mapping studies) NDVI数据和5种返青期识别方法的研究发现,1982—2009年间北半球中高纬地区植被返青期约提前4 d,春季温度的升高被认为是其主要原因,即温度每升高1 ℃可能将返青期提前3.2 d。在中国北方草地生态系统,秦格霞等[15]的研究也表明,草地植被返青期在1983—2015年间约提前0~1.5 d,而枯黄期推迟0~1.5 d,致使草地生长季长度呈延长趋势。Wu等[16⇓-18]发现,北半球高纬度地区风速的下降有利于减小蒸散发和土壤水分的损失,从而使植被秋季枯黄期推迟,而干旱对枯黄期产生提前作用且其影响程度也在加剧,最高和最低气温对枯黄期具有不对称影响。
除返青期和枯黄期外,植被生长峰值期(peak of growing season,POS)是另一个重要的植被物候指标,它是指植被生长和光合作用能力达到顶峰时的日期,属于植被从生长阶段转为枯黄阶段的时间节点[19],其对应时间的生长峰值是决定年生产力的最主要部分[20-21]。Xu等[22]和Gonsamo等[19]的研究表明,北半球中高纬地区植被生长峰值期在1982—2015年间呈提前趋势,且生长季出现整体向春季方向移动的现象。Liu等[23]进一步的研究表明,美国植被生长峰值期提前的同时,其对应时期的NDVI(即NDVI峰值)也呈上升趋势,并指出温度对峰值期的控制作用最强,而降水量对NDVI峰值的作用最明显。Wang等[24]的研究表明,中国大多类型植被(除落叶针叶林外)生长峰值期呈提前趋势,除高山植被外,其变化主要受季前温度控制。尽管过去有限的研究基本上证实了北半球中高纬或其他不同区域植被峰值期呈提前趋势,但其研究时段主要集中在1982—2015年间[19,22-23],而过去的提前趋势在2015年以来是否持续尚不明确,植被生长峰值是否持续增加或出现转折等还需要进一步深入探讨。此外,过去的研究主要关注气温和峰值期之间的相关性大小,而生长峰值期和峰值对气候,特别是对降水、云覆盖的敏感性及其与温度敏感性之间的时空差异尚未得到深入研究。与简单相关分析不同,敏感性分析能够通过多元线性回归模型定量刻画植被峰值期或生长峰值对多种气候因子的响应强度,可表达气候要素变化导致的峰值期与峰值变化[25-26]。
鉴于此,本文采用MODIS (moderate-resolution imaging spectroradiometer) EVI数据和双Logistic四参数模型,识别2001—2020年北半球中高纬地区植被生长峰值期和EVI峰值,并与对应时间段的月尺度气温、降水量和云覆盖数据相结合,开展植被生长峰值期与峰值对气候的敏感性大小及其空间分布特征研究,可为气候变化对植被物候影响评估提供科学依据和数据支撑。尤其考虑到植被生长峰值对植被年总生产力具有决定性作用[20]和峰值期的提前将有利于峰值的增加[19]等因素,本文可为气候变化及其导致的陆地生态系统碳水循环的变化过程的准确掌握提供重要的科学依据。
1 数据与方法
1.1 数据来源及预处理
1.1.1 EVI数据
MODIS EVI是在NDVI的基础上改进的植被指数,综合了“抗土壤植被指数”(soil adjusted vegetation index,SAVR)和“大气抵抗植被指数”(atmospherically resistant vegetation index,ARVI)受土壤和大气影响相对小的优势,最大限度地降低了NDVI在高植被覆盖区域的饱和问题和在低植被覆盖区的土壤散射的影响[35]。此外,与NDVI时间序列数据相比,EVI的季节性更明显,能更好地反映植被季节性变化实际特征[36-37]和空间差异[38]。因此,本文选用Terra卫星MOD13C1产品的2001—2020年间的EVI数据(
式中:ρNIR、ρRED、ρBLUE分别代表近红外、红光和蓝光波段的反射率;L为土壤调节参数,一般取值为1;参数C1、C2是对红光和蓝光波段的校正系数,取值为6.0和7.5。考虑到北半球30°N以北地区的干旱区广泛分布着沙漠和戈壁荒漠,其植被覆盖极为稀少,EVI可能不能准确反映这些区域稀疏植被年内实际生长规律,本文根据以下3个条件来移除戈壁荒漠或沙漠地区,以最大限度地降低研究结果的不确定性:① 逐年逐像元计算年平均EVI(16 d EVI平均值),并将年均EVI<0.05的像元从研究区剔除; ② 在16 d EVI数据中逐年逐像元提取最大值出现的时间,并将最大值出现在6月15日之前或9月15日之后的像元剔除;③ 根据上述条件逐年逐像元获取有效像元后,将2001—2020年的共同像元作为最终的研究区。由于在冬季研究区高海拔和高纬度地区常常被积雪覆盖,EVI值为负,本文提取植被峰值期之前先将负值替换成0.05,以表示裸地或未出现绿色植被[39]。为验证在植被覆盖度相对较低的区域EVI同NDVI是否保持着适用性,我们利用2001—2018年的GLASS GPP (
图1
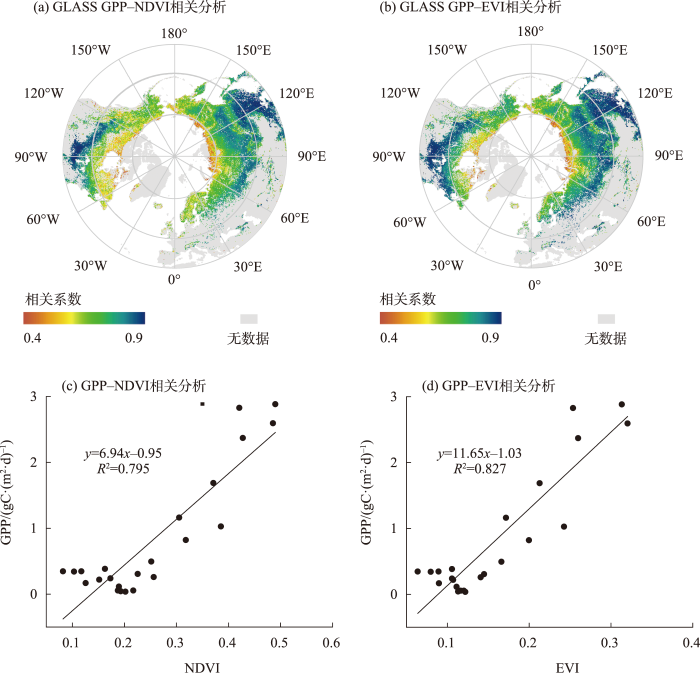
图1
2001—2018年北半球中高纬度植被GPP产品与(a)NDVI、(b)EVI相关系数及2007—2008年多伦FLUXNET GPP与(c)NDVI、(d)EVI相关性分析
Fig.1
Correlation coefficients of GLASS GPP and NDVI, EVI in the mid and high latitudes of the Northern Hemisphere during 2001-2018 and correlation between FLUXNET GPP and (c) NDVI, (d) EVI in Duolun
1.1.2 气象数据
气象数据采用英国东安格利亚大学(University of East Anglia)的Climate Research Unit (CRU)数据集。CRU产品能够提供全球大陆区域的逐月气象数据,包含气温、气温日较差、降水量、霜天和露天频率、水气压和云覆盖等气候要素[40],是目前最为广泛应用的气候数据产品之一。本文采用CRU TS v.4.06版本数据,包括了2001—2020年间空间分辨率为0.5°的月气温、总降水量和总云覆盖度数据,主要用于分析植被峰值期和生长峰值对气温、降水和云覆盖度的敏感性。为与EVI数据的空间分辨率一致,在ArcGIS 10.8环境下采用最邻近法将气温、降水量和云覆盖度数据重采样为0.05°,以便逐像元计算气候敏感性。
1.2 研究方法
1.2.1 双Logistic四参数模型
本文采用双Logistic四参数模型来识别北半球中高纬度植被生长峰值期及EVI峰值,其公式为:
图2
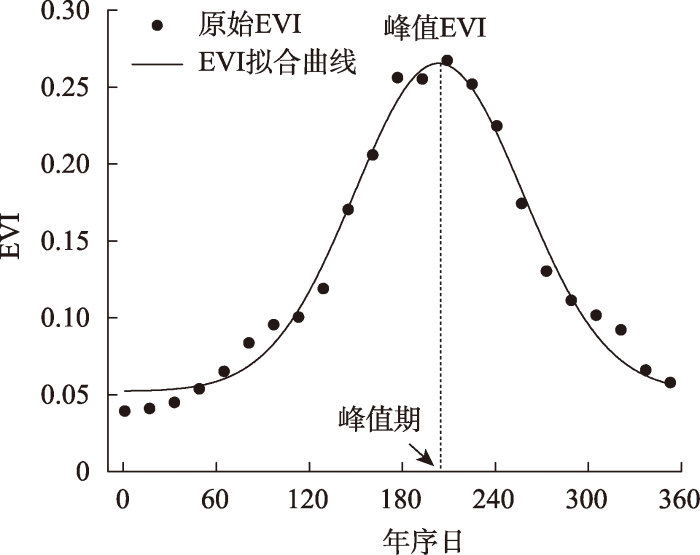
图2
基于EVI数据的植被生长曲线的双Logistic四参数模型拟合
Fig.2
Double logistic four-parameter model of vegetation growth used to fit the 16-day EVI data
1.2.2 植被生长峰值期与生长峰值变化及其气候敏感性
采用一元线性回归模型,逐像元计算植被生长峰值期和EVI峰值在2001—2020年间的变化趋势:
式中:b代表斜率,即植被峰值期或EVI峰值的变化趋势;n为观测长度,本文为20年;Ai为第i年的植被生长峰值期或EVI峰值。若b>0,表示植被峰值期推迟(EVI峰值增加);反之,b<0则表示植被峰值期提前(EVI峰值下降)。
采用三元线性回归模型构建植被峰值期(EVI峰值)与季前气温、降水量和云覆盖度之间的回归模型,以斜率表示植被峰值期(EVI峰值)对气候的敏感性大小:
季前长度由Pearson相关分析决定。具体为,将8月定为影响植被生长峰值期(EVI峰值)的起始月份,以月为时间步长,逐像元计算植被生长峰值期(EVI峰值)与温度、降水量和云覆盖度之间的相关系数,将最大相关系数出现的步长(月数)定为季前长度。Pearson相关系数计算公式为:
式中:rxy为植被生长峰值期(EVI峰值)与气候变量的相关系数,其绝对值越大,相关性越强;xi表示第i年植被生长峰值期(EVI峰值);yi表示不同季前平均气温、总降水量或云覆盖度;
2 结果与分析
2.1 植被生长峰值期与EVI峰值的空间分布特征
北半球中高纬地区2001—2020年间的植被平均生长峰值期主要发生在第180~230天之间(图3a),即每年6月末至8月末之间,区域平均峰值期为第198天,并随着纬度的升高呈先提前后推迟的变化趋势,即30°~56°N之间纬度每升高1°,植被生长峰值期平均提前0.70 d,而在56°N以北地区,纬度每升高1°,峰值期平均约推迟0.65 d(图3c)。在56°N附近植被生长峰值期最早,平均为第195天。如果不考虑70°N以北相对较小面积的陆地,峰值期随着纬度的升高呈显著提前趋势(P<0.05)。在空间上,在欧亚大陆东部、东北、西南部地区和北美大陆西部和东南部分地区,植被生长峰值期较早,一般为第190天之前。而欧亚大陆东南部地区峰值期出现的时间最晚,为第220天之后。在过去20年间,约占研究区94.6%像元地区的平均EVI峰值集中在0.2~0.6之间(图3b),并随着纬度的增加呈先增加后逐渐下降的变化趋势。在47°N附近的平均EVI峰值值最大,为0.48。在空间上,植被EVI峰值较大的区域主要分布在北美大陆东南部、欧亚大陆东部和西南少部分区域,值总体大于0.6,而高纬度地区尤其北美大陆北部的北极圈附近的EVI峰值最小,一般低于0.3。
图3
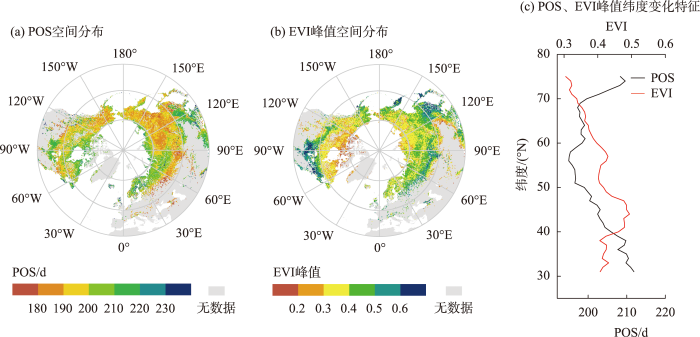
图3
2001—2020年北半球中高纬度(a) 植被生长峰值期与(b) EVI峰值空间分布及(c) 纬度变化特征
Fig.3
Spatial distribution of (a) the peaking time of the growing season and (b) peak EVI, and (c) their variations with latitudes in the mid and high latitudes of the Northern Hemisphere during 2001-2020
2.2 植被生长峰值期与EVI峰值时间变化趋势及空间差异
图4
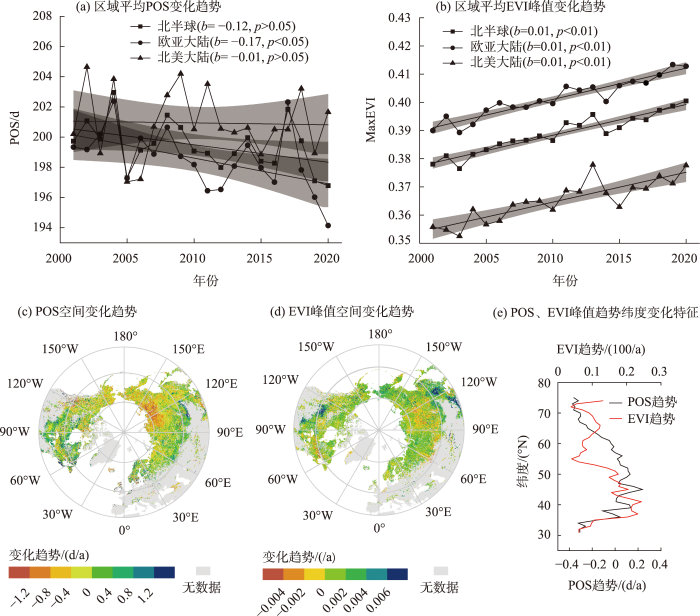
图4
2001—2020年北半球中高纬度(a) 区域平均植被生长峰值期和 (b) EVI峰值变化趋势;(c) 植被生长峰值期和(d) EVI峰值变化趋势空间格局及其(e) 纬度变化特征
注:(a)、(b)中灰色阴影部分是区域平均变化趋势的95%的置信区间。
Fig.4
Temporal trends of (a) the peaking time of the growing season and (b) peak EVI; spatial patterns of (c) the peaking time of the growing season and (d) peak EVI, and (e) their variations with latitudes in the mid and high latitudes of the Northern Hemisphere during 2001-2020
在空间上,约占研究区60.3%的地区植被生长峰值期呈提前趋势(图4c)。主要分布在欧亚大陆北部和东南地区及北美大陆西北地区,其中欧亚大陆东北部地区的提前趋势最大,达1.2 d/a。其余地区,呈推迟趋势的像元约占39.7%,分布在欧亚大陆南部、西南地区及北美大陆东部、东南地区。在纬度变化规律上,植被生长峰值期在31°~38°N和58°~75°N之间呈提前趋势(图4e),在31°~38°N间,随纬度升高,峰值期提前幅度逐渐减小。过去20年间,研究区74.5%的地区植被EVI峰值呈增加趋势,在欧亚大陆东南地区和北美大陆中南地区尤为明显(图4d);而下降趋势的像元主要分布在欧亚大陆中部和南部部分地区,及北美大陆中部、中东部分地区。在纬度梯度上,EVI峰值呈增加趋势,但随纬度升高的变化情况较复杂。其中,在30°~55°N之间,植被EVI峰值的增加趋势先增强后逐渐减弱,41°N附近,植被EVI峰值增加趋势最强,达0.02/10 a;在56°~75°N之间增加程度呈增强—减弱—增强趋势,但增加程度低于中纬度地区。
2.3 植被生长峰值期、EVI峰值与季前气候因子之间的相关性
约占研究区76.8%的地区的植被生长峰值期与季前3~5个月温度呈负相关(图5a、5b),表明春夏季温度升高将有利于峰值期提前。这些区域主要分布在欧亚大陆东南地区和北美大陆东部以及西北边缘以外的大多地区。从季前长度统计看,季前4个月的平均温度对植被峰值期的影响最广泛(图5c),像元占比达29.4%。与温度相反,植被生长峰值期与季前降水量之间主要以正相关为主(55.3%),在欧亚大陆南部、东南部分地区和北美大陆中南地区更加明显(图5d),季前长度大多为1~2个月(图5e),像元占比约为50.7%(图5f),说明夏季降水量的增加将推迟这些区域的植被生长峰值期。与降水量的影响相似,植被生长峰值期与季前云覆盖度主要以正相关为主(67.6%),尤其在欧亚大陆东南和中北部地区,以及北美大陆中南地区的相关性最强(图5g),季前长度也主要出现在季前1~2个月(38%)(图5i),与降水量的影响总体接近。
图5
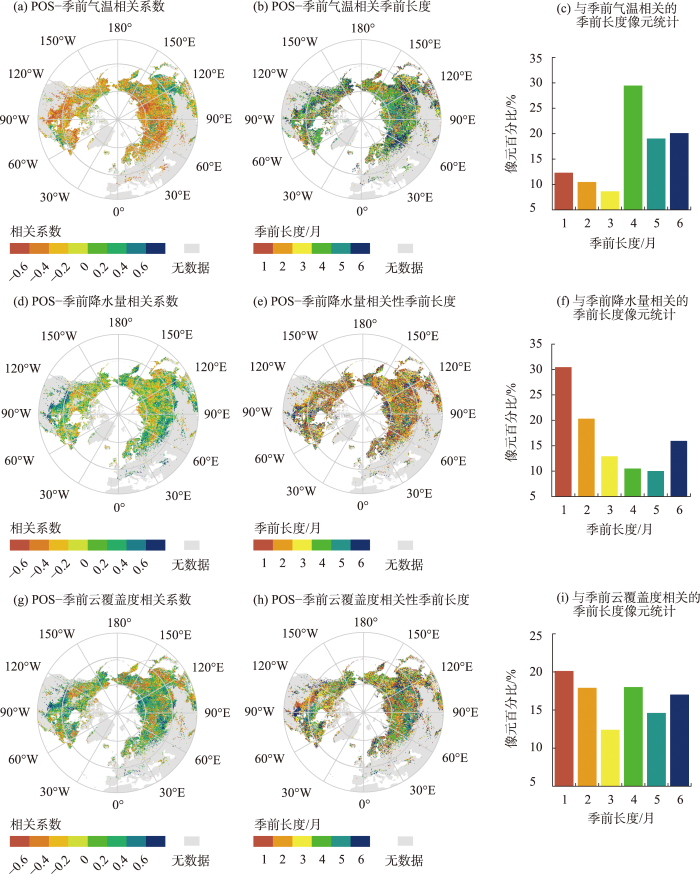
图5
2001—2020年北半球中高纬度植被生长峰值期与季前(a) 气温、(d) 降水量和(g) 云覆盖度之间的相关关系及其(b,e,h)季前长度和(c,f,i)像元统计
Fig.5
Correlation coefficients of the peaking time of the growing season and pre-season (a) temperature, (d) precipitation, and (g) cloud cover, and (b, e, h) their pre-season length and (c, f, i) pixel statistics in the mid and high latitudes of the Northern Hemisphere during 2001-2020
对EVI峰值而言,约60.2%的区域的EVI峰值与季前平均气温呈正相关(图6a),主要分布在欧亚大陆北部、东部、东南部和北美大陆西北部和东北部分地区,其中与季前6个月的平均温度之间相关性最广泛(图6b),占研究区的20.5%(图6c)。这说明温度对峰值EVI的影响更加持续,可能达5个月。EVI峰值与季前平均气温呈负相关的区域主要分布在低纬度地区,即年平均温度相对高和气候干旱的区域。EVI峰值与季前降水量同样以正相关为主,尤其低纬度地区尤为明显,在空间上与温度的响应呈相反的分布特征(图6d)。对EVI峰值影响最广泛的降水量季前长度为1~2个月(图6e),约占46.7%的像元(图6f)。EVI峰值与季前云覆盖度之间的相关性空间格局与季前降水量的分布较相似,主要在欧亚大陆东南部、中部和西南地区,北美大陆南部地区(图6g)。影响最广泛的季前长度为1~2个月(图6h),占研究区的48%(图6i)。
图6

图6
2001—2020年北半球中高纬度植被EVI峰值与季前(a)气温、(d)降水量和(g)云覆盖度之间的相关关系及其(b,e,h)季前长度和(c,f,i)像元统计
Fig.6
Correlation coefficients of peak EVI and pre-season (a) temperature, (d) precipitation, and (g) cloud cover, and (b, e, h) their pre-season length and (c, f, i) pixel statistics in the mid and high latitudes of the Northern Hemisphere during 2001-2020
2.4 植被生长峰值期、EVI峰值对气候因子的敏感性空间分布特征
植被生长峰值期与气候因子的相关性主要表示要素之间的关联程度,但不能反映气候因子对峰值期的影响程度。我们采用敏感性分析来表示峰值期对气候因子的相应大小。约占研究区84%的地区的植被生长峰值期对温度呈负敏感(图7a),其中:欧亚大陆中北部、西南部和北美大陆东南部、东北边缘地区的敏感性最强,达-0.6;仅有16%的地区对温度正敏感,分布在欧亚大陆中北部、东南部和东部部分地区,及北美大陆东南和西北部分地区。约51.4%和48.6%的区域植被生长峰值期对降水量分别呈负和正敏感(图7b):负敏感像元主要分布在欧亚大陆中北部、东部和西部部分地区,及北美大陆西部、东部和东南部分地区;正敏感像元主要分布在欧亚大陆东南部、东部和西部边缘地区,以及北美大陆中南部和边缘地区。峰值期对云覆盖负敏感的像元主要分布在欧亚大陆东部、东南部、西部和中部小部分地区,北美大陆中部、东南部、东部和西部部分地区(图7c);而正敏感的像元分布在欧亚大陆中部地区及北美大陆东南和东西部分地区。
图7
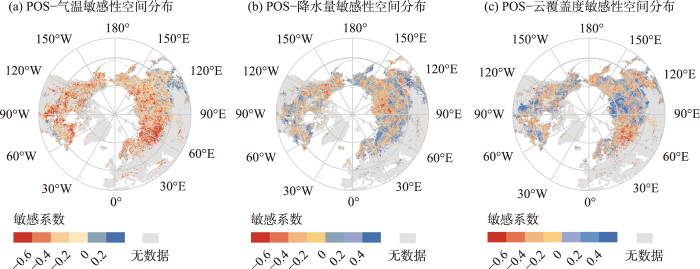
图7
2001—2020年北半球中高纬度植被生长峰值期对(a) 温度、(b) 降水和(c) 云覆盖度的敏感性空间格局
Fig.7
Spatial patterns of the sensitivity of the peaking time of the growing season to (a) temperature, (b) precipitation, and (c) cloud cover in the mid and high latitudes of the Northern Hemisphere during 2001-2020
约占研究区54.6%的地区植被EVI峰值对温度呈正敏感(图8a),主要分布在欧亚大陆高纬度地区、东南部和北美大陆少部地区。EVI峰值对降水量的敏感性正负值占比总体持平(50.2%和49.8%)(图8b)。在空间上,欧亚大陆中部、东南部、东部和西部部分地区,以及北美大陆东南部、东北部和西北部分地区降水增多,植被EVI峰值呈增加趋势。但在欧亚大陆中西部、东部和北美大陆中部、西部表现相反,即降水量增多,植被EVI峰值呈减少趋势。研究区51.1%的植被EVI峰值对云覆盖度的敏感性为负值(图8c),主要分布在欧亚大陆中西部、东部、东南部分地区以及北美大陆中北部、东西部分地区;EVI峰值对云覆盖度呈正敏感的像元分布在欧亚大陆中部、东南部、东北和西南部分地区,以及北美大陆南部和中西部边缘地区。
图8

图8
2001—2020年北半球中高纬度EVI峰值对(a) 温度、(b) 降水和(c) 云覆盖度的敏感性
Fig.8
Spatial patterns of the sensitivity of the peak EVI to (a) temperature, (b) precipitation and (c) cloud cover in the mid and high latitudes of the Northern Hemisphere during 2001-2020
为验证三元线性回归模型的拟合效果,我们采用Park等[45]的研究方法进一步将2001—2020年的季前气温、降水量和云覆盖数据作为自变量,计算了模型模拟峰值期和EVI峰值,并与实际峰值期和EVI峰值之间进行了对比。从趋势分析结果看,模型模拟得到的植被生长峰值期(图9a)和EVI(图9c)变化趋势的空间格局与遥感识别的峰值期(图9c)和EVI峰值(图9d)大致相似,说明三元模型总体上能够反映植被峰值期和EVI峰值与气候之间的关联性,与Park等[45]得出的结果总体一致。相关分析表明,模型模拟植被生长峰值期与2001—2020年实际峰值期之间的相关系数在高纬度地区高于低纬度,尤其在欧亚大陆高纬度地区(图9b)。与峰值期相比,三元线性模型对EVI峰值模拟能力相对较弱(图9d),可能与EVI峰值期主要分布在0.3~0.6有关,即数据间隔较低,使相关性降低。
图9
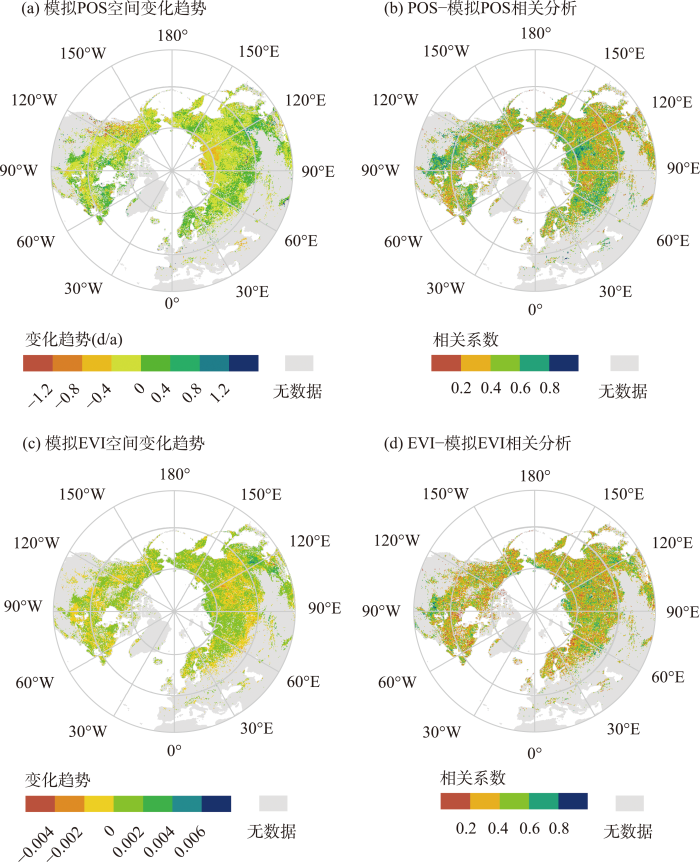
图9
三元线性模型模拟的2001—2020年(a) 植被生长峰值期和(c) EVI峰值变化趋势的空间格局及(b) 植被生长峰值期与模型模拟植被生长峰值期和(d) EVI峰值与模型拟合EVI峰值之间的相关系数
Fig.9
Spatial patterns of the trends of (a) the peaking time of the growing season and (c) peak EVI modeled by the ternary regression model; and correlation coefficients of (b) the actual peaking time of the growing season and the modeled peaking time of the growing season, and (d) the actual peak EVI and the modeled peak EVI, 2001-2020
3 讨论
本文以北半球中高纬度地区为研究区,开展了大区域尺度植被生长峰值期和EVI峰值时空变化特征及其对气候因子的响应研究,在观测时间长度和内容上进一步延伸了这一区域前人的相关研究结果[16,19,30]。与过去的研究结果一致[22],北半球中高纬度大部分地区2001—2020年的平均峰值期主要集中在夏季7—8月,但我们进一步发现随着纬度的升高峰值期呈先提前(<56°N)后推迟(>56°N)的纬度变化规律,但不考虑70°N以北的少部分陆地区域,植被峰值期呈随着纬度的升高而持续提前的变化趋势,说明高纬度地区的植被可能更早完成年内生长。这可能与高纬度植被长期暴露在低温环境中,生长季长度较短,植被生长速度比低纬度植被更快而导致峰值期提前到来有关[13,46]。在温带和寒带生态系统中,大多数植被光合作用最强的时刻(峰值期)一般出现在其植被生长最优气温的时间段[47-48]。这与本文得到的峰值期出现时间7—8月吻合,具体出现在第180~230天之间。在56°N附近峰值期最早可能与植被类型或人类活动有关,部分研究表明在50°~60°N之间农田的分布面积大于其他纬度带[43],由于受人类活动和农作物种类的不同致使56°N附近的生长峰值相对早[22]。2001—2020年北半球中高纬度植被区域平均峰值期呈提前趋势,其提前速率为0.12 d/a,说明Gonsamo等[19]1982—2015年间和Xu等[22]1982—2012年间观测到的北半球中高纬度植被峰值期提前的结果近年来仍有持续提前趋势,且提前速率与Gonsamo等的结果一致(0.12±0.6 d/a),但小于Park等[49]在2000—2016年间观测到的结果(0.166 d/a)。此外,更值得说明的是,植被EVI峰值在两个大陆和整个研究区尺度均呈显著增加趋势(图4b),与Huang等[21]在198—2011年在全球尺度观测到的结果一致,说明2011年以来植被EVI峰值仍在持续增加。在空间上,EVI峰值增长幅度最大的区域主要分布在中国东北与北美南部的农田地区(图4d),Huang等[21]也在其研究中得出农田土地面积的增加是全球植被EVI峰值增加的最主要原因之一。气候波动是包括植被生长峰值期内的植被物候变化的最主要的影响因子。其中,气温和降水量是最主要的气候因子[18,50-51],并且对植被物候产生一定的滞后效应[5,23-24,52]。本文除了气温和降水量外,还引入云覆盖度作为另一个环境因子开展植被生长峰值期与EVI峰值对多种气候因子的响应强度和敏感性。云覆盖度对植被物候的影响研究相比于气温和降水量要少。本文相关分析和敏感性分析均表明,气温对植被生长峰值期和EVI峰值将产生最重要的影响,并对两者产生不对称作用,即温度的升高有利于减小(提前)峰值期,但有利于增加EVI,在高纬度地区尤为明显。气温对峰值期和EVI峰值产生的季前长度总体一致,一般为季前3~5个月的长度。这可能由温度的升高,将降低高纬度地区尤其湿润地区的植被受低温的限制作用而增加植被生长的速度,最终致使植被峰值期提前和EVI峰值增加[53-54]。而在低纬度地区或干旱区,气温和EVI峰值之间呈负相关(图6a),这可能与温度的升高加剧干旱而抑制植被生长峰值期的增加有关[55-56]。降水量对植被生长的影响因气候区的不同而异,干旱区降水量的增加促进植被生长,增加EVI峰值在内的植被生产力或生产力指标[57-58],从而使植被更长时间的生长而导致峰值期推迟。而在温暖和湿润区,降水量的增加可能通过云量的增加而降低辐射来抑制植被生长,使EVI峰值下降[59],在空间上与本文较一致(图6d)。从整个研究区尺度来看,无论是植被生长峰值期还是EVI峰值,对降水量的敏感性正负值比例差异较小,在空间上复杂多样可能取决于生态类型及其气候特征。值得关注的是,云覆盖度对植被峰值期和EVI峰值的影响也较为复杂,正负敏感性的比重与降水量总体相似,说明云覆盖度和降水量之间有一定的内在的关联性,并对植被生长峰值期和EVI峰值产生关联性作用。过去的研究表明,降水量增加可能增加云量或有云的天数而减少太阳辐射和温度,通过温度的改变间接影响植被生长[60-61]。除气候因子对植被生长的影响外,植被生长过程可能也存在内在联系[62]。如Fu等[63]的研究表明,植被返青期和枯黄期之间存在正相关,即返青期提前可能使枯黄期也提前。这在一定程度上也说明,植被返青期和峰值期之间存在一定的相关性。但限于篇幅,本文目前还未开展2001—2020年北半球中高纬度植被返青期与峰值期、EVI峰值之间的关系,有必要在后期工作中对其进行深入研究,探究其与气候因子之间的综合作用。
4 结论
植被夏季生长峰值和峰值期对植被年内生产力累积扮演着极为重要的作用,也是对气候变化极为敏感的物候指标。本文以北半球中高纬地区为研究区域,利用2001—2020年间MODIS EVI数据集和双Logistic四参数模型识别其植被生长峰值和峰值期,并与春夏月气温、降水量和云覆盖数据相结合,研究了峰值期和EVI峰值过去20年的变化趋势及其对气候因子的敏感性。通过研究得出如下主要结论:
(1) 过去20年间,北半球中高纬度植被平均峰值期主要介于第180~230天之间,其平均值为第198天。在空间上,高纬度地区的峰值期早于低纬度地区。EVI峰值介于0.2~0.6之间,整体上随着纬度的增加呈下降的空间变化趋势。
(2) 从时间变化趋势看,区域平均峰值期呈不显著的提前趋势,但欧亚大陆的提前趋势比北美大陆更加显著,在空间上主要分布在欧亚大陆北部和东北部。而EVI峰值呈显著的增加趋势,尽管欧亚大陆和北美大陆的增加趋势很接近,但欧亚大陆的EVI峰值大于北美大陆。在空间上,EVI峰值增加幅度较大的区域主要分布在低纬度地区。
(3) 无论是峰值期还是EVI峰值,气温是其最主要的影响因子,但在高纬度地区温度对植被峰值期和EVI峰值产生不对称作用,即气温的升高使大多区域的峰值期减小(提前),而增加EVI峰值,而低纬度地区则降低EVI峰值。降水量和云覆盖度总体上影响相似,但在空间分布格局比温度的影响更加复杂和分散,但在低纬度地区降水量的增加有利于增加EVI峰值,从而使峰值期也呈推迟趋势。
参考文献
晋南地区不同海拔高度典型木本植物物候特征及其对气候变化的响应
[J].
Phenological characteristics of representative woody plants at different altitude sites in Jinnan region and their response to climate change
草地植物物候研究进展及其存在的问题
[J].植物物候是随环境变化表现出的周期性节律变化的事件,对环境变化非常敏感。多数研究发现,增温改变了单个物候事件,如提前了返青期和开花期,推迟了枯黄期;特别是近期发现相对于其他物候序列而言,结实期保持相对稳定,并且物候序列持续期的反应存在等级关系。不同植物个体物候对环境变化的响应模式不同,因而依据植物个体物候很难准确预测群落物候对环境变化的响应模式,所以应该加强群落物候的地面观测研究。尽管放牧是天然草地的主要利用方式,但目前仍然缺乏放牧如何影响气候变化对物候序列影响的研究;尤其是由于研究方法和技术等限制,也缺乏未来气候变化条件下地上与地下物候同步性、物候变化非线性及其机理的研究。
Phenology of grassland plants: A mini review
Plant phenology is a periodic event with environmental change, being much sensitive to environmental change. Most of the studies have observed that warming advanced onsets of greenup and flowering, but delayed completely leaf coloring. However, fruitingset kept relative stable under temperature change compared with other phenological sequences. There were hierarchical responses of phenological sequences in duration to temperature change (i.e. warming and cooling). In particular, more attention should be paid to observation of community phenology under future climate change because the response of individual plant phenology to climate change could not predict the response of the community phenology due to different responses from different plants. Although grazing is a major land use for natural grasslands, how grazing affects the effects of climate change on plant and community phenology is still unclear. Meanwhile, few studies have been performed on the synchrony of aboveground and root phenology, nonlinear change of phenological sequences and its mechanisms due to experimental method and technology limitations under future climate change.
秦岭山区植被春季物候的海拔敏感性
[J].
DOI:10.13287/j.1001-9332.202106.016
[本文引用: 1]

植被物候作为自然界规律性、周期性的现象,对自然环境尤其是气候变化有着重要的指示作用,研究其时空变化特征对陆地植被生态环境监测具有重要意义。本研究采用Savitzky-Golay滤波法重建秦岭山区2001—2018年MODIS增强植被指数时间序列影像,利用动态阈值法提取研究区春季物候信息(返青期),并对返青期多年平均值和年际变化与海拔、坡度进行相关分析。结果表明: 海拔每升高100 m,植被返青期推迟1.82 d;返青期的年际变化趋势主要集中在0~5 d·(10 a)<sup>-1</sup>。其中,呈推迟趋势的像元主要分布在低海拔地区,呈提前趋势的像元主要分布在高海拔地区。高海拔地区返青期的年际变化比低海拔地区复杂;秦岭山区植被返青期存在南北差异。北坡植被返青期多年平均值较南坡早2.9 d,南坡植被返青期的推迟程度大于北坡。南北坡植被返青期的年际变化在低海拔地区呈推迟趋势,且南北坡相差不大,而提前趋势在中高海拔地区存在显著差异。
Sensitivity of spring phenology to elevation in Qinling Mountains, China
DOI:10.13287/j.1001-9332.202106.016
[本文引用: 1]
Vegetation phenology, a regular and periodic phenomenon in nature, is an important indicator for natural environment, especially climate change. The study of spatiotemporal variations of vegetation phenology is of great significance for monitoring the changes of terrestrial vegetation. In this study, the Savitzky-Golay (S-G) filtering method was used to reconstruct time-series MODIS enhanced vegetation index (EVI) data in the Qinling Mountains from 2001 to 2018. The dynamic threshold method was used to extract the spring phenological parameter (start of growth season, SOS). The correlation between multi-year mean SOS and interannual variation with altitude and slope was analyzed. The results showed that SOS was delayed by 1.82 d with every 100 m increase in altitude in the Qinling Mountains. The interannual change trends of SOS mainly concentrated in 0-5 d·(10 a)<sup>-1</sup>. The pixels with delaying trend were mainly distributed in low-altitude regions, with the delaying degree being gradually decreased with the elevation. The interannual change trend of SOS in high-altitude regions was more complex than that in lower-altitude regions. The multi-year average SOS in the northern slope was approximately 2.9 d earlier than that of the southern slope, whereas the southern slope had a more significant advancing trend. The interannual change trends of SOS in both north and south slopes showed a delaying trend in low-altitude, with little difference between north and south slopes. The advancing trend in middle and high altitude was significantly different.
北半球中高纬度地区近30年植被春季物候温度敏感性
[J].
DOI:10.17521/cjpe.2021.0188
[本文引用: 2]
北半球气候变暖导致植被春季物候开始日期显著提前, 温度对春季物候的促进作用是一个过程事件而非瞬时事件, 且存在空间差异。该研究在以前研究的基础上, 进一步分析温度对植被物候的作用方式, 并探讨春季物候温度敏感性的空间特征及影响因素。利用GIMMS3g卫星植被指数产品, 采用5种方法提取1982-2009年植被春季物候, 并结合格网气象数据计算植被春季物候的温度敏感性, 着重分析自然植被春季物候温度敏感性与环境因素的关系。结果表明, 温度是北半球植被春季物候的主要制约因素, 54%的像元显示温度最大效应发生在物候开始当月和之前一个月。温度主导的春季物候的像元中, 91.3%的像元指示早春温度对物候开始的促进作用。植被春季物候的温度敏感性存在空间异质性, 随着区域环境因素的不同, 年际温度标准差、累积降水量和辐射对植被春季物候温度敏感性都具有各自或协同的调控作用。
Temperature sensitivity of vegetation phenology in spring in mid-to high-latitude regions of Northern Hemisphere during the recent three decades
DOI:10.17521/cjpe.2021.0188 URL [本文引用: 2]
基于遥感的东北植被物候沿城乡梯度变化
[J].植被物候沿城乡梯度的变化反映城市化过程对局地水热条件的调节作用。遥感技术可从区域和全球等大尺度上获取植被物候信息,从而弥补传统物候观测方法的不足。本研究以我国东北省会城市沈阳、长春、哈尔滨为例,基于MODIS NDVI数据,利用SavitzkyGolay滤波和分段高斯函数计算了各城区周边20 km内缓冲带的2种关键物候参数(生长季开始和结束日期);分析多年平均物候沿城乡梯度的变化,以及地表温度和林地盖度对物候空间变化的影响。结果发现:距城区越近,生长季开始越早,结束越晚,变化也越明显;在城乡梯度上,生长季随春季和前一年冬季地温升高而提前开始6~31 d·℃<sup>-1</sup>,随夏秋两季地温升高而推迟结束0.9~7.6 d·℃<sup>-1</sup>,而部分缓冲带内林地增多也会导致类似的生长季提前开始和延后结束。
Vegetation phenology changes along an urban-rural gradient in Northeast China based on remote sensing
Changes of vegetation phenology along the urban-rural gradients can reflect how urbanization regulates local water and heat conditions. Remote sensing can provide vegetation phenology at large scales (e.g. regional or global), making it a great alternative to traditional observation method. Taking three provincial capital cities (Shenyang, Changchun, Harbin) in Northeast China as examples, this study examined two critical phenology parameters (start of growing season, and end of growing season) in the buffer zones within 20 km from these urban areas, which were calculated from time series MODIS NDVI images using SavitzkyGolay filtering and segmented Gaussian method. Changes of multi-year mean parameters along the urbanrural gradients in relation to land surface temperature and forest coverage were analyzed. The results show that areas closer to urban sites tend to have earlier start of growing season, later end of growing season, and greater variability. Along the urban-rural gradients, 1 ℃ increase of land surface temperature in spring and last winter leads to an advance in start of growing season by 6-31 days, while 1 ℃ increase of land surface temperature in summer and autumn leads to a delay in end of growing season by 0.9-7.6 days. In some buffer zones, increase of forest coverage also contributes similar advances in start of growing season and delays in end of growing season.
基于MODISEVI时间序列的鄱阳湖湿地植被覆盖和生产力的动态变化
[J].
DOI:10.17520/biods.2018089
[本文引用: 1]
鄱阳湖是我国最大的淡水湖, 是与长江保持自由连通的两个湖泊之一, 也是最为重要的候鸟越冬地之一, 其生境质量对全球的生物多样性保护至关重要。枯水期的鄱阳湖由众多子湖构成, 不同子湖具有不同的水文控制与管理模式, 尤其是位于长江上游的三峡大坝2006年正式运行之后, 不同水文控制模式下的子湖展现出不同的退水机制, 对退水期洲滩出露的时间与湿生植被覆盖和生产力产生了不同的影响。近年来, 遥感和生态模型在研究植被变化中应用广泛。本文以MODIS增强植被指数(enhanced vegetation index, EVI)时间序列表示地表属性, 并利用EVI时间序列模型, 建立了2000-2014年植被覆盖和生产力的时空变化趋势。在研究区内建立的网格中, 随机提取了107个斑块, 采集其每16天间隔的MODIS EVI时间序列(2000年2月至2015年4月), 将自适应Savitzky-Golay平滑算法应用于EVI时间序列分析, 提取了4个关键的植被生长指标, 即生长季开始的日期、生长季长度、生长季EVI峰值和生产力。研究结果表明: (1)具有不同水文控制模式下的湿地植被生长特征表现出显著的差异, 尤其位于自由连通子湖的植被与其他模式的子湖相比: 生长季开始的时间更晚, 生长季较短, EVI峰值较低, 并且生长季节的初级生产力较低; (2)由于水文情势的改变, 自由连通子湖2006年前后的双生长周期湿地植被的生长特征差异明显, 秋季生长季提前, 导致了生物量的过度积累, 降低了越冬雁类食源的适口性; 但位于局部水文控制子湖的湿地植被不存在这种差异。(3)自由连通与局部水文控制的子湖对鄱阳湖越冬候鸟的保护均具有十分重要的意义, 需要保证这两种类型子湖的面积, 为越冬候鸟提供更广阔的食源; 当水文情势发生改变时, 局部的水文人为控制可在一定程度上减缓鄱阳湖水情变化对湿地植被生长带来的影响。
Dynamic change of vegetation cover and productivity of Poyang Lake wetland based on MODIS EVI time series
DOI:10.17520/biods.2018089
[本文引用: 1]
Poyang Lake, the largest freshwater lake in China, is one of two lakes that maintain a natural hydrological link with the Yangtze River. The lake system is critical for biodiversity conservation globally, harboring large number of migratory waterbirds. During the dry season, Poyang Lake fragments in to numerous sub-lakes, and different sub-lakes have different hydrological control and management mode. However, the recent hydrological alternation, presumably caused by the operation of Three Gorge Dam (TGD), is threatening the ecological integrity of the lake system, especially as a wintering ground for waterbirds. A robust investigation of the effects of TGD on vegetation cover and productivity at this critical biodiversity hotspot is therefore timely, and could incorporate recent advances in remote sensing and ecological modelling. In this study, using MODIS EVI (enhanced vegetation index) time series, we investigated the spatiotemporal patterns of growth in the lake for the period of 2000-2014, which includes periods before (2000-2006) and after (2007-2014) TGD was commissioned. Firstly, we extracted 107 16-day MODIS EVI time series (February 2000 to April 2015) for 10 randomly placed transects across the lake. We then applied the adaptive Savitzky-Golay smoothing algorithm to the EVI time series, and extracted four key growth metrics, namely, the starting date of growth season, growth season length, seasonal peak EVI, and productivity index. We found significant associations between the hydrological alternation and changes in vegetation seasonality. First, we found that the vegetation growth characteristics of wetlands under different hydrological control modes showed significant differences. In particular, the vegetation located in the freely connected sub-lakes had a later start of growing season, shorter growing season, lower peak EVI value, and lower primary productivity compared to sub-lakes of other modes. Second, due to the hydrological alteration, growth characteristics of sites in freely connected sub-lakes displayed two cycles per year and differed significantly before and after 2006. The advance of the autumn growing season led to excessive accumulation of biomass, which reduced the palatability of the food of migratory geese. However, this difference does not exist in the sites located in the local controlled sub-lake. Third, free connected and local controlled sub-lakes are both important for the protection of migratory birds of Poyang Lake. It is necessary to protect areas harboring both types of sub-lakes to provide a wider food source for wintering migratory birds. Local hydrology control can, to some extent, slow down the impact of much larger scale hydrological alteration on wetland vegetation growth.
中国植被物候研究进展及展望
[J].
Vegetation phenology response to climate change in China
A regional phenology model for detecting onset of greenness in temperate mixed forests, Korea: An application of MODIS leaf area index
[J].DOI:10.1016/S0034-4257(03)00103-2 URL [本文引用: 1]
Climate controls on vegetation phenological patterns in northern mid-and high latitudes inferred from MODIS data
[J].DOI:10.1111/j.1529-8817.2003.00784.x URL [本文引用: 1]
几种物候提取方法的小麦物候提取
[J].
Comparison of five methods for phenology extraction of winter wheat
高寒草甸植物物候对温度变化的响应
[J].
Plant phenological responses to temperature variation in an alpine meadow
Global warming leads to more uniform spring phenology across elevations
[J].
DOI:10.1073/pnas.1717342115
PMID:29279381
[本文引用: 2]
One hundred years ago, Andrew D. Hopkins estimated the progressive delay in tree leaf-out with increasing latitude, longitude, and elevation, referred to as "Hopkins' bioclimatic law." What if global warming is altering this well-known law? Here, based on ∼20,000 observations of the leaf-out date of four common temperate tree species located in 128 sites at various elevations in the European Alps, we found that the elevation-induced phenological shift (EPS) has significantly declined from 34 d⋅1,000 m conforming to Hopkins' bioclimatic law in 1960, to 22 d⋅1,000 m in 2016, i.e., -35%. The stronger phenological advance at higher elevations, responsible for the reduction in EPS, is most likely to be connected to stronger warming during late spring as well as to warmer winter temperatures. Indeed, under similar spring temperatures, we found that the EPS was substantially reduced in years when the previous winter was warmer. Our results provide empirical evidence for a declining EPS over the last six decades. Future climate warming may further reduce the EPS with consequences for the structure and function of mountain forest ecosystems, in particular through changes in plant-animal interactions, but the actual impact of such ongoing change is today largely unknown.
1982—2009年基于卫星数据的北半球中高纬地区植被春季物候动态及其与气候的关系
[J].
DOI:10.13287/j.1001-9332.201609.028
[本文引用: 1]
深入认识北半球植被物候在全球变暖背景下的动态变化特征,对于评估和预测生态系统结构和功能对气候变化的响应有重要的指示作用.遥感技术是获取北半球植被春季物候的最重要方法,但是由于物候提取算法的差异,目前还存在较大的不确定性.本文利用5种方法,基于卫星获取的归一化植被指数估算了北半球中高纬地区1982—2009年植被春季物候开始日期,分析了该日期的多年动态变化的时空特征,并探讨了气候变化对春季物候变化的影响.结果表明: 研究区植被春季物候开始日期呈现提前趋势,研究期间提前(4.0±0.8) d,其中,欧亚大陆提前速率为(0.22±0.04) d·a<sup>-1</sup>,显著高于北美大陆的变化速率(0.03±0.02 d·a<sup>-1</sup>);不同植被类型的变化趋势不同,5种方法都显示草地表现为显著提前趋势,而林地的提前趋势不显著.区域平均的植被春季物候开始日期的年际波动主要受春季温度的变化所驱动(r<sup>2</sup> =0.61,P<0.001), 温度每上升1 ℃,可以导致春季物候提前(3.2±0.5) d,而春季降水影响不显著(P>0.05).
Variation of satellite-based spring vegetation phenology and the relationship with climate in the Northern Hemisphere over 1982 to 2009
DOI:10.13287/j.1001-9332.201609.028
[本文引用: 1]
In-depth understanding the variation of vegetation spring phenology is important and nece-ssary for estimation and prediction of ecosystem response to climate change. Satellite-based estimation is one of the important methods for detecting the vegetation spring phenology in Northern Hemisphere. However, there are still many uncertainties among different remote sensing models. In this study, we employed NDVI satellite product from 1982 to 2009 to estimate vegetation green-up onset dates in spring across Northern Hemisphere, and further analyzed the phenology spatio-temporal variation and the relationship with climate. Results showed that spatial mean spring phenology significantly advanced by (4.0±0.8) days during this period in the Northern Hemisphere, while spring phenology advanced much faster in Eurasia (0.22±0.04 d·a<sup>-1</sup>) than in North America (0.03±0.02 d·a<sup>-1</sup>). Moreover, phenology of different vegetation types changed inconstantly during the period. All five methods consistently indicated that grassland significantly advanced, while forests didn’t advance robustly among methods. In addition, the interannual change of spring phenology was mainly driven by spring temperature. The spring phenology advanced (3.2±0.5) days with 1 ℃ increase in temperature. On the contrary, we did not find significant relationship between vegetation spring phenology and spring accumulative precipitation across the Northern Hemisphere (<i>P</i>>0.05) in this study.
中国北方草地植被物候变化及其对气候变化的响应
[J].
DOI:10.13287/j.1001-9332.201912.015
[本文引用: 1]
研究草地物候变化对揭示草地生态系统随全球气候变化的响应机制具有重要的科学意义.本研究基于1983—2015年的GIMMS NDVI 3g、气候和数字高程模型(DEM)数据,采用动态阈值法提取北方草地的物候信息[生长季始期(SOS)、生长季末期(EOS)、生长季长度(LOS)],分析北方草地物候的时空变化及LOS对气候的响应.结果表明: 88.9%的像元SOS发生在3月下旬到5月下旬(日序第90~150天),其中,68.1%的像元表现为提前,速率为-1.5~0 d·(32 a)<sup>-1</sup>;79.7%的像元EOS发生在10月上旬到10月下旬(日序第270~300天),其中,70.3%的像元表现为推迟,速率为0~1.5 d·(32 a)<sup>-1</sup>;LOS持续在100~140 d,其中,LOS变长的像元占73.7%,速率为0~1.5 d·(32 a)<sup>-1</sup>.LOS与气温呈显著正相关(R=0.628),与降水呈弱负相关(R=-0.091),并存在明显的空间差异.以海拔2000 m为分界线,低于2000 m时,LOS与海拔呈弱正相关(R=0.235),高于2000 m时,LOS与海拔呈显著负相关(R=-0.861);海拔高于3000 m时,海拔每升高1000 m, LOS缩短约10 d.
Grassland vegetation phenology change and its response to climate changes in North China
DOI:10.13287/j.1001-9332.201912.015
[本文引用: 1]
Understanding phenological change of grasslands has scientific significance to reveal their responses to global climate change. Based on the data of GIMMS NDVI 3g, climate data from 1983 to 2015 and digital elevation model (DEM), dynamic threshold method was used to extract the phenological information of northern grassland [the start of growth season (SOS), the end of growth season (EOS), and the length of growth season (LOS)]. We analyzed the temporal and spatial variation of phenology of grassland vegetation and the influence of climate on LOS. The results showed that 88.9% of SOS occurred from late March to late May (90-150 d), and 68.1% of pixels were advanced with a rate of -1.5-0 d·(32 a)<sup>-1</sup>. 79.7% of EOS occurred from early October to late October (270-300 d), with a delay rate of 0-1.5 d·(32 a)<sup>-1</sup>, accounting for 70.3% of the pixel number. LOS lasted for 100-140 days and became longer (73.7%), with a rate of 0-1.5 d·(32 a)<sup>-1</sup>. LOS was significantly positively correlated with temperature (<i>R</i>=0.628) and weakly negatively correlated with precipitation (<i>R</i>=-0.091). There was a significant spatial variation. The 2000 m line above sea level was recognized as the demarcation line. LOS had a weak positive correlation with altitude under 2000 m (<i>R</i>=0.235) and a significant negative correlation with altitude above 2000 m (<i>R</i>=-0.861). Above 3000 m altitude, LOS decreased by about 10 d for every 1000 m elevation.
Widespread decline in winds delayed autumn foliar senescence over high latitudes
[J].
Increased drought effects on the phenology of autumn leaf senescence
[J].DOI:10.1038/s41558-022-01464-9 [本文引用: 1]
Contrasting responses of autumn-leaf senescence to daytime and night-time warming
[J].DOI:10.1038/s41558-018-0346-z [本文引用: 3]
Peak season plant activity shift towards spring is reflected by increasing carbon uptake by extratropical ecosystems
[J].
DOI:10.1111/gcb.14001
PMID:29271095
[本文引用: 7]
Climate change is lengthening the growing season of the Northern Hemisphere extratropical terrestrial ecosystems, but little is known regarding the timing and dynamics of the peak season of plant activity. Here, we use 34-year satellite normalized difference vegetation index (NDVI) observations and atmospheric CO concentration and δ C isotope measurements at Point Barrow (Alaska, USA, 71°N) to study the dynamics of the peak of season (POS) of plant activity. Averaged across extratropical (>23°N) non-evergreen-dominated pixels, NDVI data show that the POS has advanced by 1.2 ± 0.6 days per decade in response to the spring-ward shifts of the start (1.0 ± 0.8 days per decade) and end (1.5 ± 1.0 days per decade) of peak activity, and the earlier onset of the start of growing season (1.4 ± 0.8 days per decade), while POS maximum NDVI value increased by 7.8 ± 1.8% for 1982-2015. Similarly, the peak day of carbon uptake, based on calculations from atmospheric CO concentration and δ C data, is advancing by 2.5 ± 2.6 and 4.3 ± 2.9 days per decade, respectively. POS maximum NDVI value shows strong negative relationships (p < .01) with the earlier onset of the start of growing season and POS days. Given that the maximum solar irradiance and day length occur before the average POS day, the earlier occurrence of peak plant activity results in increased plant productivity. Both the advancing POS day and increasing POS vegetation greenness are consistent with the shifting peak productivity towards spring and the increasing annual maximum values of gross and net ecosystem productivity simulated by coupled Earth system models. Our results further indicate that the decline in autumn NDVI is contributing the most to the overall browning of the northern high latitudes (>50°N) since 2011. The spring-ward shift of peak season plant activity is expected to disrupt the synchrony of biotic interaction and exert strong biophysical feedbacks on climate by modifying the surface albedo and energy budget.© 2017 John Wiley & Sons Ltd.
Joint control of terrestrial gross primary productivity by plant phenology and physiology
[J].
DOI:10.1073/pnas.1413090112
PMID:25730847
[本文引用: 2]
Terrestrial gross primary productivity (GPP) varies greatly over time and space. A better understanding of this variability is necessary for more accurate predictions of the future climate-carbon cycle feedback. Recent studies have suggested that variability in GPP is driven by a broad range of biotic and abiotic factors operating mainly through changes in vegetation phenology and physiological processes. However, it is still unclear how plant phenology and physiology can be integrated to explain the spatiotemporal variability of terrestrial GPP. Based on analyses of eddy-covariance and satellite-derived data, we decomposed annual terrestrial GPP into the length of the CO2 uptake period (CUP) and the seasonal maximal capacity of CO2 uptake (GPPmax). The product of CUP and GPPmax explained >90% of the temporal GPP variability in most areas of North America during 2000-2010 and the spatial GPP variation among globally distributed eddy flux tower sites. It also explained GPP response to the European heatwave in 2003 (r(2) = 0.90) and GPP recovery after a fire disturbance in South Dakota (r(2) = 0.88). Additional analysis of the eddy-covariance flux data shows that the interbiome variation in annual GPP is better explained by that in GPPmax than CUP. These findings indicate that terrestrial GPP is jointly controlled by ecosystem-level plant phenology and photosynthetic capacity, and greater understanding of GPPmax and CUP responses to environmental and biological variations will, thus, improve predictions of GPP over time and space.
Enhanced peak growth of global vegetation and its key mechanisms
[J].
Trends toward an earlier peak of the growing season in Northern Hemisphere mid-latitudes
[J].
DOI:10.1111/gcb.13224
PMID:26752300
[本文引用: 5]
Changes in peak photosynthesis timing (PPT) could substantially change the seasonality of the terrestrial carbon cycle. Spring PPT in dry regions has been documented for some individual plant species on a stand scale, but both the spatio-temporal pattern of shifting PPT on a continental scale and its determinants remain unclear. Here, we use satellite measurements of vegetation greenness to find that the majority of Northern Hemisphere, mid-latitude vegetated area experienced a trend toward earlier PPT during 1982-2012, with significant trends of an average of 0.61 day yr(-1) across 19.4% of areas. These shifts correspond to increased annual accumulation of growing degree days (GDD) due to warming and are most highly concentrated in the eastern United States and Europe. Earlier mean PPT is generally a trait common among areas with summer temperatures higher than 27.6 ± 2.9 °C, summer precipitation lower than 84.2 ± 41.5 mm, and fraction of cold season precipitation greater than 89.2 ± 1.5%. The trends toward earlier PPT discovered here have co-occurred with overall increases in vegetation greenness throughout the growing season, suggesting that summer drought is not a dominant driver of these trends. These results imply that continued warming may facilitate continued shifts toward earlier PPT and cause these trends to become more pervasive, with important implications for terrestrial carbon, water, nutrient, and energy budgets.© 2016 John Wiley & Sons Ltd.
Impacts of global change on peak vegetation growth and its timing in terrestrial ecosystems of the continental US
[J].
Estimating the peak of growing season (POS) of China's terrestrial ecosystems
[J].
Modeling growing season phenology in North American forests using seasonal mean vegetation indices from MODIS
[J].DOI:10.1016/j.rse.2014.03.001 URL [本文引用: 1]
Climatic warming increases spatial synchrony in spring vegetation phenology across the northern hemisphere
[J].
DOI:10.1029/2018GL081370
URL
[本文引用: 1]
Climatic warming has advanced spring phenology across the Northern Hemisphere, but the spatial variability in temperature sensitivity of spring phenology is substantial. Whether spring phenology will continue to advance uniformly at latitudes has not yet been investigated. We used Bayesian model averaging and four spring phenology models, and demonstrated that the start of vegetation growing season across the Northern Hemisphere will become substantially more synchronous (up to 11.3%) under future climatic warming conditions. Larger start of growing season advances are expected at higher than lower latitudes (3.7–10.9 days earlier) due to both larger rate in spring warming at higher latitudes and larger decreases in the temperature sensitivity of start of growing season at low latitudes. The consequent impacts on the northern ecosystems due to this increased synchrony may be considerable and thus worth investigating.
IPCC第六次评估报告第二工作组报告解读
[J].
Interpretation of the main conclusions of IPCC AR6 Working Group Ⅱ Report
Has the advancing onset of spring vegetation green-up slowed down or changed abruptly over the last three decades?
[J].DOI:10.1111/geb.2015.24.issue-6 URL [本文引用: 2]
Phenology shifts at start vs. end of growing season in temperate vegetation over the Northern Hemisphere for the period 1982-2008
[J].DOI:10.1111/j.1365-2486.2011.02397.x URL [本文引用: 1]
Temperature, precipitation, and insolation effects on autumn vegetation phenology in temperate China
[J].
DOI:10.1111/gcb.13081
PMID:26340580
[本文引用: 1]
Autumn phenology plays a critical role in regulating climate-biosphere interactions. However, the climatic drivers of autumn phenology remain unclear. In this study, we applied four methods to estimate the date of the end of the growing season (EOS) across China's temperate biomes based on a 30-year normalized difference vegetation index (NDVI) dataset from Global Inventory Modeling and Mapping Studies (GIMMS). We investigated the relationships of EOS with temperature, precipitation sum, and insolation sum over the preseason periods by computing temporal partial correlation coefficients. The results showed that the EOS date was delayed in temperate China by an average rate at 0.12 ± 0.01 days per year over the time period of 1982-2011. EOS of dry grassland in Inner Mongolia was advanced. Temporal trends of EOS determined across the four methods were similar in sign, but different in magnitude. Consistent with previous studies, we observed positive correlations between temperature and EOS. Interestingly, the sum of precipitation and insolation during the preseason was also associated with EOS, but their effects were biome dependent. For the forest biomes, except for evergreen needle-leaf forests, the EOS dates were positively associated with insolation sum over the preseason, whereas for dry grassland, the precipitation over the preseason was more dominant. Our results confirmed the importance of temperature on phenological processes in autumn, and further suggested that both precipitation and insolation should be considered to improve the performance of autumn phenology models.© 2015 John Wiley & Sons Ltd.
Long-term topographic effect on remotely sensed vegetation index-based gross primary productivity (GPP) estimation at the watershed scale
[J].
1982—2011年北半球中纬度秋季植被绿度变化的主要模态
[J].
DOI:10.13249/j.cnki.sgs.2014.010.1226
[本文引用: 1]
利用系统聚类方法和经验正交函数分解(EOF分析)2种方法,分别提取了北半球中纬度地区1982~2011年秋季(9~11月)归一化差值植被指数(NDVI)变化的主要模态,辨识了植被绿度变化的区域差异;并采用奇异值分解(SVD)的方法,综合时间和空间2个维度上的变异信息,揭示了植被绿度变化的气候背景。结果表明,北半球中纬度秋季植被绿度变化有2种基本模态,一种是持续增加模态(模态I),该模态广泛分布于北美大陆、亚欧大陆的北半部(大约在55<sup>o</sup>N以北)和东西两端,NDVI平均增速为0.014/10a;另一种是趋势转折模态(模态II),NDVI先增加,后减少,转折点大致出现在1994年,该模态主要出现在亚欧大陆中部,NDVI变化的平均速率分别是0.027/10a和-0.017/10a,其中以40<sup>o</sup>E~80<sup>o</sup>E最为典型。植被绿度变化与温度变化的时空特征基本一致。模态I区域的温度变化以持续性升高为主要特征,模态II区域的温度变化则以先增加后降低为主要特征,转折年份与NDVI变化的转折年份基本一致。SVD分析的第一模态NDVI与温度的时间系数相关系数为0.82,第二模态为0.92。由此表明,植被绿度变化主导模态可能由温度变化模态所致,在区域-大洲尺度上,温度变化的区域差异导致了秋季植被绿度变化的区域差异。
Main models of variations of autumn vegetation greenness in the mid-latitude of north hemisphere in 1982-2011
DOI:10.13249/j.cnki.sgs.2014.010.1226
[本文引用: 1]
:To understand response of terrestrial ecosystem to climate changes, it is important to study variations in vegetation greenness (VG) under the changing climate. We firstly extend the Advanced Very High Resolution Radiameter (AVHRR)-based Normalized Difference Vegetation Index (NDVI) from 2006 to 2011 by calibrating the Moderate Resolution Imaging Spectroradiometer-based NDVI. Using hierarchical clustering and empirical orthogonal function (EOF) analysis, this study picked out main models of variations of autumn VG (September to November) which was indicate by NDVI from 1982 to 2011. Then, by using Singular Value Decomposition (SVD), we integrated temporal variations and spatial variations of NDVI and temperature to reveal climate background of variations in VG. We found that the MODIS-NDVI captures the main variations of VG as the AVHRR-NDVI; therefore, it is reliable to extend the AVHRR-NDVI with the MODIS-NDVI. Both of cluster analysis and EOF analysis show the variations in autumn VG had two main models. One (model I) was featured by an increasing trend of VG from 1982 to 2011. This model spreads across the North America land, northern part and (west, east) two ends of Eurasia. The mean rate of increase in NDVI was ~0.014 per decade. The other model (model II) was featured by turn of NDVI variations. This model mostly spread in the center area of Eurasia. The turn point of NDVI variations was about 1994. From 1982 to 1994, the NDVI increased at the rate of 0.027 per decade; while, from 1995 to 2011, the NDVI decreased at the rate of 0.017 per decade. EOF analysis as well as illustrates that above two models could explain 21.1% and 8.1% of total variations of NDVI, respectively. The SVD analysis illustrated that variations in NDVI matched well with variations in temperature. In the Model I area, the temperature changes were featured by an increasing trend. The time coefficients of NDVI and temperature had a strong correlation (R=0.82). In the model II area, the temperature changes were featured by a turn point. Before the turn point, temperature increased; after the turn point, temperature decreased. The time coefficients of NDVI and temperature also had a strong correlation (R=0.92). These results suggest that the persisting greening in the Model I area occurred in the climate warming background and conversion from greening to browning in the Model II area co-occurred with the climate changes from warming to cooling. These findings demonstrate that the main models of variations in VG might result from temperature variations. In the continental scale, the spatial heterogeneity of temperature variations resulted in spatial heterogeneity of VG variations.
植被指数研究进展:从AVHRR-NDVI到MODIS-EVI
[J].
From AVHRR-NDVI to MODIS-EVI: Advances in vegetation index research
MODIS NDVI与MODIS EVI的比较分析
[J].
Comparison and analysis of MODIS NDVI and MODIS EVI
Modeling gross primary production of a temperate grassland ecosystem in Inner Mongolia, China, using MODIS imagery and climate data
[J].
基于EOS/MODIS数据的NDVI与EVI比较研究
[J].
Comparison of NDVI and EVI based on EOS/MODIS data
DOI:10.11820/dlkxjz.2007.01.003
[本文引用: 1]
As the continuation and development of NOAA/AVHRR NDVI, the normalized difference vegetation index (NDVI) and enhanced vegetation index (EVI) of MODIS have been comprehensively used in many fields. In order to investigate the difference between NDVI and EVI derived from MODIS, comparative study of these two vegetation indices was conducted by statistics and geo- statistic methods (semi- variance function). By the comparison of the two kinds of vegetation index distribution maps in different period, it is demonstrated that EVI improve the sensitivity for well- vegetated areas where NDVI is saturated when plants grow well, which will be helpful in monitoring plants growth status. At same resolution, i.e. 250m, 500m and 1000m, by means of the geo- statistics, the results show that range, variance and variation coefficient of EVI is higher than that of NDVI, the value of NDVI is even, and its spatial relativity is higher than that of EVI, which all show that EVI is more sensitive to the spatial heterogeneity of plants in research area.
Increased plant growth in the northern high latitudes from 1981 to 1991
[J].DOI:10.1038/386698a0 [本文引用: 1]
1979—2017年CRU、ERA5、CMFD格点降水数据在青藏高原适用性评估
[J].
Assessment of CRU, ERA5, CMFD grid precipitation data for the Tibetan Plateau from 1979 to 2017
Use of MODIS NDVI to evaluate changing latitudinal gradients of rangeland phenology in Sudano-Sahelian West Africa
[J].DOI:10.1016/j.rse.2011.08.001 URL [本文引用: 1]
The response of vegetation phenology and productivity to drought in semi-arid regions of Northern China
[J].
Spring phenological sensitivity to climate change in the northern hemisphere: Comprehensive evaluation and driving force analysis
[J].Plant phenology depends largely on temperature, but temperature alone cannot explain the Northern Hemisphere shifts in the start of the growing season (SOS). The spatio–temporal distribution of SOS sensitivity to climate variability has also changed in recent years. We applied the partial least squares regression (PLSR) method to construct a standardized SOS sensitivity evaluation index and analyzed the combined effects of air temperature (Tem), water balance (Wbi), radiation (Srad), and previous year’s phenology on SOS. The spatial and temporal distributions of SOS sensitivity to Northern Hemisphere climate change from 1982 to 2014 were analyzed using time windows of 33 and 15 years; the dominant biological and environmental drivers were also assessed. The results showed that the combined sensitivity of SOS to climate change (SCom) is most influenced by preseason temperature sensitivity. However, because of the asymmetric response of SOS to daytime/night temperature (Tmax/Tmin) and non-negligible moderating of Wbi and Srad on SOS, SCom was more effective in expressing the effect of climate change on SOS than any single climatic factor. Vegetation cover (or type) was the dominant factor influencing the spatial pattern of SOS sensitivity, followed by spring temperature (Tmin > Tmax), and the weakest was water balance. Forests had the highest SCom absolute values. A significant decrease in the sensitivity of some vegetation (22.2%) led to a decreasing trend in sensitivity in the Northern Hemisphere. Although temperature remains the main climatic factor driving temporal changes in SCom, the temperature effects were asymmetric between spring and winter (Tems/Temw). More moisture might mitigate the asymmetric response of SCom to spring/winter warming. Vegetation adaptation has a greater influence on the temporal variability of SOS sensitivity relative to each climatic factor (Tems, Temw, Wbi, Srad). More moisture might mitigate the asymmetric response of SCom to spring/winter warming. This study provides a basis for vegetation phenology sensitivity assessment and prediction.
Satellite observed delaying effects of increased winds on spring green-up dates
[J].
Accelerated rate of vegetation green-up related to warming at northern high latitudes
[J].DOI:10.1111/gcb.v26.11 URL [本文引用: 2]
Temperature and photoperiod drive spring phenology across all species in a temperate forest community
[J].
DOI:10.1111/nph.15232
PMID:29870050
[本文引用: 1]
Accurate predictions of spring plant phenology with climate change are critical for projections of growing seasons, plant communities and a number of ecosystem services, including carbon storage. Progress towards prediction, however, has been slow because the major cues known to drive phenology - temperature (including winter chilling and spring forcing) and photoperiod - generally covary in nature and may interact, making accurate predictions of plant responses to climate change complex and nonlinear. Alternatively, recent work suggests many species may be dominated by one cue, which would make predictions much simpler. Here, we manipulated all three cues across 28 woody species from two North American forests. All species responded to all cues examined. Chilling exerted a strong effect, especially on budburst (-15.8 d), with responses to forcing and photoperiod greatest for leafout (-19.1 and -11.2 d, respectively). Interactions between chilling and forcing suggest that each cue may compensate somewhat for the other. Cues varied across species, leading to staggered leafout within each community and supporting the idea that phenology is a critical aspect of species' temporal niches. Our results suggest that predicting the spring phenology of communities will be difficult, as all species we studied could have complex, nonlinear responses to future warming.© 2018 The Authors. New Phytologist © 2018 New Phytologist Trust.
Drylands in the earth system
[J].DOI:10.1126/science.1184946 PMID:20093461 [本文引用: 1]
Air temperature optima of vegetation productivity across global biomes
[J].
Changes in timing of seasonal peak photosynthetic activity in northern ecosystems
[J].
DOI:10.1111/gcb.14638
PMID:30943321
[本文引用: 1]
Seasonality in photosynthetic activity is a critical component of seasonal carbon, water, and energy cycles in the Earth system. This characteristic is a consequence of plant's adaptive evolutionary processes to a given set of environmental conditions. Changing climate in northern lands (>30°N) alters the state of climatic constraints on plant growth, and therefore, changes in the seasonality and carbon accumulation are anticipated. However, how photosynthetic seasonality evolved to its current state, and what role climatic constraints and their variability played in this process and ultimately in carbon cycle is still poorly understood due to its complexity. Here, we take the "laws of minimum" as a basis and introduce a new framework where the timing (day of year) of peak photosynthetic activity (DOY ) acts as a proxy for plant's adaptive state to climatic constraints on its growth. Our analyses confirm that spatial variations in DOY reflect spatial gradients in climatic constraints as well as seasonal maximum and total productivity. We find a widespread warming-induced advance in DOY (-1.66 ± 0.30 days/decade, p < 0.001) across northern lands, indicating a spatiotemporal dynamism of climatic constraints to plant growth. We show that the observed changes in DOY are associated with an increase in total gross primary productivity through enhanced carbon assimilation early in the growing season, which leads to an earlier phase shift in land-atmosphere carbon fluxes and an increase in their amplitude. Such changes are expected to continue in the future based on our analysis of earth system model projections. Our study provides a simplified, yet realistic framework based on first principles for the complex mechanisms by which various climatic factors constrain plant growth in northern ecosystems.© 2019 John Wiley & Sons Ltd.
Effect of rainfall pulses on plant growth and transpiration of two xerophytic shrubs in a revegetated desert area: Tengger Desert, China
[J].DOI:10.1016/j.catena.2015.09.020 URL [本文引用: 1]
Winter snow and spring temperature have differential effects on vegetation phenology and productivity across Arctic plant communities
[J].
DOI:10.1111/gcb.15505
PMID:33372357
[本文引用: 1]
Tundra dominates two-thirds of the unglaciated, terrestrial Arctic. Although this region has experienced rapid and widespread changes in vegetation phenology and productivity over the last several decades, the specific climatic drivers responsible for this change remain poorly understood. Here we quantified the effect of winter snowpack and early spring temperature conditions on growing season vegetation phenology (timing of the start, peak, and end of the growing season) and productivity of the dominant tundra vegetation communities of Arctic Alaska. We used daily remotely sensed normalized difference vegetation index (NDVI), and daily snowpack and temperature variables produced by SnowModel and MicroMet, coupled physically based snow and meteorological modeling tools, to (1) determine the most important snowpack and thermal controls on tundra vegetation phenology and productivity and (2) describe the direction of these relationships within each vegetation community. Our results show that soil temperature under the snowpack, snowmelt timing, and air temperature following snowmelt are the most important drivers of growing season timing and productivity among Arctic vegetation communities. Air temperature after snowmelt was the most important control on timing of season start and end, with warmer conditions contributing to earlier phenology in all vegetation communities. In contrast, the controls on the timing of peak season and productivity also included snowmelt timing and soil temperature under the snowpack, dictated in part by the snow insulating capacity. The results of this novel analysis suggest that while future warming effects on phenology may be consistent across communities of the tundra biome, warming may result in divergent, community-specific productivity responses if coupled with reduced snow insulating capacity lowers winter soil temperature and potential nutrient cycling in the soil.© 2020 John Wiley & Sons Ltd.
2000—2017年内蒙古荒漠草原植被物候变化及对净初级生产力的影响
[J].
DOI:10.18306/dlkxjz.2020.01.003
[本文引用: 1]
荒漠草原分布于干旱区和半干旱区,对气候变化的响应极为敏感,但目前学术界对于荒漠草原物候与生产力变化的研究仍较为薄弱。有鉴于此,论文采用2000—2017年MODIS NDVI数据和气象数据,利用通用数量化方法提取内蒙古荒漠草原植被的生长季始期(start of season, SOS)和生长季末期(end of season, EOS);基于Carnegie-Ames-Stanford Approach (CASA)模型估算了植被净初级生产力(NPP),并分析了植被物候和净初级生产力之间的关系。研究结果表明:① 2000—2017年内蒙古荒漠草原SOS呈显著提前趋势(0.88 d/a,PP>0.05),生长季长度(length of season, LOS)呈显著延长趋势(0.76 d/a)。81.53%像元的SOS与2—4月平均气温呈负相关(8.21%显著相关,PPPP2</sup>·a),有自东向西逐渐降低的区域差异;在研究时段内,春、夏季和生长季的NPP均呈不显著增加趋势,秋季NPP有不显著减少趋势;生长季降水量增加有利于生长季NPP的积累。③ 春季NPP与SOS呈不显著负相关,秋季NPP与EOS呈显著正相关。LOS的延长促进了NPP的累积,其中生长季NPP与EOS的推迟关系更为密切。研究结果揭示气候变化对内蒙古荒漠草原植被物候和生产力有显著影响,对区域生态系统管理和生态建设具有重要参考意义。
Phenological changes of desert steppe vegetation and its effect on net primary productivity in Inner Mongolia from 2000 to 2017
DOI:10.18306/dlkxjz.2020.01.003
[本文引用: 1]
<p id="C4">Desert steppe is distributed in the semiarid and arid areas and is extremely sensitive to climate change. However, limited field observations and lack of community surveys have resulted in insufficient research on the vegetation phenology and productivity of the desert steppe. Based on the normalized difference vegetation index (NDVI) data from the MODIS dataset during 2000-2017, we used a relative threshold method to extract the phenological parameters in the desert steppe of Inner Mongolia, including the start of growing season (SOS), the end of growing season (EOS), and the length of growing season (LOS). We then estimated the spatiotemporal changes in net primary productivity (NPP) of the desert steppe vegetation by the Carnegie-Ames-Stanford Approach (CASA) model. Finally, we analyzed the relationship between desert steppe productivity, phenophases, and climate variables. Our results show that: 1) during the study period, SOS advanced significantly at a rate of 0.88 d/a (<i>P</i><0.05), while EOS advanced at a rate of 0.13 d/a (non-significant). The average LOS lengthened significantly by 0.76 d/a (<i>P</i><0.05). The SOS was correlated negatively with mean temperature from February to April in 81.53% pixels (8.21% was significant) and negatively correlated with April precipitation in 60.80% pixels (6.12% was significant). The EOS showed a negative relationship with mean temperature in September in 65.16% pixels (5.03% was significant) but positively correlated with precipitation from July to September in 78.61% pixels (10.12% was significant). 2) The average annual NPP from 2000 to 2017 was 104.71gC/(m <sup>2</sup>·a) in the study area, showing regional differences with an obviously decreasing trend from east to west. Net primary productivity in spring, summer, and the growing season increased insignificantly, while NPP in autumn showed an insignificant decreasing trend. The increase of precipitation in the growing season is beneficial to the accumulation of ecosystem NPP. 3) Advance of SOS was conducive to the accumulation of spring NPP, and the delay of EOS promoted the accumulation of autumn NPP. There was a significant correlation between the LOS and NPP during the growing season (<i>P</i><0.05). This study revealed the impacts of climate change on vegetation phenology and productivity of the desert steppe in Inner Mongolia, which is significant for ecosystem management and ecological construction of the region. </p>
Large-scale variations in the vegetation growing season and annual cycle of atmospheric CO2 at high northern latitudes from 1950 to 2011
[J].
DOI:10.1111/gcb.12283
PMID:23749553
[本文引用: 1]
We combine satellite and ground observations during 1950-2011 to study the long-term links between multiple climate (air temperature and cryospheric dynamics) and vegetation (greenness and atmospheric CO(2) concentrations) indicators of the growing season of northern ecosystems (>45°N) and their connection with the carbon cycle. During the last three decades, the thermal potential growing season has lengthened by about 10.5 days (P < 0.01, 1982-2011), which is unprecedented in the context of the past 60 years. The overall lengthening has been stronger and more significant in Eurasia (12.6 days, P < 0.01) than North America (6.2 days, P > 0.05). The photosynthetic growing season has closely tracked the pace of warming and extension of the potential growing season in spring, but not in autumn when factors such as light and moisture limitation may constrain photosynthesis. The autumnal extension of the photosynthetic growing season since 1982 appears to be about half that of the thermal potential growing season, yielding a smaller lengthening of the photosynthetic growing season (6.7 days at the circumpolar scale, P < 0.01). Nevertheless, when integrated over the growing season, photosynthetic activity has closely followed the interannual variations and warming trend in cumulative growing season temperatures. This lengthening and intensification of the photosynthetic growing season, manifested principally over Eurasia rather than North America, is associated with a long-term increase (22.2% since 1972, P < 0.01) in the amplitude of the CO(2) annual cycle at northern latitudes. The springtime extension of the photosynthetic and potential growing seasons has apparently stimulated earlier and stronger net CO(2) uptake by northern ecosystems, while the autumnal extension is associated with an earlier net release of CO(2) to the atmosphere. These contrasting responses may be critical in determining the impact of continued warming on northern terrestrial ecosystems and the carbon cycle.© 2013 John Wiley & Sons Ltd.
Climate-phenology-hydrology interactions in northern high latitudes: Assessing the value of remote sensing data in catchment ecohydrological studies
[J].DOI:10.1016/j.scitotenv.2018.11.361 URL [本文引用: 1]
极端降水和极端干旱事件对草原生态系统的影响
[J].
DOI:10.3724/SP.J.1258.2014.00095
[本文引用: 1]
当前人类活动的加剧显著地影响着全球大气循环的格局。大气循环的多个模型均预测未来全球气候变化的显著特征是极端降水事件和极端干旱事件发生的频率会显著增加。水分是干旱、半干旱区草原植物生长发育的限制性资源, 而草原生态系统是陆地生态系统中对降水格局变化非常敏感的系统。但是, 关于极端降水事件和极端干旱事件对草原生态系统结构和功能的影响还是以分散的个案研究为主, 甚至关于极端气候事件的定义迄今也不尽相同。为此, 该文在分析极端气候事件定义及其研究方法的基础上, 总结了极端降水事件和极端干旱事件对草原生态系统土壤水分和养分状况、植物生长发育和生理特性、群落结构、生产力和碳循环过程的影响, 并提出了未来极端气候事件研究中应重点关注的5个重要方向, 以及控制试验研究的2个关键科学问题, 对开展全球变化背景下草原生态系统对极端气候事件响应机制的研究具有指导意义。
Effects of extreme rainfall and drought events on grassland ecosystems
DOI:10.3724/SP.J.1258.2014.00095
[本文引用: 1]
Global atmospheric circulations are greatly affected by anthropogenic activities. Several atmospheric circulation models predict that the frequencies of extreme rainfall events and extreme droughts will increase in the future. Water is one of the most limiting resources for growth and development of plants in arid and semi-arid ecosystems. Furthermore, grassland ecosystems have been proven to be very sensitive to changing precipitation regimes. However, our understanding on the effects of extreme climatic events on the structure and functioning of grassland ecosystems is inadequate. By far, the definitions of extreme climatic events are still inconsistent. Therefore, based on analyses of the definitions of extreme climatic events and research methods in literature, we synthesize the effects of extreme rainfall events and extreme droughts on soil water and nutrient availability, individual plant development and physiological characteristics, community structure, ecosystem productivity and carbon cycling. In addition, we put forward five scientific questions on research concerning the impacts of extreme climatic events and identify two key issues on manipulative precipitation experiments to help with understanding the mechanisms on how grassland ecosystems respond to extreme climatic events in the context of global change.
1982—2012年全球干旱区植被变化及驱动因子分析
[J].
Vegetation change and its driving factors in global drylands during the period of 1982-2012
Probabilistic assessment of remote sensing-based terrestrial vegetation vulnerability to drought stress of the Loess Plateau in China
[J].
Impacts of climate change on vegetation phenology and net primary productivity in arid Central Asia
[J].
Positive impacts of precipitation intensity on monthly CO2 fluxes in North America
[J].DOI:10.1016/j.gloplacha.2012.10.019 URL [本文引用: 1]
2001—2010年内蒙古植被覆盖度时空变化特征
[J].
Spatial differences of variations of vegetation coverage in Inner Mongolia during 2001-2010
DOI:10.11821/xb201209010
[本文引用: 1]
Global climate change has led to significant vegetation changes in the past half century. Inner Mongolia, most of which was located in arid and semi-arid areas, is undergoing a process of prominent warming and drying. It is necessary to investigate the response of vegetation to the climatic variations (temperature and precipitation) for a better understanding of the accumulated consequence of climate change. Vegetation coverage, which is an important indicator for evaluating terrestrial environment, is used to monitor vegetation change. MODIS-NDVI data and climate data were used to analyze the vegetation dynamics and its relationship with climate change on different spatial (forest, grassland and desert biome) and temporal (yearly and monthly) scales in Inner Mongolia during 2001-2010. It was found that vegetation coverage increased from west to east across Inner Mongolia with a change rate of 0.2/10°N. During 2001-2010, the mean vegetation coverage was 0.57, 0.4 and 0.16 in forest, grassland and desert biome, respectively, exhibiting evident spatial heterogeneities. There is a slight increase of vegetation coverage over the study period. Across Inner Mongolia, the vegetation coverages with extremely significant and significant increase accounted for 11.25% and 29.13% of the total study area, respectively, while those with extremely significant and significant decrease were 7.65% and 26.61%, respectively. The correlation analysis between vegetation coverage and climate shows that annual vegetation coverage was better correlated with precipitation, while the change of monthly vegetation coverage is consistent with both the changes of temperature and precipitation, indicating that the vegetation growth within a year is more sensitive to the joint function of hydrothermal combination rather than either climate factor. The vegetation coverage of forest biome was mainly affected by temperature on both yearly and monthly scales, while that of desert biome was mainly influenced by precipitation on the two temporal scales.
Interannual variations of monthly and seasonal normalized difference vegetation index (NDVI) in China from 1982 to 1999
[J].
东北植被生长峰值特征的变化及对气候和物候的响应
[J].
Spatiotemporal changes in vegetation growth peak and the response to climate and phenology over Northeast China
Variation in leaf flushing date influences autumnal senescence and next year's flushing date in two temperate tree species
[J].
DOI:10.1073/pnas.1321727111
PMID:24799708
[本文引用: 1]
Recent temperature increases have elicited strong phenological shifts in temperate tree species, with subsequent effects on photosynthesis. Here, we assess the impact of advanced leaf flushing in a winter warming experiment on the current year's senescence and next year's leaf flushing dates in two common tree species: Quercus robur L. and Fagus sylvatica L. Results suggest that earlier leaf flushing translated into earlier senescence, thereby partially offsetting the lengthening of the growing season. Moreover, saplings that were warmed in winter-spring 2009-2010 still exhibited earlier leaf flushing in 2011, even though the saplings had been exposed to similar ambient conditions for almost 1 y. Interestingly, for both species similar trends were found in mature trees using a long-term series of phenological records gathered from various locations in Europe. We hypothesize that this long-term legacy effect is related to an advancement of the endormancy phase (chilling phase) in response to the earlier autumnal senescence. Given the importance of phenology in plant and ecosystem functioning, and the prediction of more frequent extremely warm winters, our observations and postulated underlying mechanisms should be tested in other species.
