

陆地生态系统的水源涵养能力关系到生态文明建设、水安全、水灾害防治等国计民生重大问题。在生态学与水文学上,水源涵养能力分别指蓄水能力与产流量[1]。基于水源涵养基本概念,一般将黄河干流兰州以上、渭河(不包括泾河和北洛河)和伊洛河流域划定为黄河水源涵养区,区域面积与天然径流量分别占黄河流域的38.4%和84.1%,是黄河流域主要水量来源区。
伴随遥感技术的发展,遥感数据在植被动态研究中得到广泛应用[8],GIMMS NDVI 3g.v1、MODIS等包含植被相关指数与相关环境因子的长时序遥感数据已被广泛应用于植被动态研究[9⇓-11]。归一化植被指数(normalized difference vegetation index,NDVI)连续时间序列长、不同遥感产品的数据可用性好,是公认的反映植被生产力的良好指标[12],常被应用于研究区域植被变化及其与环境因子的相关性[3,12-13]。降水和气温被认为是影响植被动态的最重要的两个气候因子[14],全球范围内植被动态受气候变化控制的区域中主要的控制因子为降水、气温,如气温的升高促进了高纬度区域植被的生长[5],以二者为代表的气候条件影响植被变化的过程得到了广泛的关注[3,15]。此外,人类活动也是造成植被生长变化的驱动要素之一,人口的快速增长和社会经济的发展使得人类对生态环境的影响日益增加,已直接或间接导致植被覆盖的增长与减弱[16]。在中国不同区域,由于人类的影响也造成了植被覆盖不同程度的增长与减弱[17]。
对于植被变化趋势的分析,最典型的方法是线性分析,但该方法会受异常值与起始时间选取的影响[3];而非线性方法可以提供植被和气候因子趋势变化的可靠信息;植被覆被的面积变化[18]也属于植被趋势研究的一部分。相关分析是确定植被动态变化驱动因素的常用方法[19],对植被与各种环境因子进行相关分析已得到广泛应用[13],相关分析同时也被应用于研究气候变化对植被动态的时滞效应[15]。由于区域特征差异,不同区域NDVI与气候因子的相关性存在差异[20-21]。此外,分离自然与人类活动对植被变化贡献的方法有回归模型法、基于生物物理过程的模型方法、残差趋势法等,其中残差趋势法是定量分离气候变化和人类活动对植被变化影响常用且简便有效的方法[22]。
黄河水源涵养区覆盖范围广,气候条件、下垫面类型及人类活动程度差异较大且变化过程复杂[23],导致植被变化存在明显的区域分异性,响应机理模式多样。全球变化环境下黄河水源涵养区气温呈上升趋势、降水呈波动变化,同时极端气候事件频发,上游冰川面积持续减小[24],气候因子具有显著的季节性变化。研究植被与气候变化的关系时应考虑不同植被物候和生理差异所导致的植被变化对气候因子响应模式的不同。目前关于黄河水源涵养区植被变化及其响应机制的研究往往只针对某个流域或其中某一区域,结果无法反映黄河水源涵养区内的差异性,同时也少有针对涵养区不同季节植被变化响应差异的分析研究。此外,之前的研究未针对性地在整个黄河涵养区上分析植被受气候因素与人类活动影响的区域差异性。因此,本文的主要目的为:① 在黄河水源涵养区范围内针对性地进行植被动态变化的研究,确定涵养区不同时间尺度气候、植被与人类活动的变化特征;② 鉴于涵养区存在明显的区域分异性,定量解析气候变化和人类活动对于植被变化影响的贡献,辨识黄河水源涵养区植被变化的驱动力及区域差异性。
综上,本文在不同时空尺度采用线性回归方法、局部加权回归方法(locally weighted scatterplot smoothing,LOWESS)、t检验等方法分别对涵养区植被生长期(4—10月)及春季(3—5月)、夏季(6—8月)、秋季(9—11月)不同时间段内植被与气候因子趋势变化进行分析;采用Pearson相关、偏相关分析确定植被对气候的响应关系,利用残差趋势分析确定人类活动对植被变化的相对贡献。通过研究区域植被动态变化及其驱动因子,探究气候变化下生态系统内在演化机制[25],分析结果可揭示水源区植被动态变化的时空差异性,为水源涵养区生态建设与可持续发展提供重要参考。
1 研究数据与方法
1.1 研究区概况
通过水源涵养能力的定义划定的黄河水源涵养区如图1a所示。划定范围为黄河干流兰州以上、渭河(不包括泾河和北洛河)和伊洛河流域,该区域面积与天然径流量占黄河流域的38.4%和84.1%,是黄河流域主要水量来源区。
图1
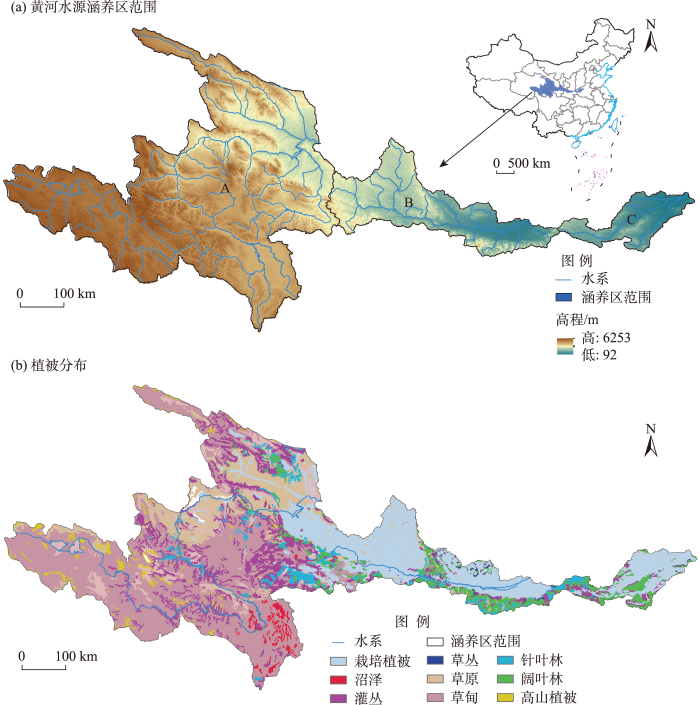
图1
黄河水源涵养区范围及植被分布
注:图a中中国地图基于自然资源部标准地图服务网站下载的审图号为GS(2020)4619号的标准地图制作,底图无修改;A、B、C分别表示黄河干流兰州段以上流域、渭河流域(不包括泾河、北洛河流域)、伊洛河流域范围。
Fig.1
Scope and vegetation distribution of the Yellow River water conservation zone
区域范围为95°55′~113°10′E、32°10′~38°20′N,东西狭长,地形分布大体为西部高原区与东部平原区。黄河水源涵养区主要分为3个部分:A区为黄河干流兰州以上,地貌类型为高原,覆盖青海省、甘肃省与四川省少部分范围,主要经过山脉为巴颜喀拉山东麓、祁连山脉东部末端、横断山脉北端,包括黄河源区域,A区北部为半干旱区,南部为半湿润区;B区属于渭河流域,地貌类型为平原,覆盖甘肃省与陕西省部分地区,区域西高东低,甘肃省境内有六盘山穿过,东部为关中盆地,B区为半湿润区,同时A、B区域大致为中国一二级阶梯分界线;C区为伊洛河流域,所处位置为平原,主要位于河南境内,为半湿润区。可见,A区为高原区,B、C为平原区,由西向东地势变平坦,气候逐渐变湿,降水量升高,并且由西部高原气候转变东部季风气候。平原区南缘为秦岭山区。后续研究将分别在整个区域及高原区(A)、平原区(B和C)展开。
1.2 数据来源与预处理
时间序列范围选取1982—2015年。NDVI数据来源于GIMMS NDVI 3g.v1数据集(the third generation Global Inventory Monitoring and Modeling System,
气候因子(降水和气温)数据来源于ERA5-Land数据(
涵养区植被类型分布数据来源于中国西部环境与生态科学数据中心的1∶1000000中国植被图集数据(
1.3 研究方法
1.3.1 NDVI与气候因子趋势分析
基于区域平均NDVI月际变化特征,划定区域植被生长期为4—10月。利用两种方法对NDVI与气候因子进行趋势分析。
(1) 利用普通最小二乘方法(OLS)[30]进行数据与时间序列的拟合,以残差平方和的最小化最优化回归曲线。分别对整体尺度、点尺度进行拟合,获得NDVI与气候因子的趋势变化。之后利用F检验来反映NDVI变化趋势的显著性。趋势以年为单位进行分析,因子变化趋势计算公式为:
式中:
F检验统计量[31]计算公式为:
式中:
LOWESS方法中局部加权计算的迭代次数设置为1,不设置回归间隔。LOWESS方法利用Python中statsmodels.lowess包完成计算。
1.3.2 NDVI与气候因子相关分析
式中
偏相关计算公式为:
t检验统计量计算公式为:
式中:
1.3.3 残差趋势分析
表1 植被NDVI变化驱动因素判定标准
Tab.1
| S | 驱动要素 | 划分标准 | |
|---|---|---|---|
| S | S | ||
| >0 | CC & HA | >0 | >0 |
| CC | >0 | <0 | |
| HA | <0 | >0 | |
| <0 | CC & HA | <0 | <0 |
| CC | <0 | >0 | |
| HA | >0 | <0 | |
注:S代表趋势,CC代表气候影响,HA代表人类活动影响。下同。
2 结果与分析
2.1 NDVI与气候因子的时空变化特征
对于黄河水源涵养区整个区域尺度上的NDVI与气候因子做趋势分析,结果如图2。不同时段NDVI与气候因子年变化趋势存在差异,根据线性趋势,植被生长期NDVI呈显著增长趋势,年增长速率为0.0009/a;温度也呈显著增长,增长趋势为0.041 ℃/a;降水呈减少趋势,速率为-1.004 mm/a。春夏秋三季NDVI均呈显著增长趋势,年增长速率分别为0.001/a、0.0006/a、0.001/a,增长速率最快季节为春季与秋季,夏季增长速率最低,由此可知,生长期NDVI的增长主要来源于春秋二季的NDVI增长。春夏秋三季温度也呈显著增长趋势,年增长速率分别为0.055 ℃/a、0.036 ℃/a、0.040 ℃/a,与NDVI在不同季节增长差异类似,生长期温度增长主要来自春秋两季增长;降水量在时间分配上存在差异,生长期春夏秋三季降水均呈减少趋势。
图2
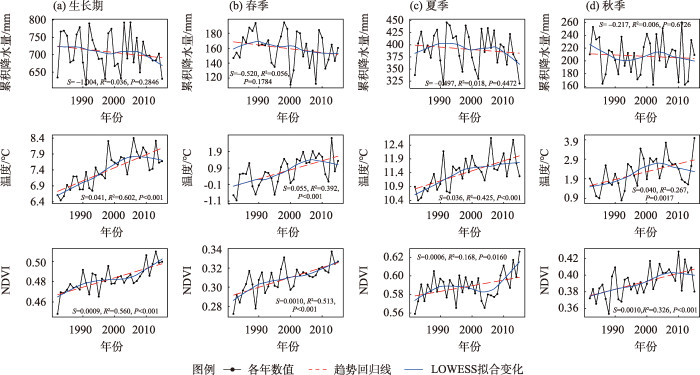
图2
黄河水源涵养区区域NDVI与气候因子变化趋势
Fig.2
Trend of variation of regional NDVI and climatic factors in the Yellow River water conservation zone
根据LOWESS局部趋势变化可知,涵养区NDVI趋势变化可较明显地划分为3个阶段:第一阶段为20世纪90年代中期前,NDVI呈增长趋势;第二阶段为90年代中期到2000年代中期,NDVI增长速率降低,增长极为缓慢;最后一个阶段为2000年代中期之后,NDVI增长加速,增长速率较第一阶段更快。生长期温度变化最明显时间发生在2005年前后,温度由增长变为停滞增长。生长期降水年际波动较大,无明显跳跃点,2005年之后降水减少速率变快。综合4个不同时段变化过程,NDVI与温度的变化阶段性较明显,而降水由于本身减少趋势不显著且其变化幅度较大,总体无显著阶段变化。
由于高原区与平原区存在显著地形差异,因此,本文针对不同宏观地形尺度(高原区与平原区)分别进行了NDVI与气候因子的趋势分析,结果如图3与图4。与整个区域趋势变化相比,高原区与平原区趋势变化存在显著差异:平原区NDVI增长速率(0.0016/a)高于高原区(0.0007/a),即涵养区NDVI主要由平原区贡献;由于气温空间变异性不大[21],总体上平原区气温增长速率(0.039 ℃/a)稍低于高原区气温变化(0.042 ℃/a);累积降水存在较大差异,平原区降水呈降低趋势(-4.848 mm/a),而高原区降水呈增加趋势(0.217 mm/a)。进一步分析得高原与平原NDVI的增长均主要源于春季与秋季NDVI的增长,对比不同季节NDVI的增长,高原区秋季NDVI增长更快,而平原区春季NDVI增长更快;平原区秋季温度增长速率在各个时段中速率是最低的(0.027 ℃/a);降水的主要差异体现在高原区降水季节差异更大,高原区降水春秋季呈多年降低趋势,而夏季呈增长趋势(0.264 mm/a),而平原区各时段均呈下降趋势。由于高原区占较高的面积比重,高原区趋势变化与整个涵养区对应的结果具有一定相似性。
图3
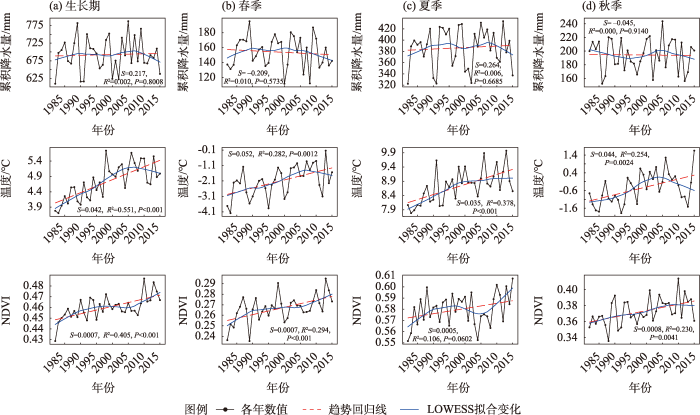
图3
高原区NDVI与气候因子变化趋势
Fig.3
Trend of variation of NDVI and climatic factors in the plateau region
图4
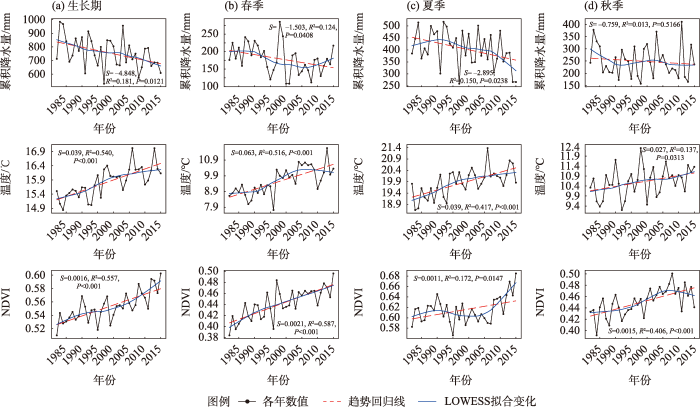
图4
平原区NDVI与气候因子变化趋势
Fig.4
Trend of variation of NDVI and climatic factors in the plain area
由图5可见,对于黄河水源涵养区空间NDVI趋势变化,生长期与春秋季空间分布具有相似性,春秋季NDVI呈增长趋势的面积分别占90.2%、89.4%,而夏季NDVI增长面积占70%,生长期NDVI的增长主要来自于春秋季,与之前所得结论一致。区域NDVI增长显著性的空间统计如表2,区域生长期NDVI显著增长区域占58.6%,增长区域占89.2%,区域总体呈增长趋势。生长期NDVI显著增长区域集中在渭河流域、伊洛河流域西部、高原区东北部,有少量NDVI趋势衰退区域散布在黄河源区域与渭河流域东部,NDVI衰退面积占10.8%,衰退原因除气候变化外,可能来自于过度放牧、城市化等人类活动[38-39]。NDVI衰退趋势主要发生在夏季高原区南部、关中盆地和伊洛河流域东部区域,其中在夏季以草甸为主的覆被区域呈明显大范围衰退趋势。
图5
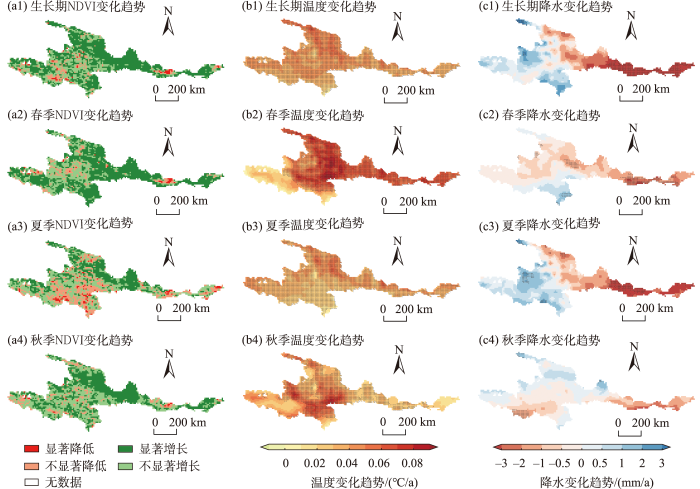
图5
黄河水源涵养区NDVI、气温、降水空间变化趋势分布
注:降雨与温度趋势变化空间分布图中,格点处“+”表示显著增长或降低。
Fig.5
Spatial trend distribution NDVI, temporature and precipitation of the Yellow River water conservation zone
表2 黄河水源涵养区区域NDVI空间趋势变化统计
Tab.2
| 时段 | 区域增长占比/% | 区域衰退占比/% | |||||
|---|---|---|---|---|---|---|---|
| 显著增长 | 弱增长 | 合计 | 显著衰退 | 弱衰退 | 合计 | ||
| 生长期 | 58.6 | 30.5 | 89.2 | 2.0 | 8.8 | 10.8 | |
| 春季 | 59.8 | 30.4 | 90.2 | 1.2 | 8.6 | 9.8 | |
| 夏季 | 30.9 | 39.1 | 70.0 | 3.9 | 26.0 | 30.0 | |
| 秋季 | 45.7 | 43.7 | 89.4 | 0.8 | 9.8 | 10.6 | |
降水空间趋势分布生长期与夏季类似,区域总体上东部为降低趋势,西部为增长趋势。生长期平原区,特别是关中盆地与伊洛河流域,降水呈显著降低趋势,平原区除生长期与夏季大部分地区呈显著降低趋势外,春季和秋季也呈降低趋势;而高原区除东北部为降低趋势外,大部分地区均呈湿润趋势,夏季少部分区域呈显著湿润趋势,而高原区春秋季降水趋势大部分地区为降低趋势,即高原区降水的增长主要来自于夏季降水,与之前趋势分析结果一致。对于温度空间趋势分布,生长期与夏季分布类似,显著特点为所有时段区域大部分地区呈显著增长趋势,整体上春秋季温度增长更快,与之前趋势分析结果一致;春秋季高原区西部与南部少数地区、秋季伊洛河流域大部分地区温度增长不显著。
2.2 NDVI对气候因子的响应
利用Pearson相关分析,得到区域NDVI对气候因子的相关关系(表3)与区域相关关系空间分布图(图6)。由表3可知,涵养区生长期、春夏季NDVI与温度呈显著相关,相应时段受温度控制,温度升高促进植被的生长[40];秋季受降水和温度同时控制,NDVI与降水呈负相关,这是由于降水减少进而导致云量等减少[3],增长了秋季植被的太阳日照长度,促进NDVI的升高。高原区与全区的相关关系类似,但其生长期、春季植被与降水呈正相关,春季的降水可以促进NDVI的升高。平原区NDVI在生长期与气温和降水均呈显著相关,温度和降水同时控制生长期植被的生长,春季NDVI与降水呈负相关,夏秋两季植被生长均与温度呈正相关,与降水呈负相关。
表3 黄河水源涵养区区域NDVI与气候因子Pearson相关关系
Tab.3
| 区域 | 相关系数 | 生长期 | 春季 | 夏季 | 秋季 |
|---|---|---|---|---|---|
| 涵养区 | -0.140 | 0.131 | -0.209 | -0.175 | |
| 0.608*** | 0.723*** | 0.350* | 0.288 | ||
| 高原区 | 0.046 | 0.215 | -0.187 | -0.147 | |
| 0.584*** | 0.695*** | 0.413* | 0.194 | ||
| 平原区 | -0.440** | -0.119 | -0.193 | -0.260 | |
| 0.552*** | 0.767*** | 0.058 | 0.262 |
注:
图6
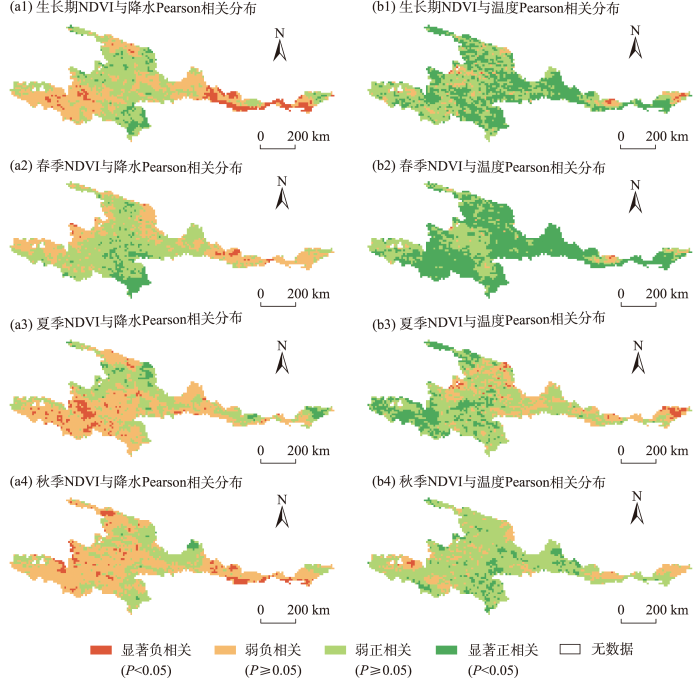
图6
黄河水源涵养区NDVI与气候因子Pearson相关空间分布
Fig.6
Pearson correlation spatial distribution of NDVI and climatic factors in the Yellow River water conservation zone
植被生长与气候因子的空间相关关系存在季节性差异。对于NDVI与降水的相关关系,由图6可知,生长期呈正相关范围占比50.4%(表4),主要分布在高原区东部与伊洛河流域东部;春季除关中平原、伊洛河流域呈负相关外,其他区域均呈正相关,正相关范围占比66.6%,其中高原区横断山脉北部呈显著正相关;夏秋季具有一定的相似性,大范围地区呈负相关,而高原区东北部与伊洛河东部区域呈正相关。对于NDVI与温度的相关关系,各季节基本以正相关为主,生长期正相关区域占比91.4%,显著正相关区域占比45.6%,显著正相关分布在高原区与渭河上游,只有平原少部分区域呈负相关;春季相关关系广泛呈正相关,正相关占比97.6%,其中显著正相关占比68.8%,显著正相关范围集中分布在高原区西南与东北部、渭河流域、伊洛河流域西部;夏季负相关关系是各时段中占比最多的季节,负相关占比26.2%,零散分布于高原区东北部与平原区;秋季相关关系同样以正相关为主,正相关区域占比83.1%。
表4 黄河水源涵养区空间Pearson相关统计
Tab.4
| 时段 | NDVI与降雨Pearson相关统计 | NDVI与温度Pearson相关统计 | |||||||||
|---|---|---|---|---|---|---|---|---|---|---|---|
| 正相关占比/% | 负相关占比/% | 正相关占比/% | 负相关占比/% | ||||||||
| P<0.05 | P≥0.05 | P<0.05 | P≥0.05 | P<0.05 | P≥0.05 | P<0.05 | P≥0.05 | ||||
| 生长期 | 5.7 | 44.7 | 8.5 | 41.1 | 45.6 | 45.8 | 0.8 | 7.8 | |||
| 春季 | 9.7 | 56.9 | 1.3 | 32.1 | 68.8 | 28.4 | 0.1 | 2.7 | |||
| 夏季 | 4.4 | 36.0 | 5.8 | 53.8 | 19.9 | 53.9 | 2.4 | 23.8 | |||
| 秋季 | 1.0 | 32.1 | 7.0 | 59.9 | 10.3 | 72.8 | 0.4 | 16.5 | |||
除在不同地形尺度、空间范围研究植被趋势变化与对气候的响应外,由于不同下垫面植被存在的物候与生理差异,不同的植被类型对气候变化的响应也存在差异[3,10,41]。本文也针对不同植被类型做了同样研究,结果如表5所示。研究区域以灌丛、草甸、草原、栽培植被分布最广。栽培植被NDVI计算特征与上述平原区计算结果具有一致性;由于相关计算方式的差异,春季NDVI与降水Pearson相关呈负相关,但由偏相关结果可得,实际春季降水对植被生长有促进作用,而夏季的持续升温不利于栽培植被的生长;栽培植被在4种植被类型中NDVI增长速率是最快的,生长期增长速率为0.00168/a。根据图1,除栽培植被外,其他3类植被主要分布在高原区,灌丛、草甸、草原主要分别分布在高原区东部、南部、北部,三者之间植被的动态也存在明显差异[20]。草原植被的NDVI增长趋势最大,生长期增长速率为0.00107/a;灌丛、草原、草甸植被生长期与春季植被生长受温度控制;对于草原植被,夏季降水促进植被生长,灌丛、草甸植被则与其相反。
表5 黄河水源涵养区不同植被类型植被变化差异
Tab.5
| 植被类型 | 时段 | NDVI趋势 /(/a) | Pearson相关 | 偏相关 | ||||
|---|---|---|---|---|---|---|---|---|
| 灌丛 | 生长期 | 0.00074*** | -0.15 | 0.55*** | -0.12 | 0.55*** | ||
| 春季 | 0.00108*** | 0.26 | 0.66*** | 0.14 | 0.64*** | |||
| 夏季 | 0.00021 | -0.28 | 0.21 | -0.24 | 0.15 | |||
| 秋季 | 0.00083* | -0.26 | 0.31 | -0.22 | 0.28 | |||
| 草甸 | 生长期 | 0.00051** | 0.03 | 0.55*** | -0.13 | 0.56*** | ||
| 春季 | 0.00066** | 0.27 | 0.68*** | -0.07 | 0.65*** | |||
| 夏季 | 0.00027 | -0.28 | 0.48** | -0.40* | 0.54** | |||
| 秋季 | 0.00058* | -0.14 | 0.16 | -0.15 | 0.17 | |||
| 栽培植被 | 生长期 | 0.00168*** | -0.34* | 0.52** | -0.08 | 0.43* | ||
| 春季 | 0.00166*** | -0.09 | 0.73*** | 0.18 | 0.74*** | |||
| 夏季 | 0.00138** | -0.20 | 0.09 | -0.18 | -0.01 | |||
| 秋季 | 0.00172*** | -0.13 | 0.29 | -0.04 | 0.27 | |||
| 草原 | 生长期 | 0.00107*** | 0.16 | 0.43* | 0.20 | 0.45** | ||
| 春季 | 0.00057*** | 0.05 | 0.60*** | 0.04 | 0.60*** | |||
| 夏季 | 0.00105*** | 0.13 | 0.13 | 0.19 | 0.19 | |||
| 秋季 | 0.00116*** | -0.04 | 0.21 | -0.02 | 0.21 | |||
利用LOWESS以15年滑动窗口拟合植被生长与气候因子的相关多年变化,得到结果如图7,可见植被生长与气候因子的相关性随时间存在阶段性变化。对于生长期偏相关变化过程,NDVI与温度多年呈正相关,在2000年左右NDVI与降水相关性由负相关变为正相关,之后几年又转变为负相关,与图2中NDVI趋势变化在该阶段变缓相对应;春季偏相关图(图7b)显示NDVI与气温一直呈显著相关,而NDVI与降水偏相关关系在1996年左右由负相关变为正相关,而在该阶段与图2中NDVI增长变缓对应;夏季NDVI与温度、降水分别呈正相关与负相关,且随时间相关性逐渐增强;秋季NDVI在2004年左右与温度、降水的相关性均由正相关转变为负相关,对应的NDVI、温度、降水变化趋势也在该时段发生转变。综上,黄河水源涵养区在各不同时间段内NDVI与降水、气温的相关性存在阶段性差异,同时NDVI、降水和气温在对应的时间也表现出相应的趋势变化。平原区与高原区NDVI对气候因子的偏相关变化经过验证也存在明显差异。
图7
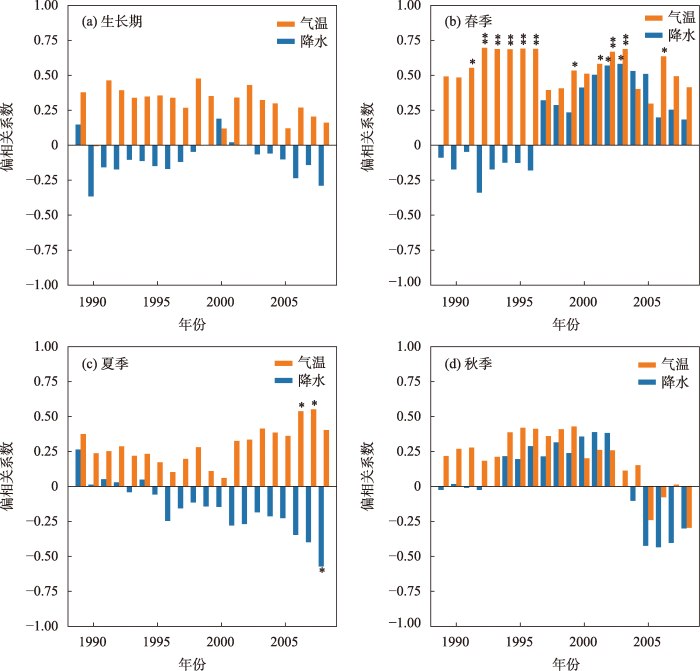
图7
黄河水源涵养区区域偏相关变化过程
注:图中**、*分别表示P<0.01、P<0.05。
Fig.7
Partial correlation trend of the whole Yellow River water conservation zone
2.3 NDVI变化的驱动因素
图8
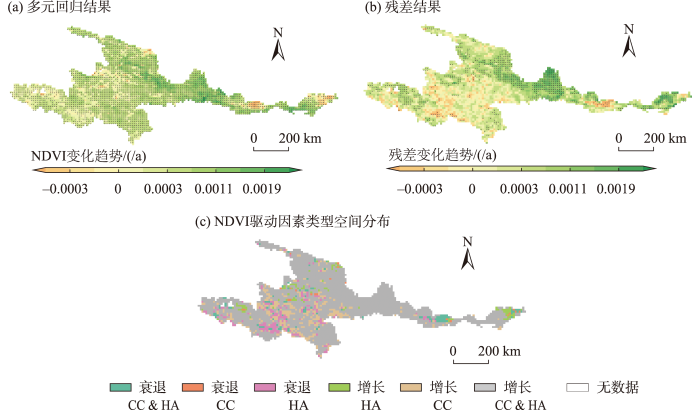
表6 NDVI变化驱动力分类
Tab.6
| 变化趋势 | 驱动类型 | 占比/% |
|---|---|---|
| 增长 | CC & HA | 74.30 |
| CC | 11.48 | |
| HA | 3.38 | |
| 降低 | CC & HA | 3.84 |
| CC | 0.77 | |
| HA | 6.23 |
将多元回归结果作为气候变化的影响,由图8a可得,受气候变化影响下的NDVI在整个区域基本呈显著增长趋势,增长最快区域分布在高原区东北部与渭河流域上游,但也存在气候对NDVI为减弱趋势影响的区域,主要分布在关中平原及伊洛河流域东部。残差趋势结果代表人类活动影响,其中人类活动对NDVI有显著影响的区域面积占比28.28%,人类活动呈显著积极作用区域分布在高原区东北部与西部、横断山脉北端、渭河上游区、伊洛河西部,以上区域也是NDVI增长速度最快地区;人类活动对植被生长呈消极作用区域分布在高原区中部、渭河流域东部、伊洛河流域东部,其中渭河流域东部NDVI呈显著降低趋势。
图8c显示了NDVI变化驱动力的空间分布。由图可知大部分地区为人类活动、气候共同作用下NDVI增长型,区域面积占比74.29%,与回归结果、残差结果对应一致,高原区东北部、渭河上游、伊洛河流域西部全范围内为气候和人类活动共同作用下增长型;由单一气候或人类活动作用下NDVI增长区域分别分布在高原区中部(区域植被以灌丛、草甸为主)、伊洛河流域东部(区域植被以栽培植被为主);区域内NDVI总体呈增长趋势的面积占比89.16%,呈降低趋势的面积占比10.84%;人类气候共同作用、单一气候作用、单一人类活动作用造成NDVI减小的区域面积占比分别为3.84%、0.77%、6.23%,可知NDVI降低区域中由单一人类活动影响的面积占比最大;单一人类活动导致NDVI降低的区域主要散布在高原区中部与西南部;由单一气候作用导致的NDVI降低只存在于极个别区域,而由人类活动和气候同时作用导致的NDVI降低区域分布在关中盆地东部、伊洛河流域东部少量区域与高原少数区域。
3 讨论
植被生长趋势及其对气候因子的响应关系在不同的时空尺度存在差异。黄河水源涵养区位于半干旱、半湿润地区,东西气候、地形条件存在差异性,进而导致以高原区、平原区划分的NDVI趋势变化与响应关系存在差异[42]。由于地形、气候、植被覆盖的差异,根据相关分析结果,高原区生长期显著受温度的控制,说明高原区温暖的环境可以促进植被的生长[40];而平原区生长期同时受温度、降水的显著影响,温暖的环境易促进耕作植被的生长,而降水的减少也利于耕作植被的生长,可能是由于夏秋季降水的减少可促进光照时间的增加[3],进而促进了植被的生长,同样的结论可在高原区夏秋季节植被与降水的负相关中体现,但高原区大部分区域春季NDVI与降水呈正相关,可能是因为高原区域春季本身雨水较少,光照较为充足,降水的增加有利于植被的生长。夏秋两季植被与降水均呈负相关,除降水的减少带来的云量减少、日照增多外,He等[20]指出,在部分地区降水减少条件下植被会通过调节气孔大小和数量限制水分蒸散,由此导致CO2浓度升高、光合作用增加,促进植被生长。同时进一步可由图6得到,NDVI与降水呈显著负相关区域主要集中在平原区,其原因还可能是耕作植被受人类影响,即使在降水减少条件下也可通过农业技术措施来进行作物生长环境的改善[43]。
涵养区的植被变化受人类活动和气候的共同作用整体呈增长趋势,与Liu等[46]对黄河流域植被动态研究结果一致,该类驱动面积占比74.29%,分布在高原区草地、渭河流域西部、伊洛河流域西部,其原因主要是由于人类退耕还林还草生态工程、植树造林等措施[47-48]与气候因素共同促进了植被的生长[49]。而高原区中部同时出现由于人类活动引起的NDVI增长与降低趋势,说明人类在该范围同时存在保护与过度放牧等行为[50],但图8b显示人类活动并不显著,因此不会产生特别严重的影响。由气候单独造成的NDVI降低趋势基本不存在,说明研究区域气候变化整体为促进植被生长[51]。城市化会使NDVI呈降低趋势[39],主要体现在关中平原东部受人类活动影响NDVI呈显著降低趋势。
4 结论
(1) 黄河水源涵养区1982—2015年NDVI呈显著增长趋势,生长期增长速率为0.0009/a,主要来自于春秋季NDVI的增长。以不同地形划分的高原区与平原区NDVI与气候因子多年变化趋势存在差异:二者气温增长变化差异不大,但平原区NDVI增速明显大于高原区NDVI增速,是由于地形差异[42]伴随气候、植被类型等原因造成的。
(2) 黄河水源涵养区植被生长期NDVI与降水呈负相关、与温度呈正相关,是地区降水阶段变化、气温条件引起的植被生理胁迫等因素导致的结果,同时区域气温呈显著增长趋势,NDVI变化主要受温度控制。由于不同植被生理状态的差异,不同植被类型的NDVI变化趋势与对气候因子的响应存在差异,各主要植被NDVI增长趋势由高到低分别为栽培植被>草原>灌丛>草甸。
(3) 由于不同年份的冷暖干湿差异,不同植被对降水、气温的相关性也存在差异[44],涵养区NDVI呈3个变化阶段:第一阶段在20世纪90年代中期之前,NDVI与温度、降水分别呈正、负相关,该阶段NDVI显著增长;第二阶段为90年代中期到2000年代中期,NDVI与温度呈正相关,与降水负相关性减弱,且之后往正相关发展,该阶段NDVI增长减缓,并呈缓速停滞增长;第三阶段为2000年代中期之后,NDVI与温度、降水回到之前的正、负相关性,NDVI呈显著增长趋势。该结果证明NDVI动态呈阶段性变化。
(4) 黄河水源涵养区植被变化同时受气候、人类活动影响,不同驱动类型面积占比由高到低分别为共同促进>气候促进>人为抑制>共同抑制>人为促进>气候抑制。黄河水源涵养区NDVI的增长主要受气候、人类活动的共同影响和单一人类活动的影响,两种影响的范围集中分布在高原区东北部、渭河流域西部、伊洛河流域西部,该部分区域也是人类活动造成NDVI显著上升的区域,说明人类退耕还林、植树造林等生态工程对植被增长起到了积极作用。人类活动造成NDVI显著降低的区域分布在高原区西南部、关中平原东部,说明人类一些放牧、开垦、城市化等活动在这些区域对植被造成了破坏。
参考文献
水源涵养功能概念的生态和水文视角辨析
[J].
DOI:10.11821/dlxb202301009
[本文引用: 2]

水源涵养是评价陆地生态系统服务功能的重要指标,然而学界对水源涵养功能概念和计算方法仍存在诸多争论。这一方面说明水源涵养功能评估具有重要的现实意义,同时也说明其概念的复杂性和模糊性,亟需从生态学和水文学的基本理论出发,厘清水源涵养功能概念的内涵和评估方法,促进科学决策和有效管理。研究水源涵养功能时,生态学家更关注陆地生态系统的蓄水能力(S<sub>max</sub>),而水文学家更关注流域的产流量(Q),两者均具有合理性,但各有侧重,若不分别辨析,极易造成概念混淆。理论和数据分析表明,蓄水能力和产流量虽然联系紧密,但概念完全不同。陆地生态系统的S<sub>max</sub>决定了流域对降水的分配:即蒸散发(绿水)和Q(蓝水),S<sub>max</sub>和Q在降水量一定的情况下往往存在此消彼长的关系。研究发现生态系统的根区蓄水能力(S<sub>R</sub><sub>max</sub>)是联系绿水和蓝水的核心要素,是水源涵养功能评估的关键变量。大尺度根区蓄水能力主要由气候决定,可借鉴工程水文中设计水库的累积曲线法,根据生态系统用水的生存策略通过气候反演。最后,本文提出3点建议:① 在实践中分别评估生态系统的绿水和蓝水涵养功能;② 进一步全面考虑冰川积雪、地下水等多要素的水源涵养功能;③ 协同耦合自然和人工水源涵养功能,提高水资源在生态和经济社会系统中的高效优化利用。
Ecological and hydrological perspectives of the water retention concept
DOI:10.11821/dlxb202301009
[本文引用: 2]
Water retention plays a critical role in terrestrial ecosystem service. However, regarding its definition and calculation, there is a long debate in academia, which illustrates its importance in practice, and simultaneously demonstrates the complexity and vagueness of this essential concept. Thus, there is an urgent need to clarify its definition and calculation method based on basic ecological and hydrological theories, and eventually promote science-based decision-making and integrated water management. Interestingly, we observed that for the same term of "water retention function", ecologists intended to concern the terrestrial ecosystem's water storage capacity (Smax), while hydrologists concerned more about the water yield from the catchment (Q). Both perspectives have their own rationality, but with totally different vision and emphasis. By theorical discussion and data analysis, we found that water storage capacity (Smax) and water yield (Q) indeed have strong connection, but they are definitely two different concepts. The Smax of terrestrial ecosystem determined the separation of precipitation into either evaporation (green water) and Q (blue water). The size of Smax in most cases trades off with the amount of Q. We further revealed that the root zone storage capacity (SRmax) of ecosystem is at the heart of water retention function assessment, and plays a key role linking blue and green water. The SRmax is the result of ecosystem's adaption to its climate, and can be derived by the classic method to design reservoir, i.e. the Mass Curve Technique (MCT). Lastly, we gave three recommendations: (1) simultaneously evaluating green water retention capacity and blue water yield in practice; (2) further investigating the water retention functions of more water bodies, e.g. glacier, snow cover, and groundwater; (3) synergizing natural and artificial water retention capacities to enhance the water use efficiency in both the ecosystem and our economic-social system.
Water scarcity in the Yellow River Basin under future climate change and human activities
[J].
NDVI-based vegetation dynamics and its response to climate changes at Amur-Heilongjiang River Basin from 1982 to 2015
[J].DOI:10.1016/j.scitotenv.2018.09.115 URL [本文引用: 11]
水源涵养与水文调节: 和而不同的陆地生态系统水文服务
[J].
Water retention and hydrological regulation: Harmony but not the same in terrestrial hydrological ecosystem services
Climate‐driven vegetation greening further reduces water availability in drylands
[J].DOI:10.1111/gcb.v29.6 URL [本文引用: 2]
Earth's energy imbalance and implications
[J].
Recent global decline of CO2 fertilization effects on vegetation photosynthesis
[J].
DOI:10.1126/science.abb7772
URL
[本文引用: 1]
\n One source of uncertainty in climate science is how the carbon fertilization effect (CFE) will contribute to mitigation of anthropogenic climate change. Wang\n et al.\n explored the temporal dynamics of CFE on vegetation photosynthesis at the global scale. There has been a decline over recent decades in the contribution of CFE to vegetation photosynthesis, perhaps owing to the limiting effects of plant nutrients such as nitrogen and phosphorus. This declining trend has not been adequately accounted for in carbon cycle models. CFE thus has limitations for long-term mitigation of climate change, and future warming might currently be underestimated.\n
Evolution of NDVI secular trends and responses to climate change: A perspective from nonlinearity and nonstationarity characteristics
[J].
1982—2006年欧亚大陆植被生长季开始时间遥感监测分析
[J].
Assessment and intercomparison of satellite-derived start-of-season (SOS) measures in Eurasia for 1982-2006
DOI:10.11820/dlkxjz.2012.11.003
[本文引用: 1]
Vegetation phenology is one of the most direct and sensitive indicators of seasonal and interanual variations of environmental conditions. Phenological changes reflect quick change of terrestrial ecosystems in response to climate change. Satellite remote-sensing techniques capture canopy reflectance and can be used for studies of vegetation phenology. In this study, satellite-derived Start of Season (SOS) dates are obtained from the GIMMS AVHRR NDVI dataset by different methods such as Dynamic Threshold method, Delayed Moving Average methods, Double Logistic analysis and Savitzky-Golay method. The derived SOS data are compared and analyzed for the ecoregions from China to Russia, and the Dynamic Threshold method is decided to be most suitable for Eurasia scale. Based on the analysis of the changes of vegetation phenology and the response of phenology to climate change from 1982 to 2006, it is concluded that the Dynamic Threshold method has high retrieval rate for the SOS dates in Eurasia, and the data show a stable trend along the latitudinal gradient. The retrieved SOS dates for boreal forests and tundra ecosystems are most stable in the long term, while in the vegetation areas of low latitudes the dates show higher variability. It is found that from 1982 to 2006, there is a trend of SOS dates becoming earlier for the majority of vegetation types, and the forest coverage areas show even stronger trend of SOS dates becoming earlier, with a change rate of 11.45-15.61 days/25 years, due to global warming. With the exception of the closed to open (>15%) shrubland (<5 m), for most other types of vegetation, there is a negative correlation between vegetation phenology and the average temperature of the month. In other words, for each one degree increase, there is 1.32-3.47 days decrease to SOS date in spring, which is consistent with global warming in recent years.
青藏高原植被NDVI对气候因子响应的格兰杰效应分析
[J].
DOI:10.18306/dlkxjz.2019.05.009
[本文引用: 2]
多变的气候和复杂的地理环境使得青藏高原植被对气候变化响应敏感,因此分析高原植被与气候因子之间的动态关系对气候变化研究和生态系统管理具有重要意义。论文基于1982—2012年青藏高原气象数据(气温、降水)以及GIMMS NDVI3g遥感数据,在像素级别上运用格兰杰因果关系检验方法,在月尺度和季节尺度上分析了高原植被NDVI(主要是草原)与平均气温、降水量之间的响应情况及因果关系。研究表明:① 月尺度上NDVI与平均气温之间、NDVI与降水量之间的时序平稳性比例高于季节尺度,月尺度下达到平稳性的植被区域分别占99.13%和98.68%,季节尺度下分别占64.01%和71.97%;② 月尺度下高原平均气温和降水量对NDVI影响的滞后期都集中在第12~13个月,荒漠草原、典型草原和草甸3种植被类型的滞后期一致,季节尺度下平均气温和降水量对NDVI影响的滞后期主要分布在第3~4和第6个季度,3种植被类型的滞后期差异性较大;③ 月尺度下,青藏高原约98.95%的植被覆被区的平均气温是引起NDVI变化的格兰杰原因,反之,大部分地区(约89.05%,除高原东南区域)内NDVI也是引起平均气温变化的格兰杰原因;季节尺度下,青藏高原中部以外植被区域(约92.03%)内的平均气温是引起NDVI变化的格兰杰原因,而在东部和西部部分地区(约50.55%)中NDVI也是引起平均气温变化的格兰杰原因;④ 月尺度下,高原东北和西北地区(约72.05%)内的降水量是引起NDVI变化的格兰杰原因,大部分地区(约94.86%,除东南部少量区域)中NDVI是引起降水量变化的格兰杰原因;季节尺度下,高原东南部(约61.43%)地区内的降水量是引起NDVI变化的格兰杰原因,高原中东部地区(约48.98%)中NDVI是引起降水量变化的格兰杰原因。总之,高原植被NDVI与气温、降水的相互作用显著,彼此均可构成格兰杰因果效应,但总体上气候因子的影响程度大于植被的反馈作用,月尺度的效应区域大于季节尺度的效应区域。
Detecting Granger effect of vegetation response to climatic factors on the Tibetan Plateau
DOI:10.18306/dlkxjz.2019.05.009
[本文引用: 2]
Due to the complex plateau climate and unique geographical environment, the vegetation responds strongly to climatic shifts on the Tibetan Plateau. Therefore, it is of great significance to discuss the causality between vegetation and climate changes. Using the meteorological dataset including average temperature and precipitation and the GIMMS (Global Inventory Modeling and Mapping Studies) NDVI3g remote sensing data from 1982 to 2012 to analyze the causal relationship between NDVI and its influencing factors at the monthly and seasonal scales by the Granger causality test on the pixel level, this study examined the response of plateau vegetation (mainly grassland) to average temperature and precipitation change and causality. The results show that: 1) The stationarity proportion of vegetation NDVI and average temperature (99.13%), NDVI and precipitation (98.68%) at the monthly scale was higher than at the seasonal scale (64.01% and 71.97% respectively). 2) Lagging effects of average temperature on NDVI and precipitation on NDVI were around 12-13 months at the monthly scale and mainly 3, 4, and 6 quarters at the seasonal scale on the Tibetan Plateau. The three vegetation types—desert steppe, typical steppe, and meadow steppe—showed high similarities at the monthly scale, while greater heterogeneity was observed at the seasonal scale. 3) For 98.95% of the area covered by vegetation on the Tibetan Plateau, it is believed that average temperature change was the Granger cause of NDVI change, while for 89.05% of the region (except for the southeast), NDVI change was supposed to be the Granger cause of average temperature change at the monthly scale. At the seasonal scale, average temperature change was considered the Granger cause of NDVI change in 92.03% of the regsion (except for the central part of the Tibetan Plateau). Nevertheless, in the eastern and western parts of the plateau (about 50.55% of the region), NDVI change was interpreted as the Granger cause of average temperature change. 4) In the northeast and northwest of the region (about 98.95% of the area) precipitation change was believed to be the Granger cause of NDVI change, while in 94.86% of the region (except for a few areas in the southeast) NDVI change was supposed to be the Granger cause of precipitation change at the monthly scale. At the seasonal scale, precipitation change was considered the Granger cause of NDVI change in the southeastern part of the plateau (61.43% of the area). Nevertheless, in the central and eastern parts of the region (about 48.98% of the area), NDVI change was interpreted as the Granger cause of precipitation change. Overall, climatic factors on the Tibetan Plateau have an interactive relationship with vegetation and each can cause a Grainger effect to the other, with climatic factors having stronger Grainger effect on vegetation than the other way round. The Granger effect region on the Tibetan Plateau at the monthly scale is larger than the Granger effect region at the seasonal scale.
气候变化和生态建设对秦岭—淮河南北植被动态的影响
[J].
DOI:10.18306/dlkxjz.2021.06.012
[本文引用: 1]
论文基于2000—2019年秦岭—淮河南北MODIS-NDVI植被覆盖数据,对中国南北过渡带植被时空变化进行分析,并探讨植被动态变化驱动因素。结果表明:① 在趋势变化上,2000—2019年秦岭—淮河南北植被显著恢复。其中,秦巴山区植被恢复面积占比最高,其次是巫山山区和关中平原;植被退化区面积占比仅为6.4%,主要分布于长三角城市群。② 在气候因素上,NDVI变化与气温显著相关(P<0.05)面积占比为9.1%,低于降水(13.1%)和日照时数(14.5%)显著区域,无显著相关区域分布面积最广,说明在关键生长季(5—9月),区域水热条件较好,植被年际波动受气候变化影响区域较少。③ 在驱动因素上,受气候因素和生态建设驱动绿化占比分别为19.2%和30.0%,其中,生态建设驱动绿化区与秦巴山区、大别山生态修复工程,川东、长江中下游撂荒地空间格局一致,说明耕地转为生态用地是区域植被快速恢复的主要原因。研究结果对量化湿润—半湿润地区植被驱动因素,优化生态建设评估模型具有启示意义。
Coupling effects of climate change and ecological restoration on vegetation dynamics in the Qinling-Huaihe region
DOI:10.18306/dlkxjz.2021.06.012
[本文引用: 1]
Using the Terra Moderate Resolution Imaging Spectroradiometer (MODIS) Normalized Difference Vegetation Index (NDVI) data (MOD13Q1) and land cover data, and the observed daily temperature, precipitation, and sunlight hours data obtained from 196 meteorological stations in the north and south of the Qinling-Huaihe region, this study explored the spatiotemporal characteristics of the vegetation dynamics in the region. It also analyzed the effects of the driving forces of climate change and human activities (such as urbanization and ecological restoration programs) on vegetation restoration and degradation between 2000 and 2019. As China's north-south transitional zone, the Qinling-Huaihe region has experienced overall greening (54.6% significant NDVI increase at P<0.05) and partial degradation (6.4% significant NDVI decrease at P< 0.05) from 2000 to 2019. The area of vegetation restoration was mainly in the Qinling-Daba Mountains, which are characterized by multi-dimensional zonal structures and biological diversity; and the percentage of NDVI increase was 96.7%. The other areas of restoration were the Qinba Mountains, Wushan Mountains and the Guanzhong Plain, which are all key implementation areas of ecological restoration programs. In terms of vegetation degradation, there was an NDVI decrease of 6.4%, which was mainly concentrated in the Yangtze River Delta urban agglomeration and sporadically spread across other rapid urbanization areas. With regard to the impacts of climatic factors on vegetation dynamics, the areas of NDVI change affected by temperature only accounted for 9.1% of the total area of the region, which is lower than the areas affected by precipitation (13.1%) and sunlight (14.5%). It indicates that the areas with significant (P<0.05) correlation between climatic factors and NDVI are limited. The reason is that there are the good hydrothermal conditions and irrigation facilities in the study region, climatic factors are not the primary limiting factors of vegetation growth. With regard to the driving forces of vegetation change, among the areas of significant greening (54.6%), 19.2% and 30.0% were identified to be related to climate change and ecological restoration programs, respectively. Ecological engineering had an influence on the vegetation dynamics of the Qinling-Huaihe region. The spatial pattern of significant restoration was consistent with the ecological restoration programs, such as the Qinling-Daba Mountains ecological protection and restoration and the Dabie Mountains ecological restoration programs. These findings enrich our understanding of the relationship between vegetation expansion, climate change, and human activities in the subtropical and warm-temperate zones of China.
Temporal responses of NDVI to precipitation and temperature in the central Great Plains, USA
[J].DOI:10.1080/01431160210154812 URL [本文引用: 2]
Spatio-temporal distribution of NDVI and its influencing factors in China
[J].
Dynamic response of satellite-derived vegetation growth to climate change in the three north shelter forest region in China
[J].DOI:10.3390/rs70809998 URL [本文引用: 1]
Interannual variations of monthly and seasonal Normalized Difference Vegetation Index (NDVI) in China from 1982 to 1999
[J].
Spatial and temporal patterns of global NDVI trends: Correlations with climate and human factors
[J].DOI:10.3390/rs71013233 URL [本文引用: 1]
Ecological engineering projects increased vegetation cover, production, and biomass in semiarid and subhumid Northern China
[J].DOI:10.1002/ldr.v30.13 URL [本文引用: 1]
Rapid shifts in plant distribution with recent climate change
[J].
DOI:10.1073/pnas.0802891105
PMID:18697941
[本文引用: 1]
A change in climate would be expected to shift plant distribution as species expand in newly favorable areas and decline in increasingly hostile locations. We compared surveys of plant cover that were made in 1977 and 2006-2007 along a 2,314-m elevation gradient in Southern California's Santa Rosa Mountains. Southern California's climate warmed at the surface, the precipitation variability increased, and the amount of snow decreased during the 30-year period preceding the second survey. We found that the average elevation of the dominant plant species rose by approximately 65 m between the surveys. This shift cannot be attributed to changes in air pollution or fire frequency and appears to be a consequence of changes in regional climate.
东北地区植被时空演变及影响因素分析
[J].
Spatiotemporal evolution and influencing factors of vegetation in Northeast China
Relationships between net primary productivity and forest stand age in US forests
[J].
气候和人为因素对植被变化影响的评价方法综述
[J].
DOI:10.7522/j.issn.1000-694X.2019.00004
[本文引用: 3]
系统评价气候变化和人为因素引起的植被退化,对有效开展生态工程建设、实现生态环境的可持续发展具有重要意义。目前绝大多研究主要分析气候因素对植被变化的影响,分析气候因素和人类活动对植被变化的双重影响少有研究。本文主要介绍这一双重影响对植被变化的贡献程度的主要研究方法——定性-半定量法、回归分析法、残差趋势法、基于净第一生产力的评价方法。综述分析了气候和人为因素对植被变化驱动的主要结论,总结目前各研究方法存在的问题,提出了未来需要重点加强气候和人为因素对植被变化驱动因素的分解研究,加强模型评价和不确定性量化研究等。
Recent advances in driving mechanisms of climate and anthropogenic factors on vegetation change
DOI:10.7522/j.issn.1000-694X.2019.00004
[本文引用: 3]
Understanding how the dynamics of vegetation growth respond to climate change and human activities at different temporal and spatial scales is critical to project future ecosystem dynamics. At present, most of the studies mainly analyze the influence of climate change on vegetation, but there are few studies on the dual effects of climate change and human activities on vegetation. We systematically reviewed the methods of how to identify contributions of climate change and human activities on vegetation at quantitative aspects, including the qualitative and semi-quantitative assessment, regression analysis, residual trend method, and the first Net Primary Production based evaluation method. By summarizing and analyzing the progresses of previous researches on quantitative evaluation of the contributions and the existing problems, we found that it would be necessary to strengthen the study of disassembling the driving mechanisms of climate change and human activities on vegetation, as well as model evaluation and uncertainty analysis in the future.
近50 a中国西南地区地表干湿状况研究
[J].
DOI:10.11849/zrzyxb.2014.01.010
[本文引用: 2]
利用1961—2011 年中国西南5 省市113 个气象站的观测资料,基于Penman-Monteith 蒸散模型计算了各个站点逐月潜在蒸散和干湿指数,研究了近50 a 来西南地区气候干湿状况的时空变化特征。结果表明:西南地区气候整体较为湿润,但存在较大的区域差异,呈“东湿西干”的空间分布特征。近50 a 来西南区域的气候有“暖干化”的变化趋势,这种趋势在进入21 世纪以后有进一步加剧的迹象。西南地区干湿季特征鲜明,夏季最为湿润,冬季最干燥。近50 a 来,西南地区的气候干湿状况有两次显著的转变过程,第一次时间点在1992 年前后,此时气候开始湿润化,进入相对湿润期;另一次在2002 年前后,变化趋势由湿润化转为干旱化,进入相对干旱期。降水量是西南地区气候干湿状况的决定因素,日照时数与相对湿度等气象要素对干湿状况也产生较大影响。
Study of surface dry and wet conditions in southwest China in recent 50 years
DOI:10.11849/zrzyxb.2014.01.010
[本文引用: 2]
Using the monthly measurements during 1961 to 2011 of 113 meteorological stations in Southwest China, the potential evapotranspiration and aridity index were calculated with the Penman-Monteith model and then the characteristics of spatial-temporal change of surface dry and wet conditions in Southwest China in recent 50 years are discussed. The results show that the dry and wet conditions in Southwest China are spatially uneven with a characteristic named "humid east and arid west" while they are moist as a whole. The climate dry and wet conditions tend to be hotter and drier in this area in recent 50 years and are growing more serious in the last 12 years. The climate dry and wet condition of summer is the moistest in four seasons while it is the driest in winter. There are two time points where the climate dry and wet conditions changed abruptly in Southwest China in the past 50 years. One is around 1992 when it tends to be moist and the other is around 2002 when it becomes dryer instead of moister. Precipitation plays a dominant role in the climate dry and wet conditions of Southwest China region meanwhile the factors such as sunshine duration and relative humidity also have a significant impact on them.
The vegetation cover dynamics (1982-2006) in different erosion regions of the Yellow River Basin, China
[J].DOI:10.1002/ldr.v23.1 URL [本文引用: 1]
The impacts of climate change and land cover/use transition on the hydrology in the upper Yellow River Basin, China
[J].DOI:10.1016/j.jhydrol.2013.08.003 URL [本文引用: 1]
Time-lag effects of NDVI responses to climate change in the Yamzhog Yumco Basin, South Tibet
[J].
An extended AVHRR 8‐km NDVI dataset compatible with MODIS and SPOT vegetation NDVI data
[J].DOI:10.1080/01431160500168686 URL [本文引用: 1]
A non-stationary 1981-2012 AVHRR NDVI3g time series
[J].DOI:10.3390/rs6086929 URL [本文引用: 1]
Interannual variations in growing-season NDVI and its correlation with climate variables in the southwestern karst region of China
[J].DOI:10.3390/rs70911105 URL [本文引用: 1]
Trends and multi-annual variability of water temperatures in the River Danube, Serbia
[J].DOI:10.1002/hyp.v30.18 URL [本文引用: 1]
Robust locally weighted regression and smoothing scatterplots
[J].DOI:10.1080/01621459.1979.10481038 URL [本文引用: 1]
Evidence for a weakening relationship between interannual temperature variability and northern vegetation activity
[J].Satellite-derived Normalized Difference Vegetation Index (NDVI), a proxy of vegetation productivity, is known to be correlated with temperature in northern ecosystems. This relationship, however, may change over time following alternations in other environmental factors. Here we show that above 30 degrees N, the strength of the relationship between the interannual variability of growing season NDVI and temperature (partial correlation coefficient RNDV-GT) declined substantially between 1982 and 2011. This decrease in RNDVI-GT is mainly observed in temperate and arctic ecosystems, and is also partly reproduced by process-based ecosystem model results. In the temperate ecosystem, the decrease in RNDVI-GT coincides with an increase in drought. In the arctic ecosystem, it may be related to a nonlinear response of photosynthesis to temperature, increase of hot extreme days and shrub expansion over grass-dominated tundra. Our results caution the use of results from interannual time scales to constrain the decadal response of plants to ongoing warming.
Vegetation dynamics and responses to climate change and human activities in Central Asia
[J].DOI:10.1016/j.scitotenv.2017.05.012 URL [本文引用: 2]
Assessment of future drought in Southwest China based on CMIP5 multimodel projections
[J].DOI:10.1007/s00376-014-3223-3 URL [本文引用: 1]
1982—2015年“一带一路”地区NDVI时空演变规律及其影响因素
[J].
Analysis of the spatiotemporal evolution of NDVI and its influencing factors in the "Belt and Road" region from 1982 to 2015
Impacts of climate change and human activities on different degraded grassland based on NDVI
[J].Grassland degradation has emerged as a serious socio-economic and ecological problem, endangering both long-term usage and the regional biogeochemical cycle. Climate change and human activities are the two leading factors leading to grassland degradation. However, it is unclear what the degradation level caused by these two factors is. Using the normalized difference vegetation index (NDVI) and coefficient of variation of NDVI (CV), the spatial distribution features of grassland degradation or restoration were analyzed in Qilian County in the northeast of the Qinghai-Tibet Plateau. The dominant climate variables affecting NDVI variation were selected through the combination of random forest model and stepwise regression method to improve the residual trend analysis, and on this basis, twelve possible scenarios were established to evaluate the driving factors of different degraded grasslands. Finally, used the Hurst index to forecast the trend of grassland degradation or restoration. The results showed that approximately 55.0% of the grassland had been degraded between 2000 and 2019, and the area of slight degradation (NDVI> 0; CV> 0; NDVI> 0.2) accounted for 48.6%. These regions were centered in the northwest of Qilian County. Climate and human activities had a joint impact on grassland restoration or degradation. Human activities played a leading role in grassland restoration, while climate change was primarily a driver of grassland degradation. The regions with slight degradation or re-growing (NDVI> 0; CV> 0), moderate degradation (NDVI< 0; CV> 0), and severe degradation or desertification (NDVI< 0; CV< 0) were dominated by the joint effects of climate and anthropogenic activity accounted for 34.3%, 3.3%, and 1.3%, respectively, of the total grassland area. Grasslands in most areas of Qilian County are forecasted to continue to degrade, including the previously degraded areas, with continuous degradation areas accounting for 54.78%. Accurately identifying the driving factors of different degraded grassland and predicting the dynamic change trend of grassland in the future is the key to understand the mechanism of grassland degradation and prevent grassland degradation. The findings offer a reference for accurately identifying the driving forces in grassland degradation, as well as providing a scientific basis for the policy-making of grassland ecological management.© 2022. The Author(s).
Double effect of urbanization on vegetation growth in China's 35 cities during 2000-2020
[J].In recent decades, the trade-off between urbanization and vegetation dynamics has broken the balance between human activities and social-economic dimensions. Our understanding towards the complex human–nature interactions, particularly the gradient of vegetation growth pattern across different city size, is still limited. Here, we selected 35 typical cities in China and classified them into five categories according to their resident population (e.g., megacities, megapolis, big cities, medium cities, and small cities). The spatial-temporal dynamics of vegetation growth for all 35 cities were inferred from the Moderate Resolution Imaging Spectroradiometer (MODIS) normalized difference vegetation index (NDVI). We found that averaged NDVI for all cities slightly decreased during 2000 and 2020, at a rate of 1.6 × 10⁻⁴ per year. Most cities were characterized with relatively lower NDVI in urban areas than its surrounding area (determined by a series of buffer zones, i.e., 1–25 km outside of the city boundary). The percentage of greening pixels increased from urban area to the 25 km buffer zone at a rate of 4.7 × 10⁻⁴ per km. We noticed that negative impact of urbanization on vegetation growth reduced as the distance to urban area increased, with an exception for megacities (e.g., Shanghai, Beijing, and Shenzhen). In megacities and megapolis, greening pixels were more concentrated at core urban area, implying that the positive urbanization effect on vegetation growth is much more apparent. We argue that urbanization in China might facilitate vegetation growth to a certain extent, for which an appropriate urban planning such as purposeful selection of city sizes could be a scientific guidance while targeting the city’s sustainable development goals in future.
Accelerated dryland expansion under climate change
[J].
DOI:10.1038/NCLIMATE2837
[本文引用: 2]
Drylands are home to more than 38% of the total global population and are one of the most sensitive areas to climate change and human activities(1,2). Projecting the areal change in drylands is essential for taking early action to prevent the aggravation of global desertification(3,4). However, dryland expansion has been underestimated in the Fifth Coupled Model Intercomparison Project (CMIP5) simulations(5) considering the past 58 years (1948-2005). Here, using historical data to bias-correct CMIP5 projections, we show an increase in dryland expansion rate resulting in the drylands covering half of the global land surface by the end of this century. Dryland area, projected under representative concentration pathways (RCPs) RCP8.5 and RCP4.5, will increase by 23% and 11%, respectively, relative to 1961-1990 baseline, equalling 56% and 50%, respectively, of total land surface. Such an expansion of drylands would lead to reduced carbon sequestration and enhanced regional warming(6,7), resulting in warming trends over the present drylands that are double those over humid regions. The increasing aridity, enhanced warming and rapidly growing human population will exacerbate the risk of land degradation and desertification in the near future in the drylands of developing countries, where 78% of dryland expansion and 50% of the population growth will occur under RCP8.5.
基于MOD13Q1数据的宁夏生长季植被动态监测
[J].
DOI:10.18306/dlkxjz.2017.06.009
[本文引用: 1]
宁夏自2000年后实施退耕还林以来,局部地区的生态环境得到明显改善,为探求近15来年宁夏地区植被的动态变化及其影响因子,本文以MOD13Q1为数据源,结合DEM数据、土地利用分类图,采用Sen+Mann-Kendall非参数检验方法和Hurst模型,分析了宁夏不同行政区、不同海拔、不同坡度、不同坡向及不同植被类型生长季NDVI的空间变化特征及未来变化趋势;并利用重心迁移模型和转移矩阵分析宁夏2000-2014年间植被覆盖的时空演变特征。结果表明:①从空间分布看,宁夏南部六盘山、北部贺兰山及引黄灌溉区植被长势较好,中部干旱地区植被长势较差;且植被NDVI与海拔高程和坡度呈显著正相关。②从植被覆盖的转移矩阵看,较高植被覆盖的面积占比从2000年的17.29%增长到2014年的31.55%,主要是由较低植被覆盖转化而来的。③从重心迁移方向看,中度植被覆盖和较高植被覆盖的重心迁移最为明显,分别向东北方向偏移了129.49 km和向东南方向偏移了89.49 km。④从变化趋势看,生长季植被NDVI整体呈上升趋势,明显改善的面积占总面积的59.63%,轻微改善区域占31.72%;林地和水田显著改善的面积分别占总面积的71.50%和70.80%;显著改善的面积比例随海拔高程和坡度的增加均先增加后减少,且南部各行政区植被改善的面积均高于北部。⑤从可持续性看,植被恢复的持续性较强,89.24%的植被NDVI呈现持续改善的趋势;南部地区的持续改善的面积大于北部地区。
Monitoring vegetation dynamics during the growing season in Ningxia based on MOD13Q1
Article title variations in growing season NDVI and its sensitivity to climate change responses to green development in mountainous areas
[J].The Normalized Difference Vegetation Index (NDVI) is sensitive to changes in surface vegetation cover. Research into how climate change impacts surface vegetation cover is essential to manage ecological systems and promote green development. The Western Henan Mountains, located in the transitional zone between the northern subtropical and warm temperate zones of China, is an ideal location to study the impacts of climate change on surface vegetation cover. Combining a digital elevation model (DEM) with temperature and precipitation data; and MODIS-NDVI imagery (2000∼2017) for the Western Henan Mountains, this study explores variations in the growing season NDVI and its response to climate change. Results show that there are significant changes with fluctuations in NDVI values from 2000 to 2017. NDVI increased at a growth rate of 0.027 per decade (p &lt; 0.05) overall, indicating vegetation conditions have gradually improved. Although the NDVI value showed an overall increasing trend, 19.12% of the areas showed a decreasing trend, interspersing and intersecting spatially, showing significant spatial differences. NDVI increased initially, but then decreased as a function of elevation, which was shown to be proportional to slope and independent of aspect. Variables including elevation and slope gradient are shown to provide high explanation of NDVI variability, whilst temperature is shown to have a more significant impact on NDVI than precipitation. However, vegetation responses to temperature and precipitation covaried with both slope and aspect. Positive NDVI trends were strongest at low elevations (i.e., &lt;1,100 masl), which we attribute to vegetation restoration activities. Lower NDVI values characterized gentle slopes (&lt;5°), whilst higher values were, in contrast, associated with steeper slopes (5∼10°). This study highlights the complex mechanisms and their relations governing vegetation response to climate change and should form an instructive basis for both future modeling studies investigating the response of vegetation to future global warming.
Downscaled solar-induced chlorophyll fluorescence has great potential for monitoring the response of vegetation to drought in the Yellow River Basin, China: Insights from an extreme event
[J].
Precipitation impacts on vegetation spring phenology on the Tibetan Plateau
[J].
DOI:10.1111/gcb.12961
PMID:25926356
[本文引用: 2]
The ongoing changes in vegetation spring phenology in temperate/cold regions are widely attributed to temperature. However, in arid/semiarid ecosystems, the correlation between spring temperature and phenology is much less clear. We test the hypothesis that precipitation plays an important role in the temperature dependency of phenology in arid/semiarid regions. We therefore investigated the influence of preseason precipitation on satellite-derived estimates of starting date of vegetation growing season (SOS) across the Tibetan Plateau (TP). We observed two clear patterns linking precipitation to SOS. First, SOS is more sensitive to interannual variations in preseason precipitation in more arid than in wetter areas. Spatially, an increase in long-term averaged preseason precipitation of 10 mm corresponds to a decrease in the precipitation sensitivity of SOS by about 0.01 day mm(-1). Second, SOS is more sensitive to variations in preseason temperature in wetter than in dryer areas of the plateau. A spatial increase in precipitation of 10 mm corresponds to an increase in temperature sensitivity of SOS of 0.25 day °C(-1) (0.25 day SOS advance per 1 °C temperature increase). Those two patterns indicate both direct and indirect impacts of precipitation on SOS on TP. This study suggests a balance between maximizing benefit from the limiting climatic resource and minimizing the risk imposed by other factors. In wetter areas, the lower risk of drought allows greater temperature sensitivity of SOS to maximize the thermal benefit, which is further supported by the weaker interannual partial correlation between growing degree days and preseason precipitation. In more arid areas, maximizing the benefit of water requires greater sensitivity of SOS to precipitation, with reduced sensitivity to temperature. This study highlights the impacts of precipitation on SOS in a large cold and arid/semiarid region and suggests that influences of water should be included in SOS module of terrestrial ecosystem models for drylands. © 2015 John Wiley & Sons Ltd.
Differentiating climate- and human- induced drivers of grassland degradation in the Liao River Basin, China
[J].
Quantitative distinction of the relative actions of climate change and human activities on vegetation evolution in the Yellow River Basin of China during 1981-2019
[J].
DOI:10.1007/s40333-022-0079-8
[本文引用: 1]
Under the combined influence of climate change and human activities, vegetation ecosystem has undergone profound changes. It can be seen that there are obvious differences in the evolution patterns and driving mechanisms of vegetation ecosystem in different historical periods. Therefore, it is urgent to identify and reveal the dominant factors and their contribution rates in the vegetation change cycle. Based on the data of climate elements (sunshine hours, precipitation and temperature), human activities (population intensity and GDP intensity) and other natural factors (altitude, slope and aspect), this study explored the spatial and temporal evolution patterns of vegetation NDVI in the Yellow River Basin of China from 1989 to 2019 through a residual method, a trend analysis, and a gravity center model, and quantitatively distinguished the relative actions of climate change and human activities on vegetation evolution based on Geodetector model. The results showed that the spatial distribution of vegetation NDVI in the Yellow River Basin showed a decreasing trend from southeast to northwest. During 1981-2019, the temporal variation of vegetation NDVI showed an overall increasing trend. The gravity centers of average vegetation NDVI during the study period was distributed in Zhenyuan County, Gansu Province, and the center moved northeastwards from 1981 to 2019. During 1981-2000 and 2001-2019, the proportion of vegetation restoration areas promoted by the combined action of climate change and human activities was the largest. During the study period (1981-2019), the dominant factors influencing vegetation NDVI shifted from natural factors to human activities. These results could provide decision support for the protection and restoration of vegetation ecosystem in the Yellow River Basin.
The cost-benefit evaluation based on ecosystem services under different ecological restoration scenarios
[J].The effects of ecological restoration based on ecosystem services (ES) have attracted more and more attention, while the simulation and cost-benefit analysis of ecological restoration scenarios are not well investigated. In this study, four ecological restoration scenarios were simulated at a typical watershed on the Qinghai-Tibetan Plateau (QTP) based on the land use conversion. Scenario 1 was only grassland restoration, Scenario 2 and 3 were mainly farmland to shrub, and Scenario 4 was mainly grassland restoration with bare land converting to forest and shrub. The ecosystem services value (ESV) and the cost-benefits of these scenarios were quantified and compared in 25 years after the restoration investment. The results showed there were significant differences in the ESV under four scenarios, among which Scenario 4 had the largest ESV and Scenario 1 had the smallest ESV. The spatial distribution of ESV was uneven, and high-value regions were concentrated in the southwest and central regions. There were great variations between original scenario and simulated scenarios, but a little difference between Scenarios 2, 3, and 4. The largest loss of farmland abandonment was regulating service, followed by supporting service, provisioning service, and cultural service. From the perspective of payback period, Scenario 1 was the fastest, and it could obtain net benefits first. From the short- and long-term (6 and 25 years after investment) benefits, Scenarios 1 and 4 had the largest cumulative ESV increase, respectively. The results of this study can provide a basis for the formulation and implementation of ecological policies.
生态保护和植树造林对黑河流域河川径流的影响
[J].
DOI:10.11820/dlkxjz.2008.03.007
[本文引用: 1]
黑河流域是密云水库上游潮白河水系的重要组成部分。从20 世纪80 年代开始,国家在黑河流域开展了大 面积的生态保护和植树造林活动。为正确认识植树造林等活动对流域水资源的影响,本研究利用20 世纪80 年代 和2000 年两期土地利用数据和流域1959~2000 年降雨、径流资料,分析了生态保护和植树造林活动影响下的流域 河川径流量的变化情况。研究结果表明:1959~2000 年黑河流域年降水量和河川径流量年际变化较大,但整体变化 趋势性不显著;黑河流域以林地、草地和耕地面积为主,从20 世纪80 年代到2000 年林地面积增加了8x10<sup>2</sup>hm<sup>2</sup>,草 地和耕地面积分别减少了7x10<sup>2</sup>hm<sup>2</sup> 和1x10<sup>2</sup>hm<sup>2</sup>;1980~2000 年开展植树造林活动期较1959~1979 年多年平均径流 系数下降了4.1%;1980 年后20 年的生态保护和植树造林活动对河川径流量的影响为- 0.3mm/hm<sup>2</sup>,且有丰水年份 对流域河川径流量影响最大,平水年次之,在枯水年份对流域河川径流量影响最小的现象。
The impact of ecological protection and afforestation on streamflow in Heihe River Basin
DOI:10.11820/dlkxjz.2008.03.007
[本文引用: 1]
Heihe basin is an important part of the Chaobai river system, which lies on the upstream of Miyun reservoir. Since 1980s, the government has launched many activities on ecological protection and afforestation. In order to understand the impact of these activities on water resource in Heihe basin, this paper analyzes the changes of streamflow by using land use data in the 1980s and 2000 and the precipitation - runoff data from 1959 to 2000. The results show: the interannual variation of precipitation and streamflow in Heihe basin from 1959 to 2000 is large, but has generally shown no obvious trend of rise or decline; and the heihe basin area is dominated by woodland, grasslands and farmland. From 1980s to 2000, the area of woodland had increased by 800 hectares while grassland and farmland had decreased, respectively, by 700 hectares and 100 hectares. During 1980 to 2000, when lots of ecological protection and afforestation activities were carried out, the average runoff coefficient got a reduction of 4.1%, compared to that in the control period of 1959 ~1979. According to the data of two periods in discussion, the impact of ecological protection and afforestation on streamflow is - 0.308mm/hm2 and it indicates a phenomenon that the impact is the largest in wet years, smaller in normal years, and the smallest in dry years.
1981—2010年气候变化和人类活动对内蒙古地区植被动态影响的定量研究
[J].
DOI:10.18306/dlkxjz.2017.08.011
[本文引用: 1]
基于GIMMS NDVI以及MODIS NDVI数据,分析内蒙古地区1981-2010年的植被变化趋势,并结合气候、社会经济数据,以旗县为单位定量分析气候变化和人类活动对植被变化的影响,结果表明:①1981-2010年间,内蒙古地区植被变化具有典型的空间异质性,其中植被显著增加区域主要集中在西南部的阿拉善盟、鄂尔多斯市以及东部通辽市等地区,显著减少区域主要集中在北部的锡林郭勒盟以及东北部的呼伦贝尔市的部分地区;②对于植被显著增加区域,人类活动作用的影响面积最大,其次为气候因素,气候与人类活动的耦合作用也对植被增加有一定显著影响;内蒙古西部降雨量的增加、围封禁牧政策的实施以及农作物播种面积的增加为驱动植被增加的主要因素;③对于植被显著减少区域,人类活动的作用略大于气候因素;内蒙古中东部地区降雨减少以及近10年来部分旗县风速的增加是导致植被显著减少的重要气候因素;虽然人工造林、农作物播种面积会增加局部植被盖度,但在县域尺度不足以抵消干旱对植被生长的不利影响,反而会导致区域植被退化。
Impacts of climate change and human activities on vegetation dynamics in Inner Mongolia, 1981-2010
DOI:10.18306/dlkxjz.2017.08.011
[本文引用: 1]
This study constructed growing season NDVI in 1981-2010 based on GIMMS NDVI and MODIS NDVI data in Inner Mongolia. The characteristics of NDVI change were analyzed and natural and human influencing factors were investigated in each county (banner) by trend analysis and multiple regression analysis. The results indicate that NDVI changes in Inner Mongolia showed great heterogeneity. The regions that experienced significantly increased vegetation cover were mainly distributed in Erdos City and Alashan Prefecture in southwestern and Tongliao City in eastern Inner Mongolia, and the regions that experienced significantly decreased vegetation cover were in HulunBuir and Xilinguole Prefectures in northern Inner Mongolia. For the increased vegetation cover regions, human activities were the dominant factor, and climate change played the second role; the coupling of climate change and human activities also had certain impact on the vegetation increase. The increase of the rainfall, implementation of banned grazing policies and increase of cropping area were the main factors driving the increase of vegetation. However, for the decreased vegetation cover regions, the role of human activities was slightly greater than that of climate change. The reduction of rainfall in the central and eastern Inner Mongolia and the raise of wind speed in some counties in nearly 10 years were the main climatic factors driving the significant decrease of vegetation. Although afforestation and the increase of cropping area might lead to the increase of vegetation cover at local scale, it was not enough to counteract the adverse effects of drought on vegetation growth at county scale; nevertheless, it might lead to regional vegetation degradation.
Soil properties following cultivation and non-grazing of a semi-arid sandy grassland in northern China
[J].DOI:10.1016/S0167-1987(03)00157-0 URL [本文引用: 1]
Effects of climate change on vegetation growth in the Yellow River Basin from 2000 to 2019
[J].A changing climate has been posing significant impacts on vegetation growth, especially in the Yellow River Basin (YRB) where agriculture and ecosystems are extremely vulnerable. In this study, the data for normalized difference vegetation index (NDVI) obtained from moderate-resolution imaging spectroradiometer (MODIS) sensors and climate data (precipitation and temperature) derived from the national meteorological stations were employed to examine the spatiotemporal differences in vegetation growth and its reaction to climate changes in the YRB from 2000–2019, using several sophisticated statistical methods. The results showed that both NDVI and climatic variables exhibited overall increasing trends during this period, and positive correlations at different significant levels were found between temperature/precipitation and NDVI. Furthermore, NDVI in spring had the strongest response to temperature/precipitation, and the correlation coefficient of NDVI with temperature and precipitation was 0.485 and 0.726, respectively. However, an opposite situation was detected in autumn (September to November) since NDVIs exhibited the weakest responses to temperatures/precipitation, and the NDVI’s correlation with both temperature and precipitation was 0.13. This indicated that, compared to other seasons, increasing the temperature and precipitation has the most significant effect on NDVI in spring (March to May). Except for a few places in the northern, southern, and southwestern regions of the YRB, NDVI was positively correlated with precipitation in most areas. There was an inverse relationship between NDVI and temperature in most parts of the central YRB, especially in summer (June to August) and growing season (May to September); however, there was a positive correlation in most areas of the YRB in spring. Finally, continuous attention must be given to the influence of other factors in the YRB.
