

生态产品价值核算是生态系统生产总值(gross ecosystem product,GEP)价值实现的基础,是生态系统保护成效评估的重要手段,也是支撑生态文明制度体系建设的关键[1]。自20世纪末学者认识到生态系统的价值开始[2-3],国际上开展了一系列生态产品价值核算研究。例如联合国启动“千年生态系统评估”国际合作项目、2012年联合国统计委员会批准的“环境经济核算体系(SEEA)中心框架”[4]、2014年发布的“环境经济核算体系:试验性生态系统核算(SEEA-EEA)”[5]、2021年通过的“环境经济统计与生态统计体系”(SEEA-EA)全新统计框架[6]等。目前,超过30个国家正在试验性地编制生态系统价值核算标准。生态产品价值核算研究成为当前生态经济学的前沿领域,以及各国政府关注的热点。
中国生态产品价值核算研究起步虽然较晚,但近年来单项生态系统服务、综合类生态产品核算、地方实践等方面开展了大量尝试。例如针对森林、湿地、草地、荒漠、海洋、农田、城市等生态系统,开展了一系列生态系统服务功能研究,并形成了多个单类生态系统服务功能评估规范和方法[7-8]。在此基础上,相继发布了综合类生态系统GEP核算的技术指南和标准,如生态环境部综合司发布的《陆地生态系统生产总值(GEP)核算技术指南》[9]。在现行的陆地生态系统产品价值核算框架下,各地政府积极开展实践,如深圳搭建了“1+3”GEP核算制度体系[10]、浙江湖州建成县域GEP核算决策支持系统[11]、德清县建立“数字两山”GEP核算决策支持平台[12],并初步形成了一些地方性的生态产品价值核算规范和方法[13]。因此,现行的陆地生态系统产品价值核算框架主要针对区域生态系统特征,分生态类型开展科学的单项生态产品的经济价值核算[14]。
水是生态之基,是支撑地球生命系统的重要基础。目前,针对陆地水生态系统的河流、水库、湖泊、湿地4种单项生态类型,已开展了大量服务功能及价值核算的探索。其中河流生态系统服务价值的研究重点关注河流生态系统服务的内涵及指标、水电开发及水利工程对河流生态系统服务功能的价值影响等[15-16]。湖泊生态系统服务价值主要侧重于水生态系统平衡、水功能分区、湖泊生态服务受益者分析及生态生产函数构建等[17⇓⇓-20]。水库生态系统服务价值的评估主要围绕水库调度的生态系统服务价值评估、净化空气的服务功能等方面[21]。湿地生态系统服务价值的评估,通常聚焦于涵养水源功能价值、净化功能价值等方面[22⇓-24]。在整个水生态系统价值量估算方面,也有一些探索。如赵同谦等[25]建立了由生活和工农业供水、水力发电、内陆航运、水产品生产、休闲娱乐组成的5个直接使用价值指标,以及调蓄洪水、河流输沙、蓄积水分、保持土壤、净化水质、固定碳、维持生物多样性组成的7个间接使用价值指标,构成了水生态系统服务功能评价指标体系。陈默等[26]通过相关文献统计筛选出3大类14项指标,建立了水生态系统生产总值核算体系,评估了向家坝水电站建设对水生态系统生产总值的影响。但目前大多数研究主要采用少量观测数据和简单经验公式针对水生态系统的各类功能进行独立评估[27⇓-29],忽视了各功能之间的水循环联系机制,核算结果的数据笼统、人为性强,难以体现水生态系统涉及的、复杂的物质能量过程及时空格局,严重制约水生态产品价值在生态系统管理与决策中的应用。
本文选用黄河上游湟水河流域为例,在明确水生态产品内涵的基础上,以水循环多过程模拟为基础,定量描述水生态系统涉及的生态水文和生物地球化学动态变化过程;结合情景分析、社会经济调查等手段,开展水生态产品价值量(水资源供给、水资源存量、土壤保持、洪水调蓄、水质净化)核算,系统分析水生态产品组成及时空分布规律。本文可为黄河上游流域水生态系统管理提供可靠的理论和技术支撑,也对黄河流域水生态保护和可持续利用等具有重要的现实意义。
1 研究区域与数据
1.1 研究区概况
本文选取湟水河及其联系的黄河干流相关子流域为对象开展研究(图1)。湟水河是黄河上游最大的一级支流,是黄河主要来水源之一,也是青海省经济文化的发祥地和兰州市城市用水的主要水源。湟水河主要由湟水干流及其支流大通河组成,总流域面积为3.29万km2。湟水干流发源于达坂山南坡的青海省海晏县,于甘肃省永靖县上车村流入黄河,全长374 km。
图1
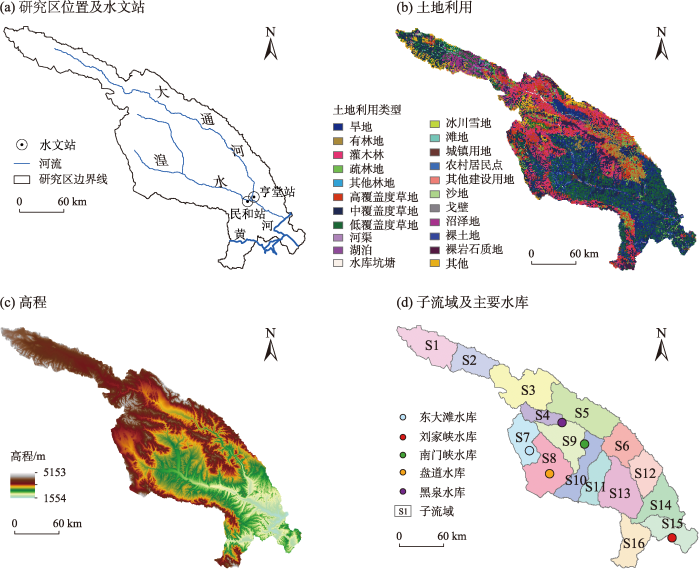
图1
研究区位置及水文站、土地利用、高程、子流域及主要水库分布
Fig.1
Location and hydrologic stations, land use, elevation and sub-basins and main reservoir distribution of the study area
湟水河流域地形复杂多样,冰川、河谷平原、黄土丘陵、石质高山交错分布,植被类型有高山草甸、山地草原、天然次生林、高山高寒灌木林、人工林等。流域属干旱和半干旱农牧林气候区,多年平均降水量约500 mm,70%的降水量集中在6—9月,年平均气温0.6~7.9 ℃,蒸发量1100~1800 mm。湟水河流域多年平均水资源量为20.7亿m3,其中人均和亩均耕地水资源量分别为663 m3和472 m3,仅为全国水平的1/3和1/4,为典型的重度缺水地区。为保障供水、防洪和发电等需要,流域已修建大量调蓄工程、引水工程和水电工程等,现状水资源利用率已达60%,已超过世界公认的40%合理极限值,河流水生态环境破坏,水土流失、干流短时断流、水污染严重,是典型的水生态问题突出区域。因此,开展研究区水生态产品价值量核算,可为湟水河流域水生态保护和水资源可持续利用提供重要的决策依据,为重度缺水、水生态问题突出区域的水生态产品价值量核算提供参考。
1.2 数据来源与处理
本文涉及的数据主要包括实物量数据和价格数据。其中,实物量数据主要为构建分布式流域水循环系统模型(HEQM)所需数据(模型详见2.3),具体为:90 m分辨率的数字高程、1∶25万河网水系、7期30 m分辨率的土地利用(1980、1990、1995、2000、2005、2010、2015年)等地理信息数据,以及1960—2018年流域及周边40个站点气温、8个站点降水及2个水文站(民和、亨堂)径流量的日观测水文气象数据序列数据。其中,水库、径流观测数据资料来源于中华人民共和国水利部印发的《黄河流域水文年鉴》,气象数据来源于国家气象局、自然资源部。各类价格数据是根据统计年鉴、全国水价网及其他文献整理获得。
2 水生态产品的内涵及核算方法
2.1 水生态产品的内涵
水生态系统是陆地生态系统的组成部分,水生态产品符合产品和生态产品的一般特征,是生态产品的重要组成部分。参考国内外相关研究[9⇓⇓⇓⇓-14,27⇓-29],水生态产品的内涵可以理解为:① 产品对象。水生态产品涉及地表水、地下水、土壤水。考虑到研究区实际情况,本文中的地表水为河流、湖泊、水库,不涉及沼泽。水利工程是水生态产品供给的重要依托,是提高水生态产品供给能力的重要支撑和保障。修建水利工程,能控制水流,防止洪涝灾害,并进行水量的调节和分配,以满足人民生活和生产用水需求。② 产品属性。产品是用于满足人们使用和消费为目的,或具有潜在的使用价值,具有价值的物品和服务,具有在市场中流通交易的可能和基础。水生态产品是人类生存和发展不可或缺的特殊产品,可通过水生态保护与修复,提高水生态产品的生产能力。③ 产品功能。根据《陆地生态系统生产总值(GEP)核算技术指南》[9],陆地生态系统生产总值核算指标体系由物质产品、调节服务和文化服务三大类构成,其中调节和文化两大类可以合并为服务功能。与之对应,水生态产品由物质供给及服务功能两大类构成。其中,物质供应是直接提供产品维持人的生活、生产活动;服务功能包括水资源存储、土壤保持、洪水调蓄、水质净化等。
2.2 水生态产品核算方法
本文基于HEQM模型,模拟流域不同下垫面条件下的水文、土壤侵蚀和水质等过程;然后采用数值模拟、情景分析等手段,进行水资源存储、土壤保持、水质净化的实物量评估,并结合社会经济统计资料,开展水资源供给、水资源存储、洪水调蓄、土壤保持、水质净化的价值评估,最终完成水生态产品总价值量核算。
为了分析研究区水生态产品时间变化规律,本文模拟了30年(1986—2015年)的水文、土壤侵蚀和水质过程。考虑到水文过程具有较强的随机性,因此实物量采用多年平均,即评估时段为1986—1995、1996—2005、2006—2015年的10年平均状态。为了方便比较不同时期的水生态产品价值,考虑到土地利用数据、气象水文数据匹配的问题,本文以2015年为基准,其他年份价格均采用GDP平减系数折算至2015年,即设置2015年价格为不变价格。
(1) 水资源供给价值量核算
水资源的供给价值在于水生态系统为人类生活用水、农业灌溉用水以及发电等为人类发展持续提供水资源量,可运用替代市场法计算,即
式中:
(2) 水资源存储价值量核算
水资源存储的价值在于水生态系统是天然的容器,起到存储、补充和调节水资源的作用。本文运用替代成本法进行计算,即
式中:
(3) 洪水调蓄价值量核算
洪水调蓄价值主要表现在蓄积洪峰水量,削减并滞后洪峰,缓解汛期洪峰造成的威胁和损失的经济价值。本文运用替代成本法进行核算。
式中:
研究区有5个大中型水库,即黑泉水库、东大滩水库、盘道水库、南门峡水库、刘家峡水库(图1)。其中黑泉水库位于子流域S4,每年可向西宁市供水1.35亿m3,年发电量达5000多万kWh。南门峡水库位于子流域S10,是互助县最大的一座拦河式中型水库,保障水库下游南门峡镇14个村5.2万亩的灌溉和互助县城约10万人的饮水安全。盘道水库位于子流域S8,主要任务是解决生态环境建设用水及农田灌溉,兼顾部分地区人蓄饮水及西宁城南新区供水。东大滩水库位于子流域S7,是目前湟水流域最大的调节型水库,以防洪为主,兼顾农田灌溉、生态用水等综合利用的不完全年调节的拦河式中型水库,主要担负湟水干流沿岸200多万人口,21万亩耕地的防洪安全和用水安全。刘家峡水库位于子流域S15,以发电为主,兼有防洪、防凌、灌溉、供水等综合功能。每年春灌期间,刘家峡水库为农业生产补水达8亿~12亿m3,灌溉黄河中下游沿岸面积1600多万亩。刘家峡水库总装机容量为122.5万kW,年发电57 亿kWh。
(4) 土壤保持价值量核算
土壤保持价值在于水生态系统可以减少泥沙淤积和减少面源污染。其中减少泥沙淤积是水生态系统通过保持土壤,减少水库、河流、湖泊的泥沙淤积,有利于降低干旱、洪涝灾害发生的风险。根据土壤保持量和淤积量,运用替代成本法(即水库清淤工程的费用)核算减少泥沙淤积价值。减少面源污染是水生态系统通过保持土壤,减少氮、磷等土壤营养物质进入下游水体,可降低下游水体面源污染。根据土壤保持量和土壤中氮、磷的含量,利用替代价格法,以同养分含量的化肥售价作为减少养分流失效益核算减少面源污染价值。
式中:
本文土壤容重、氮、磷、钾含量、单位水库清淤工程费、肥料价格等数据来源于当地土壤调查、文献、专项调查和发改委等部门。如根据《陆地生态系统生产总值(GEP)核算技术指南》[9],青海地区的土壤容重取1.236 g/cm3。根据2002年的《中华人民共和国水利部水利建筑工程预算定额》[31]中挖取单位面积土壤费用为12.6元/m3(折合为2015年的不变价格20.87元/m3)。根据《水库泥沙淤积量计算方法探讨》[32],考虑到研究区内的水库排沙状况,泥沙淤积系数取0.70;根据全国土壤调查,全国范围土壤有机质含量为1%,氮含量为0.37%,磷含量为0.108%,钾含量为2.239%。根据化肥成分(
(5) 水质净化价值量核算
水质净化价值是水域湿地生态系统吸附、降解、转化水体污染物,净化水环境的功能价值。核算生态系统降解水体污染物、净化水质的价值,运用替代成本法进行核算,即
式中:
2.3 分布式水循环模型构建
为描述水生态系统结构、格局和过程,本文基于自主研发的分布式流域水循环系统模型HEQM,进行水文、土壤生物地球化学、土壤侵蚀和水质等多过程耦合模拟,摸清了的水文要素(地表径流、土壤水、地下径流等)、土壤保持量、水质(COD)浓度变化过程及其空间分布,并利用情景分析,模拟了变化下垫面条件下的土壤侵蚀、水质变化过程,从而为流域水生态产品价值评估提供科学的、连续动态的、分布式的水文、土壤保持、水质实物量数据。HEQM模型以水和营养物质循环作为联系各过程的联系纽带,综合考虑变化环境下水文循环和营养源循环在陆面、土壤、植被和河流水体中的相互作用关系,以及闸坝调控和排污对水和营养源循环的影响。另外,考虑到研究区是典型的高寒地区,覆盖有冰川积雪,本文采用的HEQM扩展了其冰川积雪冻融过程。HEQM模型结构和参数等详见文献[33-34]。该模型已在黄河、淮河、新安江和密云水库等流域进行了应用[35]。
本文将研究区划分为16个子流域(图1)。其中,S1、S2……S16为子流域编号,排序总体为上游到下游。为确定每个子流域参数最优值,先利用LH-OAT(Latin hypercube one factor at a time)进行敏感性分析,筛选敏感性参数,然后采用SCE-UA算法,以模型体积误差、相关系数和效率系数3个指标为模型评价标准进行率定。本文采用民和、亨堂两个水文站的日径流过程进行了率定和验证(表1)。其中率定期的水量平衡系数分别是0.05和-0.11,相关系数分别是0.81和0.84,效率系数分别为0.64和0.69。验证期除民和站的效率系数有减小外,其他值变化不大。总体上率定期和验证期的结果令人满意。
表1 研究区分布式水循环模型率定及验证结果
Tab.1
| 站点 | 率定期 | 验证期 | |||||||
|---|---|---|---|---|---|---|---|---|---|
| 时段 | 偏差 | 相关系数 | 效率系数 | 时段 | 偏差 | 相关系数 | 效率系数 | ||
| 民和 | 1970—1989年 | 0.05 | 0.81 | 0.64 | 2008—2010年 | 0.28 | 0.74 | 0.43 | |
| 亨堂 | 1960—1989年 | -0.11 | 0.84 | 0.69 | 2008—2010年 | 0.06 | 0.82 | 0.63 | |
由于观测数据缺乏,本文采用参数移植方法,将已率定子流域的参数移用到没有水文观测的子流域。由于HEQM模型考虑的水文相关过程众多,涉及参数也较多,考虑到两个子流域的相似度,选取属性相似法进行参数移植,选取的相似度变量参数包括平均坡度、平均流域面积、平均高程、各土地利用(水田、草地、林地、旱地、水域、未利用地、建设用地和冰川积雪)所占比例、多年平均降水量、多年平均温度以及兴利库容8个指标。详细建模和参数确定见Zhang等[36]的研究。
3 结果与分析
3.1 水文、土壤侵蚀、水质变化过程
本文为准确计算研究区水生态产品实物量,基于分布式流域水循环系统模型HEQM,模拟了30年(1986—2015年)分布式的水文要素(地表径流、土壤水、地下径流等)、土壤侵蚀量、COD含量变化过程。
(1) 水文要素
图2是1986—2015年降水及地表水、土壤水、地下水的径流深。研究区1986—1995、1996—2005、2006—2015年平均降水为453.03、435.79、471.54 mm/a,平均总径流深118.16、132.51、151.75 mm/a,降水先降低后增加,径流深总体呈增加趋势。1986—1995、1996—2005、2006—2015年的地表水平均径流深分别为12.45、12.22、11.89 mm/a,土壤水平均径流深分别为43.91、65.17、78.97 mm/a,地下水平均径流深分别为61.8、55.12、60.89 mm/a,地下水和土壤水占主导,地表水所占比例小;总径流深区域差异较降水差异大,且研究区从上游到下游,地表水、土壤水及地下水径流深明显降低。
图2
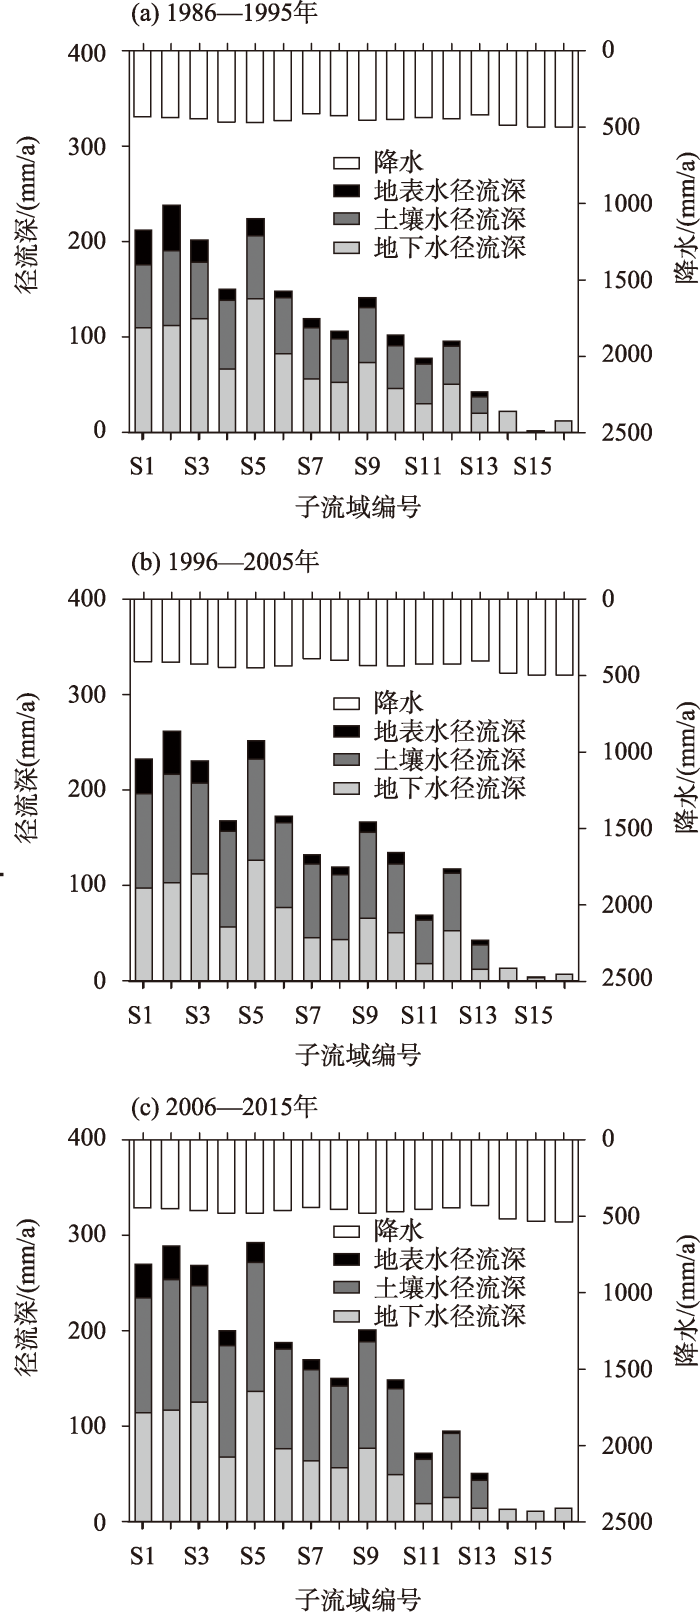
图2
1986—2015年研究区降水及径流深
Fig.2
Precipitation and runoff depth in the study area during 1986-2015
(2) 土壤侵蚀量
图3是1986—2015年研究区土壤侵蚀的现状量、转移量、调节量。其中现状量是当前地表植被覆盖情形下的实际土壤侵蚀量,转移量为没有地表植被情形下的土壤侵蚀量,调节量是现状土壤侵蚀量与转移土壤侵蚀量之差,是水生态系统的土壤保持量。从图中可以看出,研究区土壤保持量呈增大的趋势:1986—1995、1996—2005、2006—2015年平均土壤保持量分别为0.61亿kg/a、0.66亿kg/a、1.12亿kg/a;从空间分布来看,从上游到下游土壤保持量呈增大的趋势,上游多个流域土壤保持量如S1、S2、S3等,与下游子流域相差数个数量级,可以忽略;从贡献比例来看,上游与中游是草地和林地占主导,下游则是农田、草地、林地贡献相当。
图3
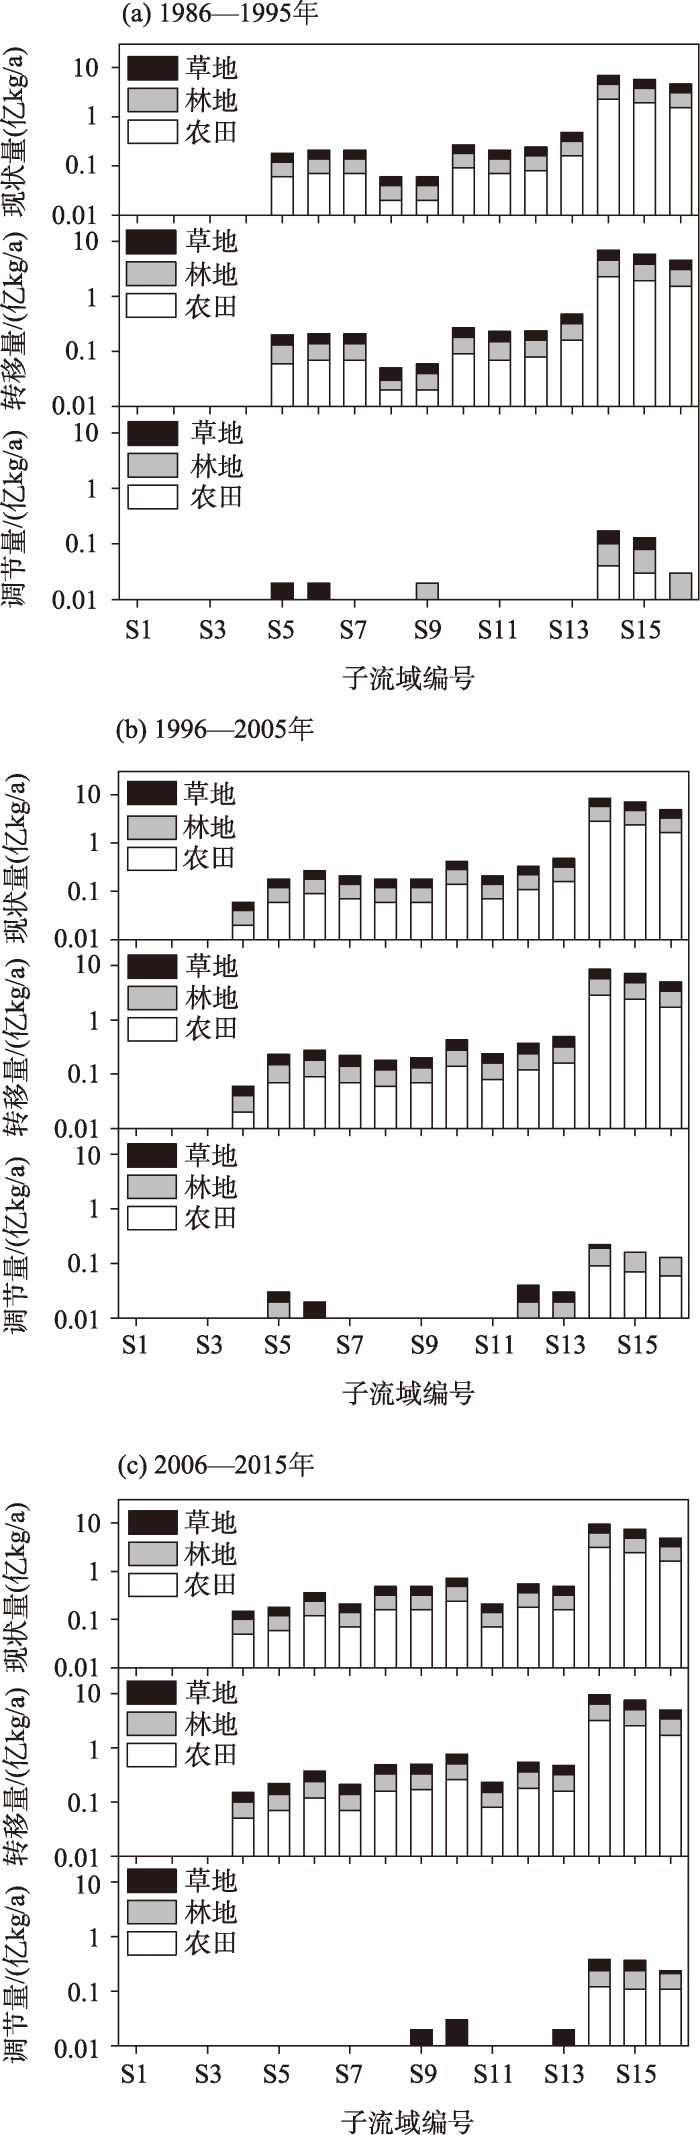
图3
1986—2015年研究区土壤侵蚀的现状量、转移量、调节量
Fig.3
Current amount, transfer amount, and adjusting amount of soil erosion in the study area during 1986-2015
(3) COD含量
图4是1986—2015年研究区COD含量的现状量、转移量、调节量。其中现状量是当前地表植被覆盖情形下的实际COD含量,转移量为没有地表植被情形下的COD含量,调节量是现状COD量与转移COD之差,是水生态系统的水质净化量。从图中可以看出,研究区水质净化量呈增大的趋势:1986—1995、1996—2005、2006—2015年平均调节COD总量分别为1.32亿kg/a、1.88亿kg/a、2.07亿kg/a;从空间分布来看,从上游到下游水质净化价值量呈增大的趋势;从贡献比例来看,水生态系统水质净化涉及农田、林地和草地贡献,其中草地贡献的比例最大,平均占80%。
图4
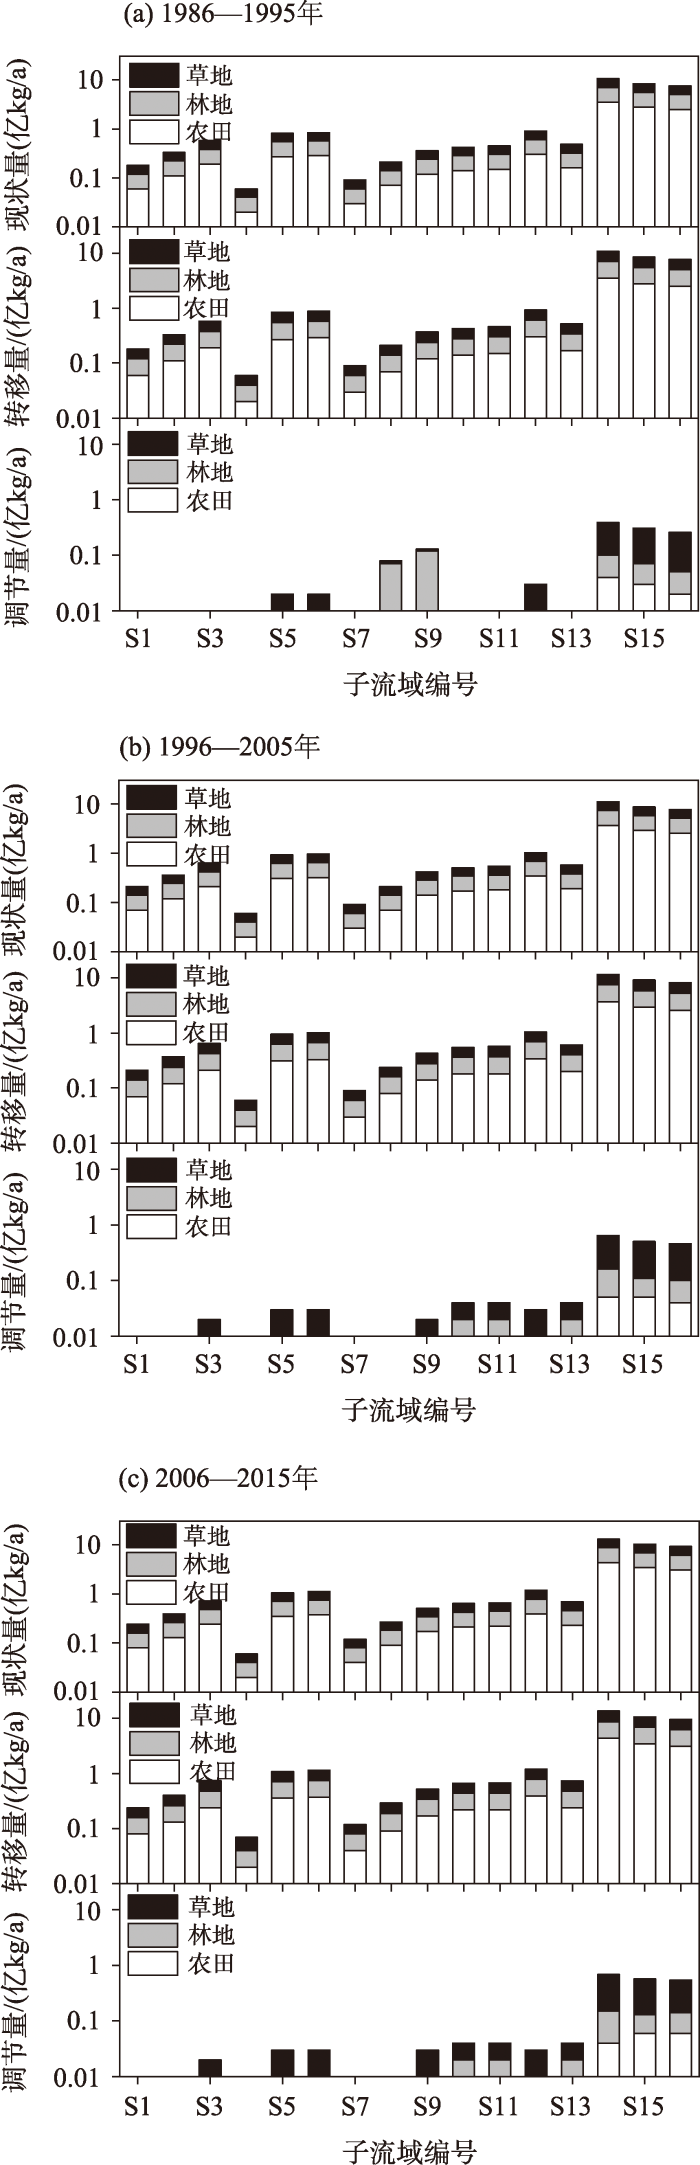
图4
1986—2015年研究区的COD现状量、转移量、调节量
Fig.4
Current amount, transfer amount, and adjusting amount of COD in the study area during 1986-2015
3.2 水生态产品价值量
表2 水生态产品实物量及价值核算
Tab.2
| 核算科目 | 类别 | 核算内容 | 单位 | 1986—1995年 | 1996—2005年 | 2006—2015年 | |
|---|---|---|---|---|---|---|---|
| 水资源供给 | 实物量 | 灌溉供水量 | 亿m3/a | 10.00 | 12.50 | 15.45 | |
| 城市供水量 | 亿m3/a | 5.00 | 6.00 | 7.75 | |||
| 发电供水量 | 亿kWh/a | 50.00 | 50.00 | 57.50 | |||
| 价值量 | 灌溉价值量 | 亿元/a | 1.10 | 1.38 | 1.70 | ||
| 城市供水价值量 | 亿元/a | 14.65 | 17.58 | 22.71 | |||
| 发电价值量 | 亿元/a | 15.00 | 15.00 | 17.25 | |||
| 水资源存储 | 实物量 | 地表水存储量 | 亿m3/a | 3.98 | 3.95 | 3.80 | |
| 土壤水存储量 | 亿m3/a | 16.36 | 24.66 | 30.22 | |||
| 地下水存储量 | 亿m3/a | 24.66 | 22.02 | 24.47 | |||
| 价值量 | 水资源存储价值量 | 亿元/a | 402.74 | 453.07 | 523.50 | ||
| 防洪调蓄 | 实物量 | 防洪库容 | 亿m3/a | 15.91 | 15.91 | 15.91 | |
| 价值量 | 防洪调蓄价值量 | 亿元/a | 142.41 | 142.41 | 142.41 | ||
| 土壤保持 | 实物量 | 农田调节泥沙总量 | 亿kg/a | 0.08 | 0.17 | 0.19 | |
| 林地调节泥沙总量 | 亿kg/a | 0.27 | 0.21 | 0.34 | |||
| 草地调节泥沙总量 | 亿kg/a | 0.26 | 0.27 | 0.58 | |||
| 价值量 | 减少泥沙淤积价值量 | 万元/a | 9.50 | 11.30 | 22.67 | ||
| 减少面源污染价值量(折合氮肥) | 万元/a | 38.66 | 41.83 | 70.99 | |||
| 减少面源污染价值量(折合钾肥) | 万元/a | 42.84 | 46.35 | 78.66 | |||
| 减少面源污染价值量(折合磷肥) | 万元/a | 891.42 | 964.49 | 1660.08 | |||
| 水质净化 | 实物量 | 农田净化COD总量 | 亿kg/a | 0.10 | 0.18 | 0.20 | |
| 林地净化COD总量 | 亿kg/a | 0.38 | 0.39 | 0.27 | |||
| 草地净化COD总量 | 亿kg/a | 0.84 | 1.31 | 1.60 | |||
| 价值量 | 水质净化价值量 | 亿元/a | 28.82 | 41.04 | 45.19 | ||
| 水生态产品价值量总计 | 亿元/a | 604.81 | 670.58 | 752.95 | |||
图5
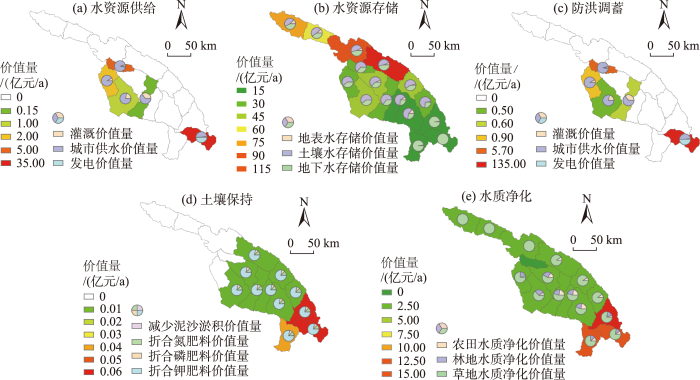
图5
研究区2006—2015年单项水生态产品价值量、组成及空间分布
Fig.5
Value, composition and spatial distribution of individual aquatic ecological products in the study area during 2006-2015
图6
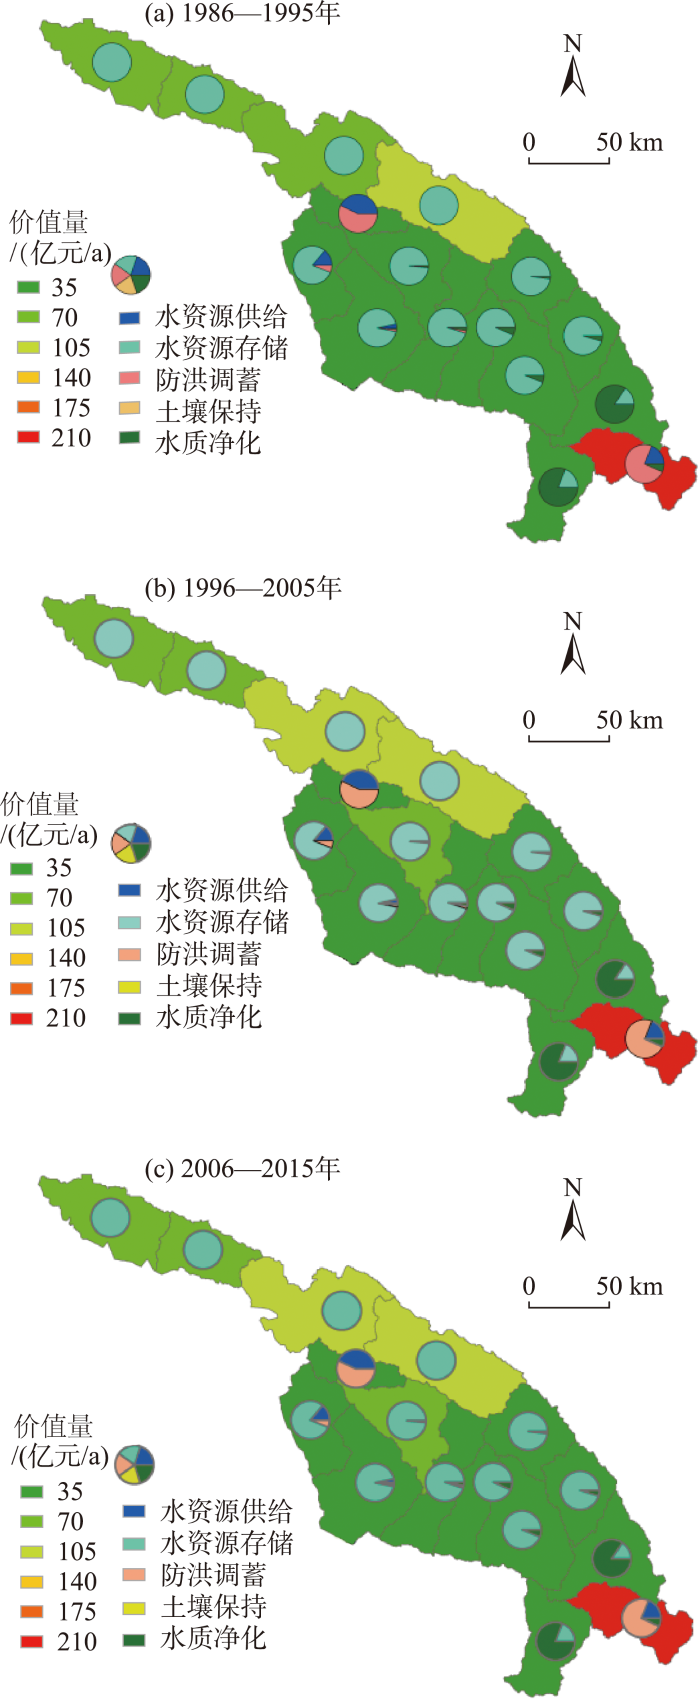
图6
研究区1986—2015年水生态产品总价值量、组成及空间分布
Fig.6
Total value, composition, and spatial distribution of all aquatic ecological products in the study area during 1986-2015
可以看出:
(1) 水资源供给价值量
研究区有5个大中型水库,其水资源供给价值量呈现增加趋势:1986—1995、1996—2015、2006—2015年每10年平均水资源供给价值量分别为30.75亿元/a、33.96亿元/a、41.66亿元/a。研究区水资源供给价值量主要由城市居民供水与发电贡献,农业灌溉所占比重较少。如2006—2015年的水资源供给价值量构成中,灌溉供水、城市供水、发电供水价值量分别为1.70亿元/a、22.71亿元/a、17.25亿元/a。水资源供给价值量的空间分布取决于水库的分布、规模及功能,其中刘家峡水库因居民供水及发电量规模大,其供给价值突出。
(2) 水资源存储价值量
研究区水资源存储总量和价值量呈现增加趋势:1986—1995、1996—2005、2006—2015年10年平均水资源存储量分别为45.00亿m3/a、50.63亿m3/a、58.49亿m3/a,平均水资源存储价值量分别为402.74亿元/a、453.07亿元/a、523.50亿元/a。从空间分布来看,水资源存储总量和价值量区域差异大,从西北到东南,从上游到下游,总体呈减少的趋势。研究区水资源存储价值量由土壤水、地表水及地下水贡献,其对贡献比例有如下趋势:地下水>土壤水>地表水,且从上游到下游,地下水的贡献比重增加,土壤水的贡献先增加后降低,地表水比重总体下降。
(3) 洪水调蓄价值量
研究区有5个大中型水库,库容为0.17~43.00亿m3。2015年洪水调蓄总价值量为142.41亿元/a,其中刘家峡水库所在子流域最高。水库建库后,一般防洪库容较少变化,其他年份的洪水调蓄价值量与基准年2015年视为不变。
(4) 土壤保持价值量
研究区土壤保持价值量呈增大的趋势:1986—1995、1996—2005、2006—2015年土壤保持价值量分别为0.09亿元/a、0.10亿元/a、0.18亿元/a。土壤保持价值包括减少泥沙淤积和减少面源污染,其中,减少面源污染占主导,减少泥沙淤积的贡献较小,占比不到2%。从空间分布来看,从西北到东南,从上游到下游减少泥沙淤积价值量呈增大的趋势。从贡献比例来看,上游和中游是草地和林地占主导,下游则是农田、草地、林地贡献相当。
(5) 水质净化价值量
湟水河流域水质净化价值量总体呈现增大趋势:1986—1995、1996—2005、2006—2015年水质净化价值量分别为28.82亿元/a、41.04亿元/a、45.19亿元/a。从空间分布来看,从西北到东南,从上游到下游水质净化价值量呈增大的趋势。水质净化由水生态系统涉及的农田、林地和草地贡献,其中草地贡献的比例最大,占比63.92%~77.29%。
(6) 价值总量
研究区水生态产品价值总量呈现增加趋势,1986—1995、1996—2015、2006—2015年多年平均水生态产品价值总量分别为604.81亿元/a、670.58亿元/a、752.95亿元/a,2006—2015年比1986—1995年增加了24.49%。研究区水生态产品价值量由水资源供给、水资源存储、洪水调蓄、土壤保持、水质净化贡献,其中水资源存储价值贡献占主导,占比66.59%~69.53%,水库防洪价值次之,占比18.91%~23.54%,水资源供给、土壤保持、水质净化价值贡献小,占比分别为5.08%~5.53%、0.02%、4.77%~6.12%;研究区无水利工程的子流域,水生态产品价值总量从西北到东南,从上游到下游呈减小的趋势,从70亿元/a减少到10亿元/a左右;中上游地区水生态产品价值量主要由水资源存储贡献,占比大于80%,下游主要由水质净化和水库供给、防洪调蓄贡献;由于水库的供水和洪水调蓄功能,水库对应的子流域价值量较高,如刘家峡水电站所在子流域水生态产品价值为160亿元/a~170亿元/a,其中洪水调蓄、供水贡献占比99%。
4 结论与讨论
本文选择黄河上游湟水河流域为典型流域,基于分布式水文、土壤生物地球化学、土壤侵蚀和水质等多过程耦合模拟、情景分析和社会经济调查等手段,核算了流域水生态产品价值量(水资源供给、水资源存量、土壤保持、洪水调蓄和水质净化),系统分析水生态产品组成及时空分布规律。结果表明:
(1) 水生态价值量计算的关键是准确计算水生态实物量。流域水循环多过程模拟可以模拟变化下垫面条件下的生态水文、生物地球化学变化响应能力,可为流域水生态产品价值评估提供尺度统一、时空分异、连续动态、分布式的水文、土壤保持、水质等实物量数据,较通常采用的基于少量观测数据和简单经验公式的方法,能有效反映水生态系统涉及的复杂的物质能量过程及时空格局,核算结果更能反映水生态系统的构成、格局和过程。
(2) 湟水河流域1986—1995年水生态产品总价值量为604.81亿元/a,近几十年来,由于研究区降水量增加、退耕还林还草以及流域生态治理恢复,水生态产品总价值量呈增加趋势,1996—2005、2006—2015年比1986—1995年分别增加了10.87%、24.49%。就各单项水生态产品贡献比重而言,水资源存储占主导,水库防洪价值、水资源供给、水质净化价值次之,土壤保持可忽略,各项所占比例分别为66.59%~69.53%、18.91%~23.54%、5.08%~5.53%、4.77%~6.12%、0.02%。其中水资源存储价值主要由土壤水、地下水存储贡献,地表水存储价值贡献不足10%,因此,在气候变化背景下,开展区域生态治理恢复和可持续利用,提升土壤水、地下水储水能力,是提高水生态产品价值量的关键。就空间分布而言,子流域水生态产品价值量从上游到下游通常呈减小趋势,由70亿元/a降为10亿元/a,个别子流域由于有水利工程,水生态产品价值量显著增加,如湟水河下游的刘家峡水库所在的子流域为160亿~170亿元/a,其洪水调蓄、供水价值占比达99%,因此,从子流域角度出发,充分考虑水生态产品空间分布以及水利工程特征,有针对性地进行水生态产品核算与水生态管理,是实现水生态产品价值的重要要求。
(3) 分布式生态水文模型可以定量描述流域生态水文生物地球化学动态变化过程。但分布式生态水文模型涉及的参数多,物理过程刻画复杂,模型本身存在模型不确定性、参数不确定性等问题,在实际使用过程中需要对模型复杂度、建模数据可获取性、模拟不确定性等多加考虑。
参考文献
生态系统生产总值核算: 概念、核算方法与案例研究
[J].
Gross ecosystem product: Concept, accounting framework and case study
DOI:10.5846/stxb URL [本文引用: 1]
The value of the world's ecosystem services and natural capital
[J].DOI:10.1038/387253a0 [本文引用: 1]
The value of nature and the nature of value
[J].Ecosystems are capital assets: When properly managed, they yield a flow of vital goods and services. Relative to other forms of capital, however, ecosystems are poorly understood, scarcely monitored, and--in many important cases--undergoing rapid degradation. The process of economic valuation could greatly improve stewardship. This potential is now being realized with innovative financial instruments and institutional arrangements.
德清推出“数字两山”GEP核算平台
[EB/OL].
Deqing Launches the "Digital Two Mountains" GEP Accounting Platform
河流生态系统服务研究进展
[J].
DOI:10.11867/j.issn.1001-8166.2018.08.0852
[本文引用: 1]

河流生态系统与人类经济社会发展关系密切,却是目前世界上最受威胁的生态系统类型。生态系统服务研究可为科学利用、保护与管理生态系统提供重要参考。通过系统总结国内外河流生态系统服务研究基础理论、评估框架与技术方法、应用实践等相关成果,指出国内存在基础理论研究薄弱、生态系统服务评估方法体系科学性欠缺、研究成果应用范围狭小等问题,并详细分析了其表现和原因;在此前提下结合研究社会需求及国内外研究动态,指出未来发展方向:将在多学科多尺度融合发展夯实生态系统服务研究基础上,通过全面革新评估框架与技术方法体系探索构建标准化、规范化的生态系统服务评估体系,并开展生态系统服务权衡研究及生态服务商业化运营途径探索,以全方位拓展研究视野,提升成果应用价值。
Research progress, existing problems and fature direction on river ecosystem service
DOI:10.11867/j.issn.1001-8166.2018.08.0852
[本文引用: 1]
River ecosystems are closely linked to human economic and social development, which are the most ecosystems at risk on earth. The research of ecosystem services can provide important scientific references for the ecosystems utilization,protection and management. On basis of summarizing the basic theories,assessment frameworks,technical methods and application practices related with research findings of river ecosystem services both at home and abroad,the existing shortcomings such as weak research foundation,lack of scientific and reasonable methods in ecosystem service evaluation,narrow application scope of the research results were pointed out. In consideration of the needs of society and the research tendency,the future developing directions of river ecosystems service were described: the solid research foundation should be established by multi-disciplinary and multi-scale integrations, the standardized,normalized and scientific evaluation system for ecosystem services shall be built by innovating assessment framework and technical methodology systems comprehensively, the new research areas including trade-offs and commercialization of ecosystem services will be carried out widely to expand our research perspectives and enhance the application values of the results.
水电开发对河流生态系统服务的效应评估与时空变化特征分析: 以武江干流为例
[J].
DOI:10.31497/zrzyxb.20200910
[本文引用: 1]
水电开发对河流生态系统的影响不容忽视,科学评估其影响有助于建立更可持续的水电开发模式。以武江干流为例,利用当量因子法和功能价值评估法,分析了武江干流梯级水电开发对受淹没影响的河岸带陆地生态系统和河流生态系统服务的效益及损失,并就其对河流生态系统服务的综合效应进行了评估。结果显示:武江干流水电开发使受淹没影响的河岸带生态系统和河流生态系统本身的服务价值均出现增加,价值增量主要体现在水文调节、水资源供给等服务方面;武江干流水电开发对河流生态系统服务的正效应大于负效应,正效应主要体现在发电、水文调节、气体调节等方面,负效应主要体现在维持生物多样性、土壤保持等支持服务方面。研究认为不同规模水电站的正负效应侧重点不同,不同流域单位电能的生态损失难以直接横向比较。结合多年来武江鱼类资源跟踪调查数据,分析了鱼类生物损失指数的变化趋势,探讨了水电开发在时间上的累积生态效应及水电服务的空间格局差异。由于生物多样性等服务的影响难以用货币直接衡量,加上水域的单位面积服务价值远高于其他生态用地类型,导致负效应的价值评估偏保守,武江干流水电开发的正负效应之比偏大。
Evaluating the cumulative impacts of the hydropower development on the river ecosystem services in terms of spatial and temporal aspects: A case study in the mainstream of the Wu-jiang River
DOI:10.31497/zrzyxb.20200910
[本文引用: 1]
The impact of hydropower development on river ecosystems cannot be ignored, and scientific evaluation of its impact will contribute to the establishment of a more sustainable hydropower development patterns. In this paper, we analyzed the benefits and losses of the cascade hydropower development in the mainstream of the Wujiang River on the riparian terrestrial ecosystems and river ecosystems by using both equivalent factor and functional value evaluation methods. Based on the benefits and losses, we made a comprehensive evaluation of the cascade hydropower development on the river ecosystem services. The results show that the hydropower development in the mainstream of the Wujiang River increased the values of the riparian terrestrial ecosystem and river ecosystem services, particularly in the hydrological regulating and water supply functions. In addition, positive effects of the development were found on the power generation, hydrological and air regulating functions, while negative effects were observed on biodiversity maintaining and soil conservation. And the positive effects on river ecosystem service are greater than the negative effects. It was difficult to compare directly the ecological losses of unit electrical energy with other basins as different hydropower stations had their own emphasis regarding the positive and negative effects. Based on the long-term survey data of fish resources in the Wujiang River, the trend of fish biological loss index was analyzed to understand temporal cumulative ecological effects of hydropower development. The differences in the spatial pattern of hydropower generation were discussed by using InVEST model. The impact of ecosystem services such as biodiversity was hard to evaluate directly in terms of currency, and the service value per unit area of the water body was considerably higher than that of any other land-use types, which resulted in a conservative, e.g. a low value of negative effects of the hydropower development in the mainstream of the Wujiang River, and a high ratio of positive to negative values.
湖泊生态系统服务功能价值评估: 以太湖为例
[J].
Evaluation of lake ecosystem services: A case study of Taihu Lake
适用于遥感影像的水生态空间多功能分类体系研究
[J].
DOI:10.18306/dlkxjz.2020.03.010
[本文引用: 1]
水生态空间分类体系是研究水生态空间变化的重要前提。目前,水生态空间分类体系一般都基于特定的研究或者管理目的,没有相对统一的划定标准。因此,这些水生态空间分类体系间的可比性及可操作性就存在一定的局限。鉴于此,论文结合遥感观测技术,基于系统论提出了适用于遥感影像的水生态空间多功能分类体系。该分类体系具有一定的理论基础,同时也兼具遥感技术的可操作性和可比性,能为研究水生态空间的面积动态变化提供理论基础和技术保障。此外,研究还结合生产管理经验和专家咨询等方法,建立了适用于Landsat卫星遥感数据的各类水生态空间的解译标志。最后,以中国为例,运用2015年的Landsat卫星遥感数据,划定了中国各类水生态空间的分布,并得到了不同水生态空间类型所占的面积比,这为进一步研究中国水生态空间的演化规律奠定了坚实基础。
Multifunctional classification of aquatic habitats for remote sensing data
DOI:10.18306/dlkxjz.2020.03.010
[本文引用: 1]
Classification is the key to understanding changes in aquatic habitats. Most of the existing classifications were proposed for different purposes such as specific research and management needs and there are no commonly applied criteria for the classification, thus their operability and comparability are limited. Therefore, the purpose of this study was to propose a multifunctional classification system of aquatic habitats that embraces the advantages of remote sensing data based on the system theory, so that the classification can be practical and comparable. Additionally, this study provided the interpreting marks of different types of aquatic habitats for Landsat remote sensing data. Based on the interpreting marks, this study obtained the spatial distribution and areal ratio of different types of aquatic habitat in China by using the Landsat remote sensing data in 2015. The multifunctional classification of aquatic habitats for remote sensing data is the foundation for understanding changes in aquatic habitats.
湖泊型流域水生态功能分区的理论与应用
[J].
DOI:10.18306/dlkxjz.2019.08.005
[本文引用: 1]
地域分异是地理学核心研究方向之一,水生态功能分区是地学分区面向生态环境领域的发展和应用。基于水生态分区的管理是流域水环境管理的趋势,流域水生态功能分区是建立中国新型水环境管理的基础。论文在界定水生态功能分区涉及的主要概念基础上,分析了湖泊型流域水生态系统的尺度,为湖泊型流域水生态功能分区体系的建立奠定了理论基础;根据分区的目的,建立了分区的原则和指标体系,研发了分区技术、结果验证校核方法;以巢湖流域为例,进行了一级至四级水生态功能分区,并对分区结果进行验证。湖泊型流域水生态功能分区有助于丰富地域分异规律研究,对水生态目标管理的理论与方法具有指导作用。
Theory and application of aquatic ecoregion delineation in lake-basin
DOI:10.18306/dlkxjz.2019.08.005
[本文引用: 1]
Spatial differentiation is one of the core research directions of geography. Aquatic ecoregion delineation is the development and application of geographic regionalization in the field of ecological environment. Management based on aquatic ecoregions is the trend of water environmental management in watersheds. Aquatic ecoregion is the foundation of future water environmental management in China. Existing work cannot meet the technical requirements of water quality management for aquatic ecosystem protection. Based on the analysis of the main concepts involved in aquatic ecoregion, this study analyzed the scale of aquatic ecosystem in lake-basins, and laid a theoretical foundation for the delineation of aquatic ecoregion system in lake-basins. Taking the Chao Lake Basin as an example, the method was used to delineate the aquatic ecoregion at four levels, and the results were validated. Aquatic ecoregion delineation of lake-basin is helpful for enriching the study of spatial differentiation of geographical regions, and has important implications for advancing the theory and methods of aquatic ecosystem target management.
湖泊生态服务受益者分析及生态生产函数构建
[J].
Beneficiary analysis and ecological production function to measure lake ecosystem services for decision-making in China
民勤红崖山水库生态系统服务功能的经济价值
[J].
Economic value of ecosystem services of Hongyashan Reservoir in Minqin County, an arid area of China
湿地生态系统服务功能及其价值核算: 以福州市为例
[J].
DOI:10.13287/j.1001-9332.202111.017
[本文引用: 1]
湿地在生态保护和社会发展中占据重要地位,科学合理评估湿地生态系统价值,是湿地保护与合理开发、确保湿地资源可持续性利用的基础。如何科学有效、标准化地评估湿地生态系统生产总值(GEP)并使之纳入国民经济体系核算是科学界和政府部门关注的焦点。本研究构建了湿地生态系统生产总值核算框架体系,并以福州市为研究案例,以多源数据为基础,从功能量与价值量层面,开展了福州市湿地GEP核算研究。结果表明: 2015年,福州市湿地生态系统GEP为2392.33亿元,主要源于湿地的生态调节服务价值(1578.69亿元,占总价值的66.0%),约是产品供给服务价值和精神文化服务价值的2.2和15.6倍。湿地生态调节服务中,以水流动调节服务价值和气候调节服务价值最高,两者占生态调节服务价值的82.9%。福州市湿地单位面积生态调节价值为134.78万元·hm<sup>-2</sup>,高于全国水平。福州市各区县中,闽清县湿地生态系统价值量最大,为888.31亿元,占福州市湿地生态系统产品供给和生态调节总价值量的40.1%。福州市滨海湿地的生态调节服务价值最大,约分别是河流湿地和人工湿地类型的2.5倍。福州市湿地生态系统GEP核算是“绿水青山就是金山银山”理念城市尺度的重要践行,为指导地方政府科学管理湿地生态系统提供了技术支撑。
Wetland ecosystem service function and its value accounting: A case study of Fuzhou City, China
DOI:10.13287/j.1001-9332.202111.017
[本文引用: 1]
Wetland plays an important role in ecological protection and social development. Scientific and rational evaluation of the values of wetland ecosystem service is the basis of protection and sustainable utilization of wetland resources. How to scientifically and effectively assess the wetland ecosystem gross ecosystem product (GEP) and make it into the national GDP accounting system are the focus of the scientific community and government departments. In this study, the accounting framework of wetland ecosystem GEP was constructed. Based on multi-source data and from the aspects of function and value, the accounting of wetland GEP in Fuzhou City was carried out. The results showed that the GEP of wetland ecosystem in Fuzhou City was 239.23 billion yuan in 2015. Such value mainly came from the ecological regulation service value (157.869 billion yuan), which accounted for 66.0% of the total and was about 2.2 and 15.6 times of the product supply service value and cultural service value. Among the ecological regulation services of wetlands, hydrodynamic regulation service and climate regulation service were the highest. Together, they accounted for 82.9% of the ecological regulation service value. The ecological regulation value per unit area of wetland in Fuzhou City was 1347.8 thousand yuan·hm<sup>-2</sup>, which was higher than the mean level of the whole country. In the districts and counties of Fuzhou City, the value of wetland ecosystem in Minqing County was the largest, about 88.83 billion yuan, accounting for 40.1% of the total value of product supply and ecological regulation. In terms of types, coastal wetlands in Fuzhou City had the largest function of ecological regulation services, which was about 2.5 times of that of river wetlands and constructed wetlands. The accounting of GEP of wetland ecosystem in Fuzhou City is an important practice for the conviction of “lucid waters and lush mountains are invaluable assets”, which would provide technical support for guiding local government to scientifically manage wetland ecosystem.
湖南省湿地生态系统服务价值初步评价
[J].
Preliminary evaluation of wetland ecosystem services in Hunan Province
湿地生态系统服务价值能值评估: 以珠江三角洲城市群为例
[J].
Wetland ecosystem services assessment based on emergy: A case of Pearl River Delta urban agglomeration
中国陆地地表水生态系统服务功能及其生态经济价值评价
[J].
Ecosystem services and their valuation of terrestrial surface water system in China
DOI:10.11849/zrzyxb.2003.04.008
[本文引用: 1]
As a special resource,water is essential for all the living things on earth.Chinese ter-restrial surface water ecosystems are classified into four types of rivers,reservoirs,lakes and marshes.According to their features,two kinds of aquatic ecosystem services are identified in this paper:prod uct supply,and environmental and life support services.The product supply and direct value were estimated and evaluated in terms of water supply for daily uses,industial and agricultural and other economic sectors,hydro-power generation,navigation,re creation and tourism,and aquatic products.The supporting services and their ecological economic values were assessed and evaluated in terms of flood control,river sedimentation transport,water resource storage,soil conservation,environmental purification,wild life habitat providing,C fixation,and biodiversity maintenance.The direct values of Chinese terrestrial surface water ecosystem services in2000were estimated as4263.91×10<sup>8</sup> yuan RMB,and indirect values were5546.92×10<sup>8</sup> yuan RMB.The total value was9810.83×10<sup>8</sup> yuan RMB,and was up to10.97%of the GDP of China in2000.Water ecological services play an even more important role in the society than its products.
水生态系统生产总值核算体系及应用
[J].
Accounting system of gross water ecosystem product and its application
水生态产品价值核算与实现研究综述
[J].
Review of the research on the value accounting and realization of aquatic ecological products
水生态产品内涵及其价值解析研究
[J].
Analysis on the connotation and value of water eco-products
关于水生态产品价值实现的若干思考
[J].
Some thoughts on the realization of the value of aquatic ecological products
水库泥沙淤积量计算方法探讨
[J].
Discussion on the calculation method of sediment deposition in reservoirs
A balanced calibration of water quantity and quality by multi-objective optimization for integrated water system model
[J].DOI:10.1016/j.jhydrol.2016.05.001 URL [本文引用: 1]
Integrated water system simulation by considering hydrological and biogeochemical processes: Model development, with parameter sensitivity and autocalibration
[J].
DOI:10.5194/hess-20-529-2016
URL
[本文引用: 1]
. Integrated water system modeling is a feasible approach to understanding severe water crises in the world and promoting the implementation of integrated river basin management. In this study, a classic hydrological model (the time variant gain model: TVGM) was extended to an integrated water system model by coupling multiple water-related processes in hydrology, biogeochemistry, water quality, and ecology, and considering the interference of human activities. A parameter analysis tool, which included sensitivity analysis, autocalibration and model performance evaluation, was developed to improve modeling efficiency. To demonstrate the model performances, the Shaying River catchment, which is the largest highly regulated and heavily polluted tributary of the Huai River basin in China, was selected as the case study area. The model performances were evaluated on the key water-related components including runoff, water quality, diffuse pollution load (or nonpoint sources) and crop yield. Results showed that our proposed model simulated most components reasonably well. The simulated daily runoff at most regulated and less-regulated stations matched well with the observations. The average correlation coefficient and Nash–Sutcliffe efficiency were 0.85 and 0.70, respectively. Both the simulated low and high flows at most stations were improved when the dam regulation was considered. The daily ammonium–nitrogen (NH4–N) concentration was also well captured with the average correlation coefficient of 0.67. Furthermore, the diffuse source load of NH4–N and the corn yield were reasonably simulated at the administrative region scale. This integrated water system model is expected to improve the simulation performances with extension to more model functionalities, and to provide a scientific basis for the implementation in integrated river basin managements.
Diffuse nutrient losses and the impact factors determining their regional differences in four catchments from North to South China
[J].DOI:10.1016/j.jhydrol.2016.10.031 URL [本文引用: 1]
Regional differences of water regulation services of terrestrial ecosystem in the Tibetan Plateau: Insights from multiple land covers
[J].
