

陆地生态系统水循环和碳循环是陆地表层系统物质能量循环的核心,是地球系统各圈层联系的纽带,也是当前生态水文学、全球变化科学和地球系统科学领域的核心主题和研究热点[1⇓⇓⇓-5]。水碳循环是互相耦合的两个最基本的生态学过程,水循环主要包括降水、蒸散发和产汇流等过程,碳循环主要包括植被光合固碳、植被呼吸消耗和凋落物分解等过程[1,6⇓-8]。陆地生态系统的水碳循环对全球变化非常敏感,对气候变化具有强烈的响应和反馈作用,深刻影响着全球和区域的水碳资源的分布格局[7,9⇓⇓-12]。因此,在全球变暖、地球变绿和水资源短缺的背景下[13⇓⇓-16],开展陆地生态系统关键水碳变量的变化特征识别及其驱动力分析的基础工作,对于理解陆地生态系统水碳循环过程和演变机理、支撑区域水碳资源管理、保障区域水资源和生态安全以及缓解全球气候变化等方面具有重要意义。
为了揭示水碳变量的时空变化格局,以及对气候变化的响应,学者们采用了不同的水循环和碳循环的量化指标。水循环方面,降水、蒸散发(evapotranspiration,ET)和径流(runoff,R)是水循环关键环节[17],也是表征陆地水循环过程最常用的水文变量,径流是长期以来最受人类重视和开发利用的传统水资源,而蒸散发是日益受关注的绿水资源,也是联系大气、水文和生态过程的纽带[18⇓-20]。对于碳循环,常用的碳变量是“4P”[21],即总初级生产力(gross primary production,GPP)、净初级生产力(net primary production,NPP)、净生态系统生产力(net ecosystem productivity,NEP)和净生物群区生产力(net biome production,NBP);而最常用来表征水碳耦合关系的变量是水分利用效率(water use efficiency,WUE),WUE是全球水碳循环的核心要素,用于定量表示水、碳通量的比值关系,是定量评价植被固碳效益的耗水代价的关键指标[6,22⇓⇓-25]。水碳变量在不同时空尺度下演变特征各异,且广泛归因于气候要素的变化和人类活动。大量研究集中在ET、GPP等关键水碳变量在全球、国家及区域的变化和归因上[26⇓⇓-29]。例如,全球ET在1982—1997年由于辐射和空气温度的增加呈上升趋势,1998—2008年由于水分供应有限呈下降趋势[30]。全球GPP在1982—2017年呈现出增长趋势,大气CO2浓度对其增加有最大的贡献[31]。在中国,Li等[32]利用4种ET产品分析得出1980—2010年中国东南部ET呈增加趋势,而东北部ET呈减少趋势,降水和饱和水汽压差对其变化起主导作用。Bo等[33]基于最佳光照效率(LUEopt)产品分析得出1982—2015年中国GPP经历了2.268 gC/(m2∙a)的上升趋势,该趋势主要分布在黄河和淮河,气温和叶面积指数在全国范围内起主导作用。总之,ET、GPP等典型水碳变量存在较强的空间异质性和成因差异性,在区域或局地尺度上明析水碳变量的时空变化和控制因子仍然是一个挑战。
黄河是中华民族的母亲河,黄河水源涵养区(包括黄河源区、秦岭、祁连山、六盘山和若尔盖等重点生态安全屏障区)处于黄河流域的西南部,该区是黄河流域重要的生态功能区,也是中国重要的水资源供给区。以往研究对于黄河水源涵养区的界定更集中在黄河源区和上游水源涵养区[34-35],主要针对三江源[36]、祁连山和若尔盖重点生态功能区,而秦岭北麓的渭河南部山区支流流域和秦岭东麓余脉所至的伊洛河流域对黄河水源涵养的重要作用并未受到足够重视,并未将渭河南部山区支流流域和伊洛河流域统一纳入黄河水源涵养区范围内开展系统完整的综合研究。整个黄河水源涵养区生态系统脆弱,对气候变化和人类活动的响应十分敏感,近30年来,该区经历了显著的气候变化和下垫面覆被变化[37⇓-39],对水碳循环产生了显著的影响,以往对于黄河流域以及重要的黄河水源涵养区的水碳循环研究侧重于对单个或者少数几个水、碳变量的研究[40⇓⇓-43],而对多个水碳变量综合研究较少;对流域整体尺度变化特征分析多[44-45],而对更细致的分区及网格尺度变化特征分析不够。因此,开展变化环境下的黄河水源涵养区的水碳变量的时空演变特征及其归因研究,对黄河流域“双碳”战略的科学实施、水碳资源综合管理和有效缓解气候变化等方面具有重要意义。
综上,本文全面考虑黄河流域重点生态功能区所及范围,将秦岭北麓渭河南部山区支流流域和秦岭东麓伊洛河流域统一纳入黄河水源涵养区范围,以地理位置彼此相连且具有重要水源涵养和生态保护功能的黄河水源涵养区作为研究区,在研究区整体、分区和栅格单元尺度上分别采用多种统计方法对多个关键水碳变量的时空变化特征及其变化趋势进行对比分析,然后综合使用地理探测器和偏相关分析法对驱动水碳变量的多个气候因子和下垫面因子进行归因探测分析。本文研究结果期望能为理解黄河流域水碳循环演变过程与机理、评估生态系统的固碳能力、保障黄河流域水资源和生态安全等提供一定的科学参考。
1 研究区概况与数据来源
1.1 研究区概况
黄河水源涵养区位于32°~39°N、96°~114°E之间,具体包括自西向东方向地理位置相互连接的三大区域(图1),即Ⅰ区(黄河上游水源区,指兰州以上流域)、Ⅱ区(渭河南部山区支流区,指渭河华县以上流域,不含泾河,以下简称为“渭河南部山区”)和Ⅲ区(伊洛河区)。黄河水源涵养区地跨青海、四川、甘肃、宁夏、陕西和河南六省,东西长约1550 km,南北宽约710 km,面积约为28.68万km2,其中I区、Ⅱ区和Ⅲ区的面积(面积占比)分别为21.76万km2(75.9%)、5.11万km2(17.8%)和1.81万km2(6.3%)。整个黄河水源涵养区约占黄河流域总面积的38%,贡献了黄河流域约84%的河川年均径流量[46]。研究区地势西高东低,跨越两大阶梯,海拔高程悬殊,高程在92~6174 m之间。该区自西向东横跨半干旱区和半湿润区,即I区处于半干旱区,II区和III区处于半湿润区。I区为青藏高原高寒气候,其余区域为温带季风气候,夏季高温多雨,冬季寒冷干燥,多年平均降水量和气温都呈由东南向西北递减的特征,其中雨期集中在6—9月。研究区内支流众多,主要的支流有白河、隆务河、庄浪河、大夏河、洮河、湟水、北川河、大通河、沣河、灞河、伊河和涧河等。
图1

图1
黄河水源涵养区和三大分区的地理位置及DEM
Fig.1
Geographical location and digital elevation model (DEM) of the water conservation zone of the Yellow River and its three subregions
1.2 数据来源与处理
1.2.1 水碳变量数据
为了避免因数据来源不同可能造成的分析误差,确保GPP、NPP、ET、WUE和CUE之间的数据同源性、内部时空一致性和趋势分析的准确性等,需要一套同时考虑GPP、NPP和ET的同源数据集。本文在综合比选国际国内多套产品数据集的基础上[49⇓⇓⇓-53],采用中国科学院生态环境研究中心联合国际和国内多家机构共同研发的中国生态系统变量数据集(2001—2018年)[54](
径流是黄河水源涵养区的关键水文变量,是黄河水源涵养区产水量和产水能力的直接表征。综合考虑到水碳变量栅格尺度空间匹配的实际需求、径流数据的可获取性、径流还原还现不准造成的误差、水文测站空间代表性的局限以及为更好地反映该区域的天然水文过程等原因,本文选用的径流数据来源于中国天然径流量格点数据集CNRD v1.0 (1961—2018年)[55](
1.2.2 影响因素数据
影响因素数据包括:降水(P)、气温(T)、饱和水汽压差(VPD)、相对湿度(RH)、净辐射(RN)、风速(U)和叶面积指数(LAI)数据。其中,降水、气温(包含计算饱和水汽压差所需的最高和最低气温)、相对湿度和风速数据均来源于国家地球系统科学数据中心(
2 研究方法
2.1 趋势分析
2.2 水碳变量的影响因素分析
地理探测器是探测空间分异性以及揭示其背后驱动力的一组统计学方法[63]。本文采用模型中的因子探测部分,通过研究因变量水碳变量Y的空间异质性,定量探测7个影响因素X对各水碳变量的解释力q。q值越大,则该因子对水碳变量的影响越大。公式如下:
式中:
一般的,假设有
式中:
3 结果与分析
3.1 黄河水源涵养区水碳变量的时间变化特征
黄河水源涵养区2001—2018年期间的水碳变量的时间演变特征如图2所示。总体而言,黄河水源涵养区及其3个分区的水碳变量的多年均值和年际变化均存在较大差异。就多年均值而言,碳变量(GPP、NPP)和水碳耦合变量(WUE)多年均值分别为701 g C/m2、327 g C/m2和1.37 g C/kg,大小顺序均为III区(伊洛河区)>II区(渭河南部山区)>I区(黄河上游水源区),呈自东向西减少的空间格局,碳利用效率(CUE)多年均值为0.41,三大分区的CUE多年均值大小顺序为II区(0.59)>III区(0.54)>I区(0.35),全区及三大分区ET和R的多年均值相差不大。可以看出,在三大分区水平上,碳变量和水碳耦合变量相较于水变量具有更强的分区异质性。就年际变化而言,碳利用效率和水分利用效率多年来变化不明显,且除了碳利用效率外,其余水碳变量变化趋势均为上升趋势,其中,全区及三大分区的GPP、NPP均为显著增加趋势,趋势大小顺序均为II区、III区>I区、全区;全区ET、R分别以1.45 mm/a、5.87 mm/a的速率呈显著增加趋势,而三大分区的变化趋势及其显著性差别较大。
图2
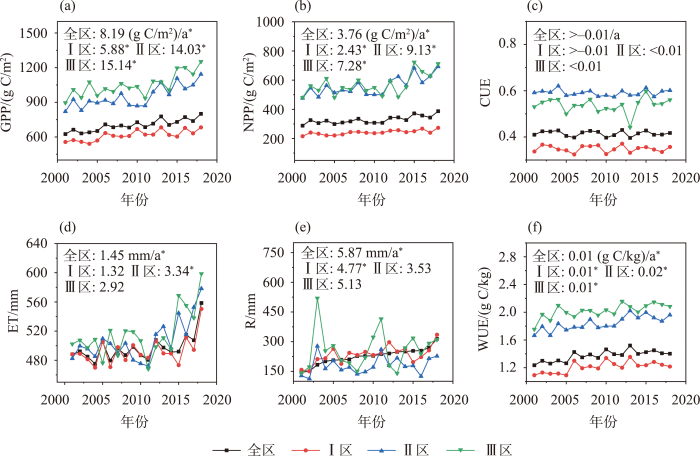
图2
黄河水源涵养区水碳变量年际变化及其Sen's斜率的显著性
注:*表示水碳变量Sen's斜率通过0.05显著性水平检验。下同。
Fig.2
Interannual variation of water and carbon variables and their Sen's slope significance in the water conservation zone of the Yellow River
3.2 黄河水源涵养区水碳变量的空间分布特征
2001—2018年期间,黄河水源涵养区全区及分区水碳变量的空间分布和空间变化趋势具有明显的空间异质性。就空间分布而言(图3),碳变量(GPP、NPP、CUE)和水碳耦合变量(WUE)总体上呈现出由东南向西北递减的变化格局,其中,全区范围内多年平均GPP和WUE的分布格局相似,高值区主要分布在II区(渭河南部山区)中下段和III区(伊洛河区)的上段,中值广泛分布在全区,低值主要分布在I区(黄河上游水源区)的西北部;水变量(ET和R)大致呈现出南部和西北部高、中部低的空间分布格局,且呈聚集态分布,不同等级值之间界限较明显。多年平均ET高值(>504 mm)的栅格数量占全区栅格总数的比例为55%,主要分布在I区、II区和III区的南部。多年平均径流R的低值(≤216 mm)主要分布在I区中北部和II区。此外,在栅格尺度上,碳变量和水碳耦合变量的空间分布相较于水变量具有更强的异质性,尤其在I区。
图3
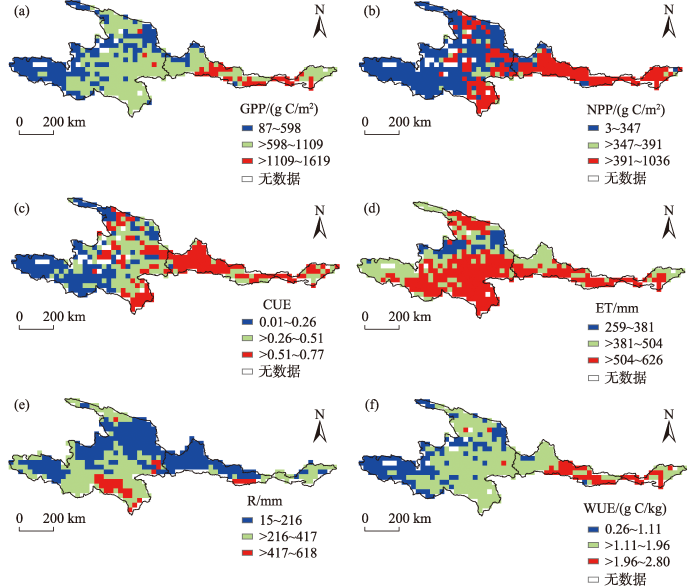
图3
黄河水源涵养区水碳变量的多年平均空间分布格局
Fig.3
Spatial distribution of interannual average water and carbon variables in the water conservation zone of the Yellow River
就空间变化趋势而言(图4),各水碳变量在研究区内的主导变化趋势为上升趋势,GPP、NPP、CUE、ET、R和WUE的上升趋势所占研究区面积比例分别为92%、68%、41%、85%、80%和88%,且绝大多数水碳变量的显著上升趋势主要分布于研究区西部的I区。具体到各个水碳变量,GPP和WUE在全区的变化趋势主要为显著上升趋势,占全区比例分别为66%、54%,该上升趋势在三大分区中分布均匀。NPP和CUE的变化趋势中面积占比最大的均为不显著上升趋势,在研究区分布相似且在I区分布面积最大。ET的不显著上升趋势分布范围最广,约占55%,在三大分区中所占面积比例相近。径流R在全区主要表现为不显著上升趋势和显著上升趋势,两者所占面积比例分别为39%和41%,其中显著上升趋势主要分布在I区,不显著上升趋势则分布在II区和III区。
图4
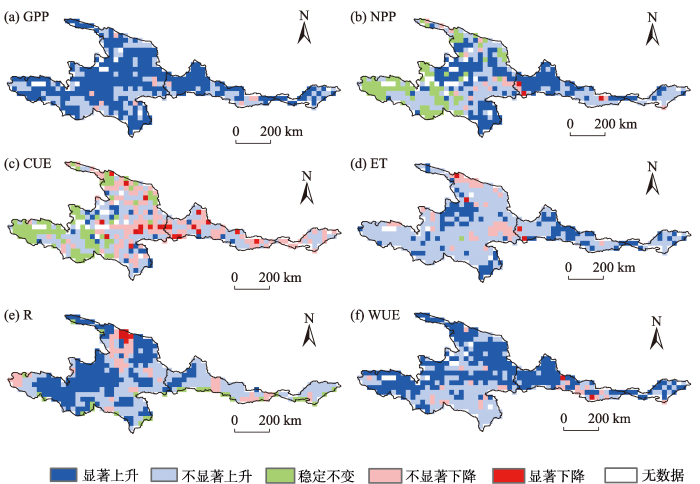
图4
黄河水源涵养区水碳变量变化趋势的空间分布格局
Fig.4
Spatial distribution of variation trend of water and carbon variables in the water conservation zone of the Yellow River
3.3 黄河水源涵养区驱动因素的变化特征
为掌握黄河水源涵养区环境驱动因素的变化,同时定性探究驱动因素与水碳变量之间的同步关系,考虑到水碳变量单位不一致,故将驱动因素与归一化后的水碳变量做双Y轴曲线对比,如图5所示。研究区各驱动因素变化趋势和波动幅度有明显差异,除VPD和RN外,其余驱动因素呈上升趋势;各驱动因素在波动中和不同的水碳变量呈现近似的变化规律,其中,黄河水源涵养区降水P多年均值为570 mm,波动幅度较大,波动区间为493~657 mm,呈不显著上升趋势,P与ET的变化相似;气温T多年均值为1.87 ℃,变动区间1.31~2.25 ℃,呈不显著上升趋势,T与GPP和WUE的变化相似,高峰出现时间一致;叶面积指数LAI多年均值为0.81,波动区间为0.70~0.91,呈现显著上升趋势,与GPP、WUE和ET的变化相似。
图5

图5
黄河水源涵养区驱动因素与归一化水碳变量的变化
注:左侧纵坐标驱动因素指P、T、VPD、RH、RN、U、LAI,右侧纵坐标水碳变量包括GPP、NPP、CUE、R、ET、WUE。
Fig.5
Variations of driving factors and normalized water and carbon variables in the water conservation zone of the Yellow River
3.4 黄河水源涵养区全区及分区尺度水碳变量变化的驱动力分析
在观察分析环境驱动因素与水碳变量之间的同步变化关系的基础上,采用地理探测器对黄河水源涵养区全区整体尺度的各水碳变量空间分异的驱动因子进行定量探测,结果如图6所示。黄河水源涵养区各水碳变量之间的驱动因子的大小顺序和多年变化趋势不同,但单个水碳变量自身驱动因子的大小顺序并未发生根本改变。具体到各个水碳变量,对于碳变量,GPP驱动因子多年平均q值范围为0.20~0.76,q值大小排名靠前的是:LAI (0.76)>T (0.41)>P (0.40)。NPP的各驱动因子多年平均q值为0.11~0.58,q值较大的是:T (0.58)>VPD (0.42)>LAI (0.36)。CUE的主要驱动因子q值为:T (0.61)>VPD (0.52)>RN (0.19)。对于水变量,ET的主要驱动因子多年平均q值为:LAI (0.77)>RH (0.61)>P (0.54)。R的主要驱动因子q值为:P (0.49)>RH (0.39)>VPD (0.31)。水碳耦合变量WUE的主要驱动因子q值为:LAI (0.59)>T (0.55)>VPD (0.31)> P (0.28)。此外,P对水碳变量变化的驱动力(q值)大致处于下降趋势,而T和VPD的驱动力(q值)大致处于上升趋势。
图6
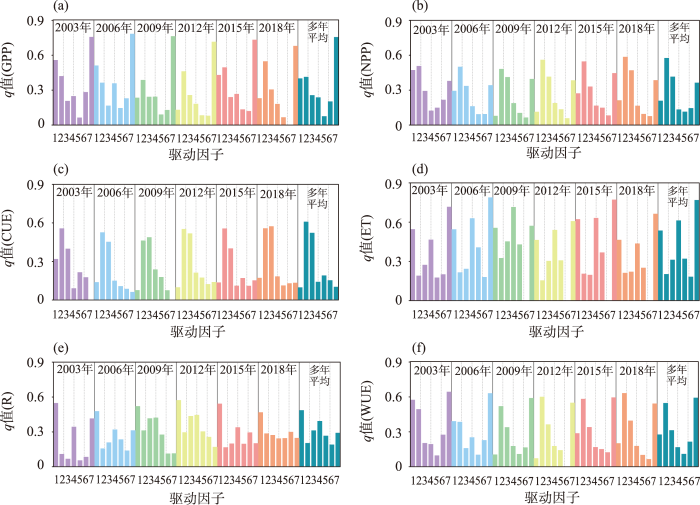
图6
黄河水源涵养区全区尺度的水碳变量变化驱动因子q值
注:横坐标驱动因子中1、2、3、4、5、6、7分别代表降水、温度、饱和水汽压差、相对湿度、净辐射、风速、叶面积指数。
Fig.6
q-values of the driving factors of change of water and carbon variables in the whole water conservation zone of the Yellow River
进一步采用偏相关分析法对研究区内逐个栅格的水碳变量变化的驱动因素开展分析,根据偏相关系数大小处理得到驱动研究区栅格水碳变量变化的主导因子的空间分布(图7),在全区和3个分区尺度分别统计主导因子的栅格面积比例,从而判别出各水碳变量变化的主导因子(表1)。总体而言,栅格尺度上驱动黄河水源涵养区水碳变量变化的主导因子分布面积存在差异,碳变量和水碳耦合变量主要受到LAI的影响,水变量主要受到P和RN的影响。具体到各个水碳变量,驱动黄河水源涵养区GPP(图7a)和WUE(图7f)的主导因子较为单一且空间分布格局相似,全区GPP和WUE受LAI主控的面积比例分别为97%和95%,且LAI对GPP和WUE均为正向驱动作用(表1),同时在三大分区分布较均匀。驱动研究区NPP(图7b)和CUE(图7c)变化的主导因素较为复杂、空间分异性强,但全区主要受LAI主导,所占面积比例分别为50%、26%,其中NPP的LAI主导区集中分布在II区的上段,占II区面积比例为74%。各影响因素与ET的偏相关系数均为正(表1),其主要受到RN和P的影响(图7d),两者主导区所占面积比例分别为52%和21%,ET的P主导区主要分布在I区的东北部和西部,ET的RN主导区则广泛分布在I区的南中北部、II区的中下段和III区。径流R(图7e)在黄河水源涵养区内主要受到P的影响,径流的P主导区占全区比例为65%,主要分布在I区的南部、II区和III区。可以看出,研究区II区和III区影响水碳变量变化的主导因子较I区更单一。
图7

图7
黄河水源涵养区和三大分区的水碳变量变化主导驱动因子的空间分布及其栅格面积比例
注:灰色部分为水碳变量和各驱动因子偏相关系数相同的地方。
Fig.7
Spatial distribution and corresponding grid area proportions of the dominant driving factors of change of water and carbon variables in the water conservation zone of the Yellow River and its three subregions
表1 黄河水源涵养区水碳变量变化的主导驱动因子的偏相关系数及其栅格面积比例
Tab.1
| 水碳变量 | 驱动因子 | |||||||
|---|---|---|---|---|---|---|---|---|
| P | T | VPD | RH | RN | U | LAI | ||
| GPP | 系数 | — | 0.51~0.97 | — | 0.62~0.97 | 0.53~0.97 | — | 0.51~0.97 |
| 比例/% | — | 0.24 | — | 0.24 | 2.38 | — | 97.14 | |
| NPP | 系数 | -0.68~0.92 | -0.59~0.93 | -0.51~0.93 | -0.56~0.93 | -0.64~0.93 | -0.58~0.93 | -0.62~0.93 |
| 比例/% | 7.12 | 2.24 | 8.24 | 12.36 | 13.11 | 6.74 | 50.19 | |
| CUE | 系数 | -0.68~0.84 | -0.60~0.93 | -0.64~0.93 | 0.50~0.93 | -0.64~0.93 | -0.80~0.93 | -0.89~0.93 |
| 比例/% | 11.55 | 4.78 | 10.36 | 21.91 | 15.54 | 10.36 | 25.50 | |
| ET | 系数 | 0.50~0.94 | 0.54~0.94 | 0.53~0.91 | 0.54~0.94 | 0.52~0.97 | -0.61~0.97 | 0.51~0.97 |
| 比例/% | 21.30 | 1.67 | 0.48 | 6.46 | 51.67 | 1.20 | 17.22 | |
| R | 系数 | -0.50~0.96 | -0.70~0.96 | -0.58~0.96 | -0.52~0.96 | -0.68~0.96 | -0.84~0.96 | -0.68~0.92 |
| 比例/% | 65.46 | 6.08 | 0.28 | 8.01 | 5.25 | 3.59 | 11.33 | |
| WUE | 系数 | -0.58~0.98 | — | -0.80~0.98 | — | -0.70~0.98 | -0.53~0.98 | 0.50~0.98 |
| 比例/% | 0.49 | — | 0.98 | — | 1.72 | 2.21 | 94.60 | |
注:“—”代表该驱动因子不是对应水碳变量的主导驱动因子。
4 结论与讨论
本文以黄河生态保护和高质量发展战略为导向,将秦岭和六盘山所在的渭河南部山区流域和伊洛河流域共同纳入黄河水源涵养区,并以“水碳变量时空变化特征—驱动因素的变化特征—驱动因素驱动力定量探析”为主线研究思路对2001—2018年黄河水源涵养区全区、分区和栅格尺度上水碳变量的时空演变特征及其可能成因进行了分析,得出以下结论:
(1) 黄河水源涵养区全区及分区的水碳变量总体呈现波动上升趋势、空间分异性强。碳变量(GPP、NPP、CUE)主要表现为上升趋势,说明黄河水源涵养区植被增加明显、生态系统固碳能力增强、生态保护成效显著;全区及分区的水变量(ET、R)呈上升趋势,且水分利用效率WUE明显增强;全区碳变量和水碳耦合变量总体上呈现出由东南向西北递减的变化格局,水变量大致呈现出南部和西北部高、中部低的空间分布格局,但无论是分区还是栅格尺度,碳变量和水碳耦合变量相较于水变量的空间异质性更强。
(2) 2001年以来,全区及分区的水碳变量时空变化主要受气候中的水热条件因子和下垫面因子的影响。驱动黄河水源涵养区全区水碳变量GPP、NPP、CUE、ET、R和WUE的最强主导因子(驱动力q值)分别为:LAI (0.76)、T (0.58)、T (0.61)、LAI(0.77)、P (0.49)和LAI (0.59),影响因子驱动力大小的逐年相对次序并未发生根本改变,但P对水碳变量变化的驱动力呈下降趋势,而T和VPD对水碳变量变化的驱动力则处于上升趋势;分区及栅格尺度上,除GPP和WUE外,其余水碳变量主导因子较为复杂、空间异质性强,尤其在I区,但总体而言,碳变量和水碳耦合变量受LAI主导的范围最大,且LAI在栅格尺度上对GPP和WUE均为正向驱动作用,水变量ET、R分别受净辐射RN、P主导的范围最大。
研究黄河水源涵养区水碳变量变化及其驱动因素对理解黄河流域水碳循环演变过程与机理、保障水资源和生态安全以及支撑水碳资源综合管理等具有重要意义。本文遵循的主线研究思路,对于大江大河水源涵养区、流域或区域水碳变量的相关研究具有一定的科学借鉴意义。本文在驱动因素驱动力定量探析方法方面,将地理探测器在全区尺度空间分异性归因的优势和偏相关分析在逐栅格单元归因上的优势相互结合,很好地定量辨析了不同空间尺度的主导驱动力及其差异。同时,多尺度水碳变量变化及其主导驱动因素的结果均揭示了显著的空间分异性,说明开展分区尺度的水碳效应研究是非常必要的,这对于黄河水源涵养区水碳资源保护的“分区施策”和“因地制宜”的管理政策制定是有实际价值的。但是,本文在水碳变量时空分辨率、驱动因子选取的全面性、下垫面因素的考虑和水碳变量变化的未来预估等方面还存在不足,今后将获取更高精度的水碳变量数据开展季节和月尺度的水碳变量演变分析,继续收集更多长序列、详实可靠的驱动因素数据开展更加综合全面的归因分析。此外,在国家“双碳”战略、水安全战略及黄河生态保护和高质量发展战略背景下,继续深入研究黄河水源涵养区植被水碳效应,定量评估不同下垫面覆被类型的水碳变量差异,科学解析植被固碳和耗水之间的合理阈值,采用生态水文模型等手段定量预测水碳变量的未来情势等均是下一步迫切需要开展的核心工作。
参考文献
陆地生态系统水—碳耦合循环与过程管理研究
[J].
DOI:10.11867/j.issn.1001-8166.2004.05.0831
[本文引用: 2]

陆地生态系统的水循环与碳循环是地球表层系统物质循环与能量交换的核心,也是最基本的耦合的两个生态学过程。区域或全球尺度生态系统的水管理与碳管理是全球变化科学与可持续发展研究的两大主题,是人类维持全球生态系统的物质与能量循环、自然资源循环再生的重要生态学途径。我们在综合评述现代应用生态学研究的发展趋势,陆地生态系统水和碳循环与生态系统管理关系的基础上,提出了陆地生态系统水循环与碳循环过程管理的内容与思路,阐述了生态系统水和碳耦合循环机制与模拟综合研究的新设想。
Study on the coupling cycle of water-carbon and process management in terrestrial ecosystem
气候变化对我国水资源影响研究面临的机遇与挑战
[J].
Opportunity and challenge of the climate change impact on the water resource of China
生态水文学兴起: 学科理论与实践问题的评述
[J].
Ecohydrology on the upsurge: History and prospect of its theory and application
中国陆地生态系统通量观测研究网络(China FLUX)的主要进展及发展展望
[J].
DOI:10.11820/dlkxjz.2014.07.005
[本文引用: 1]
基于微气象学理论的涡度相关通量观测技术实现了对生态系统尺度的生产力、能量平衡和温室气体交换等功能和过程的直接测定,特别是全球尺度通量塔观测网络的联合观测是实现从生态现象观察和生态要素观测跨越到全球尺度生态系统功能状态变化观测的重大突破。本文回顾了中国陆地生态系统通量观测研究网络(ChinaFLUX)的创建及发展历程,系统介绍了ChinaFLUX的科学目标和设计理念、观测技术体系、观测数据的标准化处理及长期积累;综合评述了ChinaFLUX在陆地生态系统碳—氮—水的收支评估和交换过程的环境响应、碳通量时空格局及其形成机制等方面所取得的主要研究进展。最后,在探讨未来全球尺度通量塔观测网络发展趋势的基础上,提出了ChinaFLUX的主要发展方向、关键科学问题与未来工作重点,为中国通量观测研究事业的进一步发展提供理论参考。
Progresses and prospects of Chinese terrestrial ecosystem flux observation and research network (China FLUX)
DOI:10.11820/dlkxjz.2014.07.005
[本文引用: 1]
Eddy Covariance technique (EC) achieves the direct measurement of system functions and processes such as plant productivity, energy balance, and greenhouse gas exchange at ecosystem scale. Coordinated observation through the global flux observation network represents a breakthrough from the observation of ecological phenomena and factors to the measurement of changes in functions of the global ecosystem. This paper first reviews the foundation and development of the Chinese terrestrial ecosystem flux observation and research network (ChinaFLUX). It then systematically introduces the scientific objectives, design concept, measurement system, standardization of observed data, and long-term data accumulation of the network. The paper also assesses the main progresses in research of terrestrial carbon-water-nitrogen budgets, environmental responses of the coupled ecosystem carbon-nitrogen-water cycles, and the spatiotemporal patterns of ecosystem carbon fluxes and mechanisms. Based on an analysis of the trend of development and emerging missions of the global flux network, this paper proposes the directions, key scientific questions and emphases of research of ChinaFLUX to provide references for the development of flux observation and research in China.
陆地水—碳耦合模拟研究进展
[J].
Research advances in simulating land water-carbon coupling
The increasing demand of adaptive management of land, forest, and water resources under the background of global change and water resources crisis has promoted the comprehensive study of coupling ecosystem water and carbon cycles and their restrictive relations. To construct the water-carbon coupling model and to approach the ecosystem water-carbon balance and its interactive response mechanisms under climate change at multiple spatiotemporal scales is nowadays a major concern. After reviewing the coupling relationships of water and carbon at various scales, this paper explored the implications and estimation methods of the key processes and related parameters of water-carbon coupling, the construction of evapotranspiration model at large scale based on RS, and the importance of this model in water-carbon coupling researches. The applications of assimilative multivariate data in water-carbon coupling researches under future climate change scenarios were also prospected.
陆地生态系统碳水循环的相互作用及其模拟
[J].
Interactions between terrestrial ecosystem water and carbon cycles and their simulation methods: A review
陆地生态系统碳—水耦合机制初探
[J].
A review on the coupled carbon and water cycles in the terrestrial ecosystems
陆地生态系统碳水通量特征研究进展
[J].
Review on research and development of carbon and water fluxes characteristics in terrestrial ecosystem
Robust responses of the hydrological cycle to global warming
[J].
DOI:10.1175/JCLI3990.1
URL
[本文引用: 1]
Using the climate change experiments generated for the Fourth Assessment of the Intergovernmental Panel on Climate Change, this study examines some aspects of the changes in the hydrological cycle that are robust across the models. These responses include the decrease in convective mass fluxes, the increase in horizontal moisture transport, the associated enhancement of the pattern of evaporation minus precipitation and its temporal variance, and the decrease in the horizontal sensible heat transport in the extratropics. A surprising finding is that a robust decrease in extratropical sensible heat transport is found only in the equilibrium climate response, as estimated in slab ocean responses to the doubling of CO2, and not in transient climate change scenarios. All of these robust responses are consequences of the increase in lower-tropospheric water vapor.
Forests and climate change: Forcings, feedbacks, and the climate benefits of forests
[J].
DOI:10.1126/science.1155121
PMID:18556546
[本文引用: 1]
The world's forests influence climate through physical, chemical, and biological processes that affect planetary energetics, the hydrologic cycle, and atmospheric composition. These complex and nonlinear forest-atmosphere interactions can dampen or amplify anthropogenic climate change. Tropical, temperate, and boreal reforestation and afforestation attenuate global warming through carbon sequestration. Biogeophysical feedbacks can enhance or diminish this negative climate forcing. Tropical forests mitigate warming through evaporative cooling, but the low albedo of boreal forests is a positive climate forcing. The evaporative effect of temperate forests is unclear. The net climate forcing from these and other processes is not known. Forests are under tremendous pressure from global change. Interdisciplinary science that integrates knowledge of the many interacting climate services of forests with the impacts of global change is necessary to identify and understand as yet unexplored feedbacks in the Earth system and the potential of forests to mitigate climate change.
Dynamic responses of terrestrial ecosystem carbon cycling to global climate change
[J].
气候变化科学方面的几个最新认知
[J].
Several new understandings in the climate change science
Global water resources: Vulnerability from climate change and population growth
[J].
DOI:10.1126/science.289.5477.284
PMID:10894773
[本文引用: 1]
The future adequacy of freshwater resources is difficult to assess, owing to a complex and rapidly changing geography of water supply and use. Numerical experiments combining climate model outputs, water budgets, and socioeconomic information along digitized river networks demonstrate that (i) a large proportion of the world's population is currently experiencing water stress and (ii) rising water demands greatly outweigh greenhouse warming in defining the state of global water systems to 2025. Consideration of direct human impacts on global water supply remains a poorly articulated but potentially important facet of the larger global change question.
Future global streamflow declines are probably more severe than previously estimated
[J].DOI:10.1038/s44221-023-00030-7 [本文引用: 1]
Characteristics, drivers and feedbacks of global greening
[J].
“绿水”与节水: 中国水资源内涵问题讨论
[J].
Green water and water saving: Discussion on the connotation of water resources in China
The ethics of socio-ecohydrological catchment management: Towards hydrosolidarity
[J].
DOI:10.5194/hess-6-1-2002
URL
[本文引用: 1]
. This paper attempts to clarify key biophysical issues and the problems involved in the ethics of socio-ecohydrological catchment management. The issue in managing complex systems is to live with unavoidable change while securing the capacity of the ecohydrological system of the catchment to sustain vital ecological goods and services, aquatic as well as terrestrial, on which humanity depends ultimately. Catchment management oriented to sustainability has to be based on ethical principles: human rights, international conventions, sustaining crucial ecological goods and services, and protecting ecosystem resilience, all of which have water linkages. Many weaknesses have to be identified, assessed and mitigated to improve the tools by which the ethical issues can be addressed and solved: a heritage of constraining tunnel vision in both science and management; inadequate shortcuts made in modern scientific system analyses (e.g. science addressing sustainability issues); simplistic technical-fix approaches to water and ecosystems in land/water/ecosystem management; conventional tools for evaluation of scientific quality with its focus on “doing the thing right” rather than “doing the right thing”. The new ethics have to incorporate principles that, on a catchment basis, allow for proper attention to the hungry and poor, upstream and downstream, to descendants, and to sites and habitats that need to be protected. Keywords: catchment, hydrosolidarity, ecosystem, water determinants, resilience, green water, blue water, sustainability science\n
Simplified modeling of catchment-scale evapotranspiration via boundary condition switching
[J].DOI:10.1016/j.advwatres.2014.04.008 URL [本文引用: 1]
生物生产力的“4P”概念、估算及其相互关系
[J].
Implications and estimations of four terrestrial productivity parameters
生态系统水分利用效率研究进展
[J].
Ecosystem level water use efficiency: A review
Increase in forest water-use efficiency as atmospheric carbon dioxide concentrations rise
[J].DOI:10.1038/nature12291 [本文引用: 1]
无定河流域土地覆被空间分异机制及相关水碳变量变化
[J].
Spatial differentiation mechanism of land cover and related changes in water-carbon variables in Wuding River Basin
下垫面因素对喀斯特地区水分利用效率的影响
[J].
DOI:10.18306/dlkxjz.2021.12.009
[本文引用: 1]
水分利用效率是衡量陆地生态系统对气候变化响应的重要指标,而下垫面因素通过影响局部气候进而影响水分利用效率。喀斯特地区生态缺水严重且下垫面情况复杂,但目前该区域多个下垫面因素对水分利用效率的综合影响仍不明晰。论文利用MODIS GPP和ET数据集计算中国西南喀斯特地区的水分利用效率,结合岩性组合、土壤类型、土地利用类型及地表粗糙度,采用广义线性模型,揭示了下垫面因素对水分利用效率的综合影响。结果表明:研究区水分利用效率受海拔和喀斯特发育程度综合影响,在空间上从东南向西北逐渐升高。下垫面因素中岩性组合对水分利用效率的影响表现出了喀斯特与非喀斯特地区的差异,喀斯特地区的碳酸盐岩岩性组合对水分利用效率呈负向影响,纯喀斯特岩性组合比非纯喀斯特岩性组合负向影响更强;土壤类型对水分利用效率的影响受分布海拔高度差异、土壤有机质差异及喀斯特与非喀斯特地貌差异3种因素影响;土地利用类型总体上呈植被越茂盛的地类对水分利用效率的正向影响越强的趋势;地表粗糙度的增大先对水分利用效率趋正向影响,后趋于负向影响。碳酸盐岩影响土壤性质,而土壤性质和地表粗糙度共同影响植被来对喀斯特地区的水分利用效率产生综合影响。
Effect of underlying surface factors on water use efficiency in the karst area
DOI:10.18306/dlkxjz.2021.12.009
[本文引用: 1]
Water use efficiency (WUE) is an important indicator of terrestrial ecosystem response to climate change, and underlying surface factors affect WUE by influencing local climate. Ecological water shortage in the karst area is serious and the underlying surface is complex, but the comprehensive influence of multiple underlying surface factors on WUE is still unclear. In this study, MODIS gross primary productivity (GPP) and evapotranspiration (ET) data sets were used to calculate WUE in the karst area of Southwest China. Coupled with lithology combination, soil type, land use type, and surface roughness, the generalized linear model was used to reveal the comprehensive influence of underlying surface factors on WUE. The results show that: the WUE of the study area is affected by altitude and karst development degree, and increases from southeast to northwest. Among the underlying surface factors, the impact of lithology combination on WUE shows a difference between karst and non-karst areas. The lithology combination of carbonate rock in the karst area has a negative impact on WUE, and the negative impact of pure karst lithology combination is stronger than that of non-pure karst lithology combination; the impact of soil type on WUE is affected by the difference of distribution altitude, soil organic matter difference, and karst and non-karst landform difference; the impact of land use types generally shows a trend that more densely vegetated land use types have a stronger positive impact on the WUE; the increase of surface roughness first has a positive impact on the WUE, and then tends to have a negative impact. Carbonate rocks affect soil properties, and soil properties and surface roughness jointly affect vegetation.
Climatic and terrestrial storage control on evapotranspiration temporal variability: Analysis of river basins around the world
[J].DOI:10.1002/grl.v43.1 URL [本文引用: 1]
Determining dominating control mechanisms of inland water carbon cycling processes and associated gross primary productivity on regional and global scales
[J].
Trends in evapotranspiration and their responses to climate change and vegetation greening over the upper reaches of the Yellow River Basin
[J].DOI:10.1016/j.agrformet.2018.08.010 URL [本文引用: 1]
The impacts of land conversion and management measures on the grassland net primary productivity over the Loess Plateau, Northern China
[J].DOI:10.1016/j.scitotenv.2018.07.161 URL [本文引用: 1]
Recent decline in the global land evapotranspiration trend due to limited moisture supply
[J].DOI:10.1038/nature09396 [本文引用: 1]
Improved estimate of global gross primary production for reproducing its long-term variation, 1982-2017
[J].
DOI:10.5194/essd-12-2725-2020
URL
[本文引用: 1]
. Satellite-based models have been widely used to simulate\nvegetation gross primary production (GPP) at the site, regional, or global\nscales in recent years. However, accurately reproducing the interannual\nvariations in GPP remains a major challenge, and the long-term changes in\nGPP remain highly uncertain. In this study, we generated a long-term global\nGPP dataset at 0.05∘ latitude by 0.05∘ longitude and\n8 d interval by revising a light use efficiency model (i.e., EC-LUE model).\nIn the revised EC-LUE model, we integrated the regulations of several major\nenvironmental variables: atmospheric CO2 concentration, radiation\ncomponents, and atmospheric vapor pressure deficit (VPD). These\nenvironmental variables showed substantial long-term changes, which could\ngreatly impact the global vegetation productivity. Eddy covariance (EC)\nmeasurements at 95 towers from the FLUXNET2015 dataset, covering nine major\necosystem types around the globe, were used to calibrate and validate the\nmodel. In general, the revised EC-LUE model could effectively reproduce the\nspatial, seasonal, and annual variations in the tower-estimated GPP at most\nsites. The revised EC-LUE model could explain 71 % of the spatial\nvariations in annual GPP over 95 sites. At more than 95 % of the sites,\nthe correlation coefficients (R2) of seasonal changes between tower-estimated and model-simulated GPP are larger than 0.5. Particularly, the\nrevised EC-LUE model improved the model performance in reproducing the\ninterannual variations in GPP, and the averaged R2 between annual mean\ntower-estimated and model-simulated GPP is 0.44 over all 55 sites with\nobservations longer than 5 years, which is significantly higher than those\nof the original EC-LUE model (R2=0.36) and other LUE models (R2\nranged from 0.06 to 0.30 with an average value of 0.16). At the global\nscale, GPP derived from light use efficiency models, machine learning\nmodels, and process-based biophysical models shows substantial differences\nin magnitude and interannual variations. The revised EC-LUE model quantified\nthe mean global GPP from 1982 to 2017 as 106.2±2.9 Pg C yr−1\nwith the trend 0.15 Pg C yr−1. Sensitivity analysis indicated that GPP\nsimulated by the revised EC-LUE model was sensitive to atmospheric CO2\nconcentration, VPD, and radiation. Over the period of 1982–2017, the\nCO2 fertilization effect on the global GPP (0.22±0.07 Pg C yr−1) could be partly offset by increased VPD (-0.17±0.06 Pg C yr−1). The long-term changes in the environmental variables could be well reflected in global GPP. Overall, the revised EC-LUE model is able to\nprovide a reliable long-term estimate of global GPP. The GPP dataset is\navailable at https://doi.org/10.6084/m9.figshare.8942336.v3 (Zheng et al.,\n2019).\n
Long-term changes in evapotranspiration over China and attribution to climatic drivers during 1980-2010
[J].
Three decades of gross primary production (GPP) in China: Variations, trends, attributions, and prediction inferred from multiple datasets and time series model in
[J].The accurate estimation of gross primary production (GPP) is crucial to understanding plant carbon sequestration and grasping the quality of the ecological environment. Nevertheless, due to the inconsistencies of current GPP products, the variations, trends and short-term predictions of GPP have not been sufficiently well studied. In this study, we explore the spatiotemporal variability and trends of GPP and its associated climatic and anthropogenic factors in China from 1982 to 2015, mainly based on the optimum light use efficiency (LUEopt) product. We also employ an autoregressive integrated moving average (ARIMA) model to forecast the monthly GPP for a one-year lead time. The results show that GPP experienced an upward trend of 2.268 g C/m2 per year during the studied period, that is, an increasing rate of 3.9% per decade since 1982. However, these trend changes revealed distinct heterogeneity across space and time. The positive trends were mainly distributed in the Yellow River and Huaihe River out of the nine major river basins in China. We found that the dynamics of GPP were concurrently affected by climate factors and human activities. While air temperature and leaf area index (LAI) played dominant roles at a national level, the effects of precipitation, downward shortwave radiation (SRAD), carbon dioxide (CO2) and aerosol optical depth (AOD) exhibited discrepancies in terms of degree and scope. The ARIMA model achieved satisfactory prediction performance in most areas, though the accuracy was influenced by both data values and data quality. The model can potentially be generalized for other biophysical parameters with distinct seasonality. Our findings are further verified and corroborated by four widely used GPP products, demonstrating a good consistency of GPP trends and prediction. Our analysis provides a robust framework for characterizing long-term GPP dynamics that shed light on the improved assessment of the environmental quality of terrestrial ecosystems.
黄河源区土地利用/覆盖变化(LUCC)研究
[J].
Research of land-use and land-cover change (LUCC) in the source regions of the Yellow River
过去30年气候变化对黄河源区水源涵养量的影响
[J].
DOI:10.11821/dlyj201601005
[本文引用: 1]
黄河源区高寒生态系统具有重要的水源涵养功能。基于改进的LPJ动态植被模型,模拟研究1981-2010年中国黄河源区水源涵养量的时空变化特征,进一步探讨气候要素变化的影响。结果表明:近30年来黄河源区水源涵养量整体略呈减少趋势,减少速率为-1.15 mm/a,区域差异特征体现为大部分地区以减少趋势为主,特别是黄河源区东南部。过去30年黄河源区降水量以及大气水分需求能力的变化是影响生态系统水源涵养量增减的主要气候因素。随着干湿条件不同,两者影响程度各异,降水减少和潜在蒸散增加共同导致黄河源区东南部半湿润地区水源涵养量减少,而降水增加则是北部半干旱地区水源涵养量增加的主要原因。
Ecosystem water conservation changes in response to climate change in the Source Region of the Yellow River from 1981 to 2010
DOI:10.11821/dlyj201601005
[本文引用: 1]
The alpine ecosystem of the Source Region of the Yellow River (SRYR) has a significant water conservation function which represents water cycle within the atmosphere and biosphere. In this paper, ecosystem water conservation (EWC) was modeled by a modified dynamic vegetation model. Based on water balance method, the spatial-temporal changes in EWC and the impacts of climatic change were analyzed in the SRYR during the period 1981-2010. Results indicated that the EWC has a slightly decreasing trend of -1.15 mm/a in the past three decades. Furthermore, the EWC of most regions decreased especially in the southeast of the SRYR. In general, changes in both precipitation and atmospheric moisture demands have explicit influences on the amount and changes of the EWC, and the influences are various in different moisture conditions. In the southeast of the SRYR with sub-humid climate, both decreased precipitation and increased potential evapotranspiration induce the significant negative changes in the EWC. Meanwhile, in the northern part with semi-arid climate, increased precipitation is the main climatic factor leading the EWC to increase.
近30年来三江源地区土地覆被与宏观生态变化特征
[J].
DOI:10.11821/yj2010080009
[本文引用: 1]
利用1970年代中后期MSS图像和1980年代末、2004年以及2008年三期TM图像并结合野外调查,获得三江源地区四期土地覆被空间数据集,提出了土地覆被转类指数和土地覆被状况指数,以表征该区域生态变化的趋势。通过计算土地覆被转类途径和幅度、土地覆被转类指数和土地覆被状况指数,分析青海三江源地区1970年代中后期以来土地覆被时空变化特征及其反映的宏观生态状况变化。结果表明:三江源地区近30年平均土地覆被状况指数为38.20,土地覆被状况为4级,其中黄河流域最好,其次为澜沧江流域,长江流域最差;三江源地区土地覆被转类,在1970s~1990s和1990s~2004年两个时段,均主要以高生态级别向低生态级别转移为主,2004~2008年时段,主要以低生态级别向高生态级别转移为主;由土地覆被状况指数变化率和土地覆被转类指数,可以反映出近30年来三江源地区土地覆被和宏观生态状况,总体上经历了变差(1970s~1990s时段土地覆被状况指数变化率Zc为-0.63,土地覆被转类指数LCCI为-0.58)—显著变差(1990s~2004时段Zc为-0.94,LCCI为-1.76)—略有好转(2004~2008时段Zc为0.06,LCCI为0.33)的变化过程。这一变化过程前、中期主要受到气候变化和草地载畜压力共同驱动的影响,后期则叠加了生态建设工程的驱动作用。
The characteristics of land cover and macroscopical ecology changes in the source region of three rivers on Qinghai-Tibet Plateau during last 30 years
DOI:10.11821/yj2010080009
[本文引用: 1]
<p>Based on field investigations we obtained four phase land cover spatial data sets by interpreting MSS images of the mid- and late 1970s and three phase TM images of the late 1980s, 2004 and 2008 in the Three Rivers’ Source Regions. We defined the relation between land cover type and ecological grade, land cover change index and land cover condition index to characterize the trends of land cover and macroscopical ecological changes in this region. By calculating the direction and extent of land cover change, land cover change index and land cover condition index, we analyzed temporal and spatial characteristics of land cover change and macro ecological condition change in the source region of three rivers on the Qinghai-Tibet Plateau since the mid- and late 1970s. The results showed that the average land cover condition index of the Three Rivers’ Source Region was 38.20, being the fourth grade in the last 30 years. The Yellow River basin had the best land cover condition, followed by the Lancang River basin, and the Yangtze River basin had the worst. Land cover type with high ecological grade transforming to that with low grade was the main phenomena during the 1970s to 1990s and the 1990s to 2004. Land cover with low grade transforming to that with high grade was the main phenomena during 2004 to 2008. Indicated by land cover condition index change rate and land cover change index, land cover and macro ecological condition degenerated (7090 period Zc-0.63, LCCI -0.58)-obviously degenerated(9004 period, Zc-0.94, LCCI -1.76)-slightly meliorated(0408 period, Zc 0.06, LCCI 0.33). This course was jointly driven by climate change, grassland stocking pressure and implementation of ecological construction project.</p>
黄河流域气候变化研究综述
[J].
DOI:10.7522/j.issn.1000-694X.2021.00086
[本文引用: 1]
黄河流域从西到东跨越多省,地形复杂,作为中国生态安全战略格局的重要组成部分,是中国气候变化敏感区和生态环境脆弱区。本文主要综述了在气候变暖背景下,黄河流域气候变化特征、影响以及成因和对策建议的最新研究进展:(1)近60年黄河流域气温呈上升趋势,平均升温速率为0.30 ℃/10a,上游升温速率最大,下游次之,冬季升温趋势最显著,夏季最小,降水量上游地区增多,中下游地区减少,蒸散量呈减少趋势。(2)在气候变化和人类活动影响下,黄河流域径流量整体呈下降趋势,源区冰川积雪消融加剧,冻土严重退化,流域植被覆盖整体呈好转趋势,上游脆弱区和中游产沙区水土流失加重,对农业影响利弊皆存,流域病虫害加剧;流域气候变暖,极端天气气候事件增多,对文化遗产安全保存带来巨大挑战。(3)黄河流域气候系统随时间演变的过程不仅受自身内部的动力、热力影响,也受大气环流、海温、青藏高原等外部强迫因子的影响,人类活动造成的大气成分和土地利用覆盖的变化是影响黄河流域局地气候的重要因子。(4)未来黄河流域气温持续上升,降水波动增加,极端天气事件将更加频繁。应对气候变化,重点在于加强黄河流域气候变化科学研究,提升极端天气气候事件的预报预警能力,联合多部门建立气象、水文、生态与数值预报及防控一体化的灾害预报预警系统,同时加强流域水资源的管理调配和有效利用,加强流域生态环境保护,制定科学合理的农业发展战略,推动黄河流域高质量发展。
Review of climate change in the Yellow River Basin
DOI:10.7522/j.issn.1000-694X.2021.00086
[本文引用: 1]
The Yellow River Basin is an important part of ecological security strategy in China, and it is a sensitive area of climate change and a vulnerable area of ecological environment. This paper mainly analyzes and reviews the latest research progress on the characteristics, impacts, causes and countermeasures of climate change in the Yellow River Basin: (1) In recent 60 years, the temperature shows an upward trend, with an average warming rate of 0.30 ℃ per decade, and the trend of temperature rise is the most significant in winter and the smallest in summer. The precipitation in the upstream increased, while that in the middle-stream and lower-stream decreased significantly. (2) In recent years, under the joint influence of climate change and human activities, a series of problems have appeared in the Yellow River Basin, such as the reduction of runoff, the degradation of glaciers and frozen soil, the improvement of vegetation coverage, the increase of soil erosion in the ecological fragile areas of upstream and sand-producing areas of the middle-stream. The impact of climatic change on the crops is not only of advantageous aspects but also of disadvantageous, and the pets and diseases increase. The climate warming and the increase of extreme events have brought great challenges to the safe preservation of cultural heritage. (3) The evolution process of climate system in the Yellow River Basin is not only affected by its own internal power and heat, but also by external forcing factors such as atmospheric circulation, sea surface temperature and Qinghai Tibet Plateau. The change of atmospheric composition and land use/cover caused by human activities is an important factor affecting the local climate. (4) In the future, the temperature will still show an upward trend, the precipitation fluctuation will increase, and extreme weather events will occur more frequently in the Yellow River Basin. It is necessary and urgent to take adaptive measures to deal with climate change. These measures mainly include strengthening the scientific research on the impact of climate change and extreme events, improving the ability of forecasting and early warning of extreme weather events, establishing a disaster forecasting and early warning system integrating meteorology, hydrology, ecology, numerical prediction, prevention and control, strengthening the management, allocation and effective utilization of water resources, strengthening the protection of ecological environment, formulating scientific and reasonable agricultural development strategy, and promoting the high-quality development of the Yellow River Basin.
Changes in vegetation greenness in the upper and middle reaches of the Yellow River Basin over 2000-2015
[J].
植被恢复工程对黄河中游土地利用/覆被变化的影响
[J].
DOI:10.11849/zrzyxb.20160073
[本文引用: 1]
剧烈的人类活动可快速地改变土地利用/覆被变化(LUCC)格局,并对地表参量和水文要素产生深刻的影响。论文以退耕还林/还草生态工程(Grain for Green Project, GGP)的重点区黄河中游为例,利用5期土地利用数据,定量分析了区域LUCC的过程与趋势,并探讨了GGP对下垫面地表参量及水文要素的影响。结果表明:1)GGP并未显著地改变研究区土地利用空间分布格局,但改变了各土地类型的转换速度和平衡状态。GGP实施前各类型间相互转换频繁,处于动态平衡态势,而 GGP实施后以土地类型单向转换为主,处于不平衡态势,以耕地单向转为林草地为主。2)不同子流域间LUCC存在差异。GGP前汾河流域变化速度较其他区域快,呈准平衡状态;工程实施后的前期,河龙区间与渭河流域的净变化率以及总变化率较快,而后期差异不显著,呈不平衡状态。3)GGP显著地改变了下垫面地表参量和水文要素。GGP的实施使得NDVI、LAI和发射率显著增加,而反照率显著下降,以河龙区间尤为显著;径流系数显著下降,而蒸散发系数显著增加,尤以河龙区间表现显著。
Impact of the grain for green project on the land use/cover change in the middle Yellow River
DOI:10.11849/zrzyxb.20160073
[本文引用: 1]
Intense human activity can quickly change the pattern of the land use/cover, and have a significant impact on the surface parameters and hydrological elements. The middle Yellow River, a typical region of GGP, was used to detect the process and trend of LUCC and identify the impact of GGP on surface parameters and hydrological elements. The results indicated that: 1) Although GGP did not significantly changed the distribution pattern of land use, it changed the speed of land use change and the balance status of land uses. After the implementation of GGP, the bidiredictional change of land use turned to one-way change from farmland to forest and grass. 2) There were significant differences of LUCC among subbasins. Before GGP, the change speed of LUCC in the Fenhe Basin was faster than in other regions, and was in quasi-balance status. In the early period of GGP, the net change speed and total change speed in Helong region and Weihe River Basin was faster than in other regions. However, there was no significant difference of speed in the end period of GGP, and it was in unbalanced status. 3) The GGP had significantly changed the terrestrial parameters and hydrological elements. The GGP implementation resulted in the significant increase of NDVI, LAI and emissivity and decrease of albedo, especially in the Helong region. In addition, the runoff coefficient decreased significantly, while evaporation coefficient increased significantly, especially in the Helong region.
黄河流域水循环要素变化趋势分析
[J].
Trend analysis of hydrological components in the Yellow River Basin
DOI:10.11849/zrzyxb.2003.02.001
[本文引用: 1]
This paper attempts to detect the trends of hydrologic cycle components in the concerned region.The hydrologic components are separated from monthly precipitation and natural runoff series based on the schemes proposed herein.Mann-Kendall method has been applied to detect the trends of the hydrologic components.For the Lanzhou station,only surface runoff(RS)showed a decreasing trend.As for the Huayuankou station,the results showed that RN,RS and RG have a strong decreasing trend,while the decreasing trend of the other components is not significant enough.Furthermore,impacts of human activities,climatic changes and annual runoff coefficient change on hydrologic cycle components have been discussed.The study suggests that increasing water resources development and utilization may be the most important factors for the frequent drying-up in the main course of the Yellow River.Moreover,the similarities of the trends in precipitation and natural runoff suggest a linkage exists between climatic change and hydrologic cycle change.With regard to intensified human activities and climatic change,knowledge about the regional hydrologic cycle change should be seen as the base for searching for an adaptation strategy in water resources use.The Yellow River basin,located in the semi-humid,semi-arid and arid climatic zones,is characterized by vertical hydrological cycle,which means a strong evapotranspiration.Thus,it is important to control that part of water consumption through adjustment of water utilization.Water-saving agriculture must be one of the most important ways to alleviate water resources deficit in the region.Therefore,industrial structure adjustment should also be under consideration for sustainable development in the basin.
黄河流域净生态系统生产力的时空分异特征及其驱动因子分析
[J].
DOI:10.16258/j.cnki.1674-5906.2022.11.001
[本文引用: 1]
净生态系统初级生产力(Net Ecosystem Productivity,NEP)及影响因素的定量评估研究,有助于深入理解区域碳循环及其驱动机制。作为气候变化敏感区域,黄河流域净生态系统生产力的时空变化特征及其气候驱动因子的研究,对阐明中国北方陆地碳汇格局特征具有重要意义。因此,该研究基于NEP的估算模型,采用趋势分析、相关分析、聚类分析等分析方法,对2000-2020年黄河流域NEP时空演变特征及其驱动机制进行分析。结果表明,(1)黄河流域年均NEP为92.7 g·m<sup>-2</sup>,总体上表现为碳汇。在空间分布上,NEP呈现从西向东逐步递增的分布特征,并存在明显的空间聚集效应,高值和低值聚集区域分别占流域面积的32.6%、41.7%。(2)2000年以来黄河流域NEP总体呈增加趋势,平均每年增加4.7 g·m<sup>-2</sup>,其中有62.4%的地区NEP增加趋势达到显著水平,植被固碳能力提升明显。在不同分区中,黄河中游地区NEP增加速率最大,平均每年增加7.8 g·m<sup>-2</sup>;在不同植被类型中,常绿林NEP提升最为显著,具有显著增加趋势的面积占比最高,达到82.8%。(3)从未来变化特征看,黄河流域NEP的Hurst指数平均为0.74,未来变化趋势具有强可持续性特征。其中NEP呈显著增加趋势,且未来保持强持续性的区域面积占比达到56.2%,说明未来黄河流域大部地区固碳能力仍将保持提升趋势。(4)从气候相关分析看,流域NEP多与降水呈正相关性,与日照时数呈负相关性,而气温影响不显著。在关键气候因子的影响范围方面,降水影响面积最大,占比达到70%;日照时数次之(19.3%);气温影响范围最小(10.7%)。因此,降水是影响黄河流域NEP空间分布的最主要气候因子。
Analysis on temporal-spatial variations and driving factors of net ecosystem productivity in the Yellow River Basin
黄河中游植被变化对水量转化的影响分析
[J].
Impact of vegetation change on water transformation in the middle Yellow River
近59 a黄河流域蒸发量变化规律及影响因素
[J].
Temporal and spatial changes of pan evaporation and its influence factors in the Yellow River Basin in recent 59 years
黄河流域植被格局变化对水分利用效率的影响
[J].
Charactersties of water use efficiency during the changing process of vegetation in the Yellow River Basin
黄河流域植被变化对区域水碳耦合的影响
[J].
Impact of vegetation change at Yellow River Basin on local water-carbon interaction
黄河流域水源涵养区界定
[J].
Definition of water conservation areas in the Yellow River Basin
1982—2018年青藏高原水分利用效率变化及归因分析
[J].
DOI:10.17521/cjpe.2021.0187
[本文引用: 1]
水分利用效率(WUE)是衡量地表生态系统碳水耦合的重要指标。青藏高原是我国重要的生态屏障, 其生态系统对全球变化响应敏感, 开展青藏高原WUE研究有利于深入理解高寒生态系统碳水循环的过程和机制, 对指导植被生态建设具有重要意义。该研究基于GLASS遥感数据、气象数据和植被类型数据, 对1982-2018年期间青藏高原WUE的时空变化格局及其对温度、降水量、太阳辐射、饱和水汽压差、CO<sub>2</sub>浓度以及叶面积指数的响应进行了分析, 并进一步揭示了植被类型间的差异。结果表明: (1)青藏高原WUE总体呈现由东南向西北递减的空间分布格局, 多年平均值约为1.64 g C·kg<sup>-1</sup>。WUE在不同植被类型间差异明显, 森林最高, 高寒荒漠最低, 高寒草甸高于高寒草原。(2)青藏高原WUE主要呈现增加趋势, 除森林和栽培植被外, 其他植被类型WUE均显著增加, 总初级生产力主导了研究区77.84%面积的WUE变化。(3)叶面积指数和CO<sub>2</sub>浓度主导了青藏高原WUE的变化, 且均为正向效应。而饱和水汽压差的升高对高寒草原、高山植被、栽培植被以及高寒荒漠的WUE有抑制作用。
Variation in ecosystem water use efficiency and its attribution analysis during 1982-2018 in Qingzang Plateau
DOI:10.17521/cjpe.2021.0187
[本文引用: 1]
<p id="p00010"><i><strong>Aims</strong></i> Water use efficiency (WUE) is a crucial parameter reflecting the coupling of carbon and water cycles in terrestrial ecosystems. Qingzang Plateau (QP) is the ecological barrier of China and its accommodated ecosystem is extremely sensitive to global change. Revealing the ecosystem WUE pattern and the driving forces is critical for improving our understanding on the process and mechanism of carbon and water cycles in the alpine ecosystem of the QP, which are the basis for vegetation conservation and restoration.</p> <p id="p00015"><i><strong>Methods</strong></i> Using the Global Land Surface Satellite (GLASS) data, meteorological data and vegetation type data, the spatio-temporal changes of WUE and their responses to temperature, precipitation, solar radiation, vapor pressure deficit (VPD), CO<sub>2</sub> concentration and leaf area index (LAI) during 1982-2018 over the QP were analyzed in this study. The trend magnitude and the influencing factors on WUE were further compared among vegetation types.</p> <p id="p00020"><i><strong>Important findings</strong></i> (1) The WUE decreases gradually from southeast to northwest on the QP, with an overall annual mean value of 1.64 g C·kg<sup>-1</sup>. Evident differences in WUE are observed among vegetation types, with the highest value in forest and the lowest value in alpine desert. In addition, the WUE in alpine meadow is higher than that in alpine steppe. (2) The QP is prevailed by an increasing trend in WUE. Significantly increasing trends are observed in all vegetation types except for forest and cultural vegetation. Meanwhile, the variation of WUE is dominated by ecosystem gross primary productivity over 77.84% of the study area. (3) The WUE variation is mainly regulated by LAI and CO<sub>2</sub> concentration on the QP, and these two factors both cause positive effects on WUE. Increasing VPD inhibits WUE in alpine steppe, alpine vegetation, cultural vegetation and alpine desert.</p>
青海湖流域植被碳利用效率时空动态研究
[J].
Temporal and spatial dynamics of vegetation carbon use efficiency in Qinghai Lake Basin
A daily and 500 m coupled evapotranspiration and gross primary production product across China during 2000-2020
[J].
DOI:10.5194/essd-14-5463-2022
URL
[本文引用: 1]
. Accurate high-resolution actual evapotranspiration (ET)\nand gross primary production (GPP) information is essential for\nunderstanding the large-scale water and carbon dynamics. However,\nsubstantial uncertainties exist in the current ET and GPP datasets in China\nbecause of insufficient local ground measurements used for model constraint. This study utilizes a water–carbon coupled model, Penman–Monteith–Leuning Version 2 (PML-V2), to estimate 500 m ET and GPP at a daily scale. The parameters of PML-V2(China) were well calibrated against observations of 26 eddy covariance flux towers across nine plant functional types in China,\nindicated by a Nash–Sutcliffe efficiency (NSE) of 0.75 and a root mean square error (RMSE) of 0.69 mm d−1 for daily ET, respectively, and a NSE of 0.82 and a RMSE of 1.71 g C m−2 d−1 for daily GPP. The model estimates get a small Bias of 6.28 % and a high NSE of 0.82 against water-balance annual ET estimates\nacross 10 major river basins in China. Further evaluations suggest that the\nnewly developed product is better than other typical products (MOD16A2,\nSEBAL, GLEAM, MOD17A2H, VPM, and EC-LUE) in estimating both ET and GPP. Moreover, PML-V2(China) accurately monitors the intra-annual variations in ET and GPP in the croplands with a dual-cropping system. The new data showed\nthat, during 2001–2018, the annual GPP and water use efficiency experienced a significant (p<0.001) increase (8.99 g C m−2 yr−2 and\n0.02 g C mm−1 H2O yr−1, respectively), but annual ET showed a\nnon-significant (p>0.05) increase (0.43 mm yr−2). This\nindicates that vegetation in China exhibits a huge potential for carbon\nsequestration with little cost in water resources. The PML-V2(China) product\nprovides a great opportunity for academic communities and various agencies\nfor scientific studies and applications, freely available at\nhttps://doi.org/10.11888/Terre.tpdc.272389 (Zhang and He, 2022).\n
Multi-decadal trends in global terrestrial evapotranspiration and its components
[J].Evapotranspiration (ET) is the process by which liquid water becomes water vapor and energetically this accounts for much of incoming solar radiation. If this ET did not occur temperatures would be higher, so understanding ET trends is crucial to predict future temperatures. Recent studies have reported prolonged declines in ET in recent decades, although these declines may relate to climate variability. Here, we used a well-validated diagnostic model to estimate daily ET during 1981–2012 and its three components: transpiration from vegetation (Et), direct evaporation from the soil (Es) and vaporization of intercepted rainfall from vegetation (Ei). During this period, ET over land has increased significantly (p < 0.01), caused by increases in Et and Ei, which are partially counteracted by Es decreasing. These contrasting trends are primarily driven by increases in vegetation leaf area index, dominated by greening. The overall increase in Et over land is about twofold of the decrease in Es. These opposing trends are not simulated by most Coupled Model Intercomparison Project phase 5 (CMIP5) models and highlight the importance of realistically representing vegetation changes in earth system models for predicting future changes in the energy and water cycle.
Coupled estimation of 500 m and 8-day resolution global evapotranspiration and gross primary production in 2002-2017
[J].DOI:10.1016/j.rse.2018.12.031 URL [本文引用: 1]
Global estimates of evapotranspiration and gross primary production based on MODIS and global meteorology data
[J].DOI:10.1016/j.rse.2010.01.022 URL [本文引用: 1]
Drought risk of global terrestrial gross primary productivity in recent 40 years detected by a remote densing-driven process model
[J].
1961—2020年青海省饱和水汽压差变化特征及影响因子分析
[J].
Variation characteristics and influencing factors of saturated vapor pressure difference in Qinghai Province from 1961 to 2020
A rank-invariant method of linear and polynomial regression analysis
[M]//
Estimates of the regression coefficient based on Kendall's Tau
[J].DOI:10.1080/01621459.1968.10480934 URL [本文引用: 1]
Nonparametric tests against trend
[J].DOI:10.2307/1907187 URL [本文引用: 1]
尼洋河流域极端气候时空分布特征及其可能成因
[J].
DOI:10.11821/dlyj020211104
[本文引用: 1]
探究全球变暖下的尼洋河流域极端气候变化特征及原因,对于科学支撑西藏地区的极端气候灾害防治和生态安全保障等具有重要意义。本文基于尼洋河流域1960—2019年逐日降水及气温数据,采用极端气候指标法、Sen's斜率估计法、MK趋势及突变检验法、GIS空间分析法从降水、气温两个角度分析近60年尼洋河流域极端气候时空分布特征,并结合大气环流因子,使用地理探测器方法探讨时空分布特征的可能成因。结果表明:在时间上,尼洋河流域极端气候整体呈现暖湿化的变化趋势。极端降水的降水量、降水强度、降水日数均呈现增加趋势,极端气温的高温极值、低温极值均呈现增大趋势,低温日数呈现减少趋势。在空间上,尼洋河流域极端气候变化存在明显的空间分异性。极端降水整体自东向西逐渐减少、极端气温整体自东南向西北逐渐降低。尼洋河河道作为水汽通道,有一定的增温、保温作用,各极端气候指标沿着河道呈现出连续的极值点。副热带高压、青藏高压对尼洋河流域暖湿化的变化起到了正向增强作用,极涡、北大西洋涛动则相反。以坡度为代表的地形因子、以NDVI为代表的下垫面因子分别是影响极端降水、极端气温空间分布的最主要的环境因子,高程对极端降水、气温的空间分布均起到了重要的作用。
Spatio-temporal distribution characteristics and possible causes of extreme climate in the Niyang River Basin
DOI:10.11821/dlyj020211104
[本文引用: 1]
Exploring the characteristics and causes of extreme climate change in the Niyang River Basin under global warming has important significance for scientific support of extreme climate disaster prevention and ecological security in Tibet. Based on the precipitation and temperature data of the Niyang River Basin from 1960 to 2019, we used the extreme climate index method, Sen's slope method, Mann-Kendall tendency and abrupt change test and GIS spatial analysis method to explore the spatio-temporal distribution characteristics of extreme climate in the basin in the past 60 years from the perspectives of precipitation and temperature. Combined with atmospheric circulation factors, we used the Geodetector method to investigate the possible causes of spatio-temporal characteristics. The results showed that the Niyang River Basin showed a trend of warming and wetting on the time scale. Precipitation amount, precipitation intensity, and the number of days of extreme precipitation all showed an increasing trend. High-temperature and low-temperature extremes all showed an increasing trend, and the number of low temperature days showed a decreasing trend. On the space scale, there was an obvious spatial heterogeneity in the study basin. The extreme precipitation overall gradually decreased from the east to the west, and the extreme temperature overall gradually cooled from the southeast to the northwest. As a water vapor channel, the Niyang River had effects of warming and heat-preserving, thus the extreme climate indexes showed continuous extreme points along the river. The Subtropical High and the Qinghai-Xizang High had a positive effect on the warming and humidification of the Niyang River Basin, while the Polar Vortex and North Atlantic Oscillation were the opposite. Topographic factors represented by slope and underlying surface factors represented by NDVI were the most important environmental factors that respectively influenced the spatial distribution of extreme precipitation and extreme temperature. Elevation played an important role in the spatial distribution of both extreme precipitation and temperature.
地理探测器:原理与展望
[J].
DOI:10.11821/dlxb201701010
[本文引用: 1]
空间分异是自然和社会经济过程的空间表现,也是自亚里士多德以来人类认识自然的重要途径。地理探测器是探测空间分异性,以及揭示其背后驱动因子的一种新的统计学方法,此方法无线性假设,具有优雅的形式和明确的物理含义。基本思想是:假设研究区分为若干子区域,如果子区域的方差之和小于区域总方差,则存在空间分异性;如果两变量的空间分布趋于一致,则两者存在统计关联性。地理探测器q统计量,可用以度量空间分异性、探测解释因子、分析变量之间交互关系,已经在自然和社会科学多领域应用。本文阐述地理探测器的原理,并对其特点及应用进行了归纳总结,以利于读者方便灵活地使用地理探测器来认识、挖掘和利用空间分异性。
Geodetector: Principle and prospective
DOI:10.11821/dlxb201701010
[本文引用: 1]
Spatial stratified heterogeneity is the spatial expression of natural and socio-economic process, which is an important approach for human to recognize nature since Aristotle. Geodetector is a new statistical method to detect spatial stratified heterogeneity and reveal the driving factors behind it. This method with no linear hypothesis has elegant form and definite physical meaning. Here is the basic idea behind Geodetector: assuming that the study area is divided into several subareas. The study area is characterized by spatial stratified heterogeneity if the sum of the variance of subareas is less than the regional total variance; and if the spatial distribution of the two variables tends to be consistent, there is statistical correlation between them. Q-statistic in Geodetector has already been applied in many fields of natural and social sciences which can be used to measure spatial stratified heterogeneity, detect explanatory factors and analyze the interactive relationship between variables. In this paper, the authors will illustrate the principle of Geodetector and summarize the characteristics and applications in order to facilitate the using of Geodetector and help readers to recognize, mine and utilize spatial stratified heterogeneity.
西北地区东部夏季不同等级降水的空间分布特征及其在旱涝年分布的差异
[J].
Spatial distribution of summer graded precipitation and its difference in drought and flood years over the east of Northwest China
