

农业景观分布广泛且空间异质性较高,由按照一定规律且相互作用的斑块组成[4]。针对农业景观格局的研究,目的是在看似无规律的农业景观中发现潜在的有意义的规律或秩序[5]。早期国外学者主要采用遥感手段提取农业景观[6-7],聚焦于农业景观可变性[8]、多样性[9]、丰富度[10],发展特征[11]等方面,对景观连通性、异质性、破碎化等特征进行深入研究[12⇓-14]。国内学者较多从景观或类型尺度对农业景观格局进行研究[15-16]。休闲农业是农业产业发展新业态,是以农业资源为基础,结合农业生产和旅游发展,以休闲、观光、旅游为体验的一种新型农业生产经营模式[17]。耕地、林地、草地、水域及未利用地作为农业生产及旅游活动载体,被纳入休闲农业景观研究范畴。
休闲农业景观格局演变通常与区域自然、经济发展和土地管理模式的改变密切相关,这些变化导致景观的多样化、复杂化和碎片化方向发展[18]。例如:一项沿海地区的研究发现,温度变化会影响农业生产和生态环境的稳定性,导致景观内部斑块更加分散,并导致景观连通性降低[19];盐池湾高寒湿地的研究发现,降水变化影响生态系统稳定性和水资源分布,从而影响人类活动和土地利用方式,进而导致该湿地景观面积变化及破碎化程度增加[20]。有研究发现,在经济增长和社会因素的影响下,乌鲁木齐休闲农业景观面积收到压缩,表明经济发展需求可能会导致土地利用方式的改变,从而影响休闲农业景观格局演变[21]。此外,刘根林等[22]研究发现,经济发展、人口增加及产业结构调整是影响江西瑞兴于地区耕地、林地等休闲农业景观破碎化程度减弱以及优势度、多样性、均衡性提高的主要驱动因素;黄宝荣等[23]通过对北京昌平区三镇的研究,发现城市扩展对研究区自然和休闲农业景观格局及稳定性产生影响,而社会经济发展、公共政策及土地利用规划为景观连通性的主要影响因素。
在休闲农业景观发展过程中,乡村旅游活动对其产生了重要的影响,使其具有旅游发展特性;同时,休闲农业景观格局受到旅游因素驱动。乡村旅游发展对休闲农业景观演变及生态保护具有“抑制”或“倒逼”效应。例如,罗楠等[24]研究发现,旅游产业发展及旅游城镇化带来旅游基础服务设施需求,这导致了广西阳朔县林地、耕地转为建设用地,从而使得休闲农业景观破碎化加剧,复杂性降低。另外,一项神农架国家公园的研究表明[25],旅游发展对当地生态环境和休闲农业景观产生影响,导致该地区生态敏感性较高,而且景观格局破碎化程度相对严重。此外,徐倩等[26]研究发现,旅游发展是导致贵州西江苗寨休闲农业景观斑块密集、破碎化和不均衡发展的重要影响因素;柳迪子等[27]研究发现,无锡太湖国家公园在旅游发展驱动下,景观格局呈破碎化、复杂化以及连通性减弱的特点。以上研究说明旅游发展对休闲农业景观的格局演变产生负向影响。然而,也有研究表明,在新安江流域高强度旅游活动的影响下,景区景观破碎化程度加剧,但并未加剧景观的恶化特征[28]。另外,仲佳等[29]研究发现,成都市三圣乡香农多样性以及均匀度指数增加,这表明乡村旅游发展是景观格局演变的主要驱动因子并产生积极影响。此外,李琛等[30]研究表明,环洱海地区乡村聚落景观则在旅游驱动因素下表现出“人—土—地—水”的共生关系,促进了人与自然的和谐共生。综上所述,乡村旅游活动对休闲农业景观影响具有复杂性。
尽管现有的研究已对农业景观格局演变进行了探讨,并对休闲农业景观及其影响因素进行了分析,但仍存在一些局限性。在休闲农业景观演变规律的研究中,以乡村旅游业为主导产业的区域休闲农业景观格局驱动影响研究尚未得到足够的重视。因此,旅游干扰下乡村休闲农业景观的演变规律是一个亟须关注的问题。
在秀美乡村建设进程和乡村旅游发展带动下,江西省婺源县是一个典型的乡村旅游区域。该地区拥有优质的生态本底、丰富的旅游资源以及深厚的乡村旅游发展基础。然而,随着旅游活动的频繁进行、旅游产业的发展以及旅游城镇化等因素的影响,婺源县休闲农业景观格局发生了显著的变化,局部生态环境问题也日益凸显。因此,本文通过遥感解译和实地调查相结合的方式,构建休闲农业景观分类系统;通过景观转移矩阵,对休闲农业景观的时空演变及景观转化进行分析;同时,着重讨论休闲农业景观的破碎度、分离度、优势度及干扰度的演化特征及差异。此外,利用灰色关联度模型,分析自然、社会经济及旅游因素对婺源县休闲农业景观格局的驱动强度,以期优化婺源的休闲农业景观格局,推动乡村旅游高质量发展,并为旅游驱动下的景观格局演变提供理论价值和案例参考。
1 研究方法与数据来源
1.1 研究方法
1.1.1 景观转移矩阵法
转移矩阵法目前在景观格局研究中得到充分应用,具有丰富的统计学意义[31]。为进一步研究婺源县休闲农业景观演变特征,掌握具体景观类型流入及流出规律,以2000—2020年为研究期,每5年为一个研究时段,分为4个时段对婺源县景观类型转移矩阵进行分析。其表达式为:
式中:x表示景观类型的数量;Sij表示由基期年到研究时段结束景观类型i转移为景观类型j的面积统计量。
1.1.2 景观格局指数法
表1 景观格局指数及计算方法
Tab.1
| 指数 | 公式 | 含义 |
|---|---|---|
| 景观破碎度指数( | 景观破碎度指数用于反映景观被分割的破碎程度,在一定程度上表示人类对景观的干扰程度,是生物多样性丧失的重要原因之一[33]。式中: | |
| 景观分离度指数( | 景观分离度指数用于反映景观类型斑块分布离散程度,景观分离指数越高,表示景观分布越复杂且稳定性越低[34]。式中: | |
| 景观优势度指数( | 景观优势度指数用于反映斑块在景观中的重要性,景观优势度高,表示该景观类型单一且深刻影响景观格局形成和变化。式中: | |
| 最大斑块指数LPI | 最大斑块指数用于反映景观中最大斑块面积占整体景观面积的比例,有助于优势景观的确立。最大斑块指数对优势景观种类、内部丰度产生影响,并且可以对景观干扰强度和频率产生影响。式中, | |
| 景观干扰度指数( | 景观干扰度指数用于反映遭受干扰时各景观类型所收到的生态损失程度[35]。式中: |
1.1.3 灰色关联模型
式中:
1.2 研究区域与数据来源
1.2.1 研究区域
江西省婺源县是一个拥有丰富休闲农业景观和旅游资源的地区,区域内分布着广泛的休闲农业景观和丰富的森林旅游资源,森林覆盖率高达82.64%,为国家级文化生态保护区,同时也是江西省重要的水源涵养区和生态屏障区。婺源县拥有丰富的旅游资源,包括1个5A级国家风景名胜区、13个4A级国家风景名胜区等。该地区被授予中国旅游强县、全国旅游标准化示范区、全国森林旅游示范县等称号。在研究区内,乡村旅游点分布密集,包括2家省5A级乡村旅游点、4家4A级乡村旅游点、9家3A级乡村旅游点。婺源县还被授予国家乡村旅游度假实验区的称号,是全国休闲农业与乡村旅游示范县、中国优秀国际乡村旅游目的地。2019年婺源县旅游接待人数达到3862.10万人次、门票收入3.50亿元,旅游综合收入244.30亿元,均创下历史新高。
1.2.2 遥感影像数据来源
2000、2005年Landsat 4-5 TM卫星影像来自地理空间数据云官网(
表2 遥感影像数据
Tab.2
| 拍摄卫星 | 拍摄日期 | 影像分辨率/m | 成像质量 |
|---|---|---|---|
| Landsat 4-5 TM | 2000年4月17日 | 30 | 平均云量 0%,质量好 |
| Landsat 4-5 TM | 2005年3月5日 | 30 | 平均云量 0.01%,质量好 |
| HJ1A | 2010年3月28日 | 30 | 平均云量 2%,质量好 |
| GF1 | 2015年3月28日 | 16 | 平均云量 3%,质量好 |
| GF1 | 2020年3月27日 | 16 | 平均云量 5%,质量好 |
根据中国科学院土地资源遥感影像解译分类系统的标准[39],结合婺源县景观类型现状,通过目视解译和实地调查检验相结合的方法,确定采用二级分类对研究区景观类型进行划分。由于研究区的情况与标准的土地利用分类体系有所不同,且遥感影像精度不足,加之草地的面积较小,所以草地不作二级分类;本文研究的重点是休闲农业景观的时空动态演变特征,因此建设用地也不做二级分类。最终利用ENVI 5.5、ArcGIS 10.7软件对遥感影像进行几何纠正、投影转换,将遥感数据解译为14类。
1.2.3 驱动力数据来源
气象数据和水文数据来源于中国气象科学数据共享网(
1.2.4 休闲农业景观分类系统
耕地作为重要的土地资源,不仅对保障国家粮食安全具有重要作用,同时也是休闲农业景观的重要组成部分[42]。林地对保护生物多样性具有重要意义,提供了生态服务功能,对于维持农业生态的稳定起到关键作用[43]。草地是一个生产及生态兼顾的休闲农业景观,是可以满足现代人食物供给,并可以实现可持续发展的农业系统[44]。水域是开展农业生产活动必需的资源,并在社会发展过程中也发挥重要的作用[45]。提高未利用地使用价值是解决建设用地紧缺困境的重要措施,也可起到维护农业生态环境功能的作用,是休闲农业景观的重要组成部分[46]。综上,参考土地利用/土地覆盖变化(LUCC)的分类标准,以及休闲农业景观的研究成果[47-48],本文将耕地、林地、草地、水域和未利用地5类用地类型归为休闲农业景观(表3)。
表3 休闲农业景观分类系统
Tab.3
| 一级分类 | 二级分类 |
|---|---|
| 耕地 | 水田、旱地 |
| 林地 | 有林地、疏林地、灌木林、其他林地 |
| 草地 | — |
| 水域 | 河渠、湖泊、水库坑塘、滩地 |
| 未利用地 | 沼泽地、裸土地 |
2 休闲农业景观时空演变及转移矩阵分析
2.1 休闲农业景观时空演变规律分析
在研究时段内,婺源县的休闲农业景观与旅游地分布高度契合,婺源县林地和耕地为优势景观,休闲农业景观呈先减后增趋势,但总体上休闲农业景观面积减少。由图1可知,林地景观为绝对优势景观,呈块状集聚分布。早期林地重点覆盖婺源县北部中部及西南部等地区。随着耕地开垦、城镇用地扩张及旅游开发,西南部区域林地面积减少,2015年较2000年减少211.29 km2。2015年后,退耕还林、生态保护等措施实行使得中部及西南部林地景观得以恢复,2020年较2015年增加155.45 km2;耕地景观面积呈先增后减特征,分布多呈条状分散分布。耕地景观主要位于婺源县中部及东北部区域,2005年耕地面积较2000年增长161.73 km2,且开垦区域位于婺源县镇头镇及赋春镇区域。后期随着乡村旅游发展及土地用途管控,耕地面积波动较为平稳。
图1
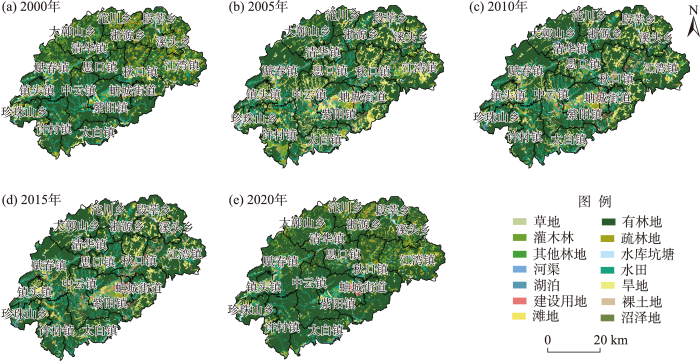
图1
休闲农业景观空间分布
Fig.1
Spatial distribution of recreational agriculture landscape
草地及未利用地面积占比较小,其分布呈点状零星分布。早期草地分布于婺源县边缘地区,2015年草地面积较2000年下降41.92 km2。随着生态文明建设和绿色发展的推进,草地景观得到恢复,2020年草地面积增加36.14 km2,且主要集中于婺源县西南部地区。未利用地面积占比有小幅度提升;水域面积呈波动起伏特征,河渠景观主要分布在婺源县中部,湖泊及水库坑塘主要分布在珍珠山及段萃乡区域。
2.2 休闲农业景观转移矩阵分析
由表4可知,2000—2020年,林地是耕地、草地、建设用地主要转入景观,而耕地是林地、草地主要转出景观且为建设用地主要转入景观。此外,水域在发展过程中主要转为耕地,未利用地的面积无明显变化。将研究时段划分为(Ⅰ) 2000—2005年、(Ⅱ) 2005—2010年、(Ⅲ) 2010—2015年、(Ⅳ) 2015—2020年4个时段进行对比分析①(① 注:考虑篇幅原因,仅展示2000—2020年休闲农业景观转移矩阵,4个时段的转移矩阵表未一一列出,如需要可向作者索取。)。
表4 2000—2020年休闲农业景观转移矩阵
Tab.4
| 景观 类型 | 2020年 | ||||||||||||||
|---|---|---|---|---|---|---|---|---|---|---|---|---|---|---|---|
| 水田 | 旱地 | 有林地 | 灌木林 | 疏林地 | 其他林地 | 草地 | 建设用地 | 河渠 | 湖泊 | 水库坑塘 | 滩地 | 沼泽地 | 裸土地 | ||
| 2000年 | 水田 | 241.70 | 1.60 | 7.95 | 0.93 | 2.65 | 0.13 | 0.24 | 11.83 | 0.30 | 0 | 1.96 | 0 | 0 | 0 |
| 旱地 | 4.37 | 50.78 | 1.78 | 0.13 | 1.22 | 0.13 | 0.42 | 3.45 | 0.11 | 0 | 1.80 | 0 | 0 | 0 | |
| 有林地 | 22.51 | 12.21 | 1982.34 | 15.62 | 22.82 | 1.23 | 3.67 | 4.18 | 0.52 | 0 | 2.74 | 0.02 | 0 | 0.13 | |
| 灌木林 | 2.59 | 3.10 | 8.11 | 140.94 | 11.66 | 0.06 | 0.20 | 0.45 | 0.02 | 0 | 0.06 | 0 | 0 | 0.01 | |
| 疏林地 | 4.12 | 4.72 | 8.43 | 0.35 | 244.25 | 0.13 | 0.45 | 7.56 | 0.08 | 0 | 0.47 | 0 | 0 | 0 | |
| 其他林地 | 0.06 | 0.15 | 1.10 | 0.01 | 3.47 | 2.79 | 0.07 | 0.18 | 0.01 | 0 | 0 | 0 | 0 | 0 | |
| 草地 | 0.23 | 1.92 | 6.54 | 0.43 | 0.97 | 0 | 49.94 | 0.18 | 0 | 0 | 0.09 | 0 | 0 | 0 | |
| 建设用地 | 0.22 | 0.01 | 0.05 | 0.01 | 0.05 | 0 | 0.01 | 6.49 | 0.02 | 0 | 0 | 0 | 0 | 0 | |
| 河渠 | 1.33 | 0.43 | 0.26 | 0.02 | 0.09 | 0.05 | 0 | 0.12 | 11.53 | 0 | 0 | 0 | 0 | 0 | |
| 湖泊 | 0 | 0 | 0 | 0 | 0 | 0 | 0 | 0 | 0 | 0 | 0 | 0 | 0 | 0 | |
| 水库坑塘 | 0.10 | 0.02 | 0.77 | 0 | 0.19 | 0 | 0.01 | 0 | 0 | 0 | 9.12 | 0.29 | 0 | 0 | |
| 滩地 | 0 | 0 | 0.35 | 0 | 0 | 0 | 0 | 0 | 0.06 | 0 | 0 | 0.25 | 0 | 0 | |
| 沼泽地 | 0 | 0 | 0 | 0 | 0 | 0 | 0 | 0 | 0 | 0 | 0 | 0 | 0 | 0 | |
| 裸土地 | 0 | 0 | 0 | 0 | 0 | 0 | 0 | 0 | 0 | 0 | 0 | 0 | 0 | 0 | |
有林地与其他林地面积呈现先减后增再减“倒N”型特征,疏林地及灌木林面积呈先减后增“V”型特征。Ⅰ时段内,有林地、疏林地、灌木林、其他林地的面积均呈下降态势;Ⅱ时段内,有林地及其他林地呈上升特征,疏林地和灌木林面积则有所下降;Ⅲ时段内,有林地、疏林地、灌木林同上一时段变化特征相同,其他林地面积减少;Ⅳ时段内,林地面积整体呈上升特征,其中灌木林和疏林地的增量最为显著。有林地面积在该时段减量最大,转出类型以疏林地、灌木林地和水田为主,转出面积分别占转出总面积的40.80%、28.13%和13.93%。灌木林主要转入景观类型为有林地和旱地,分别转入134.75、10.70 km2。疏林地的主要转入景观类型为有林地、水田和旱地,分别转入195.44、23.13、32.19 km2。Ⅰ、Ⅱ、Ⅲ时段,婺源县旅游业发展可能对林地景观造成较大破坏,当地农户生计依靠林地资源,造成林地面积的不断减少。然而,随着乡村旅游的发展和保护意识的增强,农户生计转移到旅游业,林地利用度下降。因此,在后期阶段,林地面积有所增加。此外,旅游业的发展也影响不同休闲农业景观之间的转变。
耕地景观总面积呈波动起伏特征。具体来看,在Ⅰ时段内,水田面积呈下降特征,主要转出景观类型为旱地及有林地;Ⅱ~Ⅳ时段水田呈上升特征,主要转入景观类型为有林地、旱地、河渠及疏林地。在Ⅰ阶段内,旱地面积增长迅速,水田及有林地为主要转入景观;而在Ⅱ~Ⅳ时段内,旱地呈下降特征,有林地、水田、建设用地及疏林地为主要转出景观。在婺源县旅游业发展早期,旅游开发对耕地造成过度的干扰和破坏,存在过度占用耕地现象。然而随着乡村旅游发展,土地管控愈加严格,坚决遏制耕地“非农化”、严格管控“非粮化”,水田面积减少得到遏制,耕地农业景观逐渐走向良性发展道路,但旱地面积减少问题仍需受到重视。
草地景观面积发展呈“M”型特征。具体来看,在Ⅰ时段内,草地面积净增加14.01 km2,有林地为主要转入景观;而在Ⅱ及Ⅲ时段内,草地面积总体呈下降特征,主要转出景观为有林地、水田及旱地景观;在Ⅳ时段内,旱地、水田、有林地为主要转入草地景观类型,草地面积净增加36.14 km2。针对草地景观面积下降情况,需在旅游规划中合理安排旅游景点的空间布局,避免对草地造成过多的干扰和破坏;需鼓励开展生态旅游,将旅游与生态保护相结合,既保护草地生态,又增加旅游的吸引力。
水库坑塘、裸土地、河渠面积在研究时段内变化幅度较小。具体来看,水库坑塘在Ⅰ时段内面积增加了12.51 km2,主要从有林地转化而来,占转入总面积的55.99%;在Ⅱ、Ⅲ时段内,水库坑塘保持平稳状态,但在Ⅳ时段内减少了4.61 km2,主要转为有林地和水田。裸土地主要转为建设用地。河渠面积在Ⅰ时段内增长,主要来自有林地和水田的转入,其中分别转入11.94 km2和10.89 km2;在随后的3个研究时段内,河渠面积保持稳定。湖泊及沼泽地面积均呈先增后减特征,其中Ⅰ和Ⅱ时段为上升,Ⅲ和Ⅳ时段为下降。滩地及水库坑塘为湖泊、沼泽地主要转入景观,而水田和有林地为水库坑塘和滩地的主要转出景观。总体来看,水库坑塘、裸土地、河渠面积变化幅度较小,但在旅游发展过程中,仍需注意,对于生态敏感区域,要加强保护措施,防止过度开发和转化,增强游客的生态环境保护意识,实现旅游业的可持续发展与水域保护的双赢局面。
3 休闲农业景观格局指数分析
采用Fragstats软件,对婺源县栅格数据进行处理,分别计算2000、2005、2010、2015及2020年婺源县休闲农业景观破碎度、分离度、优势度、最大斑块指数及干扰度指数等景观格局指数。
3.1 景观尺度景观格局指数变化分析
由图2可知,景观破碎度与景观分离度呈“N”形波动起伏特征,景观优势度与干扰度呈先增后减特征。随着婺源县城镇化和旅游业的不断发展,建设用地扩张和交通路网愈加密集,景观破碎化程度不断加深。具体表现为耕地、林地斑块面积减少,斑块密度下降。同时,景观分布也变得更加复杂和多样化。此外,随着土地利用类型的不断变化和旅游用地的开发利用,各景观类型分布更加离散。这也导致了景观破碎度和分离度变化特征呈高度一致的特点。
图2
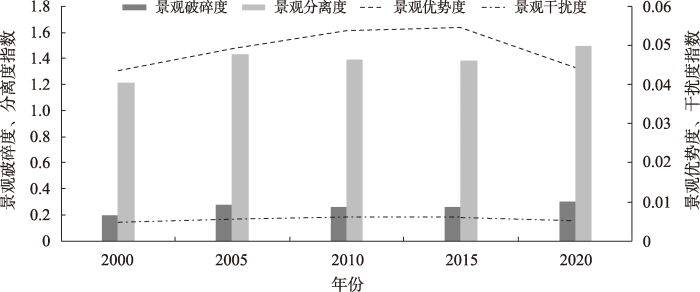
图2
休闲农业景观格局指数(景观尺度)
Fig.2
Recreational agriculture landscape pattern index (landscape scale)
在婺源县景观优势度方面,2000—2015年呈上升趋势。在这段时间内,林地面积占婺源县总面积的比例略有下降,但仍保持78.37%,而耕地面积占比较2000年提升4.82%。这说明耕地与林地的优势度较高,对整个景观的影响较为突出。随着建设用地斑块面积不断扩张,这使得景观水平优势度不断提升。然而,在2020年,景观优势度较2015年呈下降特征,这是因为婺源县作为国家文化生态保护区,生态文明建设得到了进一步推进,景观利用向多样性和均质化方向发展。这也反映了景观的优势度向更加平衡化和多样化方向发展,从而减弱了耕地和林地等景观类型的主导地位。
在景观干扰度方面,2000—2015年呈上升特征。在这段时间内,空间结构复杂程度增加,表明了受人为干扰的程度增加。这是乡村发展为满足基础设施建设、镇区开发和扩张的必然需求所导致的。然而,2015—2020年,景观干扰度下降。这主要得益于婺源县“两山”转化进程的加快,乡村旅游、红色旅游等低碳旅游形式推动了旅游经济绿色转型。经济发展的同时,也提高了休闲农业景观的承载力,实现了生产生活相协调,降低了景观受干扰程度。
3.2 类型尺度景观格局指数变化分析
通过测算婺源县在2000—2020年间的景观尺度景观格局指数,可以对整体休闲农业景观格局变化进行定量分析。同时还可以进一步从斑块类型尺度的角度,对不同土地利用类型的景观格局指数进行测算,以更深入地了解景观格局的变化特征。
由图3可知,水田破碎度较为稳定,草地、河渠及沼泽地破碎度呈先增后减特征,而其他休闲农业景观的破碎度总体均呈增长特征。具体来看,水田破碎度的稳定表明在土地整治、农业集约化收获方面取得了一定成效,水田的连片种植有助于推动高标准农田建设,提高耕地利用效率。然而,旱地破碎度呈上升特征,这会影响规模化生产,并且肯能对耕地数量、质量和生态安全造成影响。因此,旱地破碎化问题需要引起相关部门的高度重视。
图3
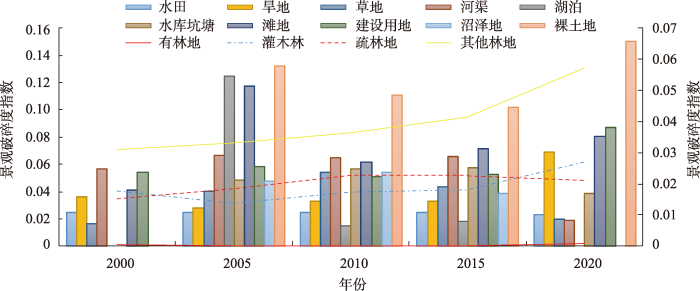
图3
休闲农业景观破碎指数(类型尺度)
注:柱形图使用左侧纵坐标,折线图使用右侧纵坐标。
Fig.3
Landscape fragmentation index for recreational agriculture (by land-use type)
林地的景观破碎化程度加深。随着城市和乡村建设用地面积的不断扩张,周边林地的面积不断被侵占。此外,旅游业的发展和景区开发以及旅游交通路线修建也导致了大量林地斑块的损失。这些因素共同导致林地景观的整体性和连通性受到了较大程度的影响。
在建设用地方面,2000—2015年间建设用地的破碎化程度呈下降特征。这可能与婺源县经济和人口迅速增长以及城镇化进程加快有关。在此期间,随着全域旅游产业的迅速发展,建设用地面积的增长速度也相应加快。然而,从2015年开始,建设用地的破碎化程度又有所增加。这可能与乡村旅游发展中空心村复垦等土地综合整治有关。
由图4可知,在婺源县的景观分离度方面,水田分离度较为稳定,河渠景观的分离度呈下降特征,疏林地、草地、水库坑塘及沼泽地的分离度呈先增后减特征,而其他的土地类型景观分离度总体呈增长特征。具体来说,水田景观分离度的稳定表明,在研究时段内,高标准农田建设和土地整治取得了成效,有效耕地面积得到了增加,同时水田的集约利用率和产出率也得到了提高。这可能得益于农业技术的进步和农业政策的支持。然而,林地、草地景观分离度逐渐上升,这可能表明在生产建设过程中,生态环境受到了一定程度的破坏,森林、草地资源保护和生态安全需要进一步加强。
图4
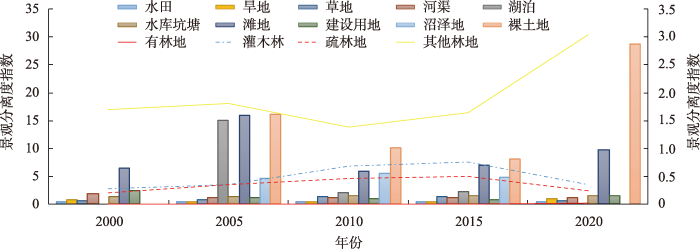
图4
休闲农业景观分离指数(类型尺度)
Fig.4
Recreational agriculture landscape separation index (by land-use type)
建设用地景观分离度的下降表明,农村建设用地整治和城镇工矿建设用地整治推动了建设用地集约化,优化了城乡建设用地布局和结构。这可能是由于城市化进程的加快和城市规划的不断完善,使得建设用地的利用效率得到了提高。
此外,河渠、湖泊、滩地及沼泽地等水域景观虽然面积较小,但在气候调节和生态保护中发挥着重要作用。为实现休闲农业景观的可持续发展,需要进一步扩大水域景观的比例,并控制周边人造景观对水域的侵蚀。在旅游发展方面,景观分离度的变化可能会对旅游规划和管理产生一定的影响。例如,水田、建设用地和河渠景观的分离度下降可能意味着这些区域的景观连通性得到了提高,可以更好地支持生态旅游和乡村旅游的发展。同时,林地和草地景观分离度的增加可能需要注意生态保护和景观的可持续性。
由图5可知,在婺源县的景观格局中,旱地、有林地及其他林地最大斑块指数呈先增后减特征,河渠、湖泊、水库坑塘景观LPI值总体呈上升特征,其余休闲农业景观总体呈下降特征。在休闲农业景观中,有林地LPI指数在研究时段内始终保持较高的水平,是全域的优势斑块类型,对全域的景观格局和生态环境发展具有重要的影响。然而,有林地的LPI指数呈下降特征,这表明在研究时段内,有林地转为水田及建设用地的现象较为普遍,这可能对全域生态平衡和可持续发展产生一定的不利影响。
图5

图5
休闲农业景观最大斑块指数(类型尺度)
Fig.5
Largest patch index for recreational agriculture landscapes (by land-use type)
在水田及旱地的最大斑块指数方面,两者在研究时段内略有下降。这表明在农业生产和粮食生产中,水田和旱地的破碎化程度有所增加,不利于高标准农田建设及提高粮食产能。因此,需要坚守永久基本农田红线,并严格管控建设用地随意占用耕地现象。
在草地方面,2000—2015年草地LPI值呈下降特征,表明在建设用地扩张及旅游发展过程中,草地景观的破碎化和分离程度增加,导致草地景观遭到破坏。然而,从2015开始,草地LPI值略有提升,这表明近年来婺源县在草地保护与开发方面取得了较好的进展,分离度与破碎度有所下降,草地景观得到一定程度的恢复。在旅游发展方面,休闲农业景观最大斑块指数的变化趋势可能会对乡村旅游开发和发展产生一定程度的影响。例如,有林地的LPI指数下降会影响生态旅游和乡村旅游的发展。同时,草地景观的恢复和保护对于提升旅游体验和维护生态平衡具有积极作用。
在婺源县的景观格局中,建设用地LPI增加值最高。这主要是由于城镇化建设、路网密度提高以及旅游景区、民宿、产业发展等推动建设用地连片集中,建设用地优势度不断提升,对整个景观格局产生了重要的影响。在早期,婺源县的建设用地扩张较为粗放,这在一定成程度上对休闲农业景观造成冲击和破坏,导致了土地利用结构发生较大变化,景观破碎度、分离度以及干扰度呈上升特征。然而,近年来,随着新型城镇化以及生态文明建设的要求和约束,土地节约集约利用能力得到了提升,土地粗放利用现象也得到了改善。
在河渠、湖泊、水库坑塘景观方面,LPI值呈缓慢上升的特征。水域面积增长了4.40 km2,占比增长了0.15%。婺源县实施河长制,对饮用水水源及地表水进行了保护,并开展了“六清”工程和“十大整治”项目,这些措施使得水域生态环境维持良好。
4 休闲农业景观格局演变驱动力分析
4.1 驱动力指标体系选取
景观格局变化驱动力因素是指导致区域土地利用发生变化的因素,包括自然、社会经济以及旅游驱动力因素。
在自然因素方面,降水量及平均气温对区域植被覆盖及水文生态产生直接影响,进而对景观造成差异化影响[49]。在社会经济因素方面,GDP增长往往来源于非农产业收入增加,非农生产活动会进一步引起建设用地对外扩张,进而引起景观格局演变[50]。人口增长会带来更多粮食需求,农林牧副渔业总产值、粮食、油料、肉类产值的提升意味着耕地、林地、草地、水域面积增加或生产效率提升[51]。城镇化率是导致乡村劳动力向城镇转移,并推动山区农村景观变化的直接驱动力。城镇人均可支配收入对建设用地具有依赖性,而农村可支配收入对耕地、林地、草地等景观具有依赖性。破碎化耕地、林地等休闲农业景观对城镇及农村居民收入产生影响[52]。在旅游因素方面,游客接待量的提升是推动景观变化的重要因素[53]。门票收入及旅游综合收入的增加会带来经济收益,进而扩大旅游规模和建设面积。同时,生态旅游收益也可为生态景观保护提供资金支持[54]。休闲农业景观是婺源乡村和森林旅游的基础,A级景区作为景观载体对景观格局演变具有重要影响[55]。旅行社和农家乐作为旅游基础配套设施,依托休闲农业景观特点,对现代农村聚落景观及休闲农业景观格局产生影响[56]。综上所述,景观格局变化的驱动力因素是一个综合体,需要综合考虑自然、社会经济和旅游因素对休闲农业景观变化的影响。
4.2 驱动力因素分析
(1) 社会经济因素与旅游因素为景观破碎度变化的主要驱动力,自然因素也有一定影响(表5)。婺源县属亚热带季风气候,地形以山地丘陵为主,导致休闲农业景观类型多样,景观破碎度较高。社会因素与旅游因素中,农村人均可支配收入和旅游综合收入是景观破碎度最大的2个驱动力。城镇人均可支配收入、游客接待量、旅行社数量同景观破碎度显著相关,且关联度较高,表明其对婺源休闲农业景观破碎度演变有重要影响。耕地、林地、草地、水域等休闲农业景观集中连片种养有利于提高粮食、油料、肉类产量,同时也有利于提高农村居民可支配收入。而农村人均可支配收入提高可以激发农民的生产积极性,促进农业集约化经营,从而降低休闲农业景观的破碎化程度。
表5 休闲农业景观格局指数与驱动因子灰色关联度
Tab.5
| 指标名称 | 景观破碎度 | 景观分离度 | 景观优势度 | 景观干扰度 | |||||||
|---|---|---|---|---|---|---|---|---|---|---|---|
| Pearson相关系数 | 关联度 | Pearson相关系数 | 关联度 | Pearson相关系数 | 关联度 | Pearson相关系数 | 关联度 | ||||
| GDP | 0.74 | 0.77 | 0.75 | 0.76 | 0.70 | 0.82 | 0.85* | 0.81 | |||
| 农林牧副渔业总产值 | 0.51 | 0.72 | 0.52 | 0.72 | 0.83* | 0.83 | 0.89** | 0.84 | |||
| 总人口 | 0.61 | 0.73 | 0.61 | 0.72 | 0.82* | 0.87 | 0.92** | 0.88 | |||
| 城镇人均可支配收入 | 0.83* | 0.76 | 0.82* | 0.75 | 0.21 | 0.72 | 0.45 | 0.75 | |||
| 农村人均可支配收入 | 0.99*** | 0.86 | 0.98*** | 0.82 | 0.17 | 0.63 | 0.47 | 0.63 | |||
| 粮食产量 | -0.18 | 0.67 | -0.20 | 0.67 | -0.99*** | 0.67 | -0.93** | 0.63 | |||
| 油料产量 | 0.55 | 0.67 | 0.54 | 0.66 | 0.56 | 0.79 | 0.67 | 0.81 | |||
| 肉类产量 | 0.34 | 0.67 | 0.35 | 0.67 | 0.85* | 0.85 | 0.86* | 0.85 | |||
| 城镇化率 | 0.74 | 0.73 | 0.73 | 0.72 | 0.43 | 0.69 | 0.62 | 0.67 | |||
| 游客接待量 | 0.82* | 0.81 | 0.82* | 0.81 | 0.58 | 0.79 | 0.77 | 0.78 | |||
| 门票收入 | 0.80 | 0.80 | 0.81 | 0.80 | 0.62 | 0.80 | 0.80 | 0.80 | |||
| 旅游综合收入 | 0.94** | 0.85 | 0.94** | 0.86 | 0.37 | 0.71 | 0.63 | 0.72 | |||
| A级景区数量 | 0.63 | 0.75 | 0.64 | 0.74 | 0.77 | 0.81 | 0.88* | 0.82 | |||
| 农家乐数量 | 0.60 | 0.71 | 0.60 | 0.71 | 0.79 | 0.88 | 0.89** | 0.86 | |||
| 旅行社数量 | 0.83* | 0.79 | 0.84* | 0.78 | 0.71 | 0.84 | 0.89** | 0.87 | |||
| 年降雨量 | -0.23 | 0.60 | -0.23 | 0.59 | 0.69 | 0.76 | 0.53 | 0.70 | |||
| 年均气温 | 0.84* | 0.76 | 0.85* | 0.77 | 0.36 | 0.75 | 0.59 | 0.77 | |||
注:*、**、***分别表示在0.1、0.05、0.01水平上显著相关。
旅游因素对婺源县休闲农业景观破碎化的影响较强,因此,在旅游开发和旅游活动中需要注意对休闲农业景观的保护和规划,以降低景观破碎化程度。同时,在乡村旅游的发展带动下,农户将宅基地、耕地、林地等用地流转或自营,用于发展旅游经济,这也会导致景观破碎化程度加深。
(2) 自然因素、社会经济因素及旅游因素均对景观分离度变化产生驱动作用,与景观破碎度驱动因素显著水平相同,但其驱动力大小略有不同。城镇、农村可支配收入入的增加表征经济活跃,对住房、娱乐、休闲等用地需求增加,并推动休闲农业景观向建设用地转变。而农村土地流转效率较低,农村土地、资金、劳动力等要素被城市虹吸,导致农村休闲农业景观分离程度加剧。
旅游因素是导致景观分离度提升的主要因素。其中,旅游综合收入、游客接待量、门票收入与景观分离度显著相关,且关联度较高,表明婺源县作为典型的旅游驱动型县域,旅游开发和旅游活动对婺源县休闲农业景观分离度产生重要影响。旅游业发展及项目开发得到政府财政和土地支持,旅游景区、乡村旅游、红色旅游等旅游发展用地新增较多,停车场、酒店、餐馆、农家乐等旅游配套设施用地增加。同时,修建公路、铁路等交通干线以提高旅游景区的可进入性,这些都会导致休闲农业景观分离度指数的上升。
2005—2015年婺源县发展生态旅游、康养旅游、森林旅游,控制旅游开发边界,休闲农业景观连通性提高,分离度指数略有下降。而2015—2020年,婺源县为上饶市重点旅游县,并做出“发展全域旅游,建设最美乡村”决策,编制《旅游发展总体规划》和20个旅游景点《旅游规划》,旅游业发展迎来新局面,旅游用地需求愈发紧张,导致休闲农业景观分离度呈上升特征。
(3) 社会经济因素与旅游因素对景观优势度变化产生重要影响。具体来说,粮食产量与景观优势度呈显著负向影响,但其关联度不高。农林牧副渔产值、肉类产量与景观优势度有显著影响且关联度较高,表明其为景观优势度的重要驱动力。农业经济的发展对景观优势度提升具有重要作用。旅游因素与景观优势度不显著,但婺源县农业发展与旅游业密切相关,农民通过销售农产品及肉类产品和提供旅游服务来提高经济收益和满足游客需求,进一步推动农业面积扩大,从而促使景观优势度增加,表明旅游因素对景观优势度有间接驱动作用。
婺源县通过休闲农业示范点、生态示范园、雕塑工厂等旅游景点开发,及养生、漂流、探险、体育等新旅游形式发展,提高了游客接待能力,从而提高了旅游业的规模和效益。这些旅游因素的发展与景观优势度密切相关,因为这些因素需要利用景观资源来吸引游客,同时也增加了休闲农业景观的优势度。
(4) 景观干扰度指数受到社会经济及旅游因素驱动影响较大。其中,总人口、旅行社数量、农家乐数量、肉类产量、农林牧副渔业总产值、A级景区数量和GDP都是重要的影响因素。随着婺源县的经济发展,总人口不断增加,这会导致土地和资源的压力增大,从而使得景观的承载力和稳定性下降,导致景观干扰度增加。旅行社和农家乐数量对旅游景观干扰度的影响主要在于它们的增加会导致旅游开发和旅游活动的增强,从而加速休闲农业景观的转变,导致景观的抗干扰能力下降,干扰度上升。肉类产量同景观干扰度呈正相关,农民扩大养殖规模,增加了农业的产值和效益,从而提高了景观的干扰度。农林牧副渔业产值同景观干扰度也呈正相关关系,因为随着农业和林业的发展,会需要更多的土地和资源来满足生产的需要,导致景观干扰度上升。
A级景区数量和GDP同景观干扰度的关系较为复杂。一方面,景区的开发和建设会导致休闲农业景观的转变,从而增加景观干扰度。另一方面,GDP的增长也反映经济的发展和收入的增加,可能会导致更多的旅游开发和旅游活动,从而进一步增加景观干扰度。经济发展和旅游因素的增强以及人口的增长都导致了景观干扰度的上升。然而,随着婺源县建设珍稀动物型、自然生态型、水源涵养型等自然保护区193处,并实施“山更绿、林更美、民更富”工程,以绿色发展引领生态文明建设,休闲农业景观抗干扰能力提升,景观干扰度下降。同时,油料产量不断提升和油菜花种植面积不断扩大,油菜花既可以产生经济价值,又能提供观赏价值,同时作为绿色旅游资源,也对提高休闲农业景观抗干扰度产生了积极作用。
5 结论与讨论
5.1 结论
本文采用3S技术、景观指数及灰色关联度等方法,从2000—2020年5期遥感影像数据的分析,对婺源县休闲农业景观格局的演变特征及其驱动力进行研究,主要结论如下:
(1) 婺源县的休闲农业景观与旅游地分布高度契合,婺源县林地和耕地为优势景观,休闲农业景观呈先减后增趋势,但总体上休闲农业景观面积减少。在景观转变方面,林地是耕地、草地、建设用地主要转入景观,而耕地是林地、草地主要转出景观且为建设用地主要转入景观。此外,水域在发展过程中主要转为耕地。未利用地的面积无明显变化。
(2) 在景观尺度上,景观破碎度与分离度呈“N”型波动起伏特征,而景观优势度与干扰度呈先增后减特征。在类型尺度上,水田破碎度、分离度较为稳定,草地和沼泽地破碎度、分离度呈先增后减特征,其余休闲农业景观破碎度总体均呈增长特征;旱地、有林地及其他林地LPI指数呈先增后减特征,河渠、湖泊、水库坑塘景观LPI指数总体呈上升特征,其余休闲农业景观总体呈下降特征。
(3) 旅游因素、社会经济因素和自然因素均对休闲农业景观格局的演变产生影响,其中旅游因素是导致各项景观格局指数演变的主要驱动因素。在旅游因素中,旅游综合收入、游客接待量、旅行社数量对景观破碎度和分离度有着显著的驱动作用;旅游因素对景观优势度产生间接影响;A级景区、农家乐、旅行社数量对景观干扰度的演变也具有重要影响。在社会经济因素中,农村人均可支配收入及城镇人均可支配收入对景观破碎度和分离度的影响最高;总人口、肉类产量和农林牧副渔业总产值则对景观优势度和干扰度的演变产生重要影响。在自然因素中,年均气温对景观破碎度和景观分离度有较强驱动作用,年均降雨量对景观格局指数的演变作用影响较弱。
5.2 讨论
本文以婺源县为研究对象,从乡村旅游发展视角对休闲农业景观的演变、景观格局指数及其驱动力因素进行分析,旨在丰富现有农业景观格局的研究内容,并为婺源县休闲农业与乡村旅游的优化布局及旅游高质量发展提供理论参考和现实依据。
(1) 在婺源县,休闲农业景观面积减少,建设用地扩张和生态保护的矛盾突出。旱地破碎化、分离化程度加剧,后备土地资源不足,未来仍面临耕地保护与土地合理利用难题。经济增长、城镇化及旅游开发建设强度不断加大,导致景观破碎化、分离化程度加深[57]。耕地、林地、草地为建设用地主要转入景观,导致休闲农业景观优势度下降。婺源县早期休闲农业景观干扰度呈上升特征,经济、社会及旅游效益协调性较差;后期通过制定和执行相关环境保护政策,进行土地及旅游景区的合理规划,以及注入生态旅游资金,景观干扰度指数下降,表明休闲农业景观趋于稳定,抗干扰、抗风险能力提高。婺源县已走出一条保护和开发良性互动的绿色崛起之路。
林地是婺源县的优势景观,虽然其经济价值较低,但生态价值较高。因此,应该严格保护林地,维护森林安全,确保其生态价值的稳定和发挥。同时在保证林地红线的基础上,可以结合旅游产业,充分发挥林地的经济功能,如生态旅游、森林探险等。另外,油菜花景观是婺源县的特色绿色旅游资源,应该在保证耕地红线的基础上,充分挖掘和利用这一旅游资源优势,全面践行“山水林田湖草生命共同体”,打造“中国最美乡村”旅游品牌。这样不仅可以提升婺源县的旅游形象和吸引力,还可以促进当地经济发展和生态保护的结合。
(2) 休闲农业景观格局在不同自然及社会经济因素的干扰类型和驱动程度下会产生变化。在自然因素中,年均气温决定了农作物的生长周期,而年降雨量则影响了土地的水文条件,这些因素均会对农作物种植类型及分布产生影响,从而影响休闲农业景观的构成与分布。在社会经济因素中,GDP、人均可支配收入,人口规模和农产品产量等也会对休闲农业景观产生影响。随着婺源县的经济和社会发展,对建设用地以及基础设施用地的需求不断增加,导致城市和农村边缘地带的土地类型逐渐转变为建设用地,从而对景观格局演变产生显著的驱动作用。此外,城镇化率的提升也会带动区域发展,加快城镇化进程,打破原有的用地结构,导致休闲农业景观破碎度和分离度加深[58]。
(3) 旅游因素是婺源县休闲农业景观格局变化的主要驱动力。景区发展规划、游客活动及旅游配套设施会导致研究区域呈不同生态学过程及休闲农业景观格局[59]。在婺源县的旅游发展早期,为了开发旅游资源和发展民宿产业,以及建设旅游基础配套设施,旅游景区周边地类向建设用地转变。这导致林地、耕地、草地等休闲农业景观未得到充分保护利用,景观多样性下降,破碎度和分离度程度加深,环境承载力下降,导致景观干扰度不断提升[60]。然而,在2015年后,婺源县开始结合优质的生态绿色本底,推动生态、低碳旅游项目,积极打造国家生态旅游示范区、国家级文化与旅游生态县、全国低碳旅游试验区。这使得景区周边地类不再向建设用地单一化发展,休闲农业景观得到多元化体现。同时,在旅游经济发展的基础上,婺源县开始提升环境承载力,转变发展模式,进行供给侧改革,以实现旅游业的高质量发展,降低旅游粗放发展对景观格局及生态环境的破坏程度[61]。
在旅游高质量发展和生态文明建设背景下,婺源县需要将旅游发展和生态保护相结合,实现“占补平衡”,严控制建设用地占用耕地、林地,减少休闲农业景观破碎化和分离化程度。同时,需要节约集约利用土地,充分挖掘存量非农建设用地潜力,合理规划旅游交通线路,有序管控建设用地扩张。此外,还需要充分利用景区周边休闲农业景观,加强生态用地保护和利用。
参考文献
乡村旅游产业带动农村经济发展机制研究
[J].
Study on the mechanism of rural economic development driven by rural tourism industry
中国区域共同富裕实践中乡村旅游作用机制
[J].
DOI:10.31497/zrzyxb.20230208
[本文引用: 1]

以2011—2020年中国31个省(市、自治区)为样本,构建乡村旅游发展水平与区域共同富裕的指标评价体系,实证测度和分析了中国乡村旅游发展水平与区域共同富裕的时空特征,采用空间自相关方法揭示其空间关联特征,同时,运用空间计量模型对乡村旅游与区域共同富裕之间的关系及其影响机制进行深入分析和探讨。结果表明:(1)中国乡村旅游发展水平与区域共同富裕持续、稳步提升,且在地理空间上呈现较显著的空间集聚与关联特征;(2)乡村旅游发展对区域共同富裕具有明显的正向影响及空间溢出效应,即乡村旅游发展水平每提升1%,本地共同富裕水平将上升0.258%,邻近省域上升0.126%;(3)乡村旅游分级指标中经济效益、生态效益、发展条件对本地共同富裕存在正向作用,且对邻近省域存在不同程度溢出效应,文化效益仅存在直接效应,溢出效应不显著;(4)乡村旅游发展对于区域共同富裕的影响程度存在区域差异,其中,中部地区乡村旅游发展对区域共同富裕水平的提升作用更大。
The mechanism of rural tourism in the practice of regional common prosperity in China
DOI:10.31497/zrzyxb.20230208
[本文引用: 1]
Taking 31 provincial-level regions in China from 2011 to 2020 as samples, we construct the index evaluation system of rural tourism development level and regional common prosperity, empirically measure and analyze the spatial and temporal characteristics of rural tourism development level and regional common prosperity in the country, and use spatial autocorrelation method to reveal their spatial correlation characteristics. At the same time, the relationship between rural tourism and regional common prosperity and its influence mechanism are analyzed and explored in depth by using spatial econometric model. The results show that: (1) China's rural tourism development level and regional common prosperity continue to steadily improve, and in geographic space present a more significant spatial clustering and correlation characteristics. (2) Rural tourism development has a significant positive impact and spatial spillover effect on regional common wealth, for every 1% increase in the development level of rural tourism in China, the local common wealth level will rise by 0.258% and the neighboring provinces by 0.126%. (3) The economic benefits, ecological and environmental benefits, and development conditions in the rural tourism grading index have positive effects on local regional common prosperity, and there are spillover effects on neighboring cities. There are different degrees of spillover effects, cultural benefits only have direct effects, and spatial benefits are not significant. (4) There are regional differences in the degree of influence of rural tourism development on regional common prosperity, among which, the central region plays a greater role in enhancing the level of common prosperity by rural tourism development.
社区弹性促进乡村旅游高质量发展: 以台湾省桃米村为例
[J].
Community resilience promotes the high-quality development of rural tourism: Taking Taomi Village in Taiwan Province as an example
基于MOP-PLUS模型的新疆阿克苏地区土地利用景观格局优化及多情景模拟
[J].
Optimization of land use landscape pattern and multi-scenario simulation in Aksu region of Xinjiang based on MOP-PLUS model
空间异质性定量研究理论与方法
[J].
Theory and methodology of spatial heterogeneity quantification
In this paper, semivariogram was used to quantify the spatial heterogeneity in landscape.It was suggested that spatial characteristics and spatial comparison were the main aspects of spatial heterogeneity quantification.For spatial characteristics, the authors emphatically discussed how to use semivariogram to decompose spatial heterogeneity into quantifiable components, to determine the degrees of spatial heterogeneity, and to detect the scale at which spatial heterogeneity changes.For spatial comparison, the authors expounded how to statistically test the parameters of semivariograms to compare the spatial heterogeneity between same variable at two sites or different variables at same site, and put forward the standardized semivariograms to compare the spatial heterogeneity with different variables at the same site.The introduced theory and methodology were examined by the example of spatial heterogeneity of forest types and soil types in landscape of broadleaf Korean pine forests.
Agricultural landscape change (1937-2002) in three townships in Iowa, USA
[J].DOI:10.1016/j.landurbplan.2010.12.007 URL [本文引用: 1]
Agricultural landscape change and stability in northeast Thailand: Historical patch-level analysis
[J].DOI:10.1016/j.agee.2003.09.024 URL [本文引用: 1]
How measures of agricultural landscape patterns are affected by crop rotation dynamics
[J].DOI:10.1007/s10980-019-00823-w [本文引用: 1]
Tree species diversity and spatial distribution patterns on agricultural landscapes in sub-humid Oromia, Ethiopia
[J].
DOI:10.1007/s10457-018-0197-7
[本文引用: 1]
Trees are important components of agricultural landscapes in different parts of Ethiopia, and information on their type, diversity and distribution in sub-humid agroecologies is essential for designing interventions. A study was conducted to evaluate tree diversity and their spatial patterns in agricultural landscapes under different land use categories in four selected sub-humid sites in Western Oromia, Ethiopia. Tree inventory was conducted on 100 homesteads (19ha), 18 crop lands (35ha) and 11 grazing lands (5.5ha) belonging to 100 randomly selected households. A total of 82 tree species were identified: 67 in the homesteads, 52 in the crop lands and 29 in the grazing lands. The density of trees varied from 68 trees per ha in crop lands to 801 trees per ha in homesteads. Diversity indices revealed that homestead was the most diverse with Shannon index of 2.42, and Simpson index of 0.84. The density of trees among the tree communities in the four sites varied from 133 in Bako Tibe to 476 in Jima Arjo, but not any one of the sites had more diverse tree community as revealed by the Renyi diversity profiles analysis. The three dominant tree species in the agricultural landscapes were Eucalyptus camaldulensis, Vernonia amygdalina and Cordia africana. Pearson correlation analysis showed that high tree species density, richness and diversity had high association with homesteads than with crop lands and grazing lands. It also revealed significant positive correlations between land size and evenness, and latitude and evenness whereas there were significant negative correlations between family size and Shannon diversity index, and land size and tree density. The majority (81.6%) of the trees were established through plantation and only 18.4% were regenerated naturally. The proportion of planted trees varied from 68% in Gobu Seyo to 94.1% in Guto Gida. The study showed that agricultural landscapes harbour high diversity of tree species with a spatial pattern, and increasing the tree cover with focus in the crop lands is essential for improved resilience of the agricultural systems and for circa-situm conservation of biodiversity.
Anuran responses to spatial patterns of agricultural landscapes in Argentina
[J].DOI:10.1007/s10980-016-0426-2 URL [本文引用: 1]
Swedish agricultural landscapes: Patterns and changes during the last 50 years, studied by aerial photos
[J].DOI:10.1016/0169-2046(94)01033-5 URL [本文引用: 1]
Characterizing fine-scale patterns of alternative agricultural landscapes with landscape pattern indices
[J].DOI:10.1007/s10980-004-5036-8 URL [本文引用: 1]
Patterns of change in two contrasting Norwegian agricultural landscapes
[J].DOI:10.1016/S0169-2046(99)00055-9 URL [本文引用: 1]
Urbanization process and the changing agricultural landscape pattern in the urban fringe of Metro Manila, Philippines
[J].
DOI:10.1177/0956247807076782
URL
[本文引用: 1]
This paper discusses physical changes in the urban fringe agricultural landscape of Metro Manila and the socioeconomic factors and other pressures underlying these changes. In 1982, agricultural land use dominated in both of the two study areas, but the area under cultivation had decreased by 1997. The changing pattern in the northwest study area was one of phased transition towards a more urban land use. In contrast, in the southeast study area, there was a sudden change from an agricultural to an urban landscape. The paper explores the reasons for this difference and recommends the conservation of green open spaces through the adoption of an ecological planning approach involving a mixture of urban and agricultural land uses.
景观格局及生态系统服务价值响应: 以千阳县为例
[J].
On the landscape pattern change and the ecological service value response: Taking Qianyang County as an example
亚热带典型农林混合流域河流氮磷输出负荷特征及与景观格局关系
[J].
Characteristics of river nitrogen and phosphorus loadings and its relationship with landscape pattern in subtropical mixed agricultural and woodland catchments
基于休闲农业发展的现代农业观光园景观规划设计研究: 评《从农业观光园到田园综合体: 现代休闲农业景观规划设计》
[J].
Study on landscape planning and design of modern agricultural sightseeing garden based on the development of leisure agriculture: Comment on "From agricultural sightseeing garden to pastoral complex: Landscape planning and design of modern leisure agriculture"
闽三角地区土地覆盖变化遥感监测及景观格局变化研究
[J].
The study on land cover change remote sensing monitoring and landscape pattern change in Fujian delta region
基于GWR模型的福建省绿色空间景观格局演变影响因素及其空间差异
[J].
Evolution of landscape pattern of green space in Fujian Province: Influencing factors and spatial differences based on GWR model
盐池湾高寒湿地景观格局演变及其影响因素
[J].
Landscape pattern evolution and its influencing factors of alpine wetland in Yanchi Bay
乌鲁木齐市景观格局变化及驱动力分析
[J].
Analysis of landscape pattern change and driving force in Urumqi City
2003—2018年瑞兴于地区土地利用景观格局时空演变及驱动因素
[J].
Spatiotemporal evolution of landscape pattern of land use and its driving factors in Ruijin-Xingguo-Yudu region from 2003 to 2018
城市扩张对北京市城乡结合部自然和农业景观的影响: 以昌平区三镇为例
[J].
The impact of the urban sprawl on natural and agricultural landscape at the urban-rural interface of Beijing: Taking three towns of Changping District for example
典型旅游区景观格局演变研究: 以广西阳朔县为例
[J].
Landscape pattern evolution of typical tourism area: A case study of Yangshuo of Guangxi
基于生态敏感性评价及景观格局分析的国家公园风景资源保育研究: 以湖北神农架国家公园为例
[J].
Conservation of scenic resources in national park based on ecological sensitivity assessment and landscape pattern analysis: A case study of Shennongjia national park in Hubei Province
山区民族旅游型乡村聚落格局演变研究: 以贵州西江千户苗寨为例
[J].
Evolution of settlement pattern of ethnic tourism villages in mountainous areas: A case study of Xijiang Qianhu Miao Village, Guizhou Province
旅游型乡村景观格局变化及生态系统服务价值响应: 以江苏省无锡市太湖国家旅游度假区为例
[J].
Landscape pattern change and its response to ecosystem services value in a rural tourism area: A case study at Taihu national tourism resort in Wuxi City of Jiangsu Province
旅游干扰下流域多尺度景观格局演化特征及驱动因素: 以新安江流域为例
[J].
Evolution characteristics and driving factors of basin multi-scale landscape pattern under the tourism disturbances: A case study of the Xin'an River Basin
乡村旅游区的景观格局空间演变分析: 以成都市三圣乡为例
[J].
Landscape pattern evolution analyses for rural tourism planning: A case study of Sansheng Town in Chengdu
高原湖泊乡村聚落空间分异及驱动力探测: 以环洱海地区为例
[J].
Spatial differentiation and driving factors of rural settlement in plateau lake: A case study of the area around the Erhai
1980—2018年扎龙湿地及乌裕尔河流域景观格局演变及其响应
[J].
Landscape pattern change and response analysis in Zhalong Wetland and the Wuyuer River Basin, 1980-2018
纵向岭谷区澜沧江流域景观生态安全时空分异特征
[J].
The temporal and spatial characteristic of landscape ecological security at Lancang River Watershed of longitudinal range gorge region in Southwest China
基于土地利用变化的细河流域景观生态风险评估
[J].
Landscape ecological risk assessment of Xi River Basin based on land-use change
Evaluating the effectiveness of landscape metrics in quantifying spatial patterns
[J].DOI:10.1016/j.ecolind.2009.04.017 URL [本文引用: 1]
基于土地利用变化的盐城海岸带生态风险评价
[J].
DOI:10.11821/dlyj201606002
[本文引用: 1]
在GIS和RS技术支持下,以行政区划为评价单元,从景观结构角度构建生态风险评价模型,借助地统计分析及空间自相关分析方法,对盐城海岸带地区2000-2010年景观生态风险的时空分异特征进行定量评价。结果表明:2000-2010年,盐城海岸带地区整体生态环境质量有所下降。10年间,研究区生态风险平均值从0.35增长至0.39,高等级生态风险区不断增加。土地利用生态风险程度整体空间分异性不断增加,局部呈现高—高聚集和低—低聚集。较高风险区和高风险区主要分布于射阳县、大丰市大丰港以北的沿海区域以及东台弶港附近,其原因主要是随着沿海开发的推进,临港产业和临海城镇的发展,海岸带土地利用变化加剧,沿海地区生态系统稳定性被破坏。
Ecological risk assessment based on land use changes in the coastal area in Yancheng City
DOI:10.11821/dlyj201606002
[本文引用: 1]
Based on remote sensing data and land use data supported by the GIS and RS technologies, the land use changes and its transformation have been quantitatively analyzed in the coastal area in Yancheng city during 2000-2010. Furthermore, considering the land use changes and landscape structures with the help of geostatistical analyst and spatial autocorrelation analysis, the ecological risk assessment model has been set up. Thus, we quantitatively evaluated the spatial and temporal dynamic changes of landscape ecological risk. It is shown that the average ecological risk value of the entire region was 0.35 in 2000, and increased from 0.36 in 2005 to 0.39 in 2010. In recent 10 years, the moderate ecological risk level covered the biggest area of the study area; the area of extremely low risk and low ecological risk had no obvious change and mainly located in inland area; the area with high risk and extremely high risk expanded, and its proportion of the total land from 0 in 2000 rose to 14.89% in 2010; the area of high ecological risk increased significantly and was mainly distributed in coastal zone of Sheyang, Dongtai and Dafeng; the degree of ecological risk showed the banded structure clearly, and increased seawards. With the economic boom, especially port industry and new town development in the coastal areas, land use has intensively changed; as a result, the ecological risk increased continuously.
1976—2013年三江平原景观生态风险变化及驱动力
[J].
A long-term site study for the ecological risk migration of landscapes and its driving forces in the Sanjiang Plain from 1976 to 2013
新疆玛纳斯河流域景观格局演变及驱动力分析
[J].
Analysis on landscape pattern change and driving force in Manas River Basin
新疆玛纳斯河流域用水结构演变及其驱动力分析
[J].
Evolution and driving forces of water consumption structure in the Manas River Basin in Xinjiang
中国多时期土地利用遥感监测数据集(CNLUCC)
[DB/OL].
China Multi-period Land Use Remote Sensing Monitoring Dataset (CNLUCC)
苏南水网地区景观格局演变分析及其驱动因素探究: 以七都镇为例
[J].
Landscape pattern evolution and the driving factors in southern Jiangsu water network area: A case study of Qidu Township
华北农田生态系统景观格局的演变特征
[J].
Change characteristics of landscape pattern in farmland ecosystems in North China
基于ANN-CA模型的重庆市多级流域耕地景观格局演化及预测
[J].
Evolution and prediction of cultivated land landscape pattern in multi-level watershed of Chongqing based on ANN-CA model
Planted forests and biodiversity
[J].
农牧交错带草地景观格局特征及其影响因素分析
[J].
Analysis of characteristics and influencing factors of grassland landscape pattern in the farming-pasturing interlocked areas
杭州湾北岸上海段水域景观生态格局变化遥感研究
[J].
Remote sensing study on the Changes in the landscape of ecological patterns in the Shanghai section of the north shore of Hangzhou Bay
基于景观连通性的怀来县未利用地开发建设适宜性评价
[J].
Suitability evaluation of unused land as construction land in Huailai based on landscape connectivity theory
20世纪80年代末以来中国土地利用变化的基本特征与空间格局
[J].
Spatiotemporal characteristics, patterns and causes of land use changes in China since the late 1980s
DOI:10.11821/dlxb201401001
[本文引用: 1]
Land-Use/land Cover Changes (LUCC) are a direct consequence of human and nature interactions. China's Land Use/cover Datasets (CLUD) were updated regularly at five-year intervals from the late 1980s to the year of 2010 with standard procedures based on Landsat TM/ETM + images. A dynamic zoning method was proposed to analyze major land-use conversions. The spatiotemporal characteristics, differences, and causes of land-use changes at a national scale were then examined. The main findings are summarized as follows: Land-Use Changes (LUC) across China indicated a significant variation in spatial and temporal characteristics in the past 20 years between the 20th and 21st centuries. The amount of cropland change decreased in the south and increased in the north, but the total area remained almost unchanged. The reclaimed cropland was shifted from northeast to northwest. The built-up lands were expanded rapidly, which were mainly distributed in the east and gradually spread out to the midwest. Woodland decreased first and then increased, but desert area was inverted. Grassland continued decreasing. Different spatial patterns of LUC in China were found between the late 20th century and the early 21st century. The original 13 LUC zones were replaced by 15 units with changes of boundaries in some zones. The main spatial characteristics of these changes included (1) an accelerated expansion of built-up land in the Huang-Huai-Hai region, the coastal areas of southeastern China, the midstream area of the Yangtze River, and the Sichuan Basin; (2) the shifted land reclamation in the north from Northeast China and eastern Inner Mongolia to the oasis agricultural areas in Northwest China; (3) the continuous transform from rain-fed farmlands in Northeast China to paddy fields; and (4) the effectiveness of the “Grain-for-Green” project in the southern agricultural-pastoral ecotones of Inner Mongolia, the Loess Plateau, and mountainous areas of southwestern China. In recent two decades, although climate change in the north impacted the change in cropland, policy regulation and economic driving forces were still the primary causes of LUC across China. During the first decade of the 21st century, the anthropogenic factors that drove variations in land-use patterns have shifted the emphasis from one-way land development to both development and conservation. The "dynamic zoning method" was used to analyze changes in the spatial patterns of zoning boundaries, the internal characteristics of zones, and the growth and decrease of units. The results revealed "the pattern of the change process," namely the process of LUC and regional differences in characteristics at different stages. The growth and decrease of zones during this dynamic LUC zoning, variations in unit boundaries, and the characteristics of change intensities between the former and latter decades were examined. The patterns of alternative transformation between the "pattern" and "process" of land use and the reasons for changes in different types and different regions of land use were explored.
改革开放以来珠三角地区农业功能转变与景观形态演变
[J].
Agricultural function and landscape change in the Pearl River Delta since reform and opening up
濂水流域降雨变化和景观格局演变的径流效应
[J].
DOI:10.13287/j.1001-9332.202301.027
[本文引用: 1]
降雨和景观格局是影响流域径流过程的两大主要因素,开展二者的径流效应研究对流域水资源管理、生态建设等具有重要意义。本研究以赣南红壤丘陵区的濂水流域为对象,基于1958—2020年的降雨、径流和土地利用数据,分析降雨、景观格局和径流的变化特征,以及降雨、景观格局与年径流、洪枯径流的关系。结果表明: 研究期间,流域年降雨量、年径流量、年最大1 d径流量均呈非显著下降趋势,年最小1 d径流量呈非显著上升趋势且年际变化幅度最大;有林地为流域内占比最高的景观类型,其他林地的变化最剧烈;景观水平上,流域的Shannon多样性指数、Shannon均匀度指数、斑块密度、景观形状指数分别由1980年的1.125、0.541、0.667、16.925上升至2020年的1.348、0.614、0.731、18.172,景观蔓延度指数由1980年的68.237下降至2020年的64.293,流域整体景观多样性、破碎化程度、形状复杂程度提高,空间分布趋于均匀,连通性降低。降雨量与年径流、洪水径流、枯水径流的相关系数分别为0.907、0.594、0.558;类型水平上,耕地减少对年径流、洪枯径流的影响均较大,而景观水平上的整体变化促进了年径流和洪水径流减少、枯水径流增加。降雨变化和景观格局演变对年径流、洪水径流和枯水径流变化的贡献率分别为17.8%、82.2%,1.5%、98.5%和-8.8%、108.8%。研究成果可为流域景观格局配置、水土流失综合治理等提供理论参考。
Runoff effect of precipitation variation and landscape pattern evolution in Lianshui Watershed, Jiangxi, China
DOI:10.13287/j.1001-9332.202301.027
[本文引用: 1]
Precipitation and landscape pattern are two main factors affecting runoff process of the watershed. Understanding their runoff effect is of great significance to water resources management and ecological construction of watershed. Based on the data of precipitation, runoff, and land use from 1958 to 2020, we analyzed the characteristics of precipitation, landscape pattern and runoff in Lianshui watershed in red soil hilly area of southern Jiangxi Pro-vince, established the relationship between precipitation, landscape pattern and annual runoff, flood runoff, low runoff, respectively. The results showed that the annual precipitation, runoff and annual maximum one-day runoff in the watershed showed a non-significant downward trend during the study period, while the annual minimum one-day runoff showed a non-significant upward trend but with the largest inter-annual variation range. Forested land was the landscape type with the highest proportion in watershed, and other woodland had the most dramatic variation. At the landscape level, Shannon diversity index, Shannon evenness index, patch density and landscape shape index increased from 1.125, 0.541, 0.667 and 16.925 in 1980 to 1.348, 0.614, 0.731 and 18.172 in 2020, respectively, while the landscape contagion index decreased from 68.237 in 1980 to 64.293 in 2020. The overall landscape diversity, fragmentation degree and shape complexity of the watershed increased, the spatial distribution tended to be uniform, and the connectivity decreased. The correlation coefficients between precipitation and annual runoff, flood runoff, low runoff were 0.907, 0.594 and 0.558, respectively. At the class level, the reduction of cultivated land had a greater impact on annual runoff, flood runoff, and low runoff, while the overall change at the landscape level promoted a decrease in annual runoff and flood runoff and an increase in low runoff. The contribution rate of precipitation variation and landscape pattern evolution to the change of annual runoff, flood runoff,and low runoff were 17.8%, 82.2% and 1.5%, 98.5% and -8.8%, 108.8%, respectively. Our results could provide theoretical refe-rence for landscape pattern allocation and comprehensive management of soil and water loss.
基于GIS空间分析的江西红色旅游资源空间特征及其开发适宜性研究
[J].
Study on the spatial characteristics of Jiangxi red tourism resources and their development suitability based on GIS spatial analysis
“二调”以来湖北省耕地变化的时空特征及其驱动因子识别
[J].
Spatiotemporal change of cultivated land and its driving factors in Hubei Province since the second land resource survey
耕地景观破碎化成因及对农村收入影响分析
[J].
Assessment of determinants of cultivated land fragmentation and its impacts on rural income
面向游客出行需求的景区道路功能等级体系
[J].
Scenic area road functional classification system based on tourist travel demand
A global perspective on trends in nature-based tourism
[J].
贵州省传统村落居民点空间分布及其影响因素
[J].
Spatial distribution of residential areas in traditional villages of Guizhou Province and its influencing factors
浅析“农家乐”及其景观规划
[J].
On peasant-household tourism and its landscape planting
喀斯特地区县域土地利用变化及其原因分析: 以贵州省黔西县为例
[J].
Land use change and its causes in counties in Karst Region: A case study on Qianxi County of Guizhou
1988—2016年婺源县土地利用变化及其影响因素分析
[J].
The analysis on land use change and its influencing factors in Wuyuan County during 1988-2016
新疆天池景区生态安全度时空分异特征与驱动机制
[J].
DOI:10.11820/dlkxjz.2013.03.017
[本文引用: 1]
本研究基于2000、2010年新疆天池风景名胜区的TM遥感影像、2000-2010年新疆统计年鉴、野外实地调查等数据,构建研究区的景观生态安全度,采用ESDA、半变异函数空间分析、逐步回归等方法,分析各样点景观生态安全度的时空演变特征,探讨导致格局演变的驱动机制。结果表明:① 2000-2010年,高景观生态安全度范围由南向北转移;中景观生态安全度区域由南北向中部集中;低景观生态安全度呈现由南向北扩散的趋势。② 景观生态安全度全局空间自相关较显著,随时间演变,空间集聚水平降低;局域空间自相关呈现集群分布向随机分布转变的趋势。③ 变程范围内,景观生态安全度值的各向异性与弱空间相关性特点是结构性因素和随机性因素综合作用的结果。④ 经度、纬度、海拔因子对景观生态安全度的影响显著;放牧、旅游以及政策活动影响景观生态安全度中小尺度格局,对景观生态安全度的演变有重要影响。
Characteristics of temporal-spatial differences in landscape ecological security and the driving mechanism in Tianchi scenic zone of Xinjiang
DOI:10.11820/dlkxjz.2013.03.017
[本文引用: 1]
The Tianchi scenic zone of Xinjiang, one of Xinjiang Tianshan Mountain's world natural heritage sites, contains well-preserved natural landscapes. Landscape ecological security is an important environmental protection indicator. In this article, gridded spatial models for the degrees of landscape ecological security in the scenic zone are constructed based on TM images from 2000 to 2010, almanacs of Xinjiang from 2000 to 2010 and the data of field survey. By using ESDA and semi-variogram for spatial analysis, and the stepwise regression methods, the characteristics and the driving forces of the evolvement of temporal-spatial differences among the individual quadrats are analyzed. The results indicate that: (1) During 2000-2010, the areas with high degrees of landscape ecological security shifted from south to north; the areas with medium degrees shifted to the center from the south and north; the areas with low degrees showed a trend of expanding from south to north. (2) From 2000 to 2010, <i>Moran's I</i> reflected positive spatial autocorrelation of landscape ecological security, but the level of spatial concentration decreased and was unstable with time. The local indicators of spatial association showed that the degrees of landscape ecological security exhibited a trend of change from a clustered to a random distributed pattern. (3) Within the variation range, the value of landscape ecological security exhibited anisotropy and weak spatial correlation features, as a result of combined effects of structural and stochastic factors. (4) The longitude, latitude and altitude significantly affected the degree of landscape ecological security. In small and medium landscape scales, grazing, tourism, and policy activities had major impacts on the evolvement of the landscape ecological security.
基于景观格局及元胞自动机—马尔科夫模型的县域生态风险评价: 以江西省婺源县为例的实证研究
[J].
Assessment on ecological risk of counties based on landscape pattern and CA-markov model: Empirical study on Wuyuan County in Jiangxi Province
“双碳”目标下江西省旅游业碳排放效率时空特征及其影响因素
[J].
Spatial and temporal characteristics of carbon emission efficiency of tourism in Jiangxi Province under the "double carbon" target and its influencing factors
