

亚洲疆域辽阔,气候变化过程复杂多样,热带季风区尤为明显[8⇓-10]。首先,亚洲气候变化总体呈现增暖、增湿发展趋势,但因季节和区域而异。亚洲旱涝灾害与季风年际涛动关系紧密,即强季风年降水量增多并易引发洪涝灾害,反之亦然[11-12]。在高温室气体排放情景(RCP8.5)下,21世纪末亚洲平均温度将上升5 ℃以上,且高纬地区增温更快,而南亚—东南亚等低纬地区升幅较小(约3 ℃)[4,13]。其次,作为亚洲热带季风典型气候区,南亚与东南亚气候变化过程差异显著。基于第六次国际耦合模式比较计划(CMIP6)预测,21世纪南亚温度和降水量将持续上升(增加),冬季增温高于夏季、区内年降水量变化率相差悬殊[14-15]。又如,东南亚升温与季风降水量变异性表现出强相关性,即增温将导致其季风降水量频繁变化与转移[16]。鉴于南亚、东南亚温度和降水量与厄尔尼诺—南方涛动(ENSO)、印度洋偶极子等大尺度气候事件密切相关并表现出显著时空异质性[17],需加强新数据在该区温度与降水量等气候要素演变与突变研究。相关新认识对探索气候变化背景下全球活跃火发生发展过程与机理具有重要作用[18-19]。然而,本区温度与降水量研究仍存数据精度不够、缺乏时间(月际)与空间(1 km)精细化演变研究等问题。地球表层区域高分辨率气候数据集(climatologies at high resolution for the earth land surface areas,CHELSA)与同类温度数据产品WorldClim (global climate and weather data)、CRU (climatic research unit)及ERA-Interim相比准确度相近,但其降水量预测有明显改进[20]。这对刻画具有显著旱/雨季特征的热带季风区气候变化尤为重要。然而,当前CHELSA相关研究多侧重于同类气候产品横向比较与精度评价等,对区域层面气候要素演变特征与突变趋势分析不足[21]。
为此,本文选取具有长时序(1980—2018年)、高空间分辨率(30″×30″)且全球覆盖的最新CHELSA月际温度和降水量数据,利用线性拟合、Mann-Kendall检验(简称M-K检验)等方法,拟揭示南亚—东南亚近40年月尺度下温度与降水量时空演变特征与突变发展趋势。南亚—东南亚不同时间(月际、季节、年际)与空间(栅格、国家、区域)尺度下的温度和降水量的时空演变与趋势特征研究,有助于认识区域内气候变化特征及其气候变化原因。
1 研究区概况
南亚—东南亚是亚洲热带核心区。全区地势相差悬殊、西高东低,地貌单元复杂多样(图1)。自西向东分布有兴都库什、喜马拉雅、长山与毛克等不同走向山脉,山脉间嵌有印度德干与缅甸掸邦等起伏不一的高原,山脉与高原之间发育有大江大河,并在中下游形成了大小不等的平原。基于全球陆地1 km基准高程(GLOBE),南亚—东南亚平均海拔为644.39 m,3500 m及以上高山区域占比不足4%,集中分布在南亚北部,构成南北向气候屏障。本文南亚旱季对应月份为10月—次年5月,雨季为6—9月;东南亚旱季对应月份为11月—次年5月,雨季为6—10月。根据柯本全球气候分类[22],全区由南向北主要包括热带雨林(21.23%)、热带季风(7.79%)、热带疏林(23.43%)、草原气候(11.98%)、冬干温暖气候(16.84%)与沙漠气候(12.13%)6种类型(共占93.40%),其他气候类型仅占6.60%(表1)。全区涉及19个国家[23-24],除东帝汶与横穿赤道的印尼、新加坡3国外,其余国家均在北半球。本区土地面积975.34万km2,约占全球6.55%。2020年总人口25.35亿(
图1
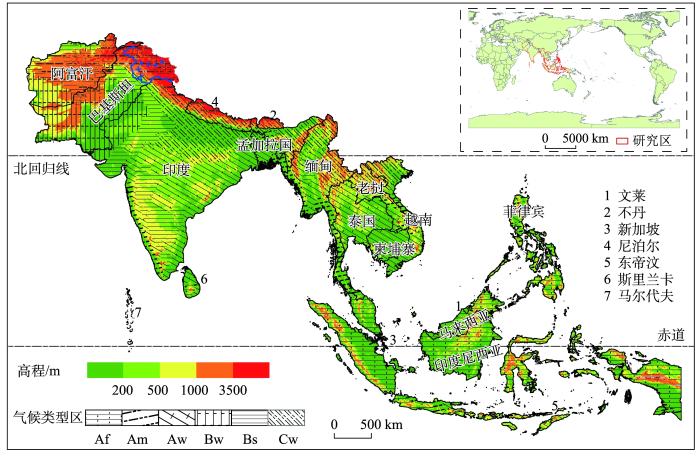
图1
南亚—东南亚地理位置与主要地形、气候分布
注:本图中的世界地图基于自然资源部标准地图服务网站下载的审图号为GS(2016)1666号的标准地图制作,底图无修改。Af:热带雨林气候;Am:热带季风气候;Aw:热带疏林气候;Bs:草原气候;Bw:沙漠气候;Cw:冬干温暖气候。
Fig.1
Topography and climate zones of South and Southeast Asia (SSEA, 19 countries)
表1 南亚、中南半岛与马来群岛主要特征
Tab.1
| 要素 | 要素分级/分类 | 占比/% | |||
|---|---|---|---|---|---|
| 南亚 | 中南半岛 | 马来群岛 | 总计 | ||
| 高程 | Ⅰ级(≤200 m) | 17.97 | 8.76 | 14.45 | 100 |
| Ⅱ级(>200~500 m) | 14.34 | 4.44 | 4.67 | ||
| Ⅲ级(>500~1000 m) | 9.97 | 4.21 | 3.49 | ||
| Ⅳ级(>1000~3500 m) | 9.58 | 2.53 | 2.22 | ||
| Ⅴ级(>3500 m) | 3.30 | 0.03 | 0.04 | ||
| 面积 | — | 52.77 | 20.11 | 27.12 | 100 |
| 人口 | — | 73.41 | 9.68 | 16.91 | 100 |
| 气候类型 | Af(热带雨林气候) | 0.20 | 0.21 | 20.82 | 100 |
| Am(热带季风气候) | 2.05 | 3.50 | 2.24 | ||
| Aw(热带疏林气候) | 11.94 | 10.16 | 1.33 | ||
| Bs(草原气候) | 11.69 | 0.29 | 0 | ||
| Bw(沙漠气候) | 12.13 | 0 | 0 | ||
| Cw(冬干温暖气候) | 9.27 | 5.90 | 1.67 | ||
| 其他 | 5.49 | 0.05 | 1.06 | ||
2 数据来源与研究方法
2.1 CHELSA温度与降水量产品
CHELSA是由瑞士联邦森林、雪、景观研究所开发维护的全球降尺度气候(包括温度和降水量)数据(
2.2 海洋Niño指数
海洋Niño指数(oceanic niño index,ONI)由美国国家海洋和大气管理局(NOAA)发布。通过观测并计算东太平洋Niño3.4海区(5°N~5°S、120°W~170°W)海洋表面温度异常值,以确定ENSO事件相位及发展程度,是国际上较为认可的主流标准[25]。厄尔尼诺现象出现并无固定周期,一般2~7年发生一次,持续时间9~12个月,少数可达2~3年[31-32]。当ONI 3个月滑动平均值达到或超过0.5(或-0.5)且持续至少5个月,表明发生了厄尔尼诺(或拉尼娜)。ONI越高,厄尔尼诺现象越明显,波及范围、影响程度也愈强烈;反之,则拉尼娜更显著。亚洲因降水引发的旱涝灾害与季风年际间涛动紧密关联,ENSO是促使亚洲季风发生年际变化的主要驱动因子之一[10-11,33-34]。根据全球近40年海洋Niño指数表[25,32],拉尼娜年及厄尔尼诺年的划分如表2所示。
表2 基于海洋Niño指数的近40年拉尼娜、厄尔尼诺年份划分
Tab.2
| 类别 | 出现时段 |
|---|---|
| 拉尼娜年 | 1983—1984、1984—1985、1988—1989、1995—1996、1998—2001、2005—2006、2007—2008、2008—2009、 2010—2012、2016、2017—2018年 |
| 厄尔尼诺年 | 1982—1983、1986—1988、1991—1992、1994—1995、1997—1998、2002—2003、2004—2005、2006—2007、 2009—2010、2014—2016年 |
2.3 研究方法
2.3.1 最小二乘法趋势分析
2.3.2 M-K检验
M-K突变检验依赖于通过顺序、逆序时间序列的秩序列计算出的2条统计量曲线UF和UB,若UF大于0,则表明序列呈上升趋势,否则呈下降趋势。取±1.96为M-K突变检验的临界线,即0.05显著性水平对应的置信度检验区间,若2条曲线的交点在临界范围内,则认为气候要素发生突变[37]。M-K趋势显著性检验值Z>0,表明气候要素呈现上升(增加)趋势,反之则呈下降(减少)趋势。在给定的显著性水平α下,若|Z|≥Z1-α/2,则拒绝原假设,即在显著性水平α上,时序数据存在显著的上升(增加)或下降(减少)趋势[38-39]。根据Z值可将气候变化趋势划分为6种类型(表3)。M-K突变与趋势检验均在Matlab-2020软件下完成。
表3 Mann-Kendall 检验趋势特征类别划分
Tab.3
| Z值 | 趋势特征 | Z值 | 趋势特征 |
|---|---|---|---|
| 0< Z ≤ 1.96 | 微显著增加 | -1.96 ≤ Z < 0 | 微显著减少 |
| 1.96< Z ≤ 2.58 | 显著增加 | -2.58 ≤ Z <-1.96 | 显著减少 |
| 2.58 < Z | 极显著增加 | Z < -2.58 | 极显著减少 |
注:Z = 0时,无明显变化趋势。
3 结果分析
3.1 降水量时空变化特征
3.1.1 降水量时序变化特征分析
南亚—东南亚1980—2018年全区平均降水量为1816.6 mm,是全球平均降水量的2.6倍。全区降水量表现出2个特征(图2a):第一,年际波动较大,年最大降水量(2039.3 mm,2008年)远超年最小降水量(1582.8 mm,1997年),且区域降水量年际波动与年降水量显著相关;第二,年降水量呈显著增加趋势,增幅为4.19 mm/a (P<0.05),远超全球平均增长水平(0.19 mm/a)[40]。域内降水量变化空间异质性强,其中马来群岛年际增长率最大(9.77 mm/a,P<0.05),中南半岛次之,南亚最小(0.61 mm/a,P<0.05)。考虑到离散分布的长时序降水量数据并不表现出明显规律,进一步对年降水量进行5年滑动平均处理。1980年代,南亚—东南亚年际降水量变化较为稳定,21世纪前后2个10年降水量都有小幅减少,之后保持稳定增长,且2000年代增速远大于1990年代。然而,21世纪前20年年际降水量先增后减,转折年份出现在2009年。南亚年降水量变化趋势呈波浪起伏型,约20年为一周期,降水量先减后增,且后一周期增长率也在变大;中南半岛及马来群岛年增长率较平缓,降水量的增加集中于21世纪(图2b)。
图2

图2
南亚—东南亚整体与区域年际降水量变化趋势
Fig.2
Trends of annual precipitation in South and Southeast Asia and the three sub-regions
表4展示了南亚—东南亚气候要素月际变化趋势强弱及其对于多年温度和降水量变化的贡献率。总体看,月际降水量变化特征复杂,不同月份间降水量呈增加趋势,但存在明显强弱差异。1、3、8、9和10月降水量增长低于月降水量增长平均水平,其中10月降水量变化幅度最小,仅为总降水量增长的1.43%,对于多年降水量变化的影响可忽略不计,6月降水量增长幅度最大(17.18%),对于南亚—东南亚多年降水量增长贡献最大。综上,南亚—东南亚旱、雨季降水量增长相近。其中,南亚降水量的增加主要出现在4—9月,马来群岛则集中于11月至次年6月,中南半岛降水量增长年内较均匀,主要集中于1、3、7及12月4个月份。
表4 南亚—东南亚月际温度与降水量变化及其对多年气候变化贡献率
Tab.4
| 月份 | 温度 | 降水量 | |||||
|---|---|---|---|---|---|---|---|
| 温度变化/(℃/a) | 贡献率/% | 显著性水平 | 降水量变化/(mm/a) | 贡献率/% | 显著性水平 | ||
| 1 | 0.016 | 5.80 | 0.05 | 0.15 | 3.58 | 0.10 | |
| 2 | 0.028 | 10.15 | 0.05 | 0.41 | 9.78 | 0.05 | |
| 3 | 0.029 | 10.51 | 0.05 | 0.15 | 3.58 | 0.10 | |
| 4 | 0.022 | 7.97 | 0.05 | 0.39 | 9.31 | 0.05 | |
| 5 | 0.022 | 7.97 | 0.05 | 0.49 | 11.70 | 0.10 | |
| 6 | 0.019 | 6.88 | 0.05 | 0.72 | 17.18 | 0.10 | |
| 7 | 0.020 | 7.25 | 0.05 | 0.53 | 12.65 | 0.10 | |
| 8 | 0.019 | 6.88 | 0.05 | 0.22 | 5.25 | 0.10 | |
| 9 | 0.022 | 7.97 | 0.05 | 0.23 | 5.49 | 0.10 | |
| 10 | 0.029 | 10.51 | 0.05 | 0.06 | 1.43 | 0.10 | |
| 11 | 0.026 | 9.42 | 0.05 | 0.47 | 11.22 | 0.05 | |
| 12 | 0.024 | 8.69 | 0.05 | 0.37 | 8.83 | 0.05 | |
1980年以来南亚—东南亚降水量高值分别出现于1984、1988、1995、1999、2005、2008、2010与2017年,年降水量低值出现于1982、1987、1992、1997、2002、2004、2006、2009及2014年。南亚—东南亚年降水量高值、低值分别对应于拉尼娜、厄尔尼诺事件发生年份,其中1994—1995年厄尔尼诺(7个月)、2016年拉尼娜(5个月)因持续时间较短,年降水量有所增加(减少),但未达到高值(低值)水平。ENSO是全球气候变化的重要影响因子,南亚—东南亚由于地理位置特殊,降水量年际间变化深受其影响,厄尔尼诺与拉尼娜作为大尺度气候事件,其对本区气候要素的影响机制、时空响应特征等还有待于进一步深入研究。
根据UF与UB曲线及其交点对应年份(图3),确定本区年降水量增长趋势在2005年发生突变。全区降水量自2005年起出现明显增长(图3a),但不显著(即未超过0.05显著性水平临界线)。此前,全区年降水量呈弱下降趋势,之后降水量年增长率急剧攀升,其中,中南半岛最为强烈(图3c),这与2007—2008、2010—2012年连续2次强拉尼娜事件紧密相关。类似地,2014年前后出现的2个交点,则跟2014—2016年超强厄尔尼诺事件有关。在厄尔尼诺影响下,东南亚降水量明显减少,局部区域甚至遭受严重的干旱。随着厄尔尼诺结束,降水量迅速恢复到一个较高水平。两个交点代表降水量趋势变化一增一减,且未持续,因此不认定其是降水量趋势变化突变点。马来群岛年降水量最大,与区域总体降水量变化趋势相近(图3d);南亚降水量变化趋势最小且最为复杂(图3b),1996年和2011年出现增加趋势但不显著,1998年与2015年后增长趋势开始削弱并迅速转为下降趋势,区域年降水量增减波动频繁。
图3
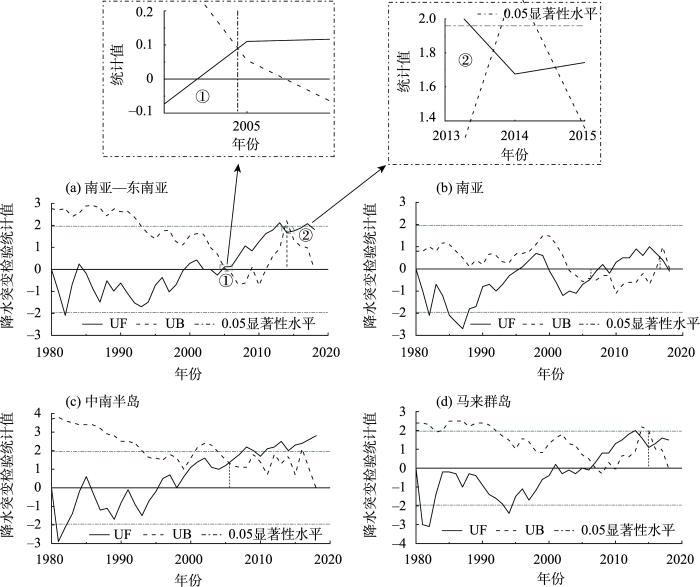
图3
南亚—东南亚整体与区域年降水量M-K突变检验(1980—2018年)
Fig.3
Mann-Kendall mutation test of annual precipitation in South and Southeast Asia as a whole and the three sub-regions during 1980-2018
3.1.2 降水量空间变化趋势分析
南亚—东南亚受亚洲季风影响显著,是欧亚大陆年降水量高值区之一,多年降水量呈增长趋势,且东南亚气候变化幅度要高于南亚[40⇓-42]。全区降水量空间分布异质性强(图4),受地形、大气环流等影响,呈南北向递减且高值区集中在山脉与海岸带附近。马来群岛因其是世界最大群岛,海洋性气候显著,常年高温多雨,降水量最大,年降水量超过2000 mm区域占90.59%;南亚北部高山阻挡了亚洲冷空气侵入,南部海洋暖湿气流不易到达,形成热带荒漠气候,降水量最小,年降水量低于2000 mm区域占88.72%。年降水量高值区,南亚集中于恒河流域东北部及西高止山脉西海岸;中南半岛集中于安达曼海岸带附近;马来群岛域内多海岛,年降水量空间分布相对均匀,高值区出现于毛克山脉及加里曼丹岛内陆区域。其中,马来西亚(3207.1 mm)与印度尼西亚(3187.8 mm)为全区年降水量高值国家;而年降水量最少、最干旱的区域为巴基斯坦(369.1 mm),印度国土面积最大、年降水量仅有1256.7 mm。
图4
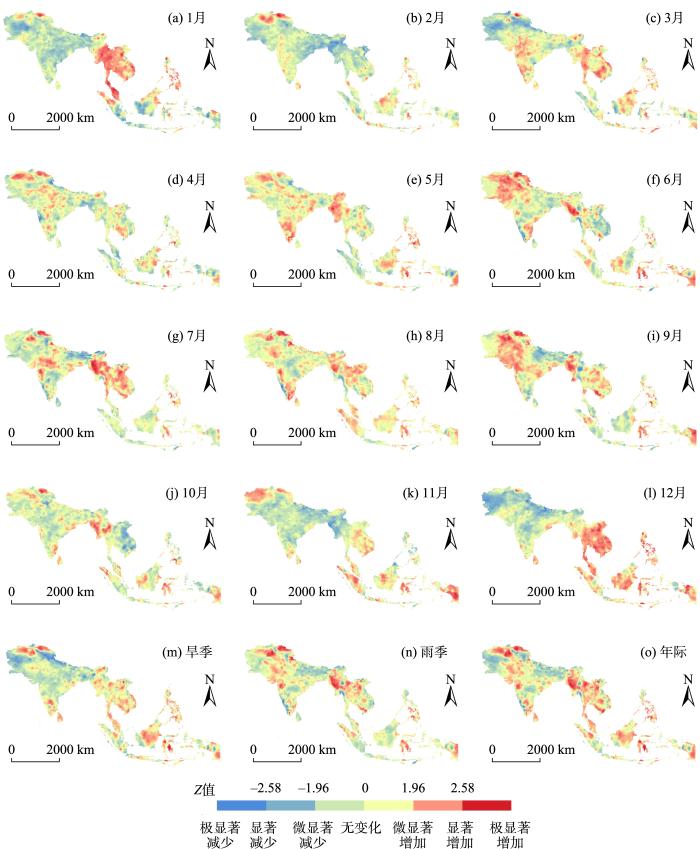
图4
南亚—东南亚不同时间尺度降水M-K趋势空间变化
Fig.4
Spatial variation of the Mann-Kendall trend of precipitation at varied temporal scales in South and Southeast Asia
1980—2018年,南亚—东南亚降水量变化显著性水平均值(即降水量变化趋势强弱程度),中南半岛最大(1.38),南亚最小(0.20)。其中,有65.32%的区域降水量变化表现为上升趋势,微显著与极显著上升分别占44.17%与11.23%。具体而言,降水量极显著增加区域,南亚集中于阿富汗内陆省份(萨尔普勒、巴米扬、瓦尔达克等省)、巴基斯坦西北部(如联邦直辖部落地区、西北边境省)、印度西南部(马哈拉施特拉邦、泰米尔纳德邦等),中南半岛集中于缅甸(钦邦、马圭、曼德勒等省)、老挝东部(川圹、波里坎赛)、越南湄公河三角洲,以及印度尼西亚(廖内、中加里曼丹、苏拉威西、巴布亚等省)等地。降水量递减区主要分布在阿富汗西南部(法拉、尼姆鲁兹、赫尔曼德、坎大哈等省)、巴基斯坦西部(俾路支省)、印度、尼泊尔、不丹和孟加拉国大部,中南半岛及马来群岛有零星分布。
年内南亚—东南亚多年降水量变化显著性空间分布统计表明,月际降水量主要集中在微显著变化区间,占比高达80%~90%,其中3—9月单月降水量微显著减少的比例低于月平均水平,降水量微显著增加占比最高月份出现在旱季的4月,达62%(图5)。旱季降水量变化显著性水平均值(根据图5中显著性Z值,计算其区域内所有像素的平均值得到)为0.474,雨季均值为0.476。整体来看,全区降水量增加的显著性旱、雨季相近,且旱季或雨季降水量变化表现为上升区占比均要明显高于下降区。雨季降水量变化的显著性南亚和东南亚相近,旱季东南亚降水量变化的显著性则要明显超过南亚。与以往研究认为东南亚降水量存在显著变化[43-44]不同的是,基于情景模拟的长时序东南亚降水量与温度变化研究发现,年降水量增加主要限于缅甸和泰国湾,且主要由雨季降水量增加所致[45]。本文根据月际层面降水量变化表明,雨季降水量增加对于年降水量增加的贡献超过平均水平但并不突出。
图5
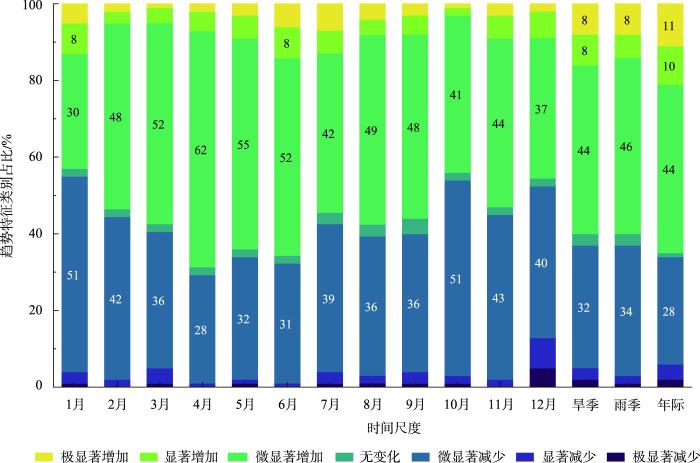
图5
南亚—东南亚不同时间尺度降水变化趋势特征占比
注:为突出主要的变化趋势特征,仅对占比大于等于8%的类别进行了标注。
Fig.5
Percentage of precipitation trend characteristics at varied temporal scales in South and Southeast Asia
3.2 温度时空变化特征
3.2.1 温度时序变化特征分析
南亚—东南亚多年均温为23.0 ℃,远超全球年均温(9.0 ℃)。全区温度表现出2个特征(图6a):第一,近40年温度保持缓慢上升趋势,累计增温接近1 ℃。年增长率为0.023 ℃/a(P<0.05),这与宁忠瑞等[40]研究表明亚洲增温速度(0.02 ℃/a)结论较为一致。第二,年增温率区域相差悬殊,马来群岛年增温率最大(0.024 ℃/a),中南半岛最小(0.021 ℃/a)。从国家层面来看,印度(0.017 ℃/a)、孟加拉国(0.018 ℃/a)略低于平均水平。年均温5年滑动曲线表明,近20年较21世纪前20年增温速率显著增大,且温度变化大体以10年为周期,表现出一定的规律性。具体而言,各个年代初期温度保持在一个稳定水平,中期温度开始攀升,之后维持稳态,在相应年代末期继续上升或略有下滑。类似地,全区年内不同月份升温较均衡(表4),2、3、10和11月的温度增长均超过了月平均增长水平。其中,以3月和10月增幅最大,对多年温度变化的贡献率最高(10.51%),1月升温速率最小,贡献率也最低(5.80%),但都通过了0.05的显著性水平检验。
图6
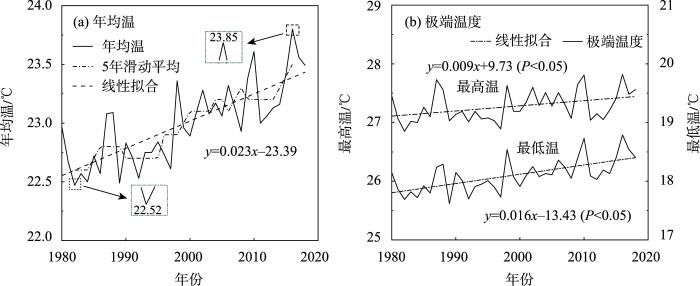
图6
南亚—东南亚年均温、最高温及最低温变化趋势
Fig.6
Trends of variation of annual mean temperature and extreme temperature in South and Southeast Asia
南亚—东南亚多年最高、最低气温分别为27.28 ℃、18.10 ℃。其中,南亚(26.07 ℃)、中南半岛(27.89 ℃)和马来群岛(27.55 ℃)最高温接近,但最低温相差悬殊,马来群岛最高(21.25 ℃),南亚最低(15.05 ℃)。受均温变化趋势影响,全区极端温度也处于缓慢增长状态,最高温增温速率(0.009 ℃/a)显著低于最低温增温速率(0.016 ℃/a),极端温差在逐年缩小(图6b)。1990年代以来,全区温度呈现明显上升趋势,21世纪初升温趋势已超过0.05显著性水平线,近10年甚至超过0.01显著性水平,即全区近20年气候变暖较前20年更显著(图7)。UF和UB曲线交点均在95%的置信度区间外,即全区温度变化不存在突变,即气候变暖是渐变现象。南亚(图7b)、中南半岛(图7c)及马来群岛(图7d)多年温度变化趋势较为一致,但区域增温强弱程度不同,南亚升温趋势要小于东南亚。温度的持续上升将在一定程度上加重南亚—东南亚干旱程度,进而加大人为与自然野火发生风险。
图7

图7
南亚—东南亚整体与区域年均温度的M-K突变检验(1980—2018)
Fig.7
Mann-Kendall mutation test of annual temperature in South and Southeast Asia as a whole and the three sub-regions during 1980-2018
3.2.2 温度空间变化特征分析
南亚—东南亚地处热带低纬地区,受纬度、地形、海陆热力性质等因素影响,全年高温但区域温差悬殊,温度变化趋势时空差异显著(图8)。南亚大陆性气候明显,且北部喜马拉雅山脉阻挡了冬季东北季风南下,造成本区全年酷热,极端高温常超过40 ℃。东南亚较南亚纬度更低、地理位置更加偏南,气候海洋性远超南亚。中南半岛中部及北部气候与南亚相似,马来群岛受海洋调节,极端高温略低于中南半岛。此外,地形因素对温度的影响占据重要地位。年均温低于10 ℃区域占6.10%,集中在南亚(5.91%)喜马拉雅、兴都库什、若开等山脉及其延伸高地范围内,其中阿富汗、尼泊尔及不丹为常年低温区。东南亚年均温低于20 ℃区域仅占7.81%,离散分布于中南半岛(3.66%)的掸邦、川圹高原及他念他翁、比劳山脉等,马来群岛(4.15%)境内巴里散、毛克、加里曼丹岛中心山脉等地,进而使得本区温度低于平均水平。随着全球持续变暖,全区极端温度事件频繁,热浪现象比过去更强烈、年内更提前[43]。受此影响,野火发生风险呈上升态势并加剧温室气体排放与区域气候变暖。
图8
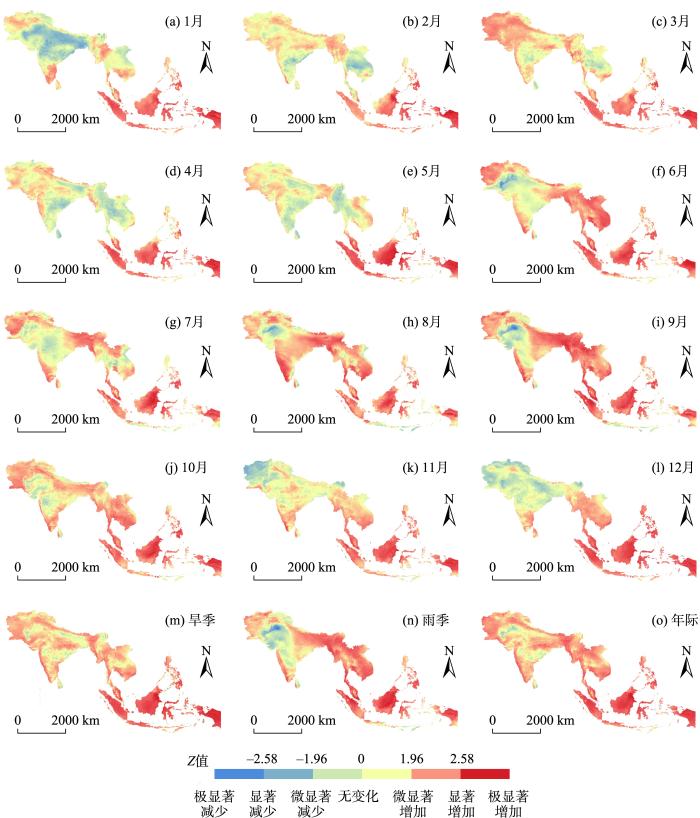
图8
南亚—东南亚不同时间尺度温度M-K趋势空间变化
Fig.8
Spatial variation of the Mann-Kendall trend of temperature at varied temporal scales in South and Southeast Asia
同期,南亚—东南亚温度空间变化较降水量更为突出。年均温显著性水平均值马来群岛最大(5.22),南亚最小(2.99)。具体地,1980—2018年全区有99.13%的区域温度处于上升趋势,其中极显著上升区占到79.34%。空间上,温度呈极显著增加区域集中于除小巽他群岛外的马来群岛大部、中南半岛大部及南亚外围区域,仅内陆巴基斯坦(旁遮普省、信德省)有小部分区域处于无变化或微显著下降趋势。其中,文莱(5.52)、印度尼西亚(5.35)、马来西亚(5.16)年均温显著性均态位列前三,印度(2.87)、巴基斯坦(2.82)及斯里兰卡(1.92)显著性低于平均水平。已有研究表明,东南亚超99%的区域温度显著上升,且变湿区与增温区高度重叠,事实上温度与降水量同增的现象在全球也较为常见,地表温度的升高会增加热低压的强度,从而导致更多的湿气从海洋流入[46-47]。南亚—东南亚降水量增加区与温度上升区分别为65.32%与99.13%,其中二者同步上升(增加)区域占64.92%,除印度东北部、阿富汗及巴基斯坦西北部、印度尼西亚南部外均存在广泛分布。全区普遍升温且具有强显著性,与之相比,降水量的时空变化表现出明显不确定性。
对南亚—东南亚多年温度变化显著性在不同时间尺度上进行分区统计,结果表明,年内月际温度变化表现出一定差异性,逐月温度变化趋势主要集中在微显著增加、显著增加和极显著增加3个区间,其中6—10月单月温度极显著增加占比要高于1—5月,最大占比出现在9月,达到了60%(图9)。旱季温度变化显著性均值为3.31,雨季均值为3.08,全区温度上升显著性水平旱季大于雨季。雨季温度变化显著性均态东南亚大于南亚,且二者差异较大,旱季温度变化显著性马来群岛最大,南亚最小。综上,南亚温度上升显著性旱季大于雨季,东南亚则相反,雨季要大于旱季。
图9
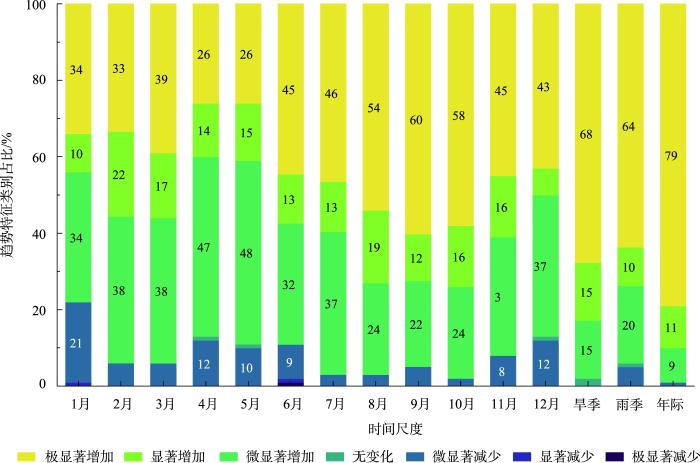
图9
南亚—东南亚不同时间尺度温度变化趋势特征类别占比
Fig.9
Percentage of temperature trend characteristics at varied temporal scales in South and Southeast Asia
4 结论与讨论
本文利用CHELSA 1980—2018年月际降水量与温度栅格产品,采用最小二乘法、M-K检验等空间统计方法,研究揭示了南亚—东南亚温度与降水量逐月、1 km的时空特征与演变趋势差异。结果表明,南亚—东南亚近40年气候变化整体表现出暖湿化发展特征,且东南亚温度与降水量变化显著性与幅度均要高于南亚。降水量呈显著增加趋势,于2005年发生突变;旱季降水量变化的显著性东南亚较南亚更明显,雨季二者相近。全区平均增温接近1 ℃,年内不同月份间温度增长较均衡;温度变化呈上升趋势区占99.13%,南亚旱季温度上升显著性大于雨季,东南亚则相反。温度与降水量变化呈同步上升(增加)趋势区域占64.92%,全区普遍升温且具有强持续性,与之相比,降水量的时空变化表现出更大不确定性,全球变化背景下需加强区域气候风险防范。
全球尺度上,预测因子与气候变量(温度、降水量)难以找到普遍有效的传递函数。此外,基础气候记录异质性高对静态预测影响较小,但当需要整合风场、气压场等因子进行高度动态预测时,统计降尺度变得尤为困难[48]。现有全球气候变化研究多采用东英格利亚大学气候研究所格点数据集(CRU)、全球历史气候网络数据集(GHCN)、全球降水量气候数据集(GPCC)等[49-50],其中又以CRU网格气候集应用最为广泛,其空间分辨率仅为0.5°。这对刻画全球尺度上气候变化尚可,但对区域气候要素变化差异揭示则显不足。相比之下,CHELSA数据集具有与大气、环境紧密结合的特性,且对前述较粗数据具有高精度优势,将有助于揭示区域气候要素时空演变特征。当然,其自身也存在一些不足,如动态因子时空异质性可能导致特定月份或特定区域的伪相关,进而对回归模型精度造成干扰[30]。此外,火是地球系统中改变生态结构和大气组成的重要过程,同时作为重要的碳排放源,其在加剧全球变暖、改变区域降水强度方面具有深刻影响[51]。当前,气候变化背景下全球特别是热带活跃火的发生发展过程与机理值得深入研究,CHELSA因其长时序与较高精度等优点将有助于开展活跃火与气候变化(即“火—气”)关系研究。
参考文献
Australian climate extremes at 1.5 ℃ and 2 ℃ of global warming
[J].
DOI:10.1038/NCLIMATE3296
[本文引用: 1]

To avoid more severe impacts from climate change, there is international agreement to strive to limit warming to below 1.5 degrees C. However, there is a lack of literature assessing climate change at 1.5 degrees C and the potential benefits in terms of reduced frequency of extreme events(1-3). Here, we demonstrate that existing model simulations provide a basis for rapid and rigorous analysis of the effects of different levels ofwarming on large-scale climate extremes, using Australia as a case study. We showthat limitingwarming to 1.5 degrees C, relative to 2 degrees C, would perceptibly reduce the frequency of extreme heat events in Australia. The Australian continent experiences a variety of high-impact climate extremes that result in loss of life, and economic and environmental damage. Events similar to the record-hot summer of 2012-2013 and warm seas associated with bleaching of the Great Barrier Reef in 2016 would be substantially less likely, by about 25% in both cases, ifwarming is kept to lower levels. The benefits of limiting warming on hydrometeorological extremes are less clear. This study provides a framework for analysing climate extremes at 1.5 degrees C global warming.
CMIP5多模式预估的1.5 ℃升温背景下中国气温和降水变化
[J].
Temperature and precipitation changes over China under a 1.5 ℃ global warming scenario based on CMIP5 models
全球1.5和2 ℃温升时的气温和降水变化预估
[J].
Temperature and precipitation projection at 1.5 and 2 ℃ increase in global mean temperature
“一带一路”区域未来气候变化预估
[J].
CMIP5 projected changes in mean and extreme climate in the Belt and Road region
Time of emergence in regional precipitation changes: An updated assessment using the CMIP5 multi-model ensemble
[J].DOI:10.1007/s00382-018-4073-y [本文引用: 1]
IPCC AR6 报告解读: 未来的全球气候: 基于情景的预估和近期信息
[J].
Interpreting IPCC AR6: Future global climate based on projection under scenarios and on near-term information
Recent trends in regional air temperature and precipitation and links to global climate change in the Maharlo watershed, Southwestern Iran
[J].DOI:10.1007/s00703-014-0341-5 URL [本文引用: 1]
A new classification of large-scale climate regimes around the Tibetan Plateau based on seasonal circulation patterns
[J].DOI:10.1016/j.accre.2017.01.001 URL [本文引用: 1]
The multiscale global monsoon system: Research and prediction challenges in weather and climate
[J].
未来30年亚洲降水情景预估及偏差订正
[J].
Projection of Asian precipitation for the coming 30 years and its bias correction
Statistical analysis of the relationship between summer monsoon precipitation extremes and foodgrain yield over India
[J].DOI:10.1002/joc.2282 URL [本文引用: 2]
Upper-and lower-tropospheric circulation anomalies associated with interannual variation of Pakistan rainfall during summer
[J].DOI:10.1007/s00376-020-0137-0 [本文引用: 1]
Asian climate change under 1.5-4 ℃ warming targets
[J].DOI:10.1016/j.accre.2017.05.004 URL [本文引用: 1]
Bias-corrected climate projections for South Asia from Coupled Model Intercomparison Project-6
[J].Climate change is likely to pose enormous challenges for agriculture, water resources, infrastructure, and livelihood of millions of people living in South Asia. Here, we develop daily bias-corrected data of precipitation, maximum and minimum temperatures at 0.25° spatial resolution for South Asia (India, Pakistan, Bangladesh, Nepal, Bhutan, and Sri Lanka) and 18 river basins located in the Indian sub-continent. The bias-corrected dataset is developed using Empirical Quantile Mapping (EQM) for the historic (1951-2014) and projected (2015-2100) climate for the four scenarios (SSP126, SSP245, SSP370, SSP585) using output from 13 General Circulation Models (GCMs) from Coupled Model Intercomparison Project-6 (CMIP6). The bias-corrected dataset was evaluated against the observations for both mean and extremes of precipitation, maximum and minimum temperatures. Bias corrected projections from 13 CMIP6-GCMs project a warmer (3-5°C) and wetter (13-30%) climate in South Asia in the 21 century. The bias-corrected projections from CMIP6-GCMs can be used for climate change impact assessment in South Asia and hydrologic impact assessment in the sub-continental river basins.
Projections of precipitation and temperature over the South Asian countries in CMIP6
[J].
DOI:10.1007/s41748-020-00157-7
[本文引用: 1]
The latest Coupled Model Intercomparison Project phase 6 (CMIP6) dataset was analyzed to examine the projected changes in temperature and precipitation over six South Asian countries during the twenty-first century. The CMIP6 model simulations reveal biases in annual mean temperature and precipitation over South Asia in the present climate. In the historical period, the median of the CMIP6 model ensemble systematically underestimates the annual mean temperature for all the South Asian countries, while a mixed behavior is shown in the case of precipitation. In the future climate, the CMIP6 models display higher sensitivity to greenhouse gas emissions over South Asia compared with the CMIP5 models. The multimodel ensemble from 27 CMIP6 models projects a continuous increase in the annual mean temperature over South Asia during the twenty-first century under three future scenarios. The projected temperature shows a large increase (over 6 °C under SSP5-8.5 scenario) over the northwestern parts of South Asia, comprising the complex Karakorum and Himalayan mountain ranges. Any large increase in the mean temperature over this region will most likely result in a faster rate of glacier melting. By the end of the twenty-first century, the annual mean temperature (uncertainty range) over South Asia is projected to increase by 1.2 (0.7–2.1) °C, 2.1 (1.5–3.3) °C, and 4.3 (3.2–6.6) °C under the SSP1-2.6, SSP2-4.5, and SSP5-8.5 scenarios, respectively, relative to the present (1995–2014) climate. The warming over South Asia is also continuous on the seasonal time scale. The CMIP6 models projected higher warming in the winter season than in the summer over South Asia, which if verified will have repercussions for snow/ice accumulations as well as winter cropping patterns. The annual mean precipitation is also projected to increase over South Asia during the twenty-first century under all scenarios. The rate of change in the projected annual mean precipitation varies considerably between the South Asian countries. By the end of the twenty-first century, the country-averaged annual mean precipitation (uncertainty range) is projected to increase by 17.1 (2.2–49.1)% in Bangladesh, 18.9 (−4.9 to 72)% in Bhutan, 27.3 (5.3–160.5)% in India, 19.5 (−5.9 to 95.6)% in Nepal, 26.4 (6.4–159.7)% in Pakistan, and 25.1 (−8.5 to 61.0)% in Sri Lanka under the SSP5-8.5 scenario. The seasonal precipitation projections also shows large variability. The projected winter precipitation reveals a robust increase over the western Himalayas, with a corresponding decrease over the eastern Himalayas. On the other hand, the summer precipitation shows a robust increase over most of the South Asia region, with the largest increase over the arid region of southern Pakistan and adjacent areas of India, under the high-emission scenario. The results presented in this study give detailed insights into CMIP6 model performance over the South Asia region, which could be extended further to develop adaptation strategies, and may act as a guideline document for climate change related policymaking in the region.
Effect of climate change on seasonal monsoon in Asia and its impact on the variability of monsoon rainfall in Southeast Asia
[J].DOI:10.1016/j.gsf.2014.02.009 URL [本文引用: 1]
Observed and modelled temperature and precipitation extremes over Southeast Asia from 1972 to 2010
[J].DOI:10.1002/joc.2018.38.issue-7 URL [本文引用: 1]
基于FIRMS MODIS与VIIRS的东南亚活跃火频次时空动态分析
[J].
DOI:10.18402/resci.2019.08.12
[本文引用: 1]
活跃火(含植被火)是影响全球陆地生态系统碳循环的重要因素,其发生类型与成因、时空特征及其影响评价是重要研究内容。利用美国国家航空航天局(NASA)FIRMS发布的MODIS C6和VIIRS V1活跃火(Active fire)位置矢量产品,从不同时间尺度(年际、逐月、分旬与小时)与空间尺度(中南半岛/马来群岛)分析了东南亚2000—2017年活跃火的时空特征与动态变化,并比较了两套活跃火产品的数据差异。结果表明:①2000—2017年东南亚MODIS C6活跃火频次累计达4.42×10 <sup>6</sup>次,年际呈现显著波动变化特征,年际峰值出现时间与全球厄尔尼诺年较为一致。中南半岛是东南亚活跃火主要分布区,其与马来群岛对厄尔尼诺的响应时间有约1年的差异,且马来群岛国家(如印度尼西亚)活跃火对厄尔尼诺现象响应更为敏感。②近18年间,缅甸、老挝、泰国、柬埔寨、越南与印度尼西亚依次是中南半岛与马来群岛活跃火频发国家,其中以缅甸东部与西部、老挝北部、柬埔寨北部、印度尼西亚的苏门答腊岛东南部与加里曼丹岛南部等地分布较为集中。③中南半岛5国活跃火现象高度集中在旱季,其中以2—4月尤为突出,3月最甚。马来群岛3国的活跃火主要集中在6—11月,其中以8—10月最为明显,9月最强。东南亚8国活跃火现象集中分布于特征月份的下、中旬。活跃火观测时段主要集中在格林威治标准时间5—7时与17—19时,6时最多。④2012—2017年东南亚VIIRS V1活跃火频次监测规模约为同期MODIS C6监测结果的5倍,且二者对活跃火频次年际变化监测具有较好一致性。MODIS C6的优势在于活跃火监测时序长,而VIIRS V1对活跃火监测精度更高,应用潜力更大。
Spatiotemporal dynamics of active fire frequency in Southeast Asia with the FIRMS Moderate Resolution Imaging Spectroradiometer (MODIS) and Visible Infrared Imaging Radiometer (VIIRS) data
DOI:10.18402/resci.2019.08.12
[本文引用: 1]
Active fire (including vegetation fire) influences the carbon cycle of global terrestrial ecosystem, and its occurrence types, ignition causes, spatiotemporal features, and impacts are important research questions. Currently, remote sensing is the main way to obtain the spatial and temporal information and occurrence frequency of active fires. With the two standard active fire data products, including MODIS C6 (Moderate Resolution Imaging Spectroradiometer Collection 6) and VIIRS V1 (Visible infrared Imaging Radiometer Version 1) provided by the US NASA’s Fire Information for Resource Management System (FIRMS), the distribution characteristics and dynamic changes of satellite-based fire occurrence (frequency) in Southeast Asia (SEA) were quantitatively examined with ArcGIS 10.5 platform at hourly, ten-day, monthly, and annual levels and national to regional (Mainland Southeast Asia (MSEA) and Island Southeast Asia (ISEA)) scales. The differences in the two active fire datasets were compared accordingly. The results show that: (1) Active fire occurrence frequencies were 4.42×10 6 in SEA based on the MODIS C6 products of 2000-2017, showing clear annual fluctuations. Temporal consistency between the occurrence frequency of maximum active fire and global El Niño events during the same period was detected. MSEA, in comparison with ISEA, was the primary region for active fires in SEA, displaying about one year gap in response to El Niño. However, active fire in ISEA countries (for example, Indonesia) was more sensitive to El Niño. (2) In the past near two decades, Myanmar, Laos, Thailand, Cambodia, and Vietnam from MSEA and Indonesia in ISEA were the leading countries for active fire occurrence, especially in regions such as eastern and western Myanmar, northern Laos, northern Cambodia, northwest Vietnam, and the southern parts of Sumatra and Kalimantan of Indonesia. (3) Active fires showed high occurrences in the five MSEA countries during the dry season, especially from February to April, and mostly in March. Similar results in the three ISEA countries (Indonesia, Malaysia, and the Philippines) were reported between June and November, particularly from August to October, and mostly in September. Within these months, active fires were primarily seen in mid-to-late month, and typically observed at five to seven a.m. and five to seven p. m. in Greenwich Mean Time (GMT), mostly at six a.m. (GMT). (4) Active fire counts derived from VIIRS V1 were about five times that of MODIS C6 during the same period (2012-2017), showing similar trends of annual changes. The latter has the advantage of longer time series since 2000, while the former has higher accuracy of detection with more detailed information and greater potential for application.
中南半岛旱季VIIRS活跃火的空间特征与国别差异
[J].
DOI:10.18306/dlkxjz.2021.08.013
[本文引用: 1]
热带是全球活跃火(active fire)的集中发生区,客观认识其空间特征、国别差异及其动态变化对评估区域生物质燃烧及其碳排放等具有重要意义。作为热带季风气候典型区,中南半岛旱季活跃火发生发展空间特征及其动态变化仍缺乏清晰认识。为此,论文利用可见光红外成像辐射仪(VIIRS) S-NPP 2012—2019年活跃火矢量数据,基于核密度与空间自相关评价了中南半岛及国别旱季尤其是其特征月份(2—4月)活跃火发生发展的密集程度、集聚特征及其动态变化。结果表明:① 中南半岛活跃火核密度低值区占比最大(79%),高值区最小(4%);柬埔寨、缅甸、老挝等经济落后国家的核密度均值明显高于泰国和越南;2012—2019年核密度高值区具有朝高海拔、向内陆与趋边境等分布特征,且柬埔寨东北部长居高值区。② 活跃火核密度中值区变化集中在1—4月,且多分布在低、高值区周围;高值区变化集中在2—4月,由柬埔寨东北部逐渐向缅甸东/西部、泰国西北部以及老挝北/南部转移。③ 半岛与5国活跃火核密度在旱季具有显著空间正相关性,空间集聚类型以“高—高”型和“低—低”型集聚为主,越南、柬埔寨等国局部自相关性强于泰国和老挝。
Spatial characteristics and national differences of active fires derived from Visible Infrared Imaging Radiometer Suite(VIIRS) in Mainland Southeast Asia in the dry season during 2012-2019
DOI:10.18306/dlkxjz.2021.08.013
[本文引用: 1]
The tropics is the hotspot of global active fires. It is of great significance to reveal the spatial characteristics and dynamic changes of active fires for assessing regional biomass burning and carbon emissions. Based on the active fire vector data (2012-2019) of Visible Infrared Imaging Radiometer Suite (VIIRS) Suomi National Polar-Orbiting Partnership (S-NPP) provided by the NASA's Fire Information for Resource Management System (FIRMS), the occurrence density and agglomeration degree of active fires in Mainland Southeast Asia were quantified and analyzed using kernel density and spatial autocorrelation methods, in order to reveal the spatiotemporal variations in active fire occurrence frequency within the dry season, especially in February and April, during 2012-2019. The results show that: 1) The occurrence of active fires was dominated by low density (79%), and the high density areas had the smallest proportion (4%). Active fires are more likely to occur in economically backward countries (Cambodia, Myanmar, and Laos) and regions (for example, eastern Cambodia and northern Laos). High kernel density areas tend to distribute in high elevation, inland, and border areas in particular. Cambodia, especially its northeastern region, was always an area with high occurrence density of active fires in the study period. 2) The changes in medium density area of active fires were concentrated between January and April, which was mostly distributed around the low and high density areas, while the changes in high density areas were concentrated between February and April, spatially gradually shifted from northeastern Cambodia to western and eastern Myanmar, northwestern Thailand, and northern and southern Laos. 3) The density of active fire occurrence showed significant spatial autocorrelation in Mainland Southeast Asia and the five countries during the dry season. The spatial clustering types of the kernel density of active fires are dominated by "high-high" and "low-low" agglomerations in the dry season, especially between February and April. The local spatial autocorrelation of the kernel density of active fires in Vietnam and Cambodia is stronger than those in Thailand and Laos.
Performance evaluation of reanalysis precipitation products in Egypt using fuzzy entropy time series similarity analysis
[J].DOI:10.1002/joc.v41.11 URL [本文引用: 1]
Rainfall in Brazilian northeast via in situ data and CHELSA product: Mapping, trends, and socio-environmental implications
[J].Rainfall is a climatic variable that dictates the daily rhythm of urban areas in Northeastern Brazil (NEB) and, therefore, understanding its dynamics is fundamental. The objectives of the study were (i) to validate the CHELSA product with data in situ, (ii) assess the spatial-temporality of the rains, and (iii) assess the trends and socio-environmental implications in the Metropolitan Region of Maceió (MRM). The monthly rainfall data observed between 1960 and 2016 were flawed and were filled with the imputation of data. These series were subjected to descriptive and exploratory statistics, statistical indicators, and the Mann-Kendall (MK) and Pettitt tests. CHELSA product was validated for MRM, and all stations obtained satisfactory determination coefficients (R) and Pearson correlation (r). The standard error of the estimate (SEE), root mean square error (RMSE), and mean absolute error (MAE) were satisfactory. The highest annual rainfall accumulated occurred near the Mundaú and Manguaba lagoons. The Pettitt test identified that abrupt changes occur in El Niño and La Niña years (strong and weak). The monthly rain boxplots showed high variability in the rainy season (April-July). Outliers have been associated with extreme rainfall at MRM. The drought period was 5 months in all MRM seasons, except in Satuba and Pilar. The Mann-Kendall test and the Sen method showed a tendency for a significant increase in rainfall in Satuba and not significant in the Pilar, while in the others, there was a tendency for a decrease in rainfall. The MRM rainfall depends on physiographic factors, multiscale meteorological systems, and the coastal environment. These results will assist in planning conservationist practices, especially in areas of socio-environmental vulnerability.
Present and future Köppen-Geiger climate classification maps at 1-km resolution
[J].We present new global maps of the Köppen-Geiger climate classification at an unprecedented 1-km resolution for the present-day (1980–2016) and for projected future conditions (2071–2100) under climate change. The present-day map is derived from an ensemble of four high-resolution, topographically-corrected climatic maps. The future map is derived from an ensemble of 32 climate model projections (scenario RCP8.5), by superimposing the projected climate change anomaly on the baseline high-resolution climatic maps. For both time periods we calculate confidence levels from the ensemble spread, providing valuable indications of the reliability of the classifications. The new maps exhibit a higher classification accuracy and substantially more detail than previous maps, particularly in regions with sharp spatial or elevation gradients. We anticipate the new maps will be useful for numerous applications, including species and vegetation distribution modeling. The new maps including the associated confidence maps are freely available via www.gloh2o.org/koppen.
The Belt and Road: Geographical pattern and regional risks
[J].
DOI:10.1007/s11442-019-1611-4
[本文引用: 1]
Building the Belt and Road is initiatives of China to promote win-win international cooperation in the new era, aiming at green, health, intellect and peace and the joint development with people of the countries along the route. Systematic analysis on environmental characteristics, evolutionary tendency and future risks are certainly the scientific fundamentals of sustainable development for the Belt and Road construction. Applied remote sensing monitoring, statistical analysis, this paper investigates the regional characteristics of climate, topography, soil, hydrology, vegetation cover and terrestrial ecosystems production, as well as socio-economic conditions. Based on the regional characteristics, the Belt and Road is divided into 9 sub-regions: Central and Eastern Europe sub-region with cold and humid climate, Mongolia and Russia sub-region with cold and arid climate, Central and West Asia arid sub-region, Southeast Asia sub-region with warm and humid climate, Pakistan arid sub-region, Bangladesh-India-Myanmar sub-region with warm and humid climate, Eastern China monsoon sub-region, Northwest China arid sub-region and Tibetan Plateau sub-region. Combining modeling simulation with scenario projections, natural disaster assessment methodology is used to assess the risk of extreme events including heat waves, droughts and floods in the coming 30 years (2021-2050). Results show that, on the basis of the regional framework, the western Eurasia would be a warming trend; both sides of Qinghai-Tibet Plateau in high temperature and heat waves risk; Central and Eastern Europe sub-region with cold and humid climate in high drought risk; Bangladesh-India-Myanmar sub-region with warm and humid climate as well as Eastern China in high risk of flooding.
2001—2013 年中国与“一带一路”沿线国家贸易网络分析
[J].
DOI:10.13249/j.cnki.sgs.2016.11.004
[本文引用: 1]
采用社会网络的分析方法分析了“一带一路”沿线国家贸易网络的基本特征以及贸易网络组团的结构变化,贸易网络的核心边缘及其演化情况,并在最后对中国与东南亚国家的子贸易网络进行了核心边缘分析。结果表明:“一带一路”沿线国家贸易网络密度增强,中国在“一带一路”沿线国家贸易网络中的核心度在逐渐提高,在2013年已经成为最核心的国家,且在中国与东南亚国家构成的子贸易网络中,中国也成为了最核心的国家。
Trade network of China and countries along "Belt and Road Initiative" areas from 2001 to 2013
DOI:10.13249/j.cnki.sgs.2016.11.004
[本文引用: 1]
Since the proposition of “Belt and Road Initiative”, researches on trade between China and countries along the Initiative area have increased. However, it is relatively rare to study trade network taking China and those countries as a whole. In this article, we utilize a social network analysis method to analyze the characteristics, trade groups as well as core-periphery structure and its evolution of this trade network. Then we analyze the structure of sub trade network of China and the Southeast Asian countries. The results show that density of the trade network established by China and countries along “Belt and Road Initiative” areas has increased, coupled with growing number of core countries. Meanwhile, China’s core degree in this trade network has increased with China being the most important core country in 2013. What’s more, China becomes the core country in the sub trade network of China and the Southeast Asian countries as well. Based on this analysis, we propose that during the process of promoting “Belt and Road Initiative” construction, China should rely on policy communication to reduce trade barriers and improve trade facilitation with countries along the Initiative area. In particular, it should be set as the priority to facilitate trading conditions with core countries in the Initiative area trade network for further enhancing China’s core position in this network. What’s more, China should make good use of the advantage of being the core position in the network, play an active role of being the area core country and promote the construction and development of “Belt and Road Initiative”.
2001—2018年印度尼西亚MODIS活跃火的发生特征与响应
[J].
DOI:10.11821/dlxb202009007
[本文引用: 3]
基于印度尼西亚2001—2018年FIRMS MODIS活跃火(Active Fire)位置数据,通过GIS渔网(1 km×1 km)定量分析了该国活跃火的发生概率、强度及其对厄尔尼诺的响应。结果表明:① 印度尼西亚18年间至少发生过一次活跃火的区域(即“有火区”)占22.79%,五大岛屿“有火区”以加里曼丹岛最多,巴布亚岛最少。活跃火发生以低概率为主,集中在8—10月,加里曼丹岛和苏门答腊岛分布最多;中概率分布较少,苏门答腊岛东部低地平原和加里曼丹岛南部及西南沿岸最为集中;高概率零星分布,大部分集中在爪哇岛和苏拉威西岛。② 活跃火的发生强度以1级(1次/a)和2级(2~3次/a)为主,3级(4~7次/a)次之。1~5级(1~22次/a)活跃火主要集中在加里曼丹岛和苏门答腊岛,6级(23~165次/a)活跃火集中在爪哇岛、苏门答腊岛和苏拉威西岛,且强度从中心向四周递减。此外,不同概率组内活跃火的发生强度也不同,低、中、高概率活跃火分别以1次/a、1~3次/a、2~7次/a为主。③ 印度尼西亚8—10月活跃火对强、弱厄尔尼诺的敏感度不同,其响应表现在活跃火频次与影响面积显著增加,厄尔尼诺越强,活跃火响应程度越高。其中,苏门答腊岛响应程度最高,巴布亚岛最低。
Occurrence characteristics and response to El Niño of MODIS-based active fires in Indonesia during 2001-2018
老挝VIIRS活跃火的主要自然地理要素特征
[J].
DOI:10.11821/dlyj020190029
[本文引用: 1]
利用美国国家航空航天局火灾信息资源管理系统(FIRMS)VIIRS V1活跃火、先进星载热发射和反射辐射仪全球数字高程模型(ASTER GDEM)、MODIS NDVI/LSWI与土地覆被数据产品(FROM-GLC),基于GIS定量分析老挝2012—2017年从分省到国家不同空间尺度活跃火频次的动态变化,并重点分析2015厄尔尼诺年活跃火频次及其与海拔、坡度、植被-水分(NDVI <sup>*</sup>、LSWI)指数、土地覆被等主要自然地理要素的相关特征。结果表明:① 老挝活跃火频次呈先增后减的趋势,峰值在2015厄尔尼诺年,主要集中在上、中寮,其中琅勃拉邦、沙耶武里与沙湾拿吉三省居前三位,而万象市、塞公和赛宋本则居后三位。② 老挝2012—2017年活跃火发生频次与地形因素(海拔、坡度)的关系基本相同,活跃火集中在海拔1000 m以下、坡度小于30°的低山-丘陵区。其中,上寮活跃火集中分布在500~1000 m、10~30°的斜陡坡山地,中、下寮集中在500 m以下、2~20°的缓斜坡丘陵。③ 活跃火高度集中在旱季,以3月、4月最多,并集中分布在NDVI为0.4~0.8和LSWI为0.2~0.6的中高覆盖度植被区。④ 老挝活跃火主要发生在森林这一土地覆被类型中,且以上寮最为集中,而中寮多以农田、草地和灌丛活跃火为主。综上,基于自然地理要素的活跃火特征分析可以有效识别其发生类型,即老挝活跃火主要由刀耕火种农业所引起。
Characteristics analyses of major physical geographic elements of Visible Infrared Imaging Radiometer (VIIRS) active fire in Laos
DOI:10.11821/dlyj020190029
[本文引用: 1]
Using US NASA's Fire Information for Resource Management System (FIRMS) VIIRS V1 (or Visible Infrared Imaging Radiometer Version 1) active fire location vector data, ASTER GDEM (30 m, or Advanced Spaceborne Thermal Emission and Reflection Radiometer Global Digital Elevation Model), Moderate Resolution Imaging Spectroradiometer (MODIS, 1 km) Normalized Difference Vegetation Index (NDVI) and Land Surface Water Index (LSWI), and Global Land Cover products (30 m), based on GIS, the dynamic changes in active fire events were quantitatively analyzed from provincial to national scales in Laos in 2012-2017. In addition, characteristics analyses of major physical geographic elements of VIIRS V1 active fires, including topography (elevation and slope), MODIS vegetation-moisture indices (NDVI and LSWI) and land cover types, were conducted in detail in the 2015 El Niño. The results showed that: (1) the number of active fire events in Laos increased first and then decreased in 2012-2017, with the peak in 2015. Active fires in Laos were mainly concentrated in the northern and central regions. Luang Prabang, Sayaburi and Savannakhet had the top number of active fires at the provincial level, while Vientiane City, Sekong and Xaisomboun in sequence ranked the last. (2) The relationship between the frequency of active fires in Laos and topographic factors (elevation and slope) in 2012-2017 was basically the same. Active fires primarily occurred in the hilly and low mountainous areas with elevations of less than 1000 m (86.10%) and slopes of less than 30° (92.45%). Among them, active fires in the northern region were concentrated in the mountainous areas with elevations of 500-1000 m and slopes of 10-30°, while others in the central and southern regions were concentrated in the hilly areas below 500 m and gentle slopes of 2°-20°. (3) Seasonally, the active fires in Laos mainly happened during the dry season (94.75%), with the most number in March and April (82.24%) and in the medium-high coverage vegetation area with NDVI of 0.4-0.8 (92.05%) and LSWI of 0.2-0.6 (75.70%). (4) Active fires were mostly distributed in the forests of Laos, especially in the northern part, while the counterparts in the central and southern parts mainly occurred in farmland, grassland and shrubland. (5) In summary, characteristics analyses of major physical geographic elements of VIIRS active fires can be used to determine its fire type, that is, active fires in Laos were mainly caused by swidden agriculture.
Active fires show an increasing elevation trend in the tropical highlands
[J].DOI:10.1111/gcb.v28.8 URL [本文引用: 1]
Occurrence frequencies and regional variations in Visible Infrared Imaging Radiometer Suite (VIIRS) global active fires
[J].
DOI:10.1111/gcb.15034
PMID:32037661
[本文引用: 1]
Active fires are considered to be the key contributor to, and critical consequence of, climate change. Quantifying the occurrence frequency and regional variations in global active fires is significant for assessing carbon cycling, atmospheric chemistry, and postfire ecological effects. Multiscale variations in fire occurrence frequencies have still never been fully investigated despite free access to global active fire products. We analyzed the occurrence frequencies of Visible Infrared Imaging Radiometer Suite (VIIRS) active fires at national, pan-regional (tropics and extratropics) to global scales and at hourly, monthly, and annual scales during 2012-2017. The results revealed that the accumulated occurrence frequencies of VIIRS global active fires were up to 12,193 × 10, yet exhibiting slight fluctuations annually and with respect to the 2014-2016 El Niño event, especially during 2015. About 35.52% of VIIRS active fires occurred from July to September, particularly in August (13.06%), and typically between 10:00 and 13:00 Greenwich Mean Time (GMT; 42.96%) and especially at 11:00 GMT (17.65%). The total counts conform to a bimodal pattern with peaks in 5°-11°N (18.01%) and 5°-18°S (32.46%), respectively, alongside a unimodal distribution in terms of longitudes between 15°E and 30°E (32.34%). Tropical annual average of active fire (1,496.81 × 10 ) accounted for 75.83%. Nearly 30% were counted in Brazil, the Democratic Republic of the Congo, Indonesia, and Mainland Southeast Asia (MSEA). Fires typically occurred between June (or August) and October (or November) with far below-average rainfall in these countries, while those in MSEA primarily occurred between February and April during the dry season. They were primarily observed between 00:00 and 02:00 GMT, between 12:00 and 14:00 within each Zone Time. We believed that VIIRS global active fires products are useful for developing fire detection algorithms, discriminating occurrence types and ignition causes via correlation analyses with physical geographic elements, and assessment of their potential impacts.© 2020 John Wiley & Sons Ltd.
Statistical analysis of active fire remote sensing data: Examples from South Asia
[J].Active fires emit aerosols and greenhouse gases in the atmosphere. In this paper, the behavior of active fires over a period of 1 year in Nepal, Bhutan, and Sri Lanka is studied using spatial statistics. In these countries, these fires are mainly forest and vegetation fires; they wreak havoc to the environment by damaging flora and fauna and emitting toxic gases. This study is based on data acquired through remote sensing of data acquisition platform, NASA's MODIS. Spatial statistics is used here to study the incidence of such fires with respect to geographical location. The behaviors of parameters of various autoregressive models like Spatial Durban Model, Spatial Lag Model, Spatial Error Model, Manski Model, and Kelegian Prucha Model are minutely analyzed. The best model with the highest pseudo R is selected. The spatial behavior of the fire radiative power (FRP) for the three countries is also predicted using spatial interpolation and kriging. The burning potential of vegetations in unsampled areas is envisaged by thus predicting FRP. This study gives a country-wise perspective to the behavior of fire; this is with reference to South Asia. It holds a great significance for countries of the developing world which lack a strong backbone of good-quality official records. Through the statistical analyses of data collected by such platforms, important information on impact of forest fires can be indirectly assessed.© 2021. The Author(s), under exclusive licence to Springer Nature Switzerland AG.
Indonesian fire activity and smoke pollution in 2015 show persistent nonlinear sensitivity to El Niño-induced drought
[J].
DOI:10.1073/pnas.1524888113
PMID:27482096
[本文引用: 2]
The 2015 fire season and related smoke pollution in Indonesia was more severe than the major 2006 episode, making it the most severe season observed by the NASA Earth Observing System satellites that go back to the early 2000s, namely active fire detections from the Terra and Aqua Moderate Resolution Imaging Spectroradiometers (MODIS), MODIS aerosol optical depth, Terra Measurement of Pollution in the Troposphere (MOPITT) carbon monoxide (CO), Aqua Atmospheric Infrared Sounder (AIRS) CO, Aura Ozone Monitoring Instrument (OMI) aerosol index, and Aura Microwave Limb Sounder (MLS) CO. The MLS CO in the upper troposphere showed a plume of pollution stretching from East Africa to the western Pacific Ocean that persisted for 2 mo. Longer-term records of airport visibility in Sumatra and Kalimantan show that 2015 ranked after 1997 and alongside 1991 and 1994 as among the worst episodes on record. Analysis of yearly dry season rainfall from the Tropical Rainfall Measurement Mission (TRMM) and rain gauges shows that, due to the continued use of fire to clear and prepare land on degraded peat, the Indonesian fire environment continues to have nonlinear sensitivity to dry conditions during prolonged periods with less than 4 mm/d of precipitation, and this sensitivity appears to have increased over Kalimantan. Without significant reforms in land use and the adoption of early warning triggers tied to precipitation forecasts, these intense fire episodes will reoccur during future droughts, usually associated with El Niño events.
1951—2007年的ENSO事件及其特征值
[J].
ENSO events during 1951-2007 and their characteristic indices
The defining characteristics of ENSO extremes and the strong 2015/2016 El Niño
[J].DOI:10.1002/rog.v55.4 URL [本文引用: 2]
Indian monsoon-ENSO relationship on interdecadal timescale
[J].DOI:10.1175/1520-0442(2000)013<0579:IMEROI>2.0.CO;2 URL [本文引用: 1]
中国气候预测研究与业务发展的回顾
[J].
Highlights of climate prediction study and operation in China over the past decades
A least-squares method for estimating the correlated error of GRACE models
[J].
DOI:10.1093/gji/ggaa104
URL
[本文引用: 1]
A new least-squares method is developed for estimating and removing the correlated errors (stripes) from the Gravity Recovery and Climate Experiment (GRACE) and GRACE Follow-On (GRACE-FO) mission data. This method is based on a joint parametric model of the correlated errors and temporal trends in the spherical harmonic coefficients of GRACE models. Three sets of simulation data are created from the Global Land Data Assimilation System (GLDAS), the Regional Atmospheric Climate Model 2.3 (RACMO2.3) and GRACE models and used to test it. The results show that the new method improves the decorrelation method by Swenson & Wahr significantly. Its application to the release 5 (RL05) and new release 6 (RL06) spherical harmonic solutions from the Center for Space Research (CSR) at The University of Texas at Austin demonstrates its effectiveness and provides a relative assessment of the two releases. A comparison to the Swenson & Wahr and Kusche et al. methods highlights the deficiencies in past destriping methods and shows how the inclusion and decoupling of temporal trends helps to overcome them. A comparison to the CSR mascon and JPL mascon solutions demonstrates that the new method yields global trends that have greater amplitude than those produced by the CSR RL05 mascon solution and are of comparable quality to the JPL RL06 mascon solution. Furthermore, these results are obtained without the need for a priori information, scale factors or complex regularization methods and the solutions remain in the standard form of spherical harmonics rather than discrete mascons. The latter could introduce additional discretization error when converting to the spherical harmonic model, upon which many post-processing methods and applications are built.
1906—2015年武汉市温度变化序列重建与初步分析
[J].
DOI:10.18306/dlkxjz.2017.09.014
[本文引用: 1]
本文利用1906-2015年武汉月平均最高与最低气温资料,重建了过去110年武汉市年平均气温距平序列,分析了其年代际尺度的变化特征。主要结论为:①过去110年武汉市经历了“暖—冷—暖”3个多年代际波动,其中1906-1946年与1994-2015年气候相对温暖,1947-1993年则气候相对寒冷;②在多年代尺度上,武汉市存在多次显著增温和降温过程,其中增温速率最快的30年和50年分别出现在1980-2009年和1960-2009年;最快降温速率则出现在1928-1957年和1925-1974年;③过去110年武汉市年均温发生了3次跃变,其中由冷转暖的跃变出现在20世纪20年代初和90年代中后期,而由暖转冷的跃变则出现在40年代;④武汉市年均温变化与全球/北半球和中国的变化趋势基本一致,但变幅偏大。此外,全球增暖停滞现象在武汉市最近十几年也有所体现。
Reconstruction and analysis of annual mean temperature of Wuhan for the 1906-2015 period
DOI:10.18306/dlkxjz.2017.09.014
[本文引用: 1]
Based on the monthly maximum and minimum temperature data at Wuhan meteorological station in 1906-2015, annual mean temperature during the 110 years was reconstructed and the temporal change was analyzed. The main conclusions are: (1) Annual mean temperature of Wuhan showed multi-decadal variations. Two warm periods were experienced during 1906-1946 and 1994-2015; and between 1947 and 1993, annual mean temperature was relatively low. (2) At multi-decadal temporal scales, annual mean temperature of Wuhan showed several significant warming and cooling trends. The largest warming trends at 30- and 50-year scales were detected during 1980-2009 and 1960-2009, with linear trends amounting to 2.67±0.48 ℃/30a and 2.20±0.50 ℃/50a, respectively. The strongest cooling trends for the same temporal scales were detected for 1928-1957 and 1925-1974, with linear trends being -1.23±0.48 ℃/30a and -1.40±0.35 ℃/50a, respectively. (3) During the 110 years, there existed three abrupt changes in Wuhan annual mean temperature. During the early 1920s and the mid-late 1990s, temperature of Wuhan turned from cold to warm conditions. In the 1940s, the change was to the opposite. (4) Comparing temperature change of Wuhan with global, hemispheric, and China's country scales, the temperatures showed similar temporal evolution, with Wuhan exhibiting greater amplitude of change. The recent pause in global warming was also observed in Wuhan.
京津冀水资源利用多效率指标的变化特征比较
[J].
DOI:10.18306/dlkxjz.2021.07.010
[本文引用: 1]
提高水资源利用效率,缓解用水压力,是解决京津冀缺水问题的有效措施,对各行业用水效率历史状况的全局把握有助于未来政策的调整。论文比较了京津冀三地的万元GDP用水量、万元工业增加值用水量、管网漏损率、人均日生活用水量、污水处理率、作物水分利用效率共6项指标组成的综合用水效率,分析了2002—2017年京津冀用水效率的Mann-Kendall突变点和趋势变化,并基于Burg算法功率谱估计分析了各指标的周期变化特征,计算了各指标基于Burg算法的功率谱。结果表明,在产业结构优化调整和节水技术提升等措施的共同作用下,三地用水效率指标的差异在逐渐缩小,显示了京津冀协同发展的效应,但仍有明显的发展差异。北京、河北的综合用水效率整体呈增长趋势,河北的增长率(0.16)明显高于北京(0.07),而天津的综合用水效率整体上呈下降趋势(-0.03),重点表现在万元GDP用水量和万元工业增加值用水量的增加(0.18、0.19)。北京综合用水效率整体呈现5 a(周期强度为77 dB)、3 a(73 dB)左右的周期,天津综合用水效率整体呈现7 a(88 dB)、2 a(81 dB)左右的周期,河北综合用水效率整体呈现3 a(81 dB)左右的周期。相比于北京和河北,天津综合用水效率的周期性更强,这意味着可以适时地利用其内在周期调控用水效率的变化趋势。
Comparison of the variation characteristics of water resource use efficiency indicators in the Beijing-Tianjin-Hebei region
DOI:10.18306/dlkxjz.2021.07.010
[本文引用: 1]
Improving the efficiency of water resource use and relieving water pressure are effective measures to solve the water shortage problem in the Beijing-Tianjin-Hebei region. An overall understanding of the historical situation of water use efficiency in various industries is conducive to future policy adjustments. In this study, we compared the comprehensive water use efficiency composed of six indicators, including water consumption per 10000 yuan of GDP, water consumption per 10000 yuan of industrial added value, water pipe network leakage rate, daily domestic water consumption per capita, sewage treatment rate, and water use efficiency of crops (WUE). Then the Mann-Kendall abrupt transition point and trend change of water use efficiency in the region from 2002 to 2017 were analyzed, and the periodic variation characteristics of each indicator were analyzed based on power spectrum estimation with the Burg method. The results show that, under the combined action of industrial structure optimization and adjustment and water-saving technology improvement, the differences of water use efficiency between the three areas of the region were gradually narrowing, showing the effect of coordinated development in the Beijing-Tianjin-Hebei region, but there were still significant development differences. The overall water use efficiency in Beijing and Hebei showed an increasing trend, and the growth rate of Hebei (0.16) was significantly higher than that of Beijing (0.07). The overall water use efficiency of Tianjin showed a decreasing trend (-0.03), which was mainly reflected in the increase of water consumption per 10000 yuan of GDP and water consumption per 10000 yuan of industrial added value (0.18, 0.19). In addition, water use efficiency in Beijing as a whole presented a cycle of about 5-year (77 dB) and 3-year (73 dB), while water use efficiency in Tianjin as a whole presented a cycle of about 7-year (88 dB) and 2-year (81 dB). Compared with Beijing and Hebei, Tianjin's comprehensive water use efficiency was more cyclical, which means that its internal cycle can be used to regulate the changing trend of water use efficiency in a timely manner.
海河流域气象和水文降水资料对比分析及时空变异
[J].
Comparison and spatial-temporal variability of daily precipitation data of weather stations and rain gauges in Haihe River Basin
DOI:10.11821/xb200909006
[本文引用: 1]
In this paper, the precipitation data from 30 weather stations for 1958-2007 and 248 rain gauges for 1995-2004 are examined and compared using linear regression, 5-year moving average, Mann-Kendall trend analysis, Kolmogorov-Smirnov test, Z test and F test methods; the WS data are used to extend the short record of RG data series; the temporal and spatial variations of precipitation in the Haihe River basin are studied. The results show that: (1) The precipitation of 1958-2007 has been decreasing except for the spring. The decline trend is significant in summer, and this trend is stronger after the 1980s; (2) The annual precipitation from both WS and RG records are normally distributed, with minor difference in the mean value and variance. In addition, their correlation degrees are higher, and it is statistically feasible to extend the precipitation of RG by weather station precipitation; (3) The temporal and spatial patterns of summer and annual precipitation in the Haihe River Basin are similar: in the piedmont of the Taihang Mountains and Yanshan Mountains there exists a rainfall rich zone, while on the leeward slope of the mountains and in the plain area there is less rainfall. In addition, the rainfall declines from the south to the north, and from the coast to the inland; winter sees the least water vapor and less precipitation in the north than in the south; while spring and autumn often witness a transition from winter to summer. In recent 50 years, the declining trend is most significant around the Wutaishan station, as well as some regions in the piedmont, and the changing trends are different in different seasons.
近50年来淮河流域极端降水的时空变化及统计特征
[J].
The trend analysis and statistical distribution of extreme rainfall events in the Huaihe River Basin in the past 50
1948—2016年全球主要气象要素演变特征
[J].
Variation and global pattern of major meteorological elements during 1948-2016
东南亚地区年际降水变化及其与ENSO的关系
[J].
Variation features of annual and seasonal rainfalls in Southeast Asia and their relations with ENSO during 1948-2002
欧亚大陆极端降水事件的区域变化特征
[J].
Regional characteristics of extreme precipitation events in Eurasia
Global and cross-country analysis of exposure of vulnerable populations to heatwaves from 1980 to 2018
[J].
DOI:10.1007/s10584-020-02884-2
[本文引用: 2]
Heatwaves have become more frequent and intense due to anthropogenic global warming and have serious and potentially life-threatening impacts on human health, particularly for people over 65 years old. While a range of studies examine heatwave exposures, few cover the whole globe and very few cover key areas in Africa, South America, and East Asia. By using global gridded climate reanalysis, population, and demographic data, this work analyses trends in change in exposure of vulnerable populations to heatwaves, providing global and per-country aggregate statistics. The difference between the global mean of heatwave indexes and the mean weighted by vulnerable population found that these populations are experiencing up to five times the number of heatwave days relative to the global average. The total exposures, measured in person-days of heatwave, highlight the combined effect of increased heatwaves and aging populations. In China and India, heatwave exposure increased by an average of 508 million person-days per year in the last decade. Mapping of changes per country highlighted significant exposure increases, particularly in the Middle East and in South East Asia. Major disparities were found between the heatwave exposures, country income group, and country health system capacity, thus highlighting the significant inequalities in global warming impacts and response capacities with respect to health across countries. It is therefore of prime importance that health development and response are coordinated with climate change mitigation and adaptation work.
Observed and modelled temperature and precipitation extremes over Southeast Asia from 1972 to 2010
[J].DOI:10.1002/joc.2018.38.issue-7 URL [本文引用: 1]
Inconsistency in historical simulations and future projections of temperature and rainfall: A comparison of CMIP5 and CMIP6 models over Southeast Asia
[J].
Multi-year variability or unidirectional trends? Mapping long-term precipitation and temperature changes in continental Southeast Asia using PRECIS regional climate model
[J].DOI:10.1007/s10584-011-0359-3 URL [本文引用: 1]
Interdecadal variability of rainfall on a warming planet
[J].
Downscaling general circulation model output: A review of methods and limitations
[J].
DOI:10.1177/030913339702100403
URL
[本文引用: 1]
General circulation models (GCMs) suggest that rising concentrations of greenhouse gases may have significant consequences for the global climate. What is less clear is the extent to which local (subgrid) scale meteorological processes will be affected. So-called 'downscaling' techniques have subsequently emerged as a means of bridging the gap between what climate modellers are currently able to provide and what impact assessors require. This article reviews the present generation of downscaling tools under four main headings: regression methods; weather pattern (circulation)-based approaches; stochastic weather generators; and limited-area climate models. The penultimate section summarizes the results of an international experiment to intercompare several precipitation models used for downscaling. It shows that circulation-based downscaling methods perform well in simulating present observed and model-generated daily precipitation characteristics, but are able to capture only part of the daily precipitation variability changes associated with model-derived changes in climate. The final section examines a number of ongoing challenges to the future development of climate downscaling.
1979—2017年北极陆地气候变化趋势
[J].
DOI:10.18402/resci.2021.06.16
[本文引用: 1]
北极地区是受全球变暖影响最为显著的地区之一。北极升温速率超过全球平均速率的2倍,这一“极地放大现象”和海冰的快速消融不仅造成当地环境的剧烈变化,还深刻影响着中纬度的天气和气候系统。深入理解气候长期趋势的季节和地理分布特征,有助于应对北极气候变化及其影响,并为未来开发北极资源服务。考虑到北极地区观测台站稀疏带来的不确定性,本文利用多套格点化的观测分析和ERA-Interim再分析资料,结合线性趋势分析,研究了1979—2017年60°N以北陆地地表温度、降水、气温日较差、年较差及相关极端气候指标的变化趋势。结果显示:①各资料中气温变化的一致性很高,但对于降水在2008年之后的变化,不同资料差异较大,可能是金融危机下可用台站数量急剧下降造成的。②ERA-Interim再分析资料能够很好地再现北极陆地温度和降水的整体增加趋势,变化速率分别约(0.57±0.07) ℃/10 a和(0.10±0.05) mm/d/100 a。春、秋、冬季升温趋势强,而夏季升温趋势较弱。北冰洋沿岸地区升温速率最大,局地可超过1.0 ℃/10 a。③降水的增加趋势在秋季最大。西伯利亚降水的增加与局地升温有很好的对应关系,其中秋季西伯利亚东部平均和极端降水的增加趋势可达热力学约束的8 %/K。④夏季气温日较差没有显著的变化趋势,春季阿拉斯加和加拿大北部地区的气温日较差呈显著增大趋势,其他区域则以减小趋势为主。气温年较差在北欧、阿拉斯加和加拿大北部呈减小趋势,在西伯利亚西部和东部呈增加趋势。无论冬夏,温度最小值的升高趋势比最大值更显著;冬季温度最小值的升高趋势比夏季更显著。研究表明,地表升温是北极陆地局地降水增加的重要驱动因素,不同区域降水变化的差异则可能与环流变化有关;观测台站数量的减少对降水趋势的监测有显著影响;ERA-Interim可作为北极地区观测分析资料的重要补充,特别在台站稀疏地区和台站数量减少的时段,ERA-Interim可提供一致和可信的气候变化信息。
Climate changes over the Arctic land during 1979-2017
DOI:10.18402/resci.2021.06.16
[本文引用: 1]
The Arctic is one of the rapidly changing regions remarkably influenced by global warming. Polar warming amplification (warming rate two times larger than the global mean) and rapidly declining sea ice lead to not only dramatic changes in the local environment, but also profound effects on weather and climate system in the mid-latitude. An in-depth understanding of seasonal and geographical features of long-term trends can contribute to policy responses to climate change and its consequence, supporting Arctic resource development in the future. Using gridded observational analysis datasets and the ERA-Interim reanalysis, this study focused on linear trends of surface air temperature, precipitation, and related extreme indices in the land area north of 60°N during 1979-2017. The results show that temperature changes highly agree with each other while precipitation changes are distinct across the multiple data sources, especially after 2008, which is possibly caused by sharply decreased gauges in use under the global financial crisis. The ERA-Interim dataset can well reproduce the upward trends of near-surface air temperature and precipitation over the Arctic land, about (0.57±0.07) ℃/10 a and (0.10±0.05) mm/d/100 a for annual mean. The warming trend is strong in spring, autumn, and winter whereas weak in summer. Areas near the Arctic coasts have the largest warming rate, with local warming higher than 1.0 ℃/10 a. The increasing trend of precipitation in autumn is the largest. The precipitation increases in Siberia are well linked to the local surface warming. During autumn, increases in both the mean and extreme precipitation in eastern Siberia can be as high as the thermodynamically constrained 8 %/K. No evident trend of diurnal temperature range is observed in summer. In spring, the diurnal temperature range in Alaska and northern Canada increases evidently whereas a decreasing trend emerges in other regions. Annual temperature range decreases in the Nordic, Alaska, and northern Canada while increases in western and eastern Siberia. In both winter and summer, warming trend of minimum temperature over the Arctic is larger than that of maximum temperature, which is also larger in winter than in summer. This study evidences that surface warming is an important driver of local precipitation increase over the Arctic land while circulation changes may create the geographical differences; decrease of observational stations has an obviously negative impact on monitoring the long-term trend of precipitation; ERA-Interim is an important alternative to observational analysis data in the Arctic land. Especially for regions with sparse weather stations and for periods when the number of available stations decreases, the ERA-Interim data can provide consistent and reliable climate change information.
1982—2015年全球植被变化及其与温度和降水的关系
[J].
DOI:10.13249/j.cnki.sgs.2020.05.017
[本文引用: 1]
采用1982-2015年的GLASS-LAI (Global Land Surface Satellite-Leaf Area Index )遥感数据和CRU(Climatic Research Unit)气象数据,利用Mann-Kendall趋势法分析了过去34 a全球9种植被的叶面积指数(Leaf Area Index,LAI)时空变化特征;使用相关分析和逐步线性回归分别探讨了全球9种植被LAI与降水、温度的年际与月关系。结果表明:① 全球植被总体呈现绿化趋势,其中变化较大的是草原、稀树草原、常绿阔叶林和多树草原;在植被生长的绿化和褐化趋势中,面积占比最大的植被类型均为草原,说明草原生态系统易受环境因素的影响。② 从年际关系看,草原和开放灌丛的LAI与年均降水多呈正相关关系,而温度对不同纬度植被的LAI存在正负2种影响。其原因为温度升高对中低纬度的植被生长有抑制作用,而对高纬度地区植被生长有促进作用。③ 从年内关系看,南半球降水和温度共同作用于植被的生长;而北半球除常绿阔叶林的生长与温度关系更为紧密外,其它类型植被的生长主要受降水影响。④ 逐步线性回归结果表明,当月温度的升高对常绿阔叶林、混交林和农作物的生长具有促进作用,而多树草原和草原2种植被的生长受当月降水的影响最为显著。
Global vegetation change and its relationship with precipitation and temperature based on GLASS-LAI in 1982-2015
DOI:10.13249/j.cnki.sgs.2020.05.017
[本文引用: 1]
We analyzed the spatial-temporal changes in global vegetation and their dynamic responses to temperature and precipitation using GLASS-LAI (Global Land Surface Satellite-Leaf Area Index ) and CRU (Climatic Research Unit) meteorological data from 1982 to 2015. The results showed that: 1) Global vegetation showed an overall greening trend, which is paricularly significant over grasslands, savannas, evergreen broadleaf forests and woody savanas. Grasslands have the largest greening and browning area, indicating their vulnerability to climate. 2) In terms of the inter-annual relationships, the LAI of grasslands and open shrublands were overall positively correlated with precipitation, while temperature had different effects on the growth of vegetation at diverse latitudes. This could be attributed to that, the growth of vegetation at middle and low latitudes was inhibited by the increasing temperature, while facilitated by the rising temperature at high latitudes. 3) In terms of the intra-annual relationships, precipitation and temperature together promoted vegetation growth in the southern hemisphere, however, the vegetation in the northern hemisphere was mainly affected by precipitation, except evergreen broadleaf forests. 4) The results of stepwise multiple regression indicated that the rising instant temperature had positive influence on the growth of evergreen broadleaf forests, mixed forests, and croplands, while woody savannas and savannas were significantly impacted by the instant precipitation.
The Global Fire Atlas of individual fire size, duration, speed and direction
[J].
DOI:10.5194/essd-11-529-2019
[本文引用: 1]
Natural and human-ignited fires affect all major biomes, altering ecosystem structure, biogeochemical cycles and atmospheric composition. Satellite observations provide global data on spatiotemporal patterns of biomass burning and evidence for the rapid changes in global fire activity in response to land management and climate. Satellite imagery also provides detailed information on the daily or sub-daily position of fires that can be used to understand the dynamics of individual fires. The Global Fire Atlas is a new global dataset that tracks the dynamics of individual fires to determine the timing and location of ignitions, fire size and duration, and daily expansion, fire line length, speed, and direction of spread. Here, we present the underlying methodology and Global Fire Atlas results for 2003-2016 derived from daily moderate-resolution (500 m) Collection 6 MCD64A1 burned-area data. The algorithm identified 13.3 million individual fires over the study period, and estimated fire perimeters were in good agreement with independent data for the continental United States. A small number of large fires dominated sparsely populated arid and boreal ecosystems, while burned area in agricultural and other human-dominated landscapes was driven by high ignition densities that resulted in numerous smaller fires. Long-duration fires in boreal regions and natural landscapes in the humid tropics suggest that fire season length exerts a strong control on fire size and total burned area in these areas. In arid ecosystems with low fuel densities, high fire spread rates resulted in large, short-duration fires that quickly consumed available fuels. Importantly, multiday fires contributed the majority of burned area in all biomass burning regions. A first analysis of the largest, longest and fastest fires that occurred around the world revealed coherent regional patterns of extreme fires driven by large-scale climate forcing. Global Fire Atlas data are publicly available through http://www.globalfiredata.org (last access: 9 August 2018) and https://doi.org/10.3334/ORNLDAAC/1642, and individual fire information and summary data products provide new information for benchmarking fire models within ecosystem and Earth system models, understanding vegetation-fire feedbacks, improving global emissions estimates, and characterizing the changing role of fire in the Earth system.
