

Couasnon等[11]对全球河口径流与风暴潮作用下的复合洪水发生概率进行评估,指出这2种致灾因子在中国沿海具有复杂的相关性。目前,有诸多学者在中国沿海地区及城市[12⇓-14]对降雨与风暴潮共同作用下的复合洪水进行研究,其中,Fang等[13]指出,在东南沿海区域忽略复合效应将低估其洪水风险。位于东南沿海的珠江三角洲,一直都是风暴潮灾害的高发区,而在全球变暖等气候变化背景下,未来风暴潮将具有更强的致灾性[15]。同时,人类高强度活动导致的河床下切,使得径潮非线性作用下河道壅水,叠加天文潮后,中腹部河网区复合洪水危险性将增加[16]。珠江河口的风暴潮对河道径流具有敏感性[17],二者的耦合作用将带来更严重的危害。Wang等[18]在东海—小榄—横门水道区域建立HEC-RAS水力模型,发现二者的复合作用将加剧水道下游30 km的极端洪水,但对不同主导因子作用下复合洪水的特点及发生概率没有进一步探究。因此,本文主要关注以下2个问题:① 不同测站中致灾因子相关性将呈现怎样的时空分布特征;② 径流与风暴潮作用下复合洪水联合重现期与现有洪水标准下(基于单变量方法)的重现期的差异。
本文选取珠江三角洲内三水站与马口站的逐日径流流量资料,及其控制下的7个不同测站的逐时风暴增水资料,分别以年径流极值主导的序列和年风暴增水极值主导的序列作为复合洪水样本事件,借助Spearman系数对两序列分别进行相关性分析,评估各测站处主导洪水事件的致灾因子;利用Mann-Kendall(简称M-K)趋势检验,分析测站内相关性随时间的变化趋势;通过选择合适的Copula函数计算复合事件的联合重现期,以期为当地洪水的应对与防护提供一定的参考建议。
1 研究区域、数据与方法
1.1 研究区域
珠江三角洲位于中国南部,南临南海。流域内包含三大水系:西江、北江和东江,河网交错,由八大口门汇入海洋,总流域面积约为17200 km2。三大水系河道径流平均流量由大到小分别为:西江7100 m3/s、北江1500 m3/s、东江720 m3/s。当洪水发生时,受径流平均流量的影响,河道洪峰流量值分布表现为西江最大、北江次之、东江最小。马口站(R1)和三水站(R2)靠近西江与北江短暂交汇后的分汊(图1),是径流观测的重要节点,因此,选择这2个测站分别作为西江、北江的径流观测站。
图1

图1
珠江三角洲及测站位置分布
注:本图基于自然资源部标准地图服务网站下载的审图号为GS(2019)4342号的标准地图制作,底图无修改。下同。
Fig.1
Distribution of hydrologic stations in the Pearl River Delta
每年7—9月,珠江三角洲将遭受来自海洋的高频风暴潮,据《珠江流域水文资料》统计,风暴增水普遍在60~280 cm之间。2018年,超强台风“山竹”在广东登陆,通过三灶站观测到其最大风暴增水达到339 cm。本文选取西江马口站与北江三水站以下河网地区作为研究区域,区域内共选取7个潮位测站,分别位于西江与北江水系的分支旁,依次为三沙口站(T1)、南沙站(T2)、万顷沙西站(T3)、横门站(T4)、灯笼山站(T5)、黄金站(T6)、西炮台站(T7),具体位置分布如图1所示。2个径流测站到7个潮位测站的平均距离约为99 km。
1.2 数据来源与预处理
7个潮位测站的逐时潮水位资料与2个径流测站的日径流流量资料均来自《中华人民共和国水文年鉴第8卷: 珠江流域水文资料》,资料年限为1962—2017年。为获得本文研究所需的风暴增水样本数据,利用Pawlowicz等[19]提出的MATLAB T_Tide程序包,通过调和分析手段,从逐时潮水位资料中剥离出天文潮位,并用潮余值作为风暴潮水位,即风暴增水,在这个过程中,去除了平均海平面上升的影响以及带来的数据非稳定性。
1.3 研究方法
1.3.1 洪水事件的选取
对于研究径流与风暴潮共同作用下的复合洪水,以北江、西江2支不同的径流作为划分依据,将径流测站分别与所在径流流经的风暴潮测站进行两两组合,具体测站组合如表1所示,其中北江、西江均流经T4横门站,因此横门站分2个组合,即R2T4与R1T4。
表1 测站组合
Tab.1
| 径流 | 组合代号 | 测站组合 | 径流 | 组合代号 | 测站组合 |
|---|---|---|---|---|---|
| 北江 | R2T1 | 三水—三沙口 | 西江 | R1T4 | 马口—横门 |
| R2T2 | 三水—南沙 | R1T5 | 马口—灯笼山 | ||
| R2T3 | 三水—万顷沙西 | R1T6 | 马口—黄金 | ||
| R2T4 | 三水—横门 | R1T7 | 马口—西炮台 |
基于Couasnon等[11]在2020年开展的对全球风暴潮与径流进行的模拟工作,本文选取2种数据序列,分别为以第n年最大径流Qn为主的序列(Qn, sn)和以第n年最大风暴增水Sn为主的序列(Sn, qn)。其中sn为第n年最大径流Qn发生的前后Δ天内的最大风暴增水,qn为第n年最大风暴增水Sn发生的前后Δ天内的最大径流,即:
间隔时间Δ为复合洪水发生时,引起风暴潮的寒潮(大风)或热带气旋(台风)移动到三角洲并产生水位影响的时间,或者上游径流经水道抵达潮位测站的滞后时间,与流域面积A(km2)有关[10],Δ=0.11A0.4 d,珠江三角洲取Δ=4 d。
1.3.2 Spearman相关性分析与Mann-Kendall趋势检验
本文所选用的复合洪水事件观测数据符合Spearman相关系数的适用范围,因此,在后续计算中选用Spearman系数ρs对洪水事件进行相关性分析[20]。
M-K趋势检验法是一种检验数据序列趋势的非参数检验法,所选数据序列可以不服从具体的概率分布,个别异常值对结果无影响,因此被广泛应用于水文序列趋势判断领域。对于径流量与风暴潮序列中存在的会放大趋势显著性的自相关性,采用预置白处理方法[21]消除序列中的自相关性。
1.3.3 二维Copula函数选择
为确定Copula函数的具体表达式,可通过AIC(Akaike Information Criteria)与BIC(Bayesian Information Criteria)同时进行拟合优度检验,二者的表达式为:
式中:k为参数的数量,l为似然函数,本文采用极大似然估计,n为样本数量。
采用2种准则能够更好地选择符合变量的Copula函数,BIC弥补了AIC在样本数量过多时模型精度和复杂度过高的不足。对数据序列进行AIC和BIC计算,AIC和BIC均为最小值时所对应的Copula函数为当前数据序列的最优Copula函数。
1.3.4 二维Copula联合重现期
二维Copula函数的重现期分为2种:联合重现期(OR return period)和同重现期(AND return period)[3]。当至少有一个变量超过其风险值时,称此类事件为“或”事件,此时的重现期为联合重现期;当2个变量同时超过风险值时,称此类事件为“和”事件,此时的重现期为同重现期。联合概率、联合重现期和同重现期表达式分别为:
式中:X和Y分别为2类连续随机变量,x和y分别为变量的风险值,u和v分别为其边缘分布函数,F(x)、G(y)分别为其概率密度函数,C(u,v)为两变量相关时的Copula函数。
对于风暴潮与径流共同作用下的复合洪水,两变量间存在一定的相互作用,发生复合洪水的情景多样,因此选择联合重现期进行后续研究。
2 风暴潮与径流相关性时空分布
2.1 风暴潮与径流相关性的空间分布
对(Qn, sn)和(Sn, qn)序列(下文简写为(Q, s)、(S, q)序列)两变量间的相关性进行计算,其结果的空间分布如图2所示。
图2
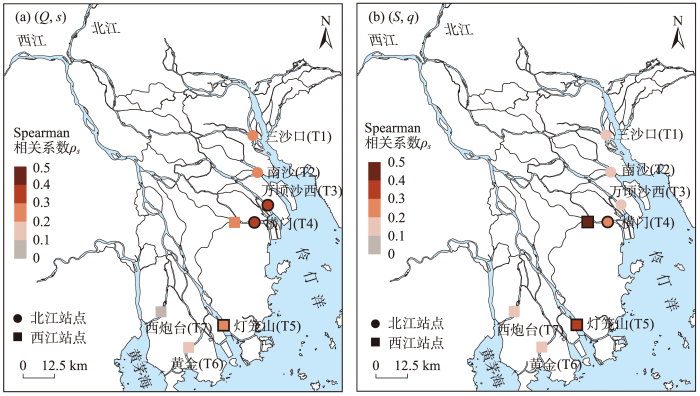
图2
不同序列下测站组合Spearman相关系数ρs的空间分布
注:北江、西江均流经T4横门站,分2个组合;边缘描黑表示相关系数显著(P<0.05)。
Fig.2
Spatial distribution of Spearman correlation coefficient ρs in different series
2种序列下的风暴潮与径流均呈正相关,相关系数的区间为0~0.50。对比同一序列的不同测站,发现2种序列邻近横门与磨刀门的测站(T4、T5)相关性相对强,且(Q, s)序列中万顷沙西站(T3)、横门站(T4,北江)、灯笼山站(T5)与(S, q)序列中横门站(T4)、灯笼山站(T5)显著相关,而西南部入海口黄金站(T6)与西炮台站(T7)因分流少相关性弱;2种序列所有测站中,(S, q)序列中西江径流控制下的横门站相关性最高,为0.42;对比不同序列下的同一测站,发现北江控制的测站在(Q, s)序列中相关系数较高;而西江控制的测站在(S, q)序列中相关系数较高,且(Q, s)序列的显著相关测站数量高于(S, q)序列。万顷沙西站在(Q, s)序列中显著相关,但在(S, q)序列中相关性相对弱,说明相较于风暴增水的变化,此测站对径流极值的变化更为敏感,在此发生的复合洪水多为径流极值主导。对于由2支径流控制的横门站,在(Q, s)序列中北江径流控制下相关性显著,(S, q)序列中西江、北江的径流组合均显著,但西江径流控制下相关性更强,因此横门站复合洪水概率取决于北江径流极值下的风暴增水大小和风暴增水极值下的西江径流值大小。
2.2 风暴潮与径流相关性的长时间变化趋势
以25年为滑动窗口,对2种序列下的数据进行Spearman相关系数计算,得到相关系数随时间的变化趋势,随后通过M-K趋势检验计算出不同序列下各测站的ρs随时间变化的趋势值,将测站组合的M-K趋势绝对值绘制如图3所示。
图3
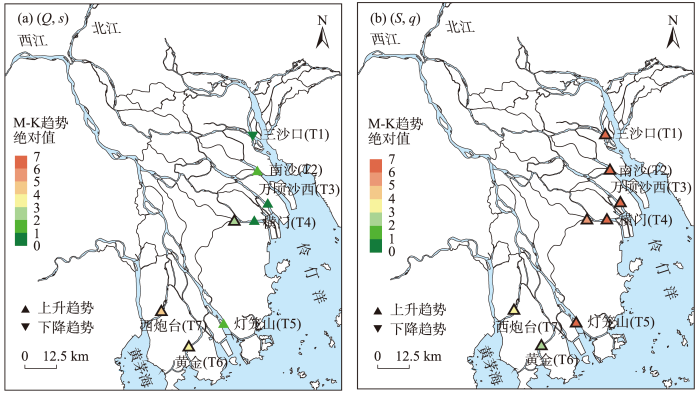
图3
不同序列下测站组合M-K趋势绝对值|Z|的空间分布
注:T4横门站左、右边的三角形分别表示西江、北江组合,边缘描黑表示趋势显著(P<0.05)。
Fig.3
Spatial distribution of M-K trend absolute value |Z| in different series
由图3可知,(Q, s)序列下北江测站除三沙口站的相关性随时间降低外,其余测站组合的相关性均随时间呈增加趋势且不显著,西江各测站的M-K趋势值均大于北江各测站的值,且除灯笼山外的西江测站趋势显著;(S, q)序列下均为显著趋势,且东入海口测站M-K趋势值更大。对比两序列下的同一测站,发现除黄金站和西炮台站以(Q, s)序列趋势为主外,其余测站均为(S, q)序列趋势更强,说明过去几十年来这些测站的风暴增水极值逐渐与径流相关紧密,复合洪水将逐渐以风暴增水极值为主导。
图4
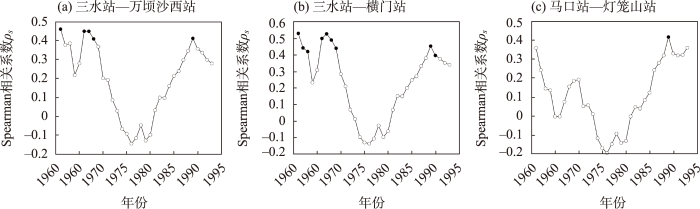
图4
(Q, s)序列下显著相关测站Spearman相关系数ρs随时间的变化趋势
注:滑动窗口为25年,实心圆表示相关性显著(P<0.05)。
Fig.4
Trends of Spearman correlation coefficient ρs of stations with significant correlation in (Q, s) series
2.3 风暴潮与径流相关性的季节性变化
风暴潮的高发具有季节性,珠江三角洲径流流量在洪枯季也表现出显著差异。比较洪季(4—9月)和枯季(10月—次年3月)(Q, s)和(S, q)序列下各测站组合的相关性及其差异能更好地对复合洪水的发生特征进行分析,两序列下各测站组合的季节相关性如图5所示。
图5
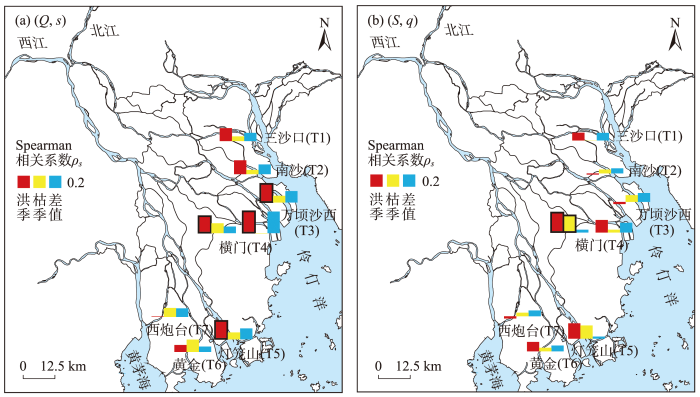
图5
不同序列下测站组合Spearman相关系数ρs洪季、枯季及差值的空间分布
注:T4横门站左、右边的柱状图分别表示西江、北江组合,边缘描黑表示相关系数显著(P<0.05)。
Fig.5
Spatial distribution of Spearman correlation coefficient ρs in flood season (orange), dry season (yellow), and the difference (blue) in different series
对比同一序列下不同季节与差值的Spearman相关系数分布,发现(Q, s)序列下,主要以洪季相关性占优,且万顷沙西站、横门站、灯笼山站在洪季具有显著的相关性,而枯季测站组合的相关性较弱,这表明在洪季极端径流更容易与风暴潮相继发生,引发复合洪水的概率较大,枯季则不相继发生。但黄金站与西炮台测站组合相关性枯季强于洪季,分析其原因可能是枯季流量相较于洪季整体减少,径流极值年际量级差降低,使其年际变化与对应时间内风暴增水的年际变化趋势更加接近,相关性得到增强。不同测站间相关系数洪枯季差异较明显,最大差值在横门站(北江),约为0.35,最小差值在黄金站,约为0.09;在(S, q)序列下,整体相关性较弱,仅在横门站(西江)有显著相关性,即极端风暴潮与径流相继发生概率较小。不同测站间季节性差值变化不大,差值普遍小于0.15,最大差值在横门站(北江),约为0.16,最小差值在灯笼山站,约为0.03。横门站在不同径流控制下季节相关性差异较大,对其进一步分析可知,在风暴增水极值出现时,横门站与西江马口站径流量的相关性更强。
3 风暴潮与径流联合重现期分布
3.1 最优Copula函数选择
对不同序列中显著相关的测站组合进行AIC和BIC计算,结果如表2所示。(Q, s)序列中R2T3与R2T4组合选用Plackett Copula函数,R1T5组合选用二元Student's t Copula函数;(S, q)序列中R2T4组合选用Frank Copula函数,R1T4与R1T5选用二元Student's t Copula函数。
表2 各测站组合在不同Copula函数下的AIC与BIC值
Tab.2
| 序列 | 测站 组合 | AIC | BIC | |||||||||
|---|---|---|---|---|---|---|---|---|---|---|---|---|
| Clayton | Frank | Gumbel | Student's t | Plackett | Clayton | Frank | Gumbel | Student's t | Plackett | |||
| (Q, s) | R2T3 | -2.44 | -6.21 | -5.99 | -5.59 | -7.01* | -2.40 | -6.17 | -5.95 | -5.52 | -7.01* | |
| R2T4 | -2.76 | -8.45 | -8.59 | -8.74 | -10.31* | -2.73 | -8.41 | -8.55 | -8.67 | -10.31* | ||
| R1T5 | -1.16 | -3.34 | -3.48 | -3.77* | -3.69 | -1.13 | -3.30 | -3.45 | -3.70* | -3.69 | ||
| (S, q) | R2T4 | -0.73 | -3.70* | -2.81 | -3.06 | -3.28 | -0.69 | -3.67* | -2.78 | -2.99 | -3.28 | |
| R1T4 | -8.55 | -9.94 | -6.94 | -10.16* | -9.01 | -8.51 | -9.90 | -6.90 | -10.09* | -9.01 | ||
| R1T5 | -7.34 | -8.51 | -9.04 | -10.26* | -7.95 | -7.30 | -8.48 | -9.00 | -10.19* | -7.95 | ||
注:*表示AIC、BIC的最小值,二者均为最小值时对应的Copula函数为最优选择。
3.2 联合重现期分析
表3 显著相关测站在不同单变量重现期下联合重现期大小
Tab.3
| 序列 | 测站组合 | 重现期 | |||
|---|---|---|---|---|---|
| 10年 | 20年 | 50年 | 100年 | ||
| 变量独立 | 5.26 | 10.26 | 25.25 | 50.25 | |
| (Q, s) | 三水—万顷沙西 | 5.71 | 10.79 | 25.86 | 50.89 |
| 三水—横门 | 5.89 | 11.03 | 26.16 | 51.22 | |
| 马口—灯笼山 | 5.78 | 11.30 | 27.82 | 55.30 | |
| (S, q) | 三水—横门 | 5.54 | 10.56 | 25.57 | 50.58 |
| 马口—横门 | 6.07 | 11.58 | 27.73 | 54.19 | |
| 马口—灯笼山 | 6.00 | 11.44 | 27.43 | 53.66 | |
显著相关测站的联合重现期均远远小于给定的单变量重现期(10、20、50、100年),相较于单变量重现期,联合重现期约减少了50%,说明在多变量因素共同作用下的洪水发生概率将远大于单一变量作用下的洪水发生概率。对比分析变量独立时与变量相关时的联合重现期,发现变量相关时的联合重现期均大于变量独立时的联合重现期,说明以变量完全独立考虑联合重现期将高估复合洪水发生概率。
对比不同序列下同一测站,发现北江控制下的横门站,在(S, q)序列下复合洪水的发生概率大于(Q, s)序列,结合图3b分析其原因可能是横门站北江径流下风暴增水极值与径流相关性随时间呈显著上升趋势。对于灯笼山站,在(Q, s)序列下复合洪水的10年/20年一遇的发生概率大于(S, q)序列,但随着重现期的增大,(S, q)序列下洪水的发生概率反超(Q, s)序列,分析其原因可能是灯笼山站在短时间内获得较高量级的马口径流量,洪水发生概率高,但由于(S, q)序列下相关系数M-K趋势显著,测站主导因子便逐渐转为风暴增水极值,所以(S, q)序列下洪灾概率升高;对比同一序列下的各测站,(Q, s)序列下联合重现期最小值出现在万顷沙西站,为5.71年,(S, q)序列下联合重现期最小值出现在北江径流控制的横门站,为5.54年,在所有测站中风险最大。
对多变量的共同作用进行合理的分析,全面考虑估算复合洪水发生概率对洪水防护有着重要作用,绘制(Q, s)序列下显著相关测站在变量相关时联合分布下不同重现期等值线,结果如图6所示。
图6

图6
(Q, s)序列显著相关测站组合中不同联合重现期等值线图
Fig.6
Contour map of different return periods of stations with significant correlation in (Q, s) series
由图6可知,对于不同的测站,其联合重现期等值线的分布趋势一致,相比横轴,不同年份的等值线在纵轴分布更为紧密,说明万顷沙西站、横门站和灯笼山站的复合洪水重现期对径流变化不敏感,而对风暴增水变化较为敏感,微小水位变化都可能引起重现期的改变,分析其原因是这3个测站均位于入海口附近,更容易受到海上风暴潮的影响,因此应该加强针对风暴潮的防护工作。其中灯笼山站重现期内流量显著大于其余2个测站,前者约为后两者的3倍,原因是西江的平均流量要远超北江。万顷沙西站与横门站重现期的径流区间相同,但风暴增水区间最大值前者显著高于后者。通常对于某一确定的联合重现期,其变量最可能达到的值为联合概率密度最大时对应的值[25],在联合重现期较小时(如5、10、20年),万顷沙西站风暴增水设计值与其他2个站点相差不大。
4 讨论与结论
在人类活动与全球气候变暖的影响下,三角洲河网区将受到河道径流与风暴增水双重作用,这种双变量复合洪水的发生概率将远超单一变量引起的洪水发生概率,给沿海城市群带来严重的人员伤亡与经济损失。本文利用1962—2017年珠江三角洲逐时风暴增水和日径流流量数据,组成年径流极值主导序列与年风暴增水极值主导序列,计算两序列下各选定测站的Spearman相关系数,通过选择合适的Copula函数,得到显著相关测站的联合重现期大小,主要结论如下:
(1) 北江与西江流经的测站发生的复合洪水分别由径流极值与风暴增水极值主导。(Q, s)序列下,北江流经的三沙口站、南沙站、万顷沙西站、横门站的相关系数大于(S, q)序列下对应测站的相关系数,说明这些测站需要关注极端径流事件的发生;(S, q)序列下,西江流经的横门站、灯笼山站、黄金站、西炮台站的相关系数大于(Q, s)序列下对应测站的相关系数,说明这些测站需要关注极端风暴增水事件的发生,其中(S, q)序列中西江径流控制下的横门站相关系数最高,为0.42,且显著相关。这是因为北江与西江存在流量差异,(Q, s)序列中,年际量级差异小的北江径流极值与对应风暴增水的趋势更符合,而(S, q)序列中,由于风暴增水取年极值,此时量级更大的西江径流趋势与其更符合。
(2) 在滑动窗口为25年时,由M-K趋势可知,除黄金站和西炮台站以(Q, s)序列趋势为主外,其余测站均为(S, q)序列趋势更强,说明在1961—2017年,黄金站与西炮台站复合洪水逐渐以径流极值为主导,其余测站的复合洪水将逐渐以风暴增水极值为主导。对于(Q, s)序列下显著相关的测站,致灾因子相关性随时间呈周期性波动变化,万顷沙西站与横门站周期为23年,灯笼山站周期为20年。在季节性变化中,相较于(S, q),(Q, s)序列下致灾因子相关性以洪季占优,不同测站间洪枯季相关系数的差值在空间分布上差异较大,最大差值发生在北江流经的横门站,为0.35,最小差值在黄金站,为0.09。
(3) 双变量下的洪水联合重现期比给定的单变量重现期缩短50%,万顷沙西站和横门站分别为(Q, s)与(S, q)序列下显著相关测站中联合重现期最小的测站,复合洪水发生可能性较大,在给定单变量为10年一遇的概率下,联合重现期分别为5.71年和5.54年。两变量相关时的联合重现期略大于假设两变量完全独立时的联合重现期,(S, q)序列下西江流经的横门站在单变量10年一遇时的联合重现期为6.07年,相比变量独立时的联合重现期增幅最大,为15%,说明仅通过单变量或者假设变量完全独立,从而计算洪水发生概率的方式存在着低估或高估的情况,需要考虑变量的相关性。
本文揭示了在珠江三角洲西北江河网区,以单变量重现期作为洪水标准而低估洪水发生概率这一不合理之处,分析得到了各测站处引发复合洪水的主导致灾因子及变化趋势,并量化了其联合重现期,能够为当地复合洪涝灾害提供新的防范角度。但还存在一些不足之处,如本文采用八大口门附近共7个测站进行分析,在数据的选取上,局限于现有的历史数据,无法根据气候变化来对复合洪水进行预测,未来可结合数学模型与气象指标细化致灾因子对复合洪水的贡献度,进一步明确其物理机制。
参考文献
沿海地区复合洪水危险性研究进展
[J].
A review of compound flood hazard research in coastal areas
Compounding effects of sea level rise and fluvial flooding
[J].
DOI:10.1073/pnas.1620325114
PMID:28847932
[本文引用: 4]

Sea level rise (SLR), a well-documented and urgent aspect of anthropogenic global warming, threatens population and assets located in low-lying coastal regions all around the world. Common flood hazard assessment practices typically account for one driver at a time (e.g., either fluvial flooding only or ocean flooding only), whereas coastal cities vulnerable to SLR are at risk for flooding from multiple drivers (e.g., extreme coastal high tide, storm surge, and river flow). Here, we propose a bivariate flood hazard assessment approach that accounts for compound flooding from river flow and coastal water level, and we show that a univariate approach may not appropriately characterize the flood hazard if there are compounding effects. Using copulas and bivariate dependence analysis, we also quantify the increases in failure probabilities for 2030 and 2050 caused by SLR under representative concentration pathways 4.5 and 8.5. Additionally, the increase in failure probability is shown to be strongly affected by compounding effects. The proposed failure probability method offers an innovative tool for assessing compounding flood hazards in a warming climate.
Estimating the probability of compound floods in estuarine regions
[J].
DOI:10.5194/hess-25-2821-2021
URL
[本文引用: 1]
. The quantification of flood risk in estuarine regions relies on accurate estimation of flood probability, which is often challenging due to the rareness of hazardous flood events and their multi-causal (or “compound”) nature. Failure to consider the compounding nature of estuarine floods can lead to significant underestimation of flood risk in these regions. This study provides a comparative review of alternative approaches for estuarine flood estimation – namely, traditional univariate flood frequency analysis applied to both observed historical data and simulated data, as well as multivariate frequency analysis applied to flood events. Three specific implementations of the above approaches are evaluated on a case study – the estuarine portion of Swan River in Western Australia – highlighting the advantages and disadvantages of each approach. The theoretical understanding of the three approaches, combined with findings from the case study, enable the generation of guidance on method selection for estuarine flood probability estimation, recognizing issues such as data availability, the complexity of the application/analysis process, the location of interest within the estuarine region, the computational demands, and whether or not future conditions need to be assessed.
Dependence between sea surge, river flow and precipitation in south and west Britain
[J].
DOI:10.5194/hess-8-973-2004
URL
[本文引用: 1]
. Estuaries around Great Britain may be at heightened risk of flooding because of the simultaneous occurrence of extreme sea surge and river flow, both of which may be caused by mid-latitude cyclones. A measure especially suited for extremes was employed to estimate dependence between river flow and sea surge. To assist in the interpretation of why flow-surge dependence occurs in some areas and not in others, the dependence between precipitation and surge and between precipitation and river flow was also studied. Case studies of the meteorological situations leading to high surges and/or river flows were also carried out. The present study concerns catchments draining to the south and west coasts of Great Britain. Statistically significant dependence between river flow and daily maximum sea surge may be found at catchments spread along most of this coastline. However, higher dependence is generally found in catchments in hilly areas with a southerly to westerly aspect. Here, precipitation in south-westerly airflow, which is generally the quadrant of prevailing winds, will be enhanced orographically as the first higher ground is encountered. The sloping catchments may respond quickly to the abundant rainfall and the flow peak may arrive in the estuary on the same day as a large sea surge is produced by the winds and low atmospheric pressure associated with the cyclone. There are three regions where flow-surge dependence is strong: the western part of the English south coast, southern Wales and around the Solway Firth. To reduce the influence of tide-surge interaction on the dependence analysis, the dependence between river flow and daily maximum surge occurring at high tide was estimated. The general pattern of areas with higher dependence is similar to that using the daily maximum surge. The dependence between river flow and daily maximum sea surge is often strongest when surge and flow occur on the same day. The west coast from Wales and northwards has slightly stronger flow-surge dependence in summer than in winter, whereas dependence is stronger in winter than in summer for the southern part of the study area. Keywords: : Britain, dependence, sea surge, river flow, precipitation, mid-latitude cyclone, seasonality, time lag\n
The co-incidence of storm surges and extreme discharges within the Rhine-Meuse Delta
[J].
Increasing risk of compound flooding from storm surge and rainfall for major US cities
[J].
DOI:10.1038/NCLIMATE2736
[本文引用: 2]
Wahl, Thomas; Meyers, Steven D.; Luther, Mark E. Univ S Florida, Coll Marine Sci, St Petersburg, FL 33701 USA. Wahl, Thomas; Bender, Jens Univ Siegen, Res Ctr Siegen, D-57076 Siegen, Germany. Jain, Shaleen Univ Maine, Climate Change Inst, Civil & Environm Engn, Orono, ME 04469 USA. Jain, Shaleen Univ Maine, Mitchell Ctr Sustainabil Solut, Orono, ME 04469 USA. Bender, Jens Univ Siegen, Res Inst Water & Environm, D-57076 Siegen, Germany.
Mapping dependence between extreme rainfall and storm surge
[J].DOI:10.1002/jgrc.v123.4 URL [本文引用: 1]
Joint probability analysis of extreme wave heights and surges along China's coasts
[J].DOI:10.1016/j.oceaneng.2018.12.010 URL [本文引用: 1]
Trends in compound flooding in northwestern Europe during 1901-2014
[J].
DOI:10.1029/2019GL084220
[本文引用: 2]
We analyze trends in compound flooding resulting from high coastal water levels (HCWLs) and peak river discharge over northwestern Europe during 1901-2014. Compound peak discharge associated with 37 stream gauges with at least 70 years of record availability near the North and Baltic Sea coasts is used. Compound flooding is assessed using a newly developed index, compound hazard ratio, that compares the severity of river flooding associated with HCWL with the at-site, T-year (a flood with 1/T chance of being exceeded in any given year) fluvial peak discharge. Our findings suggest a spatially coherent pattern in the dependence between HCWL and river peaks and in compound flood magnitudes and frequency. For higher return levels, we find upward trends in compound hazard ratio frequency at midlatitudes (gauges from 47 degrees N to 60 degrees N) and downward trends along the high latitude (>60 degrees N) regions of northwestern Europe. Plain Language Summary Compound floods in delta areas, that is, the co-occurrence of high coastal water levels (HCWLs) and high river discharge, are a particular challenge for disaster management. Such events are caused by two distinct mechanisms: (1) HCWLs may affect river flows and water levels by backwater effects or by reversing the seaward flow of rivers, particularly in regions with elevation less than 10 m in northwestern Europe. (2) The correlation between HCWL and river flow peaks may also stem from a common meteorological driver. Severe storm periods may be associated with high winds leading to storm surges, and at the same time with high precipitation followed by inland flooding. Understanding the historical trends in compound flooding, owing to changes in relative sea levels, in river flooding and in the dependence between these two drivers, is essential for projecting future changes and disaster management. The risk assessment frameworks are often limited to assessing flood risk from a single driver only. We present a new approach to assess compound flood severity resulting from extreme coastal water level and peak river discharge. We find upward trends in compound flooding for midlatitude regions and downward trends for high latitudes in northwestern Europe.
Measuring compound flood potential from river discharge and storm surge extremes at the global scale
[J].
中国沿海地区雨潮复合灾害联合分布及危险性研究
[J].
DOI:10.18306/dlkxjz.2022.10.007
[本文引用: 1]
沿海地区极易受到极端降雨和高潮位引发的复合洪涝灾害影响。研究风暴增水和累积降雨同时发生的概率,设计雨潮联合分布函数,对提升沿海城市防洪除涝应对措施的有效性、减少城市复合洪涝灾害造成的损失具有重要意义。论文以1979—2014年中国沿海逐日最大风暴增水和邻近雨量站日累积降雨数据作为统计样本,采用Copula函数构建雨潮联合概率模型,并利用Kolmogorov-Smirnov检验、赤池信息准则、贝叶斯信息准则评价雨潮联合分布拟合优度,优选中国沿海雨潮联合概率分布函数模型。基于此模型,定量化设计中国沿海雨潮复合灾害情景。结果表明:在空间分布上,中国沿海雨潮复合灾害频次呈现明显的“两头多中间少”格局,其中,广东西部沿海、福建北部、浙江南部、山东及辽宁沿海频次相对较高;在50年一遇联合重现期下,北部湾、海南岛北部、浙江沿海、渤海湾部分沿海表现为极端降雨和较高的风暴增水,雨潮遭遇的复合灾害事件十分值得关注。研究结果在一定程度上揭示了中国沿海地区雨潮复合灾害的时空变化规律,并为复合灾害情景预测提供了定量化评估方案。
Joint distribution and risk of the compound disaster caused by rainfall and storm surge across Chinese coastal region
DOI:10.18306/dlkxjz.2022.10.007
[本文引用: 1]
Coastal regions are extremely vulnerable to compound floods caused by extreme rainfall and strong storm surge. To improve the effectiveness of flood control measures in Chinese coastal cities and reduce the losses caused by urban compound flooding, it is important to analyze the joint probability of occurrence of extreme rainfall and strong storm surge and design the joint distribution function of daily storm surge and cumulative rainfall. In this study, we employed the Copula function to fit the joint probability distribution of storm surge and cumulative rainfall from 1979 to 2014. Then we used the Kolmogorov-Smirnov (K-S), Akaike Information Criteria (AIC), and Bayesian Information Criteria (BIC) statistical methods to obtain the optimal Copula function between storm surge and cumulative rainfall at each gauge alone the coast of China. Finally, based on the Copula method, we assessed the design value of compound scenarios of storm surge and rainfall in coastal China. The results indicate that the northern and southern parts of Chinese eastern coast have high frequency and the middle part has low frequency of compound disasters of strong storm surge and extreme rainfall. Western Guangdong, northern Fujian, southern Zhejiang, Shandong, and Liaoning provinces have a high frequency of compound disasters. Under the 50-year return period, the Beibu Gulf, northern Hainan Island, the coast of Zhejiang Province, and parts of the Bohai Bay have extreme rainfall and high storm surge. This study shows the temporal and spatial distribution of compound disasters of storm surge and rainfall in coastal China, and provides a framework for compound disaster scenario prediction.
Compound flood potential from storm surge and heavy precipitation in coastal China: Dependence, drivers, and impacts
[J].
DOI:10.5194/hess-25-4403-2021
URL
[本文引用: 2]
. The interaction between storm surge and concurrent precipitation is poorly understood in many coastal regions. This paper investigates the potential compound effects from these two flooding drivers along the coast of China for the first time by using the most comprehensive records of storm surge and precipitation. Statistically significant dependence between flooding drivers exists at the majority of locations that are analysed, but the strength of the correlation varies spatially and temporally and depending on how extreme events are defined. In general, we find higher dependence at the south-eastern tide gauges (TGs) (latitude < 30∘ N) compared to the northern TGs. Seasonal variations in the dependence are also evident. Overall there are more sites with significant dependence in the tropical cyclone (TC) season, especially in the summer. Accounting for past sea level rise further increases the dependence between flooding drivers, and future sea level rise will hence likely lead to an increase in the frequency of compound events. We also find notable differences in the meteorological patterns associated with events where both drivers are extreme versus events where only one driver is extreme. Events with both extreme drivers at south-eastern TG sites are caused by low-pressure systems with similar characteristics across locations, including high precipitable water content (PWC) and strong winds that generate high storm surge. Based on historical disaster damages records of Hong Kong, events with both extreme drivers account for the vast majority of damages and casualties, compared to univariate flooding events, where only one flooding driver occurred. Given the large coastal population and low capacity of drainage systems in many Chinese urban coastal areas, these findings highlight the necessity to incorporate compound flooding and its potential changes in a warming climate into risk assessments, urban planning, and the design of coastal infrastructure and flood defences.
Joint risk of rainfall and storm surges during typhoons in a coastal city of Haidian Island, China
[J].
气候变化背景下中国风暴潮灾害风险及适应对策研究进展
[J].
DOI:10.18306/dlkxjz.2016.11.011
[本文引用: 2]
风暴潮是沿海地区在强烈的大气扰动条件下产生的异常增水现象,并受海平面上升等因素的影响。中国风暴潮灾害频繁,其中尤以东南沿海地区发生频率较高,灾害损失严重。本文从风暴潮灾害的危险性、承灾体的易损性、综合风险区划3个方面系统总结风暴潮灾害的研究进展及存在的主要问题;并以风暴潮灾情特征及风险评估为基础,探讨气候变化对风暴潮灾害风险的影响及其适应对策。气候变化引起的海平面上升将影响风暴潮的趋势、周期及风险区域,因而亟待开展结合海平面上升等因素的综合风险评估。充分考虑气候变化背景下沿海地区自然条件变化及社会经济发展状况,注重短期与长期相结合,完善风险评估体系。为适度、有序的适应气候变化下风暴潮灾害风险,中国在应急预警机制、工程防御及政策法规等适应能力建设方面不断完善,以提高风暴潮灾害的防灾减灾能力。
A review of storm surge disaster risk research and adaptation in China under climate change
DOI:10.18306/dlkxjz.2016.11.011
[本文引用: 2]
Storm surges are a phenomenon of abnormal water-level rises under the influence of strong atmospheric turbulence in coastal areas and are effected by many factors, such as sea-level rise. China has seen frequent storm surges, especially in the southeastern coastal areas where their frequency is high and disaster losses are serious. This article systematically summarized the progress and main problems of storm surge research in China with regard to the hazard, vulnerability, and risk regionalization. Based on the characteristics and risk assessment of storm surges, the impact of climate change and adaptation strategies were further investigated. Especially in the context of climate change, future trend, recurrence periods, and high risk areas of storm surges would be greatly affected by sea-level rise. Thereby, a comprehensive risk assessment incorporating factors such as sea-level rise is urgently needed. Moreover, the changes in natural conditions and socioeconomic development in the coastal areas under global climate change should be taken into account to improve risk assessment with the combination of short-term and long-term views. In order to adapt to the risk of storm surge disasters under climate change, China has continuously improved the capacity building for emergency preparedness, structural defense, and policies and regulations to improve the ability of disaster prevention and mitigation.
Flood frequency analysis for alterations of extreme maximum water levels in the Pearl River Delta
[J].DOI:10.1016/j.oceaneng.2016.11.013 URL [本文引用: 1]
珠江河口风暴潮对径流的敏感性研究: 以台风“山竹”为例
[J].
Effect of runoff on storm surge in Pearl River estuary
The coupling effect of flood discharge and storm surge on extreme flood stages: A case study in the Pearl River Delta, South China
[J].
Classical tidal harmonic analysis including error estimates in MATLAB using T_TIDE
[J].DOI:10.1016/S0098-3004(02)00013-4 URL [本文引用: 1]
Monte Carlo experiments on the effect of serial correlation on the Mann-Kendall test of trend
[J].DOI:10.1127/metz/4/1992/82 URL [本文引用: 1]
Copula函数在水文水资源中的研究进展与述评
[J].
Application of Copula functions in hydrology and water resources: A state-of-the-art review
The meta-elliptical distributions with given marginals
[J].
A class of bivariate distributions
[J].DOI:10.1080/01621459.1965.10480807 URL [本文引用: 1]
Bivariate flood frequency analysis using Copulas
[J].
