

植被物候是全球气候变化的敏感指示因子,区域以及全球尺度的植被返青期、衰落期的时空变化及其对气候因子的响应已经得到广泛研究[1⇓⇓-4]。最近的研究表明,植被的固碳量更多地取决于夏季的光合作用峰值[5-6]。夏季峰值由生长季峰值(peak of growing season,POS)和生长期最大值(maximum vegetation growth,NDVImax)共同表征。POS是植被生长旺盛期重要的时间节点,可以表征植被生长期最大值的时间[7⇓-9],影响总初级生产力,其变化被认为是植被对环境水热条件的适应[10-11]。NDVImax在一定程度上反映冠层光合作用的最大潜力,影响生态系统的碳吸收[12-13],在解释森林的碳积累方面表现出更大的潜力[6,14-15]。
气候变化和大气成分影响着植物生长,POS、NDVImax对气候变化和不同大气成分响应敏感[10],并且不同区域的气候对POS、NDVImax的影响具有空间异质性。已有研究表明,植被的POS、NDVImax受到季前气候因子和大气成分的影响,其中:中国和美国陆地生态系统中温度对POS的影响最大,其次是辐射和降水;美国陆地生态系统中降水对NDVImax的影响最大(31.7%),温度、二氧化碳和氮沉降影响分别占16.4%、13.7%和10.4%[16-17]。不同地区大气成分中PM2.5含量存在差别[18-19];大气污染可以直接影响植被生长,影响植被绿度,增加总初级生产力[20-21];大气污染也可通过改变气候因子间接影响植被物候,降低农业生产力[22⇓⇓⇓-26]。PM2.5会使环境能见度降低[27],气溶胶的直接和间接辐射效应产生的辐射强迫影响辐射、温度[28],气溶胶间接效应同样会引起降水的变化[25,29]。黑碳(PM2.5的主要成分之一)能够吸收太阳辐射,降低冰雪的地表反照率,并通过影响温度和降水降低农业生产力[30⇓-32]。
京津冀地区地貌类型丰富,具有明显的季节特征,不同类型的植被物候对气象因子的响应关系存在差别。以往的研究多探究单一作物(夏玉米或者小麦)物候、植被覆盖、NDVI和初级生产力的时空变化及其对气候变化的响应,对植被生长季峰值和生长期最大值的研究较少[33⇓⇓-36];此前大多数研究旨在探究植被物候与温度、降水和辐射等气象因子的响应机制。然而京津冀地区多种污染物大量排放加之山脉阻隔导致污染物不易扩散,进而使得该地区一度大气污染超标[37];大气污染通过直接或间接的方式影响植被生长,因此,大气污染因素不容忽视,但目前对京津冀地区植被生长峰值的时空分布及其响应机制的探究尚不明确。为明确京津冀不同区域植被物候的时空演变格局,深入分析PM2.5对不同地区夏季植被生长峰值产生的不同影响,本文利用GIMMS NDVI 3g长时序数据、气象数据和PM2.5数据进行研究,试图探明以下问题:① POS、NDVImax的时空变化特征;② PM2.5对气候因子的影响;③ PM2.5对POS、NDVImax与气候因子响应机制的影响;④ PM2.5对POS、NDVImax的直接影响。研究结果可为大气污染对植被物候影响的研究工作提供一定的借鉴。
1 研究区域、数据和方法
1.1 研究区域概况
京津冀地区地貌复杂多样,根据1∶400万中国数字地貌数据集[38]可知(图1a),该地区多台地、山地、丘陵、平原。地处中纬度亚欧大陆东岸,属温带半干旱半湿润大陆性季风气候,春季干旱多风,夏季炎热多雨;平均气温从东南到西北逐渐降低,降水季节与地域分布不均,水资源严重不足。复杂的地貌、多样的土壤类型和复杂的气候条件使得京津冀地区植物种类繁多,本文参照2001—2015年空间分辨率为500 m的土地覆盖产品(MCD12Q1)(
图1
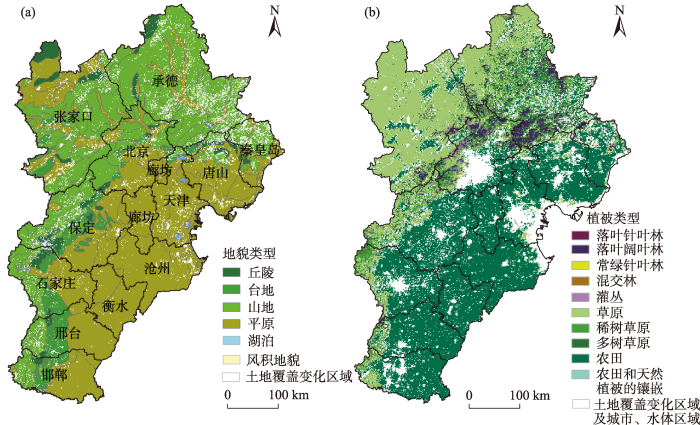
图1
京津冀地区地貌和植被类型的空间分布[38]
Fig.1
Spatial distribution of landforms and vegetation types in the Beijing-Tianjin-Hebei region
1.2 数据来源
1.2.1 气象数据
1.2.2 NDVI数据
本文采用最新版本的GIMMS NDVI数据集进行分析,该数据集是由GIMMS生产的第三代NDVI数据集(NDVI3g,version 1数据集)(
1.2.3 PM2.5数据
1.3 生长季峰值、生长期最大值的计算方法
式中:
一年24幅NDVI影像,一个像元一年则有24个NDVI值。y代表NDVI值,x为对应的日期,据此构造二维数组,即(x0, y0), (x1, y1) … (x23, y23)。然后根据一系列三次多项式Si估计相邻两点(xi, yi)和(xi+1, yi+1) 之间的NDVI值。
式中:Si(x)是日期为x时插值得到的NDVI值;ai、bi、ci为系数;
1.4 研究方法
1.4.1 数据插值方法
双线性插值方法的核心思想是在水平和垂直2个方向(x和y)上分别进行线性插值,充分利用四周存在的4个真实像素进行目标像素的确定,首先在x方向上插值,然后在y方向上利用x轴2个插值结果进行插值得到最终结果。此方法计算量大但不会出现灰度不连续的问题,插值效果优于简单的最邻近内插法,加之运行速度快于双三次插值,得到普遍应用[49]。软件ENVI 5.3中进行重采样得到分辨率降低的遥感影像时,通常使用最邻近方法和像元聚合的方法,其中像元聚合采用对输出像元值有贡献的所有像元平均值来进行采样。本文利用双线性插值方法将气象数据、利用像元聚合方法将PM2.5数据重采样到(1/12)°,从而实现研究使用的数据具有相同的空间分辨率。
1.4.2 趋势分析
式中:
式中:T=
1.4.3 偏相关分析
式中:rxy(z) 表示控制变量z的作用后,变量x、y的偏相关系数:rxy、rxz、ryz分别为变量x与y、x与z及y与z之间的相关系数。
研究中控制降水和PM2.5两个变量,计算POS或NDVImax之前0~n个月的POS或NDVImax与平均气温的偏相关系数,季前气温被定义为偏相关系数最大的时间到多年平均POS时段的平均气温,最大时间段n为1月到POS多年平均值之前的时间范围。如POS或NDVImax发生在7月,POS或NDVImax与5—7月的平均气温偏相关系数的绝对值最大,则季前气温的长度为2;季前降水和PM2.5以同样的方法得到。
1.4.4 线性回归分析
式中:Y代表PM2.5数值,X为温度、降水或辐射数据;
2 结果与分析
2.1 生长季峰值、生长期最大值的时空分布
2001—2015年京津冀地区的POS平均值分布较分散,具有明显的空间差异。88.8%的像元数值在180~240 d之间,较早的POS主要分布在NDVImax值较大的植被覆盖区域,包含了燕山和部分太行山区域,而东南部平原(沧州市和衡水市) POS较晚 (图2a)。南部平原POS的标准差(SD) 空间差异比较明显(图2b)。NDVImax平均值主要分布在0.3~1.0之间,其中0.7~0.8的频数最高,占总像元的42.6%。NDVImax的低值分布在沿海地区、张家口市以及其他城市的中心地区 (图2c)。NDVImax的高值区域主要分布在承德市和北京市西北部地区(燕山和太行山余脉),该区域的NDVImax的标准差(SD) 也明显较低(0.01~0.03)。高SD区域(0.06~0.07)主要分布在张家口坝上地区、东部和南部平原区(图2d)。
图2
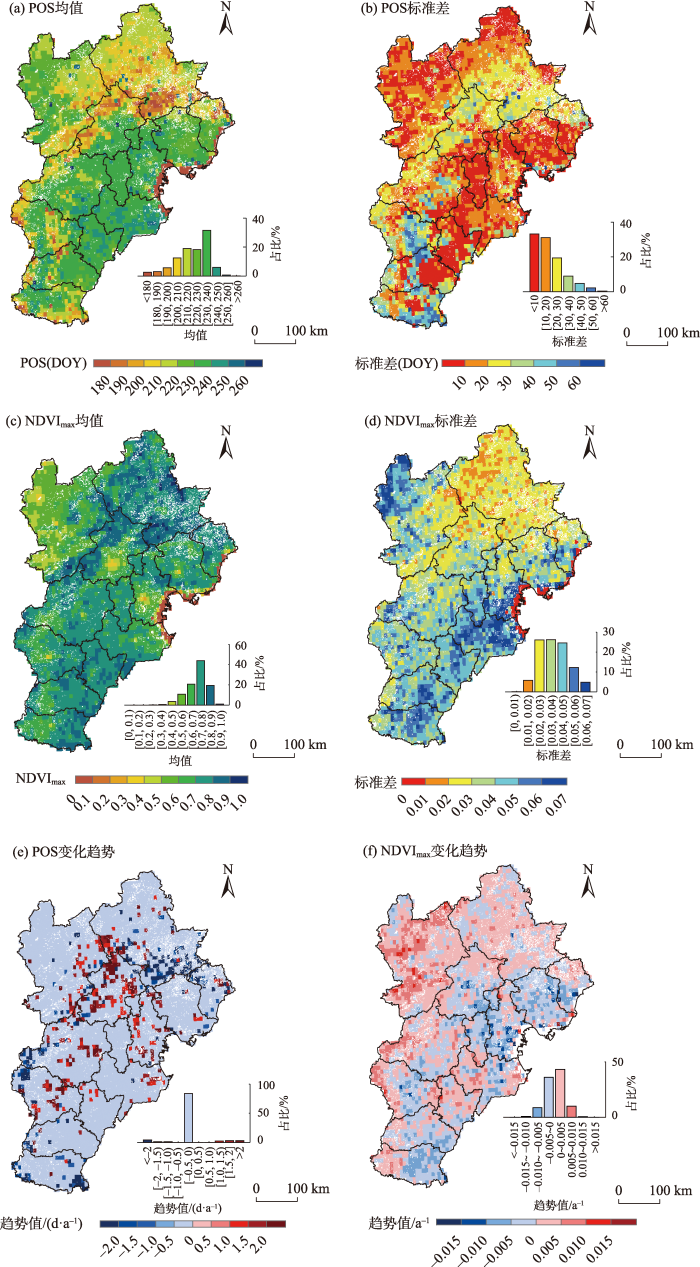
图2
利用2001—2015年NDVI3g数据集计算的POS和NDVImax均值、SD及其趋势的空间分布
注:DOY为序日。
Fig.2
Spatial distribution of mean, SD and trend values of POS and NDVImax calculated using NDVI3g dataset from 2001 to 2015
2.2 PM2.5对气象因子的影响
PM2.5对春、夏季降水影响的斜率分别为-0.9~1.2、-3.0~2.5,表明PM2.5浓度每变化1 μg/m3,不同区域在不同季节会发生不同程度的降水量的变化。正值集中在中东部平原,负值集中在燕山和太行山区(P<0.1)(图3a、3b),负值表示PM2.5增加会抑制降水,正值表示促进降水。
图3
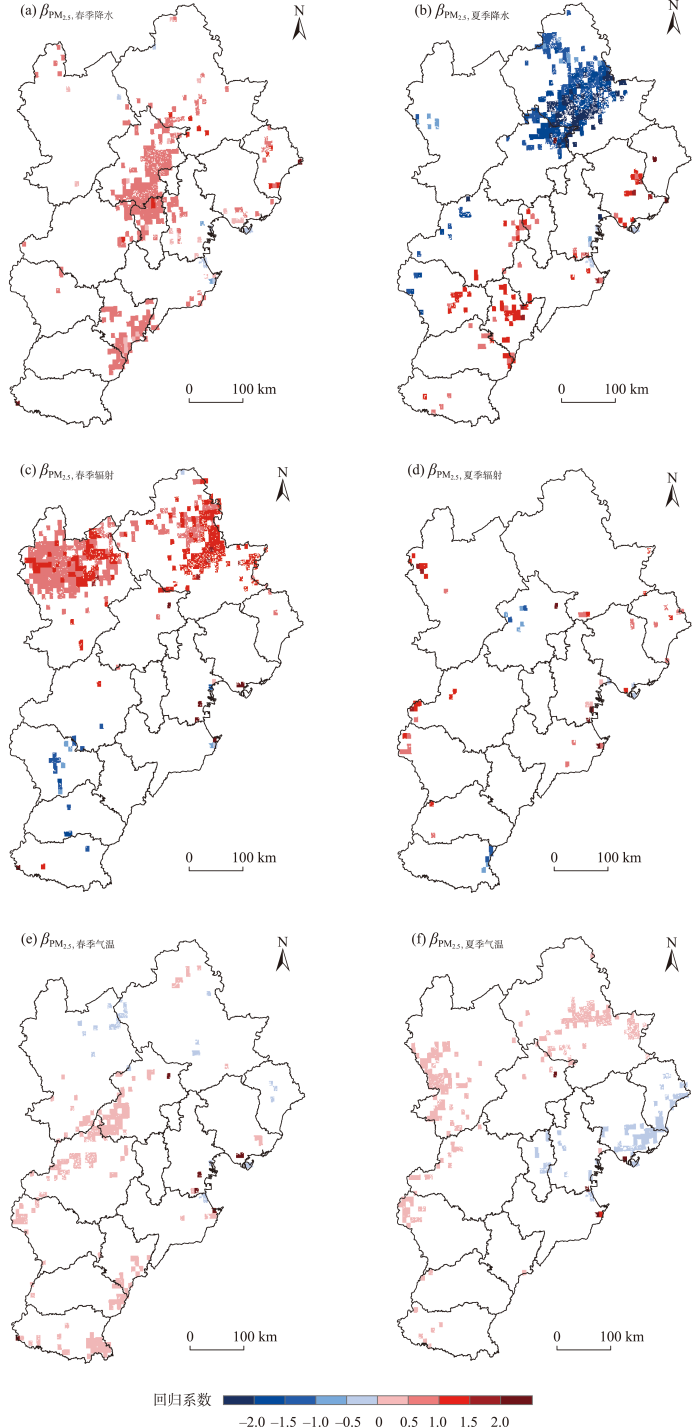
图3
PM2.5与气象因子的回归系数分布(P<0.1)
Fig.3
Distribution of regression coefficients of PM2.5 and meteorological factors (P<0.1)
PM2.5对春季辐射显著影响区域多于夏季,斜率在-1.7~1.5之间,R2为0.2~1.0(P<0.1)。PM2.5每增加1个单位浓度,使得向下的短波辐射值增加和减少的区域较分散,辐射量减少数值较大的区域基本分布在平原区(图3c、3d)。
PM2.5对春、夏季温度的影响斜率在-0.1~0.5之间,R2介于0.2~1.0(P<0.1);不同季节、不同区域的PM2.5对温度的作用和影响数值不同,对温度的负作用明显的区域基本分布在高纬度和沿海区域(图3e、3f)。
2.3 PM2.5对生长季峰值、生长期最大值与气象因子关系的影响
2.3.1 PM2.5对生长季峰值与气象因子的关系的影响
控制温度后,15.0%的区域降水与POS呈显著相关关系,负相关比例明显多于正相关(57.2%和42.8%)(图4a)。其中,正相关主要分布在北部山区和坝上地区,负相关集中分布在平原地区。控制温度和PM2.5两个变量后,显著相关区域占比为15.2%,其中负相关区域占比增加,占显著相关区域的58.2%(图4b)。京津冀地区总体呈现PM2.5使降水对POS的提前作用被低估。中东部平原(北京南部、廊坊中北部和石家庄东部)表现为显著负相关增加,北部燕山地区显著正相关减少,说明PM2.5使降水对POS提前的作用被低估;张家口北部丘陵地区正相关比例增加,说明PM2.5使降水对POS提前的作用被高估;太行山北部、中部和南部地区分别表现为正相关增加、负相关减少和正相关减少,PM2.5对太行山区降水与POS的关系的影响较复杂。
图4
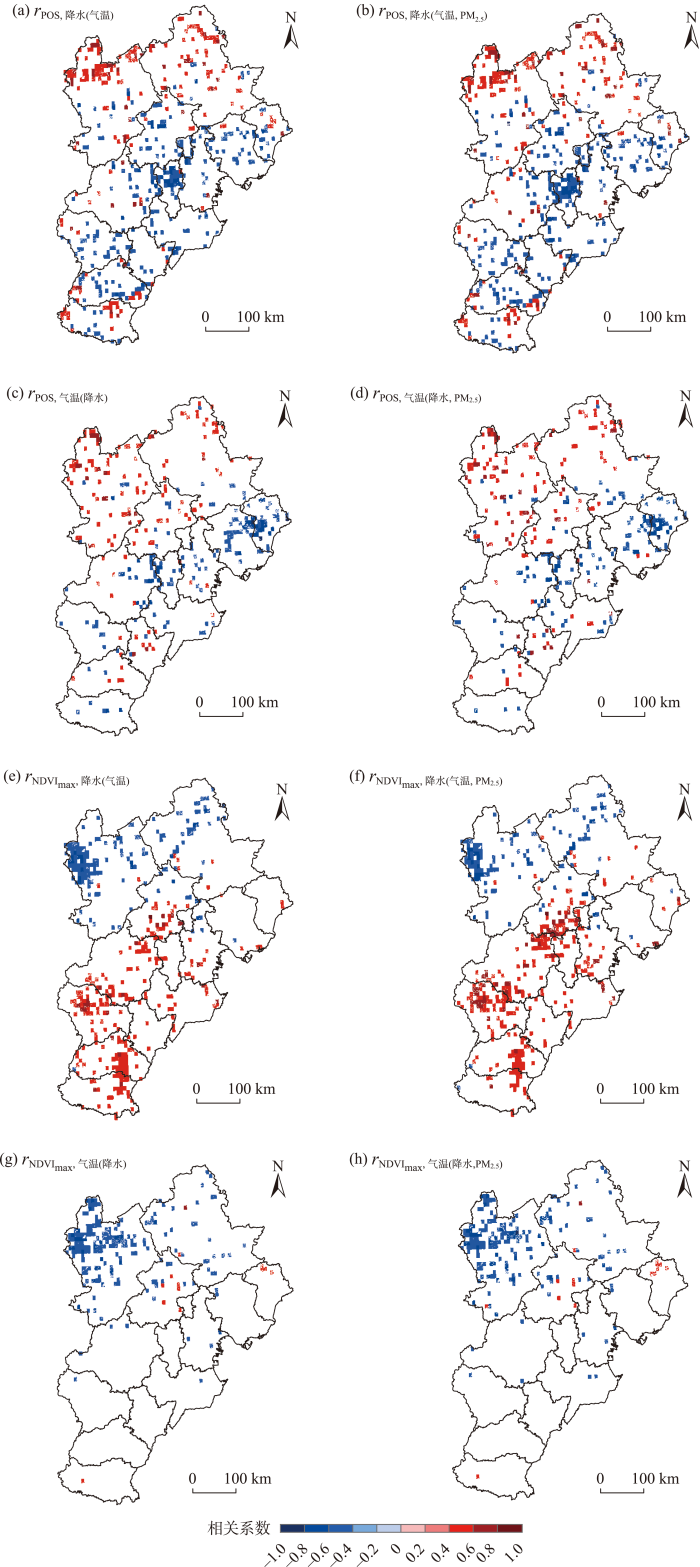
图4
POS、NDVImax与季前降水、季前温度的偏相关系数分布(P<0.1)
注:图a~d、e~h分别为POS、NDVImax与各气候因子的偏相关系数;图a、c、e、g为不控制PM2.5时的结果,图b、d、f、h为控制PM2.5时的结果。
Fig.4
Partial correlation coefficients distribution of POS, NDVImax and precipitation and temperature (P<0.1)
2.3.2 PM2.5对生长期最大值与气象因子关系的影响
控制温度后,12.2%的区域降水与NDVImax呈显著相关,其中显著负相关占显著相关区域的39.9%,表明大部分区域随着降水的增多,NDVImax数值随之增长(图4e)。去除PM2.5的影响,显著相关区域增加至12.9%,显著正相关区域也略有增加,占显著相关区域比为68.1%;显著负相关区域占比降为31.9%(图4f)。PM2.5的影响下,张家口坝上地区和燕山地区降水对NDVImax的负向作用比例更高,降水对NDVImax的抑制作用被高估;中部和沿海平原地区显著正相关区域更少,表明降水对NDVImax的促进作用被低估;南部平原东部地区表现为正相关占比更高,说明降水对NDVImax的促进作用被高估。
2.4 生长季峰值、生长期最大值与PM2.5的偏相关系数空间分布
由图5a、5b可知,研究区有13.8%的区域POS与PM2.5呈显著相关(P<0.1),且正负比例差距明显,其中只有21.1%的像元呈正相关(显著正相关占2.9%),78.9%的像元呈负相关(显著负相关占10.9%),即多数地区PM2.5增加会使POS呈提前趋势。图5c、5d显示,NDVImax与PM2.5呈显著相关的区域占研究区的11.1%(P<0.1),其中只有10.9%的像元呈负相关(显著负相关占1.2%),主要分布在邯郸市和邢台市;89.1%的区域呈现随着PM2.5的提高,NDVImax呈增加趋势(显著正相关占9.9%)。长期来看,京津冀大部分地区PM2.5浓度增加会使POS提前且能增大NDVImax。
图5
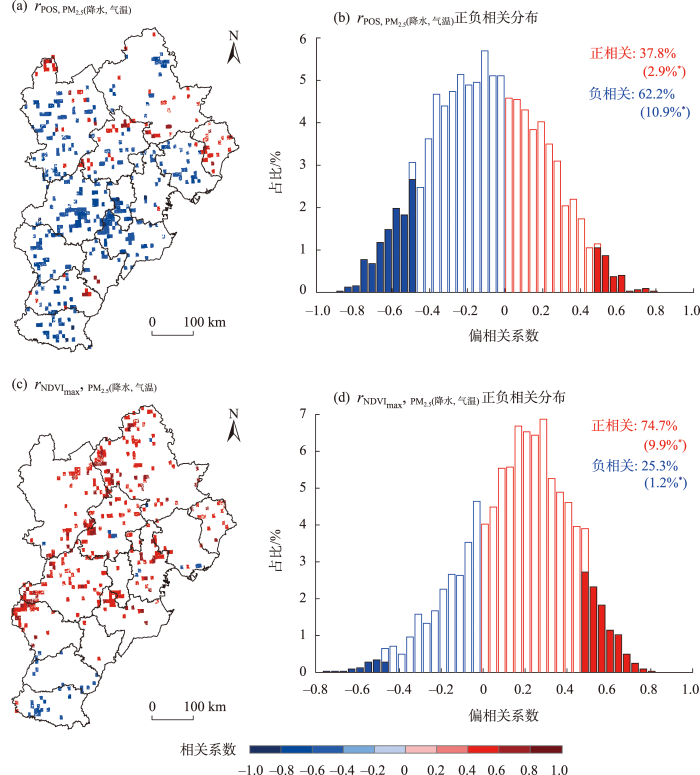
图5
POS、NDVImax与PM2.5偏相关系数空间分布(P<0.1)
注:图b、d中括号内数值为通过0.1显著性水平检验的单元占比。
Fig.5
Spatial distribution of partial correlation coefficients of POS, NDVImax and PM2.5 (P<0.1)
3 讨论
3.1 生长季峰值、生长期最大值的时空分布
京津冀地区POS、NDVImax主要发生在7、8月,植被生长期最大值(NDVImax)通常与温度最大值时间同步[11]。同时POS、NDVImax分布具有明显的空间异质性,分别与植被类型相关。落叶阔叶林和稀树草原POS更早,其次是草原和农田。NDVImax的最大值分布在落叶阔叶林(0.8~1.0)和农田(0.7~0.8),此结果与之前研究一致[17]。POS异质性是植物适应环境的结果[10],NDVImax在一定程度上可表征光合潜力,森林生态系统的光合潜力大[6,53]。草原的NDVImax的SD较大,主要原因为草本植物根系较浅,草原对降水更为敏感,降水的变化直接影响草原NDVImax[54]。
3.2 气候对大气污染的响应
PM2.5与降水在不同地区会呈现不同的正负相关关系。这一结果与以往的研究结论相符,不同环境条件形成的不同云层,不同大小的气溶胶颗粒形成的凝结核(cloud condensation nuclei,CCN)对于降水的作用效果不同,气溶胶对降水的影响有一定的临界值[57-58]。降水受云的影响,大气污染物通过改变云的特征使降水效率减小,同时改变云凝结核的数量[59]。对流云对降水的作用表现为先增加后减少,CCN增加少量时会促使小水滴合并形成降水[60];在山区随着PM2.5的增加,持续增加的饱和度过低的云凝结核会导致热通量和对流有效势能减少,造成深对流延迟,降水减少[57,61⇓-63];但平原城市地区形成的CCN会促进降水[59];同时海盐粒子作为巨CCN也可能促使降水增加[64-65]。
气溶胶通过散射和吸收太阳辐射直接影响辐射,并通过影响云的散射使短波辐射大幅减少,近地面温度下降[61-62]。本文发现PM2.5增加会造成向下的短波辐射量减少、近地面温度降低。大气中PM2.5的存在,可减少到达地面的区域平均净短波辐射11.2~14.4 W/m2,从而使近地面气温降低0.06~0.14 ℃[61]。20世纪末至21世纪初,大气层顶处的全球年平均人为气溶胶辐射强迫为-0.82 W/m2;地表人为气溶胶辐射强迫为-1.07 W/m2。人为气溶胶辐射强迫导致全球地表温度降低0.05~0.12 ℃[66-67]。不同地区不同气溶胶对温度的影响效率不同。虽然污染引起的降温可以由温室气体、城市热岛效应引起的增温效应部分抵消,但还会使温度呈增加趋势[60]。
3.3 生长季峰值、生长期最大值对气候因子的响应
降水的数量和频率等均会影响植被的光合作用,降水对植被生长的影响需要根据实地的水环境条件而定[68-69]。本文发现,季前降水使POS出现显著提前或者延后(58.2%、41.8%),NDVImax显著增大或减小(68.1%、31.9%),降水对POS、NDVImax的影响并非线性。同时张家口北部和燕山地区降水与POS、NDVImax呈正相关,平原大部分地区呈负相关,可能原因是2000年代京津冀地区春季干旱频率仍显著扩大,集中在冀东北和南部地区[70];在较干旱地区,水为植被生长的限制因素,降水能增加土壤水分供给,提高土壤中营养物质的可用性,增加植被的养分含量[71],促进植被生长;并且降水频率高会使晴空少有,一定程度上降低白天的太阳辐射、增加夜间的长波辐射,进而使白天温度更低、夜间温度更高,夜间温度增加对夏季植被绿化具有更强的作用[68]。燕山南麓降水增加,可能会使土壤水分过多,导致内部通风不畅,植被根系无法呼吸[72],影响正常生长。张家口北部地区增加的降水可能仍无法缓解干旱[73],降水增加,植被仍表现为生长缓慢。
此外,本文发现季前温度使POS提前和延后的比例(分别为49.5%和50.5%)相差1%,与NDVImax的相关关系中负相关占主导地位(占比91.8%)。足够的积温是触发植被发生物候事件的必要因素[74⇓-76],温暖的环境会促进植被的光合作用,局地或全球气候变暖使得大多数的植被开始提前生长[77-78]。季前温度与POS呈负相关区域是因为大多数植被在温度升高后,植被中酶活性提高,表现为提前生长,很可能提前到达光合作用最大值;并且温度升高可能会造成夏季干旱,植被为适应环境,POS提前;正相关区域基本分布在坝上地区,春季寒冷,夏季具有较高温度有可能会导致干旱[70],从而使得POS延后。温度升高,导致植被蒸腾作用加强,土壤中的可利用水分减少[79-80]。另外,升高的气温并非植被生长最适宜的温度,这些均对植被光合作用产生影响,造成NDVImax降低。
3.4 生长季峰值、生长期最大值对大气污染的响应
不同地区物候对降水和温度的敏感度不同,在温度、水分条件以及大气环境背景的交互作用中物候对气候变化的响应呈现较大的时空异质性[81]。本文中,对比去除PM2.5影响前后的降水、温度与POS的关系变化,可以发现:不同地区POS对降水和温度的变化的响应不同,平原和山区差异明显。同时,研究结果表明,绝大部分地区PM2.5的间接作用为降低NDVImax数值;气溶胶光学厚度(aerosol optical depth, AOD)的间接作用表现为使农田、森林和草原的总初级生产力降低[20]。北京南部、廊坊中北部和石家庄东部较为湿润[82-83],在去除PM2.5的影响后,降水与POS呈负相关的区域增加;这可能是因为PM2.5造成中东部平原春夏两季降水增加,短波辐射量降低,影响了光合作用,从而造成POS延后、NDVImax降低。PM2.5使山区春季短波辐射量增加,春季温度升高可能使部分地区植被提前生长;夏季温度升高,植被蒸腾作用增大,降水减少,NDVImax数值降低。这也解释了PM2.5影响下,春夏季温度的变化使得山区POS延后的比例更低,NDVImax降低的比例更高。
3.5 不确定分析
空气污染问题自20世纪70年代末开始日益突出[59],“十三五”期间大气污染防控成效显著,PM2.5浓度大幅降低[86-87]。本文研究受限于现有的遥感影像[18],采用2001—2015年的PM2.5、气象和NDVI数据进行探究,未来可进行更长时段的时空分析;影响因子未考虑人为因素(开垦和人口密度的增加等因素)对植被变化的影响。此外,获取的土地覆被类型、气象和PM2.5数据集的误差可能对植被物候的变化产生一定影响;同时,在数据处理等过程中产生的误差对数据产生的影响可能会影响研究结果。另外,本文所使用的2001—2015年GIMMS NDVI数据空间分辨率较低,未来可在时间和空间分辨率方面进行改进,并将地面监测数据和遥感数据进行结合,进一步探讨大气污染对植被物候的影响。
4 结论
本文利用GIMMS NDVI3g数据研究了2001—2015年京津冀地区的植被生长季峰值(POS)、生长期最大值(NDVImax)的时空分布及其变化趋势,探讨了大气污染物(PM2.5)影响下,POS、NDVImax对降水、温度的响应的变化,以及PM2.5对POS、NDVImax的影响。主要结论如下:
(1) 2001—2015年京津冀地区POS、NDVImax的分布具有明显的空间异质性且与植被类型相关。森林和农田NDVImax较大,草原更为敏感,NDVImax的标准差更大。张家口坝上地区、燕山和太行山区域NDVImax呈显著增加趋势,POS更为稳定。
(2) PM2.5对降水、温度的影响同样具有时空差异。对春季、夏季气候因子的影响区域不同;总体而言,PM2.5显著抑制燕山和太行山地区的降水,对高纬度和沿海区域的温度负作用显著。
(3) PM2.5对降水与POS的关系的影响主要体现在:中东部平原和北部燕山地区POS的提前作用被低估,张家口北部丘陵地区存在POS提前作用被高估的情况。PM2.5的影响使东部、南部平原、张家口坝上地区和北部燕山地区温度对POS的提前作用被高估。除南部平原部分地区,PM2.5通过影响降水使得NDVImax增大;总体表现为PM2.5通过对降水和温度的影响间接降低NDVImax。
(4) 在京津冀大部分地区,PM2.5的直接作用为使NDVImax升高,POS提前。
参考文献
Peak season plant activity shift towards spring is reflected by increasing carbon uptake by extratropical ecosystems
[J].
DOI:10.1111/gcb.14001
PMID:29271095
[本文引用: 1]

Climate change is lengthening the growing season of the Northern Hemisphere extratropical terrestrial ecosystems, but little is known regarding the timing and dynamics of the peak season of plant activity. Here, we use 34-year satellite normalized difference vegetation index (NDVI) observations and atmospheric CO concentration and δ C isotope measurements at Point Barrow (Alaska, USA, 71°N) to study the dynamics of the peak of season (POS) of plant activity. Averaged across extratropical (>23°N) non-evergreen-dominated pixels, NDVI data show that the POS has advanced by 1.2 ± 0.6 days per decade in response to the spring-ward shifts of the start (1.0 ± 0.8 days per decade) and end (1.5 ± 1.0 days per decade) of peak activity, and the earlier onset of the start of growing season (1.4 ± 0.8 days per decade), while POS maximum NDVI value increased by 7.8 ± 1.8% for 1982-2015. Similarly, the peak day of carbon uptake, based on calculations from atmospheric CO concentration and δ C data, is advancing by 2.5 ± 2.6 and 4.3 ± 2.9 days per decade, respectively. POS maximum NDVI value shows strong negative relationships (p < .01) with the earlier onset of the start of growing season and POS days. Given that the maximum solar irradiance and day length occur before the average POS day, the earlier occurrence of peak plant activity results in increased plant productivity. Both the advancing POS day and increasing POS vegetation greenness are consistent with the shifting peak productivity towards spring and the increasing annual maximum values of gross and net ecosystem productivity simulated by coupled Earth system models. Our results further indicate that the decline in autumn NDVI is contributing the most to the overall browning of the northern high latitudes (>50°N) since 2011. The spring-ward shift of peak season plant activity is expected to disrupt the synchrony of biotic interaction and exert strong biophysical feedbacks on climate by modifying the surface albedo and energy budget.© 2017 John Wiley & Sons Ltd.
Satellite detection of cumulative and lagged effects of drought on autumn leaf senescence over the Northern Hemisphere
[J].
DOI:10.1111/gcb.14627
PMID:30897264
[本文引用: 1]
Climate change has substantial influences on autumn leaf senescence, that is, the end of the growing season (EOS). Relative to the impacts of temperature and precipitation on EOS, the influence of drought is not well understood, especially considering that there are apparent cumulative and lagged effects of drought on plant growth. Here, we investigated the cumulative and lagged effects of drought (in terms of the Standardized Precipitation-Evapotranspiration Index, SPEI) on EOS derived from the normalized difference vegetation index (NDVI3g) data over the Northern Hemisphere extra-tropical ecosystems (>30°N) during 1982-2015. The cumulative effect was determined by the number of antecedent months at which SPEI showed the maximum correlation with EOS (i.e., R ) while the lag effect was determined by a month during which the maximum correlation between 1-month SPEI and EOS occurred (i.e., R ). We found cumulative effect of drought on EOS for 27.2% and lagged effect for 46.2% of the vegetated land area. For the dominant time scales where the R and R occurred, we observed 1-4 accumulated months for the cumulative effect and 2-6 lagged months for the lagged effect. At the biome level, drought had stronger impacts on EOS in grasslands, savannas, and shrubs than in forests, which may be related to the different root functional traits among vegetation types. Considering hydrological conditions, the mean values of both R and R decreased along the gradients of annual SPEI and its slope, suggesting stronger cumulative and lagged effects in drier regions as well as in areas with decreasing water availability. Furthermore, the average accumulated and lagged months tended to decline along the annual SPEI gradient but increase with increasing annual SPEI. Our results revealed that drought has strong cumulative and lagged effects on autumn phenology, and considering these effects could provide valuable information on the vegetation response to a changing climate.© 2019 John Wiley & Sons Ltd.
Asymmetric behavior of vegetation seasonal growth and the climatic cause: Evidence from long-term NDVI dataset in Northeast China
[J].
2000—2017年内蒙古荒漠草原植被物候变化及对净初级生产力的影响
[J].
DOI:10.18306/dlkxjz.2020.01.003
[本文引用: 1]
荒漠草原分布于干旱区和半干旱区,对气候变化的响应极为敏感,但目前学术界对于荒漠草原物候与生产力变化的研究仍较为薄弱。有鉴于此,论文采用2000—2017年MODIS NDVI数据和气象数据,利用通用数量化方法提取内蒙古荒漠草原植被的生长季始期(start of season, SOS)和生长季末期(end of season, EOS);基于Carnegie-Ames-Stanford Approach (CASA)模型估算了植被净初级生产力(NPP),并分析了植被物候和净初级生产力之间的关系。研究结果表明:① 2000—2017年内蒙古荒漠草原SOS呈显著提前趋势(0.88 d/a,PP>0.05),生长季长度(length of season, LOS)呈显著延长趋势(0.76 d/a)。81.53%像元的SOS与2—4月平均气温呈负相关(8.21%显著相关,PPPP2</sup>·a),有自东向西逐渐降低的区域差异;在研究时段内,春、夏季和生长季的NPP均呈不显著增加趋势,秋季NPP有不显著减少趋势;生长季降水量增加有利于生长季NPP的积累。③ 春季NPP与SOS呈不显著负相关,秋季NPP与EOS呈显著正相关。LOS的延长促进了NPP的累积,其中生长季NPP与EOS的推迟关系更为密切。研究结果揭示气候变化对内蒙古荒漠草原植被物候和生产力有显著影响,对区域生态系统管理和生态建设具有重要参考意义。
Phenological changes of desert steppe vegetation and its effect on net primary productivity in Inner Mongolia from 2000 to 2017
DOI:10.18306/dlkxjz.2020.01.003
[本文引用: 1]
<p id="C4">Desert steppe is distributed in the semiarid and arid areas and is extremely sensitive to climate change. However, limited field observations and lack of community surveys have resulted in insufficient research on the vegetation phenology and productivity of the desert steppe. Based on the normalized difference vegetation index (NDVI) data from the MODIS dataset during 2000-2017, we used a relative threshold method to extract the phenological parameters in the desert steppe of Inner Mongolia, including the start of growing season (SOS), the end of growing season (EOS), and the length of growing season (LOS). We then estimated the spatiotemporal changes in net primary productivity (NPP) of the desert steppe vegetation by the Carnegie-Ames-Stanford Approach (CASA) model. Finally, we analyzed the relationship between desert steppe productivity, phenophases, and climate variables. Our results show that: 1) during the study period, SOS advanced significantly at a rate of 0.88 d/a (<i>P</i><0.05), while EOS advanced at a rate of 0.13 d/a (non-significant). The average LOS lengthened significantly by 0.76 d/a (<i>P</i><0.05). The SOS was correlated negatively with mean temperature from February to April in 81.53% pixels (8.21% was significant) and negatively correlated with April precipitation in 60.80% pixels (6.12% was significant). The EOS showed a negative relationship with mean temperature in September in 65.16% pixels (5.03% was significant) but positively correlated with precipitation from July to September in 78.61% pixels (10.12% was significant). 2) The average annual NPP from 2000 to 2017 was 104.71gC/(m <sup>2</sup>·a) in the study area, showing regional differences with an obviously decreasing trend from east to west. Net primary productivity in spring, summer, and the growing season increased insignificantly, while NPP in autumn showed an insignificant decreasing trend. The increase of precipitation in the growing season is beneficial to the accumulation of ecosystem NPP. 3) Advance of SOS was conducive to the accumulation of spring NPP, and the delay of EOS promoted the accumulation of autumn NPP. There was a significant correlation between the LOS and NPP during the growing season (<i>P</i><0.05). This study revealed the impacts of climate change on vegetation phenology and productivity of the desert steppe in Inner Mongolia, which is significant for ecosystem management and ecological construction of the region. </p>
Understanding the role of phenology and summer physiology in controlling net ecosystem production: A multiscale comparison of satellite, PhenoCam and eddy covariance data
[J].Understanding the temporal and spatial variability (SV) of net ecosystem productivity (NEP) is critical for coupling ecosystem carbon (C) cycle and climate system. Previous studies have shown responses of NEP to changes of plant phenology, but impacts of summer physiological status on annual NEP and how this may vary across different ecosystems and spatial scales were largely unknown. Combining large regional satellite derived indices (MODIS), 676 site-year local data (FLUXDATA) covering seven vegetation types, and 57 site-year regional data (PhenoCam), we found that phenological metrics and summer physiological indicators were significantly correlated with their respective gross primary production-based estimates. The interannual variability of NEP was mostly explained by summer physiology than phenology for most ecosystems, while phenology showed a better performance than summer physiology only for grassland sites. In comparison, inconsistent results were derived from three scales when explaining the SV of NEP. Summer physiology showed more potential in interpreting the SV of NEP at large regional scale, but both physiology and the length of growing season exhibited similar performances at local scale. Observations from regional scale were not able to explain NEP, given that the green chromatic coordinate signal cannot track photosynthesis in summer with a high canopy closure. The finding highlights the important role of summer physiology in controlling the C accumulation of terrestrial ecosystems and understanding the responses of summer physiology to environmental drivers is of great significance for improving the simulation accuracy of C sequestration under the global climate change.
Long-term trend in vegetation gross primary production, phenology and their relationships inferred from the FLUXNET data
[J].
DOI:S0301-4797(19)30824-2
PMID:31202828
[本文引用: 3]
Climate-induced changes in plant phenology and physiology plays an important role in control of carbon exchange between terrestrial ecosystems and the atmosphere. Based on dataset during 1997-2014 from 41 flux tower sites (440 site-years) across the northern hemisphere, relationships between long-term trends in start of growing season (SOS), end of growing season (EOS), length of growing season (LOS), maximal gross primary production (GPP), and seasonal and annual gross primary production (GPP) were analyzed. Statistical Models of Integrated Phenology and Physiology (SMIPP) were built for predicting the long-term trends in annual GPP. Results showed that SOS advanced and EOS delayed for forest sites, while both SOS and EOS for grassland (GRA) sites delayed. Long-term trends in SOS and EOS of evergreen needle-leaf forests (ENF) sites were greater than those of deciduous broadleaf forests (DBF) sites. Seasonal and annual GPP for forest sites increased, among which long-term trend in annual GPP of ENF sites was the largest. Spring GPP of GRA sites decreased, but annual GPP increased. Strong relationships between long-term trends in phenological and physiological indicators and seasonal GPP were found. Long-term trend in GPP had the highest relationship with long-term trend in annual GPP for forest sites, but long-term trend in SOS was the most related to long-term trend in annual GPP for GRA sites. Increases in spring and autumn GPP due to a one-day advance in SOS and delay in EOS for DBF sites were greater than ENF sites. Delay in EOS resulted in more carbon sequestration than advance in SOS for forest sites, while advance in SOS significantly increased spring GPP for GRA sites. The SMIPP model driven by long-term trends in LOS and GPP had stronger explanatory power for predicting long-term trend in annual GPP than the SMIPP model driven by long-term trends in SOS, EOS, and GPP. Long-term trend in annual GPP was accurately predicted by using the SMIPP model, while long-term trend in annual GPP for GRA sites was more difficult to be captured than the forest sites. Drought and disturbance effects on phenology and physiology were major factors for model uncertainty. This study is helpful to understand changes in phenology and carbon uptake and their differences among different vegetation types and provides a potential way for predicting annual rate of change in carbon uptake through vegetation photosynthesis at a global scale.Copyright © 2019 Elsevier Ltd. All rights reserved.
Joint control of terrestrial gross primary productivity by plant phenology and physiology
[J].
DOI:10.1073/pnas.1413090112
PMID:25730847
[本文引用: 1]
Terrestrial gross primary productivity (GPP) varies greatly over time and space. A better understanding of this variability is necessary for more accurate predictions of the future climate-carbon cycle feedback. Recent studies have suggested that variability in GPP is driven by a broad range of biotic and abiotic factors operating mainly through changes in vegetation phenology and physiological processes. However, it is still unclear how plant phenology and physiology can be integrated to explain the spatiotemporal variability of terrestrial GPP. Based on analyses of eddy-covariance and satellite-derived data, we decomposed annual terrestrial GPP into the length of the CO2 uptake period (CUP) and the seasonal maximal capacity of CO2 uptake (GPPmax). The product of CUP and GPPmax explained >90% of the temporal GPP variability in most areas of North America during 2000-2010 and the spatial GPP variation among globally distributed eddy flux tower sites. It also explained GPP response to the European heatwave in 2003 (r(2) = 0.90) and GPP recovery after a fire disturbance in South Dakota (r(2) = 0.88). Additional analysis of the eddy-covariance flux data shows that the interbiome variation in annual GPP is better explained by that in GPPmax than CUP. These findings indicate that terrestrial GPP is jointly controlled by ecosystem-level plant phenology and photosynthetic capacity, and greater understanding of GPPmax and CUP responses to environmental and biological variations will, thus, improve predictions of GPP over time and space.
Dominant role of plant physiology in trend and variability of gross primary productivity in North America
[J].Annual gross primary productivity (GPP) varies considerably due to climate-induced changes in plant phenology and physiology. However, the relative importance of plant phenology and physiology on annual GPP variation is not clear. In this study, a Statistical Model of Integrated Phenology and Physiology (SMIPP) was used to evaluate the relative contributions of maximum daily GPP (GPPmax) and the start and end of growing season (GSstart and GSend) to annual GPP variability, using a regional GPP product in North America during 2000–2014 and GPP data from 24 AmeriFlux sites. Climatic sensitivity of the three indicators was assessed to investigate the climate impacts on plant phenology and physiology. The SMIPP can explain 98% of inter-annual variability of GPP over mid- and high latitudes in North America. The long-term trend and inter-annual variability of GPP are dominated by GPPmax both at the ecosystem and regional scales. During warmer spring and autumn, GSstart is advanced and GSend delayed, respectively. GPPmax responds positively to summer temperature over high latitudes (40–80°N), but negatively in mid-latitudes (25–40°N). This study demonstrates that plant physiology, rather than phenology, plays a dominant role in annual GPP variability, indicating more attention should be paid to physiological change under futher climate change.
Influence of spring and autumn phenological transitions on forest ecosystem productivity
[J].
Changes in timing of seasonal peak photosynthetic activity in northern ecosystems
[J].
DOI:10.1111/gcb.14638
PMID:30943321
[本文引用: 3]
Seasonality in photosynthetic activity is a critical component of seasonal carbon, water, and energy cycles in the Earth system. This characteristic is a consequence of plant's adaptive evolutionary processes to a given set of environmental conditions. Changing climate in northern lands (>30°N) alters the state of climatic constraints on plant growth, and therefore, changes in the seasonality and carbon accumulation are anticipated. However, how photosynthetic seasonality evolved to its current state, and what role climatic constraints and their variability played in this process and ultimately in carbon cycle is still poorly understood due to its complexity. Here, we take the "laws of minimum" as a basis and introduce a new framework where the timing (day of year) of peak photosynthetic activity (DOY ) acts as a proxy for plant's adaptive state to climatic constraints on its growth. Our analyses confirm that spatial variations in DOY reflect spatial gradients in climatic constraints as well as seasonal maximum and total productivity. We find a widespread warming-induced advance in DOY (-1.66 ± 0.30 days/decade, p < 0.001) across northern lands, indicating a spatiotemporal dynamism of climatic constraints to plant growth. We show that the observed changes in DOY are associated with an increase in total gross primary productivity through enhanced carbon assimilation early in the growing season, which leads to an earlier phase shift in land-atmosphere carbon fluxes and an increase in their amplitude. Such changes are expected to continue in the future based on our analysis of earth system model projections. Our study provides a simplified, yet realistic framework based on first principles for the complex mechanisms by which various climatic factors constrain plant growth in northern ecosystems.© 2019 John Wiley & Sons Ltd.
Drylands in the Earth system
[J].DOI:10.1126/science.1184946 PMID:20093461 [本文引用: 2]
Tracking plant physiological properties from multi-angular tower-based remote sensing
[J].
DOI:10.1007/s00442-010-1901-0
PMID:21221647
[本文引用: 1]
Imaging spectroscopy is a powerful technique for monitoring the biochemical constituents of vegetation and is critical for understanding the fluxes of carbon and water between the land surface and the atmosphere. However, spectral observations are subject to the sun-observer geometry and canopy structure which impose confounding effects on spectral estimates of leaf pigments. For instance, the sun-observer geometry influences the spectral brightness measured by the sensor. Likewise, when considering pigment distribution at the stand level scale, the pigment content observed from single view angles may not necessarily be representative of stand-level conditions as some constituents vary as a function of the degree of leaf illumination and are therefore not isotropic. As an alternative to mono-angle observations, multi-angular remote sensing can describe the anisotropy of surface reflectance and yield accurate information on canopy structure. These observations can also be used to describe the bi-directional reflectance distribution which then allows the modeling of reflectance independently of the observation geometry. In this paper, we demonstrate a method for estimating pigment contents of chlorophyll and carotenoids continuously over a year from tower-based, multi-angular spectro-radiometer observations. Estimates of chlorophyll and carotenoid content were derived at two flux-tower sites in western Canada. Pigment contents derived from inversion of a CR model (PROSAIL) compared well to those estimated using a semi-analytical approach (r(2) = 0.90 and r(2) = 0.69, P < 0.05 for both sites, respectively). Analysis of the seasonal dynamics indicated that net ecosystem productivity was strongly related to total canopy chlorophyll content at the deciduous site (r(2) = 0.70, P < 0.001), but not at the coniferous site. Similarly, spectral estimates of photosynthetic light-use efficiency showed strong seasonal patterns in the deciduous stand, but not in conifers. We conclude that multi-angular, spectral observations can play a key role in explaining seasonal dynamics of fluxes of carbon and water and provide a valuable addition to flux-tower-based networks.
Tracking forest phenology and seasonal physiology using digital repeat photography: A critical assessment
[J].DOI:10.1890/13-0652.1 URL [本文引用: 1]
Maximum carbon uptake rate dominates the interannual variability of global net ecosystem exchange
[J].
DOI:10.1111/gcb.14731
PMID:31197940
[本文引用: 1]
Terrestrial ecosystems contribute most of the interannual variability (IAV) in atmospheric carbon dioxide (CO ) concentrations, but processes driving the IAV of net ecosystem CO exchange (NEE) remain elusive. For a predictive understanding of the global C cycle, it is imperative to identify indicators associated with ecological processes that determine the IAV of NEE. Here, we decompose the annual NEE of global terrestrial ecosystems into their phenological and physiological components, namely maximum carbon uptake (MCU) and release (MCR), the carbon uptake period (CUP), and two parameters, α and β, that describe the ratio between actual versus hypothetical maximum C sink and source, respectively. Using long-term observed NEE from 66 eddy covariance sites and global products derived from FLUXNET observations, we found that the IAV of NEE is determined predominately by MCU at the global scale, which explains 48% of the IAV of NEE on average while α, CUP, β, and MCR explain 14%, 25%, 2%, and 8%, respectively. These patterns differ in water-limited ecosystems versus temperature- and radiation-limited ecosystems; 31% of the IAV of NEE is determined by the IAV of CUP in water-limited ecosystems, and 60% of the IAV of NEE is determined by the IAV of MCU in temperature- and radiation-limited ecosystems. The Lund-Potsdam-Jena (LPJ) model and the Multi-scale Synthesis and Terrestrial Model Inter-comparison Project (MsTMIP) models underestimate the contribution of MCU to the IAV of NEE by about 18% on average, and overestimate the contribution of CUP by about 25%. This study provides a new perspective on the proximate causes of the IAV of NEE, which suggest that capturing the variability of MCU is critical for modeling the IAV of NEE across most of the global land surface.© 2019 John Wiley & Sons Ltd.
Explaining inter-annual variability of gross primary productivity from plant phenology and physiology
[J].DOI:10.1016/j.agrformet.2016.06.010 URL [本文引用: 1]
Impacts of global change on peak vegetation growth and its timing in terrestrial ecosystems of the continental US
[J].
Estimating the peak of growing season (POS) of China's terrestrial ecosystems
[J].
Improved 1km resolution PM2.5 estimates across China using enhanced space-time extremely randomized trees
[J].
2000—2011年中国PM2.5时空演化特征及驱动因素解析
[J].
DOI:10.11821/dlxb201711012
[本文引用: 1]
高浓度PM<sub>2.5</sub>是形成雾霾的主要原因之一,科学识别PM<sub>2.5</sub>浓度的空间异质性与驱动因素对区域大气联动治理意义重大。研究采用2000-2011年NASA大气遥感影像反演的PM<sub>2.5</sub>数据,结合地统计、地理探测器及GIS空间分析等方法,系统分析了中国2000-2011年PM<sub>2.5</sub>浓度时空演化格局特征与其驱动因素。结果表明:① 2000-2011年中国PM<sub>2.5</sub>污染平均浓度一直保持在22.47~28.26 μg/m<sup>3</sup>区间,总体呈现先快速增加后趋于稳定的演化态势,2006年是PM<sub>2.5</sub>浓度值变化的拐点(峰值)。② 空间上PM<sub>2.5</sub>浓度整体呈现北方高于南方,东部高于西部趋势,污染浓度高值区集中分布在黄淮海平原、长三角下游平原、四川盆地与塔克拉玛干沙漠四大区域,其中京津冀地区污染最为严重。③ 污染浓度重心研究表明PM<sub>2.5</sub>重心总体呈现快速东移趋势,污染高值区持续向东移动,低值区向西移动,两者重心背向而行,表明东部雾霾污染程度在进一步加剧。④ 空间自相关分析表明PM<sub>2.5</sub>年均浓度呈现强烈的局部空间正自相关特性,PM<sub>2.5</sub>“高—高”集聚区连片分布在黄淮海平原、汾渭盆地、四川盆地及江汉平原地区,PM<sub>2.5</sub>“低—低”集聚区分布在长城以北的内蒙古、黑龙江、青藏高原、以及台湾、海南与福建等东南沿海及岛屿地区。⑤ 地理探测分析表明气候等自然因素与人类活动共同对PM<sub>2.5</sub>浓度空间变化产生巨大影响,其中自然地理区位、人口密度、汽车数量、工业烟尘、秸秆燃烧等因子是中国PM<sub>2.5</sub>浓度空间变化的主要驱动因素。
Spatio-temporal evolution and the influencing factors of PM2.5 in China between 2000 and 2011
Effects of aerosol on terrestrial gross primary productivity in Central Asia
[J].
Intermediate aerosol loading enhances photosynthetic activity of croplands
[J].
Clearing the air: A review of the effects of particulate matter air pollution on human health
[J].
DOI:10.1007/s13181-011-0203-1
PMID:22194192
[本文引用: 1]
The World Health Organization estimates that particulate matter (PM) air pollution contributes to approximately 800,000 premature deaths each year, ranking it the 13th leading cause of mortality worldwide. However, many studies show that the relationship is deeper and far more complicated than originally thought. PM is a portion of air pollution that is made up of extremely small particles and liquid droplets containing acids, organic chemicals, metals, and soil or dust particles. PM is categorized by size and continues to be the fraction of air pollution that is most reliably associated with human disease. PM is thought to contribute to cardiovascular and cerebrovascular disease by the mechanisms of systemic inflammation, direct and indirect coagulation activation, and direct translocation into systemic circulation. The data demonstrating PM's effect on the cardiovascular system are strong. Populations subjected to long-term exposure to PM have a significantly higher cardiovascular incident and mortality rate. Short-term acute exposures subtly increase the rate of cardiovascular events within days of a pollution spike. The data are not as strong for PM's effects on cerebrovascular disease, though some data and similar mechanisms suggest a lesser result with smaller amplitude. Respiratory diseases are also exacerbated by exposure to PM. PM causes respiratory morbidity and mortality by creating oxidative stress and inflammation that leads to pulmonary anatomic and physiologic remodeling. The literature shows PM causes worsening respiratory symptoms, more frequent medication use, decreased lung function, recurrent health care utilization, and increased mortality. PM exposure has been shown to have a small but significant adverse effect on cardiovascular, respiratory, and to a lesser extent, cerebrovascular disease. These consistent results are shown by multiple studies with varying populations, protocols, and regions. The data demonstrate a dose-dependent relationship between PM and human disease, and that removal from a PM-rich environment decreases the prevalence of these diseases. While further study is needed to elucidate the effects of composition, chemistry, and the PM effect on susceptible populations, the preponderance of data shows that PM exposure causes a small but significant increase in human morbidity and mortality. Most sources agree on certain "common sense" recommendations, although there are lonely limited data to support them. Indoor PM exposure can be reduced by the usage of air conditioning and particulate filters, decreasing indoor combustion for heating and cooking, and smoking cessation. Susceptible populations, such as the elderly or asthmatics, may benefit from limiting their outdoor activity during peak traffic periods or poor air quality days. These simple changes may benefit individual patients in both short-term symptomatic control and long-term cardiovascular and respiratory complications.
Air pollution and farm-level crop yields: An empirical analysis of corn and soybeans
[J].
DOI:10.1017/S1068280500008790
URL
[本文引用: 1]
While many studies have estimated the impacts of air pollution on crop yields on experimental plots, few have estimated these impacts under actual farm production conditions. This study econometrically estimates the impact of air pollution on corn and soybean yields, controlling for weather, soil quality and management practices, using farm-level data for the eastern United States. Ozone pollution was found to reduce yields for both crops. The mean elasticity of yield with respect to ozone exposure was − 0.19 for corn and − 0.54 for soybeans. The benefits of ozone standards to protect crops, measured in terms of crop revenues, range from $17 to $82 million depending on the stringency of the standard. Over 85 percent of the revenue gains are captured by three states: Maryland, North Carolina, and Virginia.
合肥市PM2.5对城市辐射和气温的影响
[J].
Effects of PM2.5 on the urban radiation and air temperature in Hefei
Impact of natural and anthropogenic aerosols on stratocumulus and precipitation in the Southeast Pacific: A regional modelling study using WRF-Chem
[J].
The impact of fine particulate matter (PM2.5) on China's agricultural production from 2001 to 2010
[J].DOI:10.1016/j.jclepro.2017.12.204 URL [本文引用: 1]
Case study of the effects of atmospheric aerosols and regional haze on agriculture: An opportunity to enhance crop yields in China through emission controls?
[J].The effect of atmospheric aerosols and regional haze from air pollution on the yields of rice and winter wheat grown in China is assessed. The assessment is based on estimates of aerosol optical depths over China, the effect of these optical depths on the solar irradiance reaching the earth's surface, and the response of rice and winter wheat grown in Nanjing to the change in solar irradiance. Two sets of aerosol optical depths are presented: one based on a coupled, regional climate/air quality model simulation and the other inferred from solar radiation measurements made over a 12-year period at meteorological stations in China. The model-estimated optical depths are significantly smaller than those derived from observations, perhaps because of errors in one or both sets of optical depths or because the data from the meteorological stations has been affected by local pollution. Radiative transfer calculations using the smaller, model-estimated aerosol optical depths indicate that the so-called "direct effect" of regional haze results in an approximately 5-30% reduction in the solar irradiance reaching some of China's most productive agricultural regions. Crop-response model simulations suggest an approximately 1:1 relationship between a percentage increase (decrease) in total surface solar irradiance and a percentage increase (decrease) in the yields of rice and wheat. Collectively, these calculations suggest that regional haze in China is currently depressing optimal yields of approximately 70% of the crops grown in China by at least 5-30%. Reducing the severity of regional haze in China through air pollution control could potentially result in a significant increase in crop yields and help the nation meet its growing food demands in the coming decades.
Modelling the effect of aerosol feedbacks on the regional meteorology factors over China
[J].DOI:10.4209/aaqr.2014.11.0272 URL [本文引用: 1]
Enhanced PM2.5 pollution in China due to aerosol-cloud interactions
[J].Aerosol-cloud interactions (aerosol indirect effects) play an important role in regional meteorological variations, which could further induce feedback on regional air quality. While the impact of aerosol-cloud interactions on meteorology and climate has been extensively studied, their feedback on air quality remains unclear. Using a fully coupled meteorology-chemistry model, we find that increased aerosol loading due to anthropogenic activities in China substantially increases column cloud droplet number concentration and liquid water path (LWP), which further leads to a reduction in the downward shortwave radiation at surface, surface air temperature and planetary boundary layer (PBL) height. The shallower PBL and accelerated cloud chemistry due to larger LWP in turn enhance the concentrations of particulate matter with diameter less than 2.5 μm (PM) by up to 33.2 μg m (25.1%) and 11.0 μg m (12.5%) in January and July, respectively. Such a positive feedback amplifies the changes in PM concentrations, indicating an additional air quality benefit under effective pollution control policies but a penalty for a region with a deterioration in PM pollution. Additionally, we show that the cloud processing of aerosols, including wet scavenging and cloud chemistry, could also have substantial effects on PM concentrations.
Global and regional climate changes due to black carbon
[J].
Soot climate forcing via snow and ice albedos
[J].
DOI:10.1073/pnas.2237157100
URL
[本文引用: 1]
\n Plausible estimates for the effect of soot on snow and ice albedos (1.5% in the Arctic and 3% in Northern Hemisphere land areas) yield a climate forcing of +0.3 W/m\n 2\n in the Northern Hemisphere. The “efficacy” of this forcing is ∼2, i.e., for a given forcing it is twice as effective as CO\n 2\n in altering global surface air temperature. This indirect soot forcing may have contributed to global warming of the past century, including the trend toward early springs in the Northern Hemisphere, thinning Arctic sea ice, and melting land ice and permafrost. If, as we suggest, melting ice and sea level rise define the level of dangerous anthropogenic interference with the climate system, then reducing soot emissions, thus restoring snow albedos to pristine high values, would have the double benefit of reducing global warming and raising the global temperature level at which dangerous anthropogenic interference occurs. However, soot contributions to climate change do not alter the conclusion that anthropogenic greenhouse gases have been the main cause of recent global warming and will be the predominant climate forcing in the future.\n
Recent climate and air pollution impacts on Indian agriculture
[J].
DOI:10.1073/pnas.1317275111
PMID:25368149
[本文引用: 1]
Recent research on the agricultural impacts of climate change has primarily focused on the roles of temperature and precipitation. These studies show that India has already been negatively affected by recent climate trends. However, anthropogenic climate changes are a result of both global emissions of long-lived greenhouse gases (LLGHGs) and other short-lived climate pollutants (SLCPs). Two potent SLCPs, tropospheric ozone and black carbon, have direct effects on crop yields beyond their indirect effects through climate; emissions of black carbon and ozone precursors have risen dramatically in India over the past three decades. Here, to our knowledge for the first time, we present results of the combined effects of climate change and the direct effects of SLCPs on wheat and rice yields in India from 1980 to 2010. Our statistical model suggests that, averaged over India, yields in 2010 were up to 36% lower for wheat than they otherwise would have been, absent climate and pollutant emissions trends, with some densely populated states experiencing 50% relative yield losses. [Our point estimates for rice (-20%) are similarly large, but not statistically significant.] Upper-bound estimates suggest that an overwhelming fraction (90%) of these losses is due to the direct effects of SLCPs. Gains from addressing regional air pollution could thus counter expected future yield losses resulting from direct climate change effects of LLGHGs.
Spatiotemporal differentiation of changes in wheat phenology in China under climate change from 1981 to 2010
[J].DOI:10.1007/s11430-017-9149-0 [本文引用: 1]
Spatio-temporal changes in vegetation in the last two decades (2001-2020) in the Beijing-Tianjin-Hebei region
[J].In terrestrial ecosystems, vegetation is sensitive to climate change and human activities. Its spatial-temporal changes also affect the ecological and social environment. In this paper, we considered the Beijing–Tianjin–Hebei region to study the spatio-temporal vegetation patterns. The detailed analysis of a moderate-resolution imaging spectroradiometer (MODIS) data were carried out through the Google Earth Engine (GEE) platform. Our results show a slow and tortuous upward trend in the average leaf area index (LAI) in the study region for the periods 2001–2020. Specifically, Beijing had the highest LAI value, with an average of 1.64 over twenty years, followed by Hebei (1.30) and Tianjin (1.04). Among different vegetation types, forests had the highest normalized difference vegetation index (NDVI) with the range of 0.62–0.78, followed by shrubland (0.58–0.75), grassland (0.34–0.66), and cropland (0.38–0.54) over the years. Spatially, compared to the whole study area, index value in the northwestern part of the Beijing–Tianjin–Hebei region increased greatly in many areas, such as northwest Beijing, Chengde, and Zhangjiakou, indicating a significant ecological optimization. Meanwhile, there was ecological degradation in the middle and southeast regions, from Tangshan southeastward to Handan, crossing Tianjin, Langfang, the east part of Baoding, Shijiazhuang, and the west part of Cangzhou. Air temperature and precipitation were positively and significantly correlated with net primary production (NPP) and precipitation stood out as a key driver. Additionally, an intensification of the urbanization rate will negatively impact the vegetation NPP, with the shrubland and forest being affected most relative to the cropland.
Disaggregating climatic and anthropogenic influences on vegetation changes in Beijing-Tianjin-Hebei region of China
[J].
京津冀地区植被物候时空变化及其对城市化的响应
[J].
Spatial and temporal changes of vegetation phenology and its response to urbanization in the Beijing-Tianjin-Hebei region
基于混合效应模型的京津冀地区PM2.5数值模拟
[J].
Numerical simulation of PM2.5 in Beijing-Tianjin-Hebei region based on mixed effect model
On downward shortwave and longwave radiations over high altitude regions: Observation and modeling in the Tibetan Plateau
[J].DOI:10.1016/j.agrformet.2009.08.004 URL [本文引用: 1]
Improving land surface temperature modeling for dry land of China
[J].
Little change in heat requirement for vegetation green-up on the Tibetan Plateau over the warming period of 1998-2012
[J].DOI:10.1016/j.agrformet.2016.10.021 URL [本文引用: 1]
A non-stationary 1981-2012 AVHRR NDVI3g time series
[J].DOI:10.3390/rs6086929 URL [本文引用: 1]
Increasing global vegetation browning hidden in overall vegetation greening: Insights from time-varying trends
[J].DOI:10.1016/j.rse.2018.05.018 URL [本文引用: 1]
黔桂喀斯特山区年NDVI变化的影响因素研究
[J].
DOI:10.18306/dlkxjz.2019.11.013
[本文引用: 1]
喀斯特山区是中国典型的生态脆弱区,区内的植被极易发生退化,且退化后难以恢复。论文采用逐步多元回归、相关性分析和残差分析等方法,探讨了黔桂喀斯特山区气候变化特征及其NDVI变化的影响因素。结果表明:2002—2015年研究区气候变化呈现暖湿化趋势,但变化并不显著,年降水量和年均温变化分别介于-15.6~25.6 mm/a和-0.08~0.06 ℃/a之间,年均增速分别为7.9 mm/a和0.000 35 ℃/a。过去14 a内,气候变化是影响NDVI变化的关键因素(贡献率约95%),其中降水对植被NDVI的影响大于气温。残差分析表明,近14 a来黔桂喀斯特山区NDVI残差和NDVI残差趋势的均值分别为0.03和0.0007/a,说明人类活动的正效应呈上升趋势。城市化的进程使得大量耕地、林地被建设用地占用,在毕节、安顺、贵阳以及河池、柳州、百色一带,人类活动对植被NDVI变化呈较明显的负效应,但是在六盘水、黔西南自治州、遵义和来宾,由于一系列生态还林工程的实施,人类活动则表现为正向影响。
Impact factors of annual NDVI change in karst mountain areas of Guizhou and Guangxi provinces
DOI:10.18306/dlkxjz.2019.11.013
[本文引用: 1]
The karst mountain areas are typical ecologically fragile regions in China. The vegetation is highly prone to degradation and is difficult to recover after that. In this study, we explored the change trend of climatic factors and distinguished the impact factors of annual NDVI change in karst mountain areas, by using stepwise regression, correlation analysis, and residual analysis. From 2002 to 2015, a warm and humid trend was found in the study area, but not significant at the P=95% level. The average annual changes of precipitation and temperature are in the range of -15.6-25.6 mm/a and -0.08-0.06 ℃/a, with an increasing rate of 7.9 mm/a and 0.00035 ℃/a respectively at the regional scale. During the study period, climate variability was the dominating factor of NDVI changes, which accounted for 95% of the annual variations, and the impact of precipitation on NDVI was slightly greater than that of temperature. The residual analysis of NDVI showed that the mean values of NDVI residual and its trend were 0.03 and 0.0007/a in the last 14 years, indicating that the positive effects of human activities were present. Human activities such as urbanization caused a large amount of cultivated land and forest to be occupied by construction land, thus had obvious negative effects on NDVI changes in Bijie, Anshun, Guiyang, Hechi, Liuzhou, and Baise. However, due to the implementation of ecological rehabilitation and reforestation projects, human activities had positive effects on NDVI changes in Liupanshui, Qianxinan, Zunyi, and Laibin.
Reconstructing 1-km-resolution high-quality PM2.5data records from 2000 to 2018 in China: Spatiotemporal variations and policy implications
[J].
Estimating PM2.5 concentrations in the conterminous United States using the random forest approach
[J].DOI:10.1021/acs.est.7b01210 URL [本文引用: 1]
A simple method for reconstructing a high-quality NDVI time-series data set based on the Savitzky-Golay filter
[J].DOI:10.1016/j.rse.2004.03.014 URL [本文引用: 1]
Leaf area index measurements at Fluxnet-Canada forest sites
[J].DOI:10.1016/j.agrformet.2006.08.005 URL [本文引用: 1]
基于双线性内插模型的地理空间数据保密技术研究
[J].
Research on the security of geospatial data based on the bilinear interpolation model
The Theil-Sen estimator with doubly censored data and applications to astronomy
[J].DOI:10.1080/01621459.1995.10476499 URL [本文引用: 1]
Trend detection in hydrologic data: The Mann-Kendall trend test under the scaling hypothesis
[J].DOI:10.1016/j.jhydrol.2007.11.009 URL [本文引用: 1]
Correlations between fine particulate matter (PM2.5) and meteorological variables in the United States: Implications for the sensitivity of PM2.5to climate change
[J].DOI:10.1016/j.atmosenv.2010.06.060 URL [本文引用: 1]
Spatial patterns and climate controls of seasonal variations in carbon fluxes in China's terrestrial ecosystems
[J].
Monitoring phenology in the temperate grasslands of China from 1982 to 2015 and its relation to net primary productivity
[J].Both vegetation phenology and net primary productivity (NPP) are crucial topics under the background of global change, but the relationships between them are far from clear. In this study, we quantified the spatial-temporal vegetation start (SOS), end (EOS), and length (LOS) of the growing season and NPP for the temperate grasslands of China based on a 34-year time-series (1982–2015) normalized difference vegetation index (NDVI) derived from global inventory modeling and mapping studies (GIMMS) and meteorological data. Then, we demonstrated the relationships between NPP and phenology dynamics. The results showed that more than half of the grasslands experienced significant changes in their phenology and NPP. The rates of their changes exhibited spatial heterogeneity, but their phenological changes could be roughly divided into three different clustered trend regions, while NPP presented a polarized pattern that increased in the south and decreased in the north. Different trend zones’ analyses revealed that phenology trends accelerated after 1997, which was a turning point. Prolonged LOS did not necessarily increase the current year’s NPP. SOS correlated with the NPP most closely during the same year compared to EOS and LOS. Delayed SOS contributed to increasing the summer NPP, and vice versa. Thus, SOS could be a predictor for current year grass growth. In view of this result, we suggest that future studies should further explore the mechanisms of SOS and plant growth.
A likely increase in fine particulate matter and premature mortality under future climate change
[J].
DOI:10.1007/s11869-019-00785-7
[本文引用: 1]
Climate change modulates the concentration of fine particulate matter (PM2.5) via modifying atmospheric circulation, temperature, and the hydrological cycle. Furthermore, PM2.5is associated with cardiopulmonary diseases and premature mortality. Here, we use seven models to assess the response of PM2.5to end of the twenty-first century climate change under Representative Concentration Pathway 8.5, and the corresponding impact on premature mortality. The majority of models yield an increase in both PM2.5and premature mortality associated with lung cancer and cardiopulmonary disease in all world regions except Africa. These results are robust across five different future population projections, although the magnitude of premature deaths can vary by up to a factor of two. Much larger uncertainty is related to uncertainty in model physics and the representation of aerosol processes. Although our analysis requires several assumptions related to future population estimates, as well as the concentration-response function, results suggest that future emission reductions are necessary to avoid the likely health risks associated with increasing PM2.5in a warmer world.
Effect of rainfall pulses on plant growth and transpiration of two xerophytic shrubs in a revegetated desert area: Tengger Desert, China
[J].DOI:10.1016/j.catena.2015.09.020 URL [本文引用: 1]
Impact of aerosols on precipitation from deep convective clouds in Eastern China
[J].DOI:10.1002/jgrd.v121.16 URL [本文引用: 2]
The climate impact of aerosols on the lightning flash rate: Is it detectable from long-term measurements?
[J].
气溶胶对中国天气、气候和环境影响综述
[J].
Impact of aerosols on the weather,climate and environment of China: An overview
Long-term impacts of aerosols on the vertical development of clouds and precipitation
[J].DOI:10.1038/ngeo1313 [本文引用: 2]
Simulating chemistry-aerosol-cloud-radiation-climate feedbacks over the continental U.S. using the online-coupled Weather Research Forecasting Model with chemistry (WRF/Chem)
[J].DOI:10.1016/j.atmosenv.2010.05.056 URL [本文引用: 3]
Delaying precipitation and lightning by air pollution over the Pearl River Delta. Part I: Observational analyses
[J].DOI:10.1002/jgrd.v121.11 URL [本文引用: 2]
Declining frequency of summertime local-scale precipitation over eastern China from 1970 to 2010 and its potential link to aerosols
[J].DOI:10.1002/2017GL073533 URL [本文引用: 1]
Physical and chemical observations in marine stratus during the 1993 North Atlantic Regional Experiment: Factors controlling cloud droplet number concentrations
[J].DOI:10.1029/96JD01228 URL [本文引用: 1]
Water-soluble fractions of aerosol and their relations to number size distributions based on aircraft measurements from the North Atlantic Regional Experiment
[J].DOI:10.1029/96JD00345 URL [本文引用: 1]
Assessment of air quality-climate interactions in IPCC AR6
[J].
基于MIROC6模式探讨1850—2014年全球不同类型人为气溶胶的时空分布及辐射强迫
[J].
The spatial-temporal distribution of anthropogenic aerosols and their radiative forcing from 1850 to 2014 based on the MIROC6 model
Satellite observed land surface greening in summer controlled by the precipitation frequency rather than its total over Tibetan Plateau
[J].
Temperature, precipitation, and insolation effects on autumn vegetation phenology in temperate China
[J].
DOI:10.1111/gcb.13081
PMID:26340580
[本文引用: 1]
Autumn phenology plays a critical role in regulating climate-biosphere interactions. However, the climatic drivers of autumn phenology remain unclear. In this study, we applied four methods to estimate the date of the end of the growing season (EOS) across China's temperate biomes based on a 30-year normalized difference vegetation index (NDVI) dataset from Global Inventory Modeling and Mapping Studies (GIMMS). We investigated the relationships of EOS with temperature, precipitation sum, and insolation sum over the preseason periods by computing temporal partial correlation coefficients. The results showed that the EOS date was delayed in temperate China by an average rate at 0.12 ± 0.01 days per year over the time period of 1982-2011. EOS of dry grassland in Inner Mongolia was advanced. Temporal trends of EOS determined across the four methods were similar in sign, but different in magnitude. Consistent with previous studies, we observed positive correlations between temperature and EOS. Interestingly, the sum of precipitation and insolation during the preseason was also associated with EOS, but their effects were biome dependent. For the forest biomes, except for evergreen needle-leaf forests, the EOS dates were positively associated with insolation sum over the preseason, whereas for dry grassland, the precipitation over the preseason was more dominant. Our results confirmed the importance of temperature on phenological processes in autumn, and further suggested that both precipitation and insolation should be considered to improve the performance of autumn phenology models.© 2015 John Wiley & Sons Ltd.
京津冀地区气象干旱特征及其成因分析
[J].
Characteristics of meteorological drought in Jing-Jin-Ji area and cause analysis
Global desertification: Building a science for dryland development
[J].
DOI:10.1126/science.1131634
PMID:17495163
[本文引用: 1]
In this millennium, global drylands face a myriad of problems that present tough research, management, and policy challenges. Recent advances in dryland development, however, together with the integrative approaches of global change and sustainability science, suggest that concerns about land degradation, poverty, safeguarding biodiversity, and protecting the culture of 2.5 billion people can be confronted with renewed optimism. We review recent lessons about the functioning of dryland ecosystems and the livelihood systems of their human residents and introduce a new synthetic framework, the Drylands Development Paradigm (DDP). The DDP, supported by a growing and well-documented set of tools for policy and management action, helps navigate the inherent complexity of desertification and dryland development, identifying and synthesizing those factors important to research, management, and policy communities.
Driving forces of the changes in vegetation phenology in the Qinghai-Tibet Plateau
[J].Phenological change is an emerging hot topic in ecology and climate change research. Existing phenological studies in the Qinghai–Tibet Plateau (QTP) have focused on overall changes, while ignoring the different characteristics of changes in different regions. Here, we use the Global Inventory Modeling and Mapping Studies (GIMMS3g) normalized difference vegetation index (NDVI) dataset as a basis to discuss the temporal and spatial changes in vegetation phenology in the Qinghai–Tibet Plateau from 1982 to 2015. We also analyze the response mechanisms of pre-season climate factor and vegetation phenology and reveal the driving forces of the changes in vegetation phenology. The results show that: (1) the start of the growing season (SOS) and the length of the growing season (LOS) in the QTP fluctuate greatly year by year; (2) in the study area, the change in pre-season precipitation significantly affects the SOS in the northeast (p < 0.05), while, the delay in the end of the growing season (EOS) in the northeast is determined by pre-season air temperature and precipitation; (3) pre-season precipitation in April or May is the main driving force of the SOS of different vegetation, while air temperature and precipitation in the pre-season jointly affect the EOS of different vegetation. The differences in and the diversity of vegetation types together lead to complex changes in vegetation phenology across different regions within the QTP. Therefore, addressing the characteristics and impacts of changes in vegetation phenology across different regions plays an important role in ecological protection in this region.
气候变化背景下张家口地区干旱化趋势
[J].
Changes in drought trends in Zhangjiakou due to global climate change
Contrasting effects of warming and increased snowfall on Arctic tundra plant phenology over the past two decades
[J].
DOI:10.1111/gcb.13051
PMID:26216538
[本文引用: 1]
Recent changes in climate have led to significant shifts in phenology, with many studies demonstrating advanced phenology in response to warming temperatures. The rate of temperature change is especially high in the Arctic, but this is also where we have relatively little data on phenological changes and the processes driving these changes. In order to understand how Arctic plant species are likely to respond to future changes in climate, we monitored flowering phenology in response to both experimental and ambient warming for four widespread species in two habitat types over 21 years. We additionally used long-term environmental records to disentangle the effects of temperature increase and changes in snowmelt date on phenological patterns. While flowering occurred earlier in response to experimental warming, plants in unmanipulated plots showed no change or a delay in flowering over the 21-year period, despite more than 1 °C of ambient warming during that time. This counterintuitive result was likely due to significantly delayed snowmelt over the study period (0.05-0.2 days/yr) due to increased winter snowfall. The timing of snowmelt was a strong driver of flowering phenology for all species - especially for early-flowering species - while spring temperature was significantly related to flowering time only for later-flowering species. Despite significantly delayed flowering phenology, the timing of seed maturation showed no significant change over time, suggesting that warmer temperatures may promote more rapid seed development. The results of this study highlight the importance of understanding the specific environmental cues that drive species' phenological responses as well as the complex interactions between temperature and precipitation when forecasting phenology over the coming decades. As demonstrated here, the effects of altered snowmelt patterns can counter the effects of warmer temperatures, even to the point of generating phenological responses opposite to those predicted by warming alone. © 2015 John Wiley & Sons Ltd.
Leaf onset in the Northern Hemisphere triggered by daytime temperature
[J].Piao, Shilong; Shen, Miaogen Chinese Acad Sci, Inst Tibetan Plateau Res, Ctr Excellence Tibetan Earth Sci, Key Lab Alpine Ecol & Biodivers, Beijing 100085, Peoples R China. Piao, Shilong Chinese Acad Sci, CAS Ctr Excellence Tibetan Plateau Earth Sci, Beijing 100085, Peoples R China. Piao, Shilong; Tan, Jianguang; Fu, Yongshuo H.; Liu, Qiang; Zeng, Zhenzhong; Li, Yue; Peng, Shushi Peking Univ, Sino French Inst Earth Syst Sci, Coll Urban & Environm Sci, Beijing 100871, Peoples R China. Chen, Anping Princeton Univ, Dept Ecol & Evolutionary Biol, Princeton, NJ 08544 USA. Fu, Yongshuo H.; Janssens, Ivan A.; Vicca, Sara Univ Antwerp, Dept Biol, B-2610 Antwerp, Belgium. Ciais, Philippe; Peng, Shushi UMR CEA CNRS, LSCE, F-91191 Gif Sur Yvette, France. Jeong, Su-Jong CALTECH, Jet Prop Lab, Pasadena, CA 91011 USA. Myneni, Ranga B. Boston Univ, Dept Earth & Environm, Boston, MA 02215 USA. Penuelas, Josep CREAF, Barcelona 08193, Spain. Penuelas, Josep CREAF CSIC UAB, Global Ecol Unit, Barcelona 08193, Spain.
Strong impacts of daily minimum temperature on the green-up date and summer greenness of the Tibetan Plateau
[J].
DOI:10.1111/gcb.13301
PMID:27103613
[本文引用: 1]
Understanding vegetation responses to climate change on the Tibetan Plateau (TP) helps in elucidating the land-atmosphere energy exchange, which affects air mass movement over and around the TP. Although the TP is one of the world's most sensitive regions in terms of climatic warming, little is known about how the vegetation responds. Here, we focus on how spring phenology and summertime greenness respond to the asymmetric warming, that is, stronger warming during nighttime than during daytime. Using both in situ and satellite observations, we found that vegetation green-up date showed a stronger negative partial correlation with daily minimum temperature (Tmin ) than with maximum temperature (Tmax ) before the growing season ('preseason' henceforth). Summer vegetation greenness was strongly positively correlated with summer Tmin, but negatively with Tmax. A 1-K increase in preseason Tmin advanced green-up date by 4 days (P < 0.05) and in summer enhanced greenness by 3.6% relative to the mean greenness during 2000-2004 (P < 0.01). In contrast, increases in preseason Tmax did not advance green-up date (P > 0.10) and higher summer Tmax even reduced greenness by 2.6% K(-1) (P < 0.05). The stimulating effects of increasing Tmin were likely caused by reduced low temperature constraints, and the apparent negative effects of higher Tmax on greenness were probably due to the accompanying decline in water availability. The dominant enhancing effect of nighttime warming indicates that climatic warming will probably have stronger impact on TP ecosystems than on apparently similar Arctic ecosystems where vegetation is controlled mainly by Tmax. Our results are crucial for future improvements of dynamic vegetation models embedded in the Earth System Models which are being used to describe the behavior of the Asian monsoon. The results are significant because the state of the vegetation on the TP plays an important role in steering the monsoon.© 2016 John Wiley & Sons Ltd.
Scratching-induced surface characteristics and material removal mechanisms in rotary ultrasonic surface machining of CFRP
[J].
DOI:S0041-624X(18)30422-0
PMID:31030058
[本文引用: 1]
Rotary ultrasonic machining has been successfully explored in surface machining of carbon fiber reinforced plastic (CFRP) composites. It has been proven to be an effective and efficient CFRP machining method. Both theoretical and experimental investigations have been conducted with the assumption that the CFRP is removed by brittle fracture removal mode. However, in brittle material machining, ductile flow phenomenon still exists. Ductile scratching marks are also observed on the machined CFRP surfaces. It is still unknown that what actual material removal modes are under different machining variables. To investigate the material removal mechanisms in rotary ultrasonic surface machining (RUSM) of CFRP, single abrasive scratching tests were conducted. The scratching induced characteristics and scratching forces were analyzed. Both the ductile removal mode and the brittle fracture removal mode were observed and identified in both carbon fiber layers and epoxy resin layers on the machined marks by using scanning electron microscopy (SEM) imaging. With the increase of scratching depth, the material removal mode of CFRP was changed from the ductile removal mode to the brittle fracture mode. From the analysis of kinematic trajectory of diamond grain, the scratching cutting forces were decreased in the tests with the assistance of ultrasonic vibration under the same machining variables. The generation mechanisms of the delamination were analyzed and discussed.Copyright © 2019 Elsevier B.V. All rights reserved.
Diverse responses of phenology to global changes in a grassland ecosystem
[J].Shifting plant phenology (i.e., timing of flowering and other developmental events) in recent decades establishes that species and ecosystems are already responding to global environmental change. Earlier flowering and an extended period of active plant growth across much of the northern hemisphere have been interpreted as responses to warming. However, several kinds of environmental change have the potential to influence the phenology of flowering and primary production. Here, we report shifts in phenology of flowering and canopy greenness (Normalized Difference Vegetation Index) in response to four experimentally simulated global changes: warming, elevated CO(2), nitrogen (N) deposition, and increased precipitation. Consistent with previous observations, warming accelerated both flowering and greening of the canopy, but phenological responses to the other global change treatments were diverse. Elevated CO(2) and N addition delayed flowering in grasses, but slightly accelerated flowering in forbs. The opposing responses of these two important functional groups decreased their phenological complementarity and potentially increased competition for limiting soil resources. At the ecosystem level, timing of canopy greenness mirrored the flowering phenology of the grasses, which dominate primary production in this system. Elevated CO(2) delayed greening, whereas N addition dampened the acceleration of greening caused by warming. Increased precipitation had no consistent impacts on phenology. This diversity of phenological changes, between plant functional groups and in response to multiple environmental changes, helps explain the diversity in large-scale observations and indicates that changing temperature is only one of several factors reshaping the seasonality of ecosystem processes.
Summer-drought constrains the phenology and growth of two coexisting Mediterranean oaks with contrasting leaf habit: Implications for their persistence and reproduction
[J].DOI:10.1007/s00468-009-0320-5 URL [本文引用: 1]
Trends toward an earlier peak of the growing season in Northern Hemisphere mid-latitudes
[J].
DOI:10.1111/gcb.13224
PMID:26752300
[本文引用: 1]
Changes in peak photosynthesis timing (PPT) could substantially change the seasonality of the terrestrial carbon cycle. Spring PPT in dry regions has been documented for some individual plant species on a stand scale, but both the spatio-temporal pattern of shifting PPT on a continental scale and its determinants remain unclear. Here, we use satellite measurements of vegetation greenness to find that the majority of Northern Hemisphere, mid-latitude vegetated area experienced a trend toward earlier PPT during 1982-2012, with significant trends of an average of 0.61 day yr(-1) across 19.4% of areas. These shifts correspond to increased annual accumulation of growing degree days (GDD) due to warming and are most highly concentrated in the eastern United States and Europe. Earlier mean PPT is generally a trait common among areas with summer temperatures higher than 27.6 ± 2.9 °C, summer precipitation lower than 84.2 ± 41.5 mm, and fraction of cold season precipitation greater than 89.2 ± 1.5%. The trends toward earlier PPT discovered here have co-occurred with overall increases in vegetation greenness throughout the growing season, suggesting that summer drought is not a dominant driver of these trends. These results imply that continued warming may facilitate continued shifts toward earlier PPT and cause these trends to become more pervasive, with important implications for terrestrial carbon, water, nutrient, and energy budgets.© 2016 John Wiley & Sons Ltd.
Plant phenology changes and drivers on the Qinghai-Tibetan Plateau
[J].DOI:10.1038/s43017-022-00317-5 [本文引用: 1]
基于温度供水干旱指数的京津冀春旱监测及时空分布分析
[J].
Spring drought monitoring in Beijing-Tianjin-Hebei based on temperature water supply drought index
华北地区农业干旱灾害变化特征
[J].
Characteristics of agricultural drought disaster in Northern China
Field evidences for the positive effects of aerosols on tree growth
[J].
DOI:10.1111/gcb.14339
PMID:29855126
[本文引用: 1]
Theoretical and eddy covariance studies demonstrate that aerosol-loading stimulates canopy photosynthesis, but field evidence for the aerosol effect on tree growth is limited. Here, we measured in situ daily stem growth rates of aspen trees under a wide range of aerosol-loading in China. The results showed that daily stem growth rates were positively correlated with aerosol-loading, even at exceptionally high aerosol levels. Using structural equation modeling analysis, we showed that variations in stem growth rates can be largely attributed to two environmental variables covarying with aerosol loading: diffuse fraction of radiation and vapor pressure deficit (VPD). Furthermore, we found that these two factors influence stem growth by influencing photosynthesis from different parts of canopy. Using field observations and a mechanistic photosynthesis model, we demonstrate that photosynthetic rates of both sun and shade leaves increased under high aerosol-loading conditions but for different reasons. For sun leaves, the photosynthetic increase was primarily attributed to the concurrent lower VPD; for shade leaves, the positive aerosol effect was tightly connected with increased diffuse light. Overall, our study provides the first field evidence of increased tree growth under high aerosol loading. We highlight the importance of understanding biophysical mechanisms of aerosol-meteorology interactions, and incorporating the different pathways of aerosol effects into earth system models to improve the prediction of large-scale aerosol impacts, and the associated vegetation-mediated climate feedbacks.© 2018 John Wiley & Sons Ltd.
The effect of atmospheric aerosol particles and clouds on net ecosystem exchange in the Amazon
[J].
我国大气污染协同防控理论框架初探
[J].
Preliminary research on theoretical framework of cooperative control of air pollution in China
中国城市群地区PM2.5时空演变格局及其影响因素
[J].
DOI:10.11821/dlxb201912014
[本文引用: 1]
城市群作为中国新型城镇化主体形态,是支撑全国经济增长、促进区域协调发展、参与国际分工合作的重要平台,也是空气污染的核心区域。本文选取2000-2015年NASA大气遥感影像反演PM<sub>2.5</sub>数据,运用GIS空间分析和空间面板杜宾模型,揭示了中国城市群PM<sub>2.5</sub>的时空演变特征与主控因素。结果显示:① 2000-2015年中国城市群PM<sub>2.5</sub>浓度呈现波动增长趋势,2007年出现拐点,低浓度城市减少,高浓度城市增多。② 城市群PM<sub>2.5</sub>浓度以胡焕庸线为界呈现东高西低的格局,城市群间空间差异性显著且不断扩大,东部、东北地区浓度提升更快。③ 城市群PM<sub>2.5</sub>年均浓度空间集聚性显著,以胡焕庸线为界,热点区域集中东部,范围持续增加,冷点集中在西部,范围持续缩小。④ 城市群内各城市间PM<sub>2.5</sub>浓度存在空间溢出效应。不同城市群影响要素差异显著,工业化和能源消耗对PM<sub>2.5</sub>污染有正向影响;外商投资在东南沿海和边境城市群对PM<sub>2.5</sub>污染具有负向影响;人口密度对本地区PM<sub>2.5</sub>污染主要具有正向影响,对邻近地区则相反;城市化水平在国家级城市群对PM<sub>2.5</sub>污染有负向影响,在区域性和地方性城市群则相反;产业结构高级度对本地区PM<sub>2.5</sub>污染有负向影响,对邻近地区则相反;技术扶持度对PM<sub>2.5</sub>污染的影响显著,但存在滞后性和回弹效应。
Spatio-temporal evolution patterns and influencing factors of PM2.5 in Chinese urban agglomerations
DOI:10.11821/dlxb201912014
[本文引用: 1]
As the main form of China new urbanization, urban agglomerations are the important platform to support national economic growth, promote regional coordinated development and participate in international competition and cooperation, but they are also the core area of air pollution. This paper selects PM2.5 data from NASA atmospheric remote sensing image inversion from 2000 to 2015, and uses GIS spatial analysis and Spatial Durbin Model to reveal the temporal and spatial evolution pattern characteristics and main controlling factors of PM2.5 in China's urban agglomerations. The main conclusions are as follows: (1) From 2000 to 2015, the PM2.5 concentration of China urban agglomerations showed a volatility growth trend. In 2007, there was an inflection point. The number of low-concentration cities declined, and the number of high-concentration cities increased. (2) The concentration of PM2.5 in urban agglomerations was in the pattern of high in the east and and low in the west, with the "Hu Huanyong Line" as the boundary. The spatial difference between urban agglomerations is significant, and the difference is increasing. The concentration of PM2.5 is growing faster in urban agglomerations in the eastern and northeastern regions. (3) The urban agglomeration of PM2.5 has a significant spatial concentration. The hot spots are concentrated to the east of the "Hu Huanyong Line", and the number of cities continues to rise. The cold spots are concentrated to the west of the "Hu Huanyong Line", and the number of cities continues to decline. (4) There is a significant spatial spillover effect of PM2.5 pollution among cities within urban agglomerations. The main controlling factors of PM2.5 pollution in different urban agglomerations have significant differences. Industrialization and energy consumption have a significant positive impact on PM2.5 pollution. Foreign direct investment has a significant negative impact on PM2.5 pollution in the southeast coastal and border urban agglomerations. Population density has the significant positive impact on PM2.5 pollution in the region, and has the opposite result in the neighbouring areas. Urbanization level has a negative impact on PM2.5 pollution in national-level urban agglomerations, and has the opposite result in regional and local urban agglomerations. The high degree of industrial structure has a significant negative impact on PM2.5 pollution in the region, and has the opposite result in the neighboring regions. Technical support has a significant impact on PM2.5 pollution, but there are also lag effects and rebound effects.
