

空间活力是“抽象的存在”,表征着城市可持续发展的质量和潜力。随着城市建设中以公共交通为导向的开发模式(transit-oriented development,TOD)的兴起以及城市轨道交通的快速发展,地铁站点影响的区域即地铁站域的城市空间活力愈发受到重视[1-2]。地铁站域是站点所影响的区域,包含车站及其互动城市区域的整体,兼顾地铁站点和城市公共空间特性,为居民和旅客提供日常公共活动和社会服务功能,承担城市交通、公共广场、社会服务、商业设施等城市空间属性[3]。地铁站域活力能够集中体现居民的流动与驻留、工作与生活的活跃程度,其构成要素具有复杂性和多样性。利用大数据技术[4-5]实现地铁站域活力的全方位精细化评估对于优化站域资源配置、促进空间协同发展、提升城市空间品质至关重要。
城市空间活力已成为当前国内外研究热点,城市群[6]、城市[7]、街道[8]、滨水空间[9]、公园[10]、社区公共空间[11]等不同尺度和类型的空间活力的影响因素受到极大关注。而少数以地铁站域为对象的空间活力研究着重体现在对活力评价及其营造方面。地铁站域地下商业空间活力受空间结构合理性、轨道交通功能介入、空间功能混合程度、出入口布局等多重因素综合影响[12]。站域活力分析主要从以下方面进行,如:从服务设施数量与社会公共服务获取便利性2个维度构建轨道交通站点周边空间活力评价模型[13];通过百度热力图数据构建轨道站点周边空间使用强度指标分析和评价上海市地铁10号线沿线各站周边的城市空间活力[14];公共空间供应、微观品质对上海轨交站域的停留活动具有重要影响,可以很好地预测城市活力[15];街道可达性、人行道宽度以及街道功能混合度对北京市站域活力均具有显著影响[2];深圳市轨道交通站点服务区划分为4种活力类型,建设强度和用地均衡对活力测度有明显的影响[16]。经过多年的理论与实践的发展,TOD形成了经典的开发设计3D原则[17]。基于TOD模式下营造地铁站域活力是以公交站点和中心商业区为核心,半径为400~800 m的步行可达范围内,融合居住、办公、商业等,从而激发公交站点周边地区的空间活性[18],如美国佛罗里达州在其TOD规划指南中,建议城市核心区的轨道站点周边空间设计至少满足18 h的重要活动时间( Florida Department of Transportation. Florida transit-oriented development. 2012.)。
城市空间活力的研究虽然经过近年来持续的努力,提出了较为丰富的研究模型和影响因素,但地铁站域活力的精细化研究仍显不足。首先,研究区域多为东部发达城市,鲜见对西部地区大城市的实证研究探讨。西部大城市在全国发展中具有重要的战略地位,对其交通站域活力研究对提升城市现代化建设水平、缩小东西部发展差距、促进区域协调发展具有重要意义。其次,测度的空间结构上仅选择地铁周边400~1000 m区域,忽略了地铁站本身,而地铁站点却是显现空间集散能力的重要节点。再次,评价维度及其指标有待改进。已有研究主要从空间形态或人群客流的单一维度切入,对地铁站点的特性和功能的综合考量不足,存在量化指标不全面的构建缺陷。因此,本文系统梳理和归纳反映地铁站域活力的多个维度,构建尽可能完善的指标体系,以西安市为研究区,运用百度热力图、POI等多源大数据,从整体结构和代表性站域2个方面,对145个地铁站域的空间活力进行精准测度、分类、剖析空间分布特征并提出相应建议,以期为地铁站域活力评价建立一个更科学合理的分析框架,为公共交通导向下的城市活力的营造和提升提供科学参考。
1 研究数据与方法
1.1 研究区域
西安市地处关中平原,是西北地区首个开通地铁的国家中心城市。根据《西安统计年鉴2021》,2020年西安市区面积5145.66 km2,常住人口为1060.6万。2011年9月西安市开通运行第一条地铁线路,截至2021年,西安市运营线路为8条,线路长度达252.6 km,位居全国第12位②(②交通运输部,2021年7月全国城市轨道交通运营数据速报。)。地铁在西安城市客运中承担了关键作用,《2021年西安城市交通发展年度报告》统计显示,地铁日均客运量高达280.28万人次,明显大于其他交通方式的日均客运/骑行量③(③《2021年西安城市交通发展年度报告》指出,公共汽(电)车日均客运量228.98万人次,巡游出租车日均客运量72.36万人次,网约车日均客运量41.33万人次,公共自行车日均骑行量11.41万人次,共享单车日均骑行量51.09万人次。)。
目前西安已开通地铁站点为159座,本文仅研究西安市内的地铁站点,因而剔除西咸新区位于咸阳市的地铁站点,共计145座,分布在莲湖区、碑林区、新城区、雁塔区、未央区、灞桥区、长安区和临潼区。《城市轨道沿线地区规划设计导则》将轨道车站影响区定义为距站点500~800 m,步行约15 min以内可以到达站点入口,与轨道功能紧密关联的地区,TOD理论指出地铁站域通常包括5~15 min的步行区,即地铁站周边半径400~800 m的范围[18],结合西安地铁站点影响区人口和就业岗位的覆盖率的测算半径④(④《2021年西安城市交通发展年度报告》显示,站点800 m半径人口与就业岗位覆盖率由上年的33.7%提升至33.9%。),将各站点周边半径800 m的范围作为站域空间。西安市地铁线路、站点、站域、POI和热力值分布如图1所示,利用ArcGIS 10.7对百度热力图进行批量投影、地理配准及矢量化,为了科学地量化分析,使用栅格计算器对热力图数据进行赋值和重分类,将热力值分为7个等级。基于以上处理后的热力图,利用地铁站点缓冲区对热力图进行掩膜提取,生成地铁站域热力图。
图1
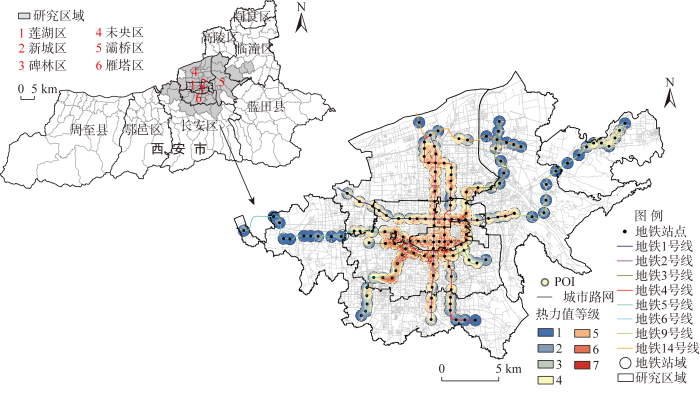
图1
西安市地铁线路及站域分布
Fig.1
Distribution of subway lines and station domains in Xi'an City
1.2 研究方法
1.2.1 活力评价指标体系构建与指标量化方法
Jacobs[19]认为,正是人和人的活动及生活场所相互交织的过程,即这种城市生活的多样性,使城市获得活力。空间活力的表达包含3个关键的组成部分:人群活动、物质空间和通达性。人群及其活动是站域活力的主体,而站域空间是人及其活动的物质载体,物态面貌是构成活力的物质条件,通达性建立了二者联系,促进活力的产生。因此,在参考城市空间活力和地铁站域活力相关指标设计的基础上,本文从分别反映“人”和“地”的人群活动和建成环境2大维度建立指标体系,建成环境按照地铁站域的空间组成结构,且考虑到站点的交通和集散功能,进一步划分为周边要素(道路、功能、建筑)和自身要素(站点通达性)。其中:热力平均值[20]反映地铁站域人口活动的热度特征;路网密度和公交站点密度[21-22]反映通往站域的路网水平、站域公交接驳和可达性;功能密度和功能混合度[8,23]分别反映站域设施集约化程度以及多样性;建筑容积率和密度[24]体现站域人口规模和城市建设现代化水平;地铁可达性用空间句法中的全局集成度[25]表示,反映整个系统中某一节点与其他所有节点之间的可达程度;地铁连通性则用站点出入口数量[26]和全局选择度[27]表示,其分别反映站点集散能力、地铁地下和地上空间的协调性以及站点被穿行的可能性。评价指标体系及其量化方法如表1所示。
表1 地铁站域活力评价指标体系及量化方法
Tab.1
| 维度层 | 要素层 | 指标层 | 因子 | 量化方法 | 权重 | 说明 | |
|---|---|---|---|---|---|---|---|
| 人群 活动 | 活动 热度 | 热力平均值 | x1 | 0.15 | 百度热力图数据来源于百度地图 | ||
| 建成 环境 | 周边 要素 | 道路 | 路网密度 (km·km-2) | x2 | 站域800 m缓冲区内道路总长度/站域面积 | 0.08 | 路网及公交站点数据从开源地图OpenStreetMap获取 |
| 公交站点密度(个·km-2) | x3 | 站域800 m缓冲区内公交站点数量/站域面积 | 0.09 | ||||
| 功能 | 功能密度 (个·km-2) | x4 | 站域800 m缓冲区内的POI数目/站域面积 | 0.11 | 兴趣点数据由高德地图API获取 | ||
| 功能混合度 | x5 | Mix= | 0.17 | ||||
| 建筑 | 容积率 | x6 | 站域800 m缓冲区内所有建筑物的楼层面积/该站域面积 | 0.06 | 西安市建筑轮廓数据,来源于百度地图 | ||
| 占地密度 | x7 | 站域800 m缓冲区内建筑物占地总面积/该站域面积 | 0.05 | ||||
| 自身 要素 | 通达性 | 可达性 | x8 | 全局集成度, 其中: | 0.16 | 地铁线路和站点数据,来源于西安市地铁官网 | |
| 连通性 | x9 | 站点出入口数量 | 0.13 | 地铁线路和站点数据来源于西安市地铁官网,站点出入口数量来源于百度地图 | |||
| 全局选择度, | |||||||
1.2.2 地铁站域活力评价方法
式中:SVi为第i个地铁站域活力,越接近1说明活力越强;x1i, x2i, …, x9i分别为第i个地铁站域的热力平均值、路网密度、公交站点密度、功能密度、功能混合度、容积率、建筑物占地密度、地铁可达性、地铁连通性;w1, w2, …, w9分别为熵值法所确定的上述指标的权重,且和为1;m为站域总数。
1.3 数据来源
本文研究数据包括西安市地铁线路和站点、百度热力图、兴趣点(POI)、道路、公交站点、建筑轮廓、站点出入口数量等数据,具体数据来源见表1。西安市轨道交通线路和站点数据来源于西安市地铁官网最新公布的地铁线路示意图,通过ArcGIS对其矢量化处理并结合人工判读进行编辑修改,完成数据预处理工作,然后在对交通线路和站点数据进行拓扑关系检查的基础上构建交通网络数据集,用于空间句法变量值的计算。百度热力图数据采集时段为2022年4月6日工作日和4月9日休息日7:00~23:00,每小时采集一次,共收集百度热力图34张。POI来自地铁站半径800 m范围内的采集数据,去重筛查后共获得145972条,其类型依据商业、住宅、政府、交通、教育、绿地、公司企业、其他8大功能进行划分[4]。
2 地铁站域活力评价及时空间特征
2.1 活力评价
根据式(1)计算得出西安市地铁站域综合活力值[0.04,0.78],活力平均水平为0.26。在145个站域中,高于综合活力平均值的站域数量有65个,占比44.83%;而低于平均值的站域数量为80个,占比48.63%。按照自然间断点法分为5级(表2),低等级活力的地铁站域的数量和占比明显高于高等级活力,数量随着活力等级的提高先增加后减少,第四等级地铁站域数量和占比在所有等级中最高。从总值和不同等级活力站域的数量来看,充分表明西安市地铁站域活力不足,均存在不同程度的活力营造和提升空间。
表2 综合活力值不同等级的地铁站域分析
Tab.2
| 等级 | 数值范围 | 数量 | 占比/% | 地铁站域 |
|---|---|---|---|---|
| 第一等级 | (0.44,0.78] | 19 | 13.10 | 北大街、五路口、朝阳门、康复路、体育场、永宁门、钟楼、胡家庙、通化门、小寨、吉祥村、科技路、和平门、大差市、南稍门、省人民医院、边家村、丰庆公园、西北工业大学 |
| 第二等级 | (0.33,0.44] | 25 | 17.24 | 开远门、玉祥门、洒金桥、万寿路、纺织城、航天城、会展中心、纬一街、安远门、龙首原、大明宫西、行政中心、西安北站、咸宁路、太白南路、大雁塔、西安科技大学、青龙寺、太乙路、建筑科技大学·李家村、文艺路、金光门、华清池、双寨、雁翔路北口 |
| 第三等级 | (0.21,0.33] | 30 | 20.69 | 劳动路、汉城路、长乐坡、浐河、半坡、凤栖原、三爻、市图书馆、延平门、凤城五路、广泰门、辛家庙、石家街、长乐公园、延兴门、北池头、丈八北路、大唐芙蓉园、文景路、汉城南路、西窑头、石桥立交、阿房宫南、丈八六路、丈八四路、丈八一路、木塔寺、甘家寨、东三岔、西花园 |
| 第四等级 | (0.11,0.21] | 44 | 30.34 | 后卫寨、三桥、皂河、枣园、韦曲南、运动公园、北苑、香湖湾、浐灞中心、桃花潭、鱼化寨、东长安街、飞天路、航天大道、曲江池西、含元殿、大明宫、大明宫北、余家寨、百花村、常青路、市中医医院、凤城九路、凤城十二路、马腾空、理工大曲江校区、王寺、斗门、复兴大道南、镐京、欢乐谷、文教园、郭杜西、西部大道、造字台、省体育馆、银桥大道、西工程大·西科大(临潼校区)、芷阳广场、洪庆、田王、灞柳二路、香王、西工程大·武德路 |
| 第五等级 | [0.04,0.11] | 27 | 18.63 | 保税区、新筑、国际港务区、务庄、航天新城、航天东路、神舟大道、金滹沱、元朔路、黄渠头、高桥、东马坊、沣西文化公园、创新港、西安国际医学中心、仁村、秦陵西、鹦鹉寺公园、凤凰池、紫霞三路、渭河南、文景山公园、北辰、奥体中心、新寺、港务大道、贺韶 |
注:西安市地铁站域活力值最大值为0.78,最小值为0.04,平均值为0.26。
2.2 时序变化特征
(1) 工作日与休息日均呈现出“上升、稳定和下降”的时序变化规律。由全部地铁站域总活力的时序变化(图2)可以看出,在工作日一天的变化中,西安市地铁站域活力有较为明显的波动性变化,经历了上升、稳定和下降阶段。7:00~9:00,地铁站域活力值上升迅速,人群活动以上学、通勤为主。9:00~19:00,出现周期性上下浮动,但总体较为稳定。该阶段地铁站域活力维持在一个较高的水平,人群活动呈现多样性和叠加效应。19:00~23:00为地铁站域活力的下降期,19:00~21:00人群活动先以晚通勤为主,后以回家就餐、逛街购物等室内活动为主,导致活力值出现顶峰后持续下降;21:00~22:00人们在室外进行散步等活动,使得站域活力平稳;22:00~23:00人们回家休息,且面临地铁停止运行,活力继续下降。
图2
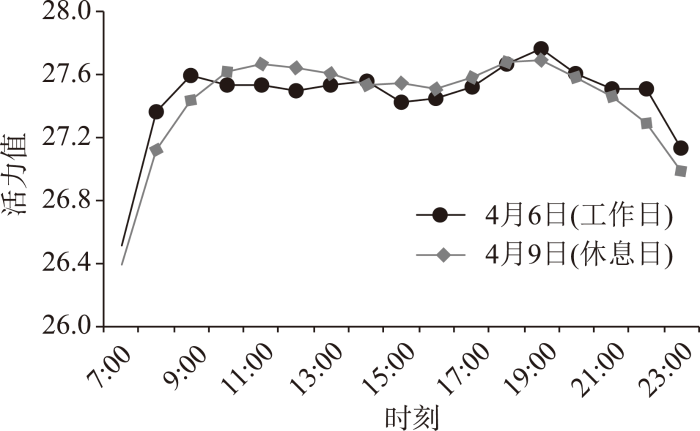
图2
工作日及休息日全部地铁站域总活力时序变化
Fig.2
Time series of total vitality of all metro stations on working days and non-working days
休息日地铁站域活力表现出与工作日相似的波动变化,同样经历上升、平稳、下降的过程。活力上升期为7:00~11:00,持续时间长,人们在10:00后出门活动,时间比较自由。活力稳定期为11:00~18:00,出现缓慢下降后上升,但热力值在3.2~3.4的范围内,处于基本稳定的状态,人们居家休息或在外就餐后,继续逛街、游玩等活动。18:00~23:00为休息日地铁站域活力的衰退期,呈现出持续下降的趋势,18:00临近夜晚,人们居家或进入娱乐、购物、餐饮等场所,站域内活动人口减少,故而活力持续下降。
(2) 与工作日相比,休息日呈现出“上升期”延后、“平稳期”强度提升、“下降期”时段提前的特征。工作日与休息日的地铁站域活力在时间上均呈现出“上升、稳定和下降”的变化规律。但相比工作日,休息日的活力上升期起点低、时间相对延后、持续时间长,活力稳定期进入时间早且地铁站域活力更强,活力下降期开始时间略有提前。总体而言,人们时间越自由则地铁站域越有活力,但受地铁通勤功能的支配作用,工作日地铁站域活力在早晚通勤时段高于休息日。
需要指出的是,站域活力的形成受到了城市功能要素空间配置和地铁站点的共同作用。城市功能要素空间配置是产生空间活力的基础,地铁站点建成及其线路开通引发城市空间要素的站域集聚与重构,依托地铁通达性,在其双重作用下,导致人流的新格局变化,从而激发站域活力,先天性的基础叠加后发性的优劣势,呈现出上述站域活力的时间特征。
2.3 空间特征
(1) 总体上,地铁站域活力呈现显著的中心—外围结构。由图3可知,活力较高的地铁站域主要集中在以钟楼为中心的南北向站域,如钟楼(0.78)、五路口(0.71)、永宁门(0.67)。这些站域相对于其他站点,功能设施、交通设施等较为完善,与学校、综合医院等重要公共服务设施的距离优势也较为明显。而位于城市外围区的地铁站域则相反,活力值普遍较低,如创新港(0.08)、贺韶(0.06)、新寺(0.04)等。因此,总体上地铁站域综合活力值由中心向外围降低。
图3
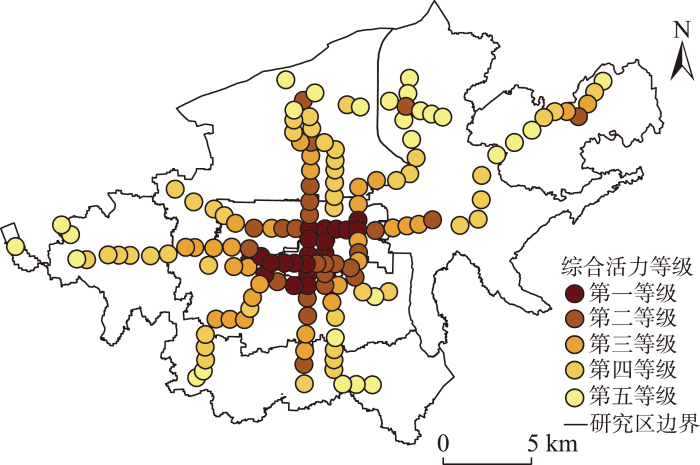
图3
西安市地铁站域综合活力分布
Fig.3
Comprehensive vitality distribution of Xi'an metro station domains
(2) 从不同地铁线路上看,各站域活力存在以下特征:1) 站域平均活力前3位的地铁线路中,贯穿西安南北方向的2号地铁线站域活力最强(0.39),其次为东西方向的1号地铁线站域(0.37),东北—西南方向的3号线地铁站域活力相对略弱(0.29)。 2) 各条线路首尾段的站域活力值普遍较低。具体表现在3号线的首(鱼化寨0.10)尾(保税区0.08)段站域、5号线的首(创新港0.08)尾(马腾空0.13)段站域等。而1号线的终点站纺织城站(0.35)和2号线起点站西安北站(0.37)作为换乘站点和终端站点比较特殊,人流量较高,基础设施较为完善。3) 地铁线开通时间早的站域活力值高。地铁2号线(西安北站—韦曲南)开通时间最早,多数站点坐落于主城区,沿线设施分布的资源优势也最高,因而该线路的站域综合活力相对其他线路较高(平均值0.39)。相反,地铁14号线(贺韶—机场西)开通时间最晚,综合活力普遍较低(平均值0.11)。
(3) 地铁站域活力高的站域包括地铁换乘站域、旅游区地铁站域、大学聚集区接驳站域。地铁线交叉点即14个地铁换乘站,其影响区域活力值普遍高于一般站域,如小寨(0.50)、通化门(0.49),交通连通性好,具有复合型交通功能。位于市中心东北部临潼区的华清池站域(0.37)等活力值较高,与其邻近著名旅游景点有关。西安科技大学站域(0.42)接驳大学聚集区,如西安建筑科技大学、空军军医大学、长安大学雁塔校区、西安科技大学等,人流量具有明显优势。这表明交通便利、旅游业发展、高校聚集等原因能够带动建筑及功能设施和道路交通的改善以及站点建设,吸引人流量,从而提升站域综合活力值。
2.4 指标的重要性分析
由于每个指标的量化数值范围及单位不同,在对各指标值进行归一化处理的基础上,计算各指标的平均值以评价其在地铁站域活力中的作用,从大到小依次为功能混合度(0.60)、地铁可达性(0.57)、热力平均值(0.46)、公交站点密度(0.34)、容积率(0.28)、地铁连通性(0.24)、功能密度(0.20)、路网密度(0.20)、建筑占地密度(0.18)。
功能混合度、地铁可达性、人群活动热度是构成地铁综合站域活力的核心因素。功能混合度越高表示地铁站域范围内的基础设施越完备、功能业态种类越丰富,站域内所提供的服务能力、人类活动越多样,从而有利于促进活力的提高。地铁可达性越高的站点其交通通行更加便捷,与其他站点联系发生的可能性和紧密性也越高,是站域活力产生的动力。规模化的人口数量是活动产生基础[31],人群活动密度越高更容易产生丰富的经济、社会、文化等活动,区域内便表现出较为旺盛的地铁站域活力。公交站点密度、容积率、连通性、路网密度、功能密度是组成地铁站域综合活力的重要因素。完善的公交站点和路网,为人们在站域内活动提供便利性和多样性,对地铁站域活力产生积极影响。地铁站点的连通性越高,说明进出站及换乘步行时间越短,站域被客流途经的概率越高,人群在站域内活动的可能性越大,则越有利于产生活力。容积率越高,表明建筑物的利用面积和使用效率越高,能够为各个行业带来更高的容纳能力,可承载更多的人口数量,对地铁站域活力的营造具有有效的促进作用。功能密度越高的区域对周边区域的辐射影响越强,而对人群产生强烈虹吸作用,吸引人群前往该区域活动、驻留[21],进而产生较高的地铁站域活力。建筑占地密度则是构成地铁站域活力的一般因素。这些因素均在一定程度上差异化地影响地铁站域活力。
3 基于活力值的站域类型识别
3.1 地铁站域活力聚类分析
由图4可知,西安市145个地铁站域可分为4种类型:人群活动和建成环境活力值均低于平均水平的地铁站域为孕育型站域;人群活动活力值高但建成环境活力值低或人群活动活力值低但建成环境活力值高的地铁站域为成长型站域;人群活动和建成环境活力值相匹配为平衡型站域;人群活动与建成环境活力值显著高于平均水平,但总活力值仍不高的站域为乳熟型站域(乳熟指处于成熟初期尚未完全成熟的站域)。数量和占比从高到低依次为孕育型站域50个(34.48%)、成长型站36个(24.83%)、乳熟型站域34个(23.45%)、平衡型站域25个(17.24%)。
图4
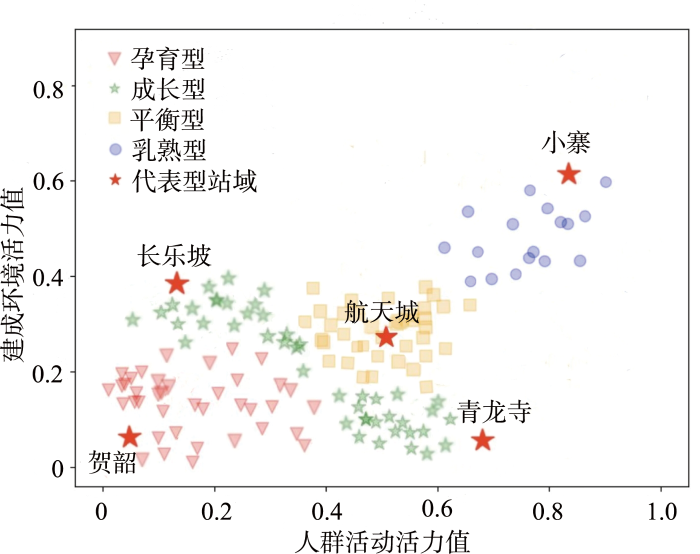
图4
西安市地铁站域活力聚类结果
Fig.4
Clustering results of metro station domain vitality in Xi'an City
3.2 地铁站域类型空间分布特征
使用ArcGIS软件将分类结果进行专题制图,得到各类站域的空间分布情况(图5)。总体来看,西安市地铁站域类型呈中心—外围的分布特点,中心区域多为乳熟型和平衡型站域,外围地区站域多为成长型和孕育型。从分布的城区来看,莲湖区、碑林区、新城区及雁塔区作为西安市核心区,城市化程度高,城市功能齐全,乳熟型站域集中分布,平衡型站域分散分布;未央区和灞桥区分别作为西安市主城区之一,4种类型站域交错分布;长安区和临潼区作为西安市外围区域,主要分布着孕育型和成长型站域。
图5
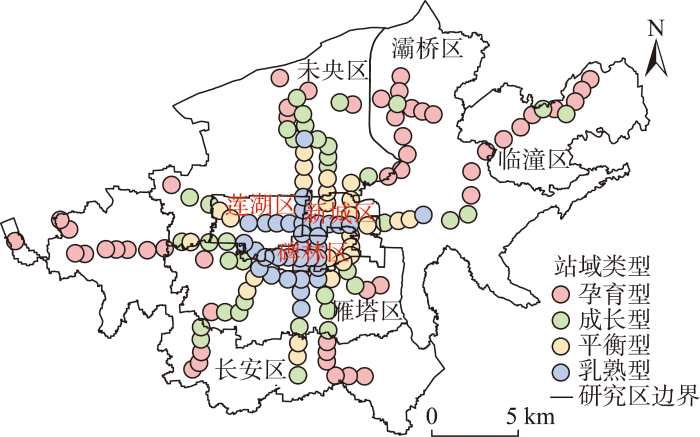
图5
西安市地铁站域类型空间分布⑤
⑤ 孕育型站域包含镐京、欢乐谷、斗门、文教园、高桥、鹦鹉寺公园、秦陵西、沣西文化公园、航天新城、奥体中心、凤凰池、新寺、贺韶、航天东路、东马坊、保税区、新筑、文景山公园、西安国际医学中心、港务大道、创新港、神舟大道、紫霞三路、渭河南、复兴大道南、王寺、务庄、洪庆、香湖湾、田王、马腾空、芷阳广场、仁村、浐灞中心、国际港务区、东长安街、北辰、元朔路、银桥大道、东三岔、西花园、桃花潭、郭杜西、飞天路、后卫寨、凤城十二路 、航天大道、黄渠头、鱼化寨、丈八六路;成长型站域包含丈八北路、余家寨、运动公园、延平门、汉城南路、文景路、丈八一路、广泰门、丈八四路、三桥、市中医医院、省体育馆、三爻、皂河、百花村、凤城九路、西部大道(西太路口)、北苑、金滹沱、青龙寺、西安北站、双寨、华清池、大唐芙蓉园、韦曲南、长乐坡、理工大曲江校区、西工程大·西科大(临潼校区)、造字台、曲江池西、香王、灞柳二路、西安工大·武德路、常青路、阿房宫南、西窑头;平衡型站域包含万寿路、含元殿、石家街、汉城路、太乙路、半坡、长乐公园、延兴门、北池头、凤城五路、咸宁路、浐河、甘家寨、木塔寺、石桥立交、枣园、大明宫、大明宫西、辛家庙、胡家庙、航天城、凤栖原、大明宫北、市图书馆、雁翔路北口;乳熟型站域包含北大街、科技路、小寨、通化门、南稍门、钟楼、永宁门、建筑科技大学·李家村、大雁塔、西北工业大学、体育场、大差市、纺织城、行政中心、和平门、安远门、玉祥门、朝阳门、纬一街、会展中心、西安科技大学、金光门、龙首原、省人民医院·黄雁村、太白南路、文艺路、边家村、吉祥村、洒金桥、开远门、劳动路、康复路、五路口、丰庆公园。
Fig.5
Spatial distribution of metro station domain types in Xi'an City
3.3 地铁站域类型特征
孕育型站域主要分布在城市外围区,地铁站点投入使用时间较晚。此类站域在人群活动和建成环境2个活力维度上均表现不佳,通过具体分析可知(表3),孕育型站域指标除功能混合度外,其他指标平均值均低于其指标所有站域的总平均值,其中人群活动热度、公交站点密度、功能密度、容积率、建筑密度、可达性较为突出,最具代表性的站域如贺韶站。此类地铁站域普遍存在站点建设早于社区建设、人口密度低、周边土地未完全开发、城市空间利用率不足、服务设施不完善等问题。
表3 不同地铁站域类型各指标平均值与总平均值对比
Tab.3
| 站域类型 | x1 | x2 | x3 | x4 | x5 | x6 | x7 | x8 | x9 |
|---|---|---|---|---|---|---|---|---|---|
| 孕育型 | 0.16 | 0.11 | 0.16 | 0.05 | 0.69 | 0.07 | 0.05 | 0.29 | 0.19 |
| 成长型 | 0.47 | 0.23 | 0.34 | 0.14 | 0.55 | 0.18 | 0.16 | 0.58 | 0.20 |
| 平衡型 | 0.63 | 0.19 | 0.46 | 0.24 | 0.61 | 0.34 | 0.26 | 0.75 | 0.25 |
| 乳熟型 | 0.79 | 0.32 | 0.53 | 0.45 | 0.52 | 0.65 | 0.32 | 0.88 | 0.38 |
| 总平均值 | 0.46 | 0.20 | 0.34 | 0.20 | 0.60 | 0.28 | 0.18 | 0.57 | 0.24 |
注:总平均值指各指标4种类型站域即所有站域的平均值。表内数值均经过归一化处理,其中:x1为热力平均值;x2为路网密度;x3为公交站点密度;x4为功能密度;x5为功能混合度;x6为容积率;x7为建筑密度;x8为可达性;x9为通达性。
成长型站域邻近中心区,功能密度、功能混合度、容积率、建筑密度和通达性低于总平均值(表3),一部分站域内个别社区未建设成熟,服务设施容纳空间少,从而功能密度较低,如长乐坡站;一部分为旅游景区型站域,如青龙寺站等,社区、商业区的开发建设强度低,功能设施类型较为单一。另外一些站域内的站点出入口并未建设完全,如韦曲南、香王等,且该类型站域所含换乘站点较少,因此通达性相对较差。
平衡型站域主要位于中心区的外围,路网密度低。此类站域由于开通时间较早,站域内土地利用及建筑建设较为成熟,可利用空间较低,因此路网密度相对较低,如航天城站。
乳熟型站域主要位于城市核心区,且大多邻近发展成熟的社区,站点开通时间较早,此类型站域拥有高人口活动热度,同时站域及站点本身建设较为完善,主要存在的问题是站域内部设施类型分布不够均衡,如小寨站域内商业占比高达72.57%,功能混合度有待进一步提高和完善。
将4种地铁站域类型进行对比,除路网密度、功能混合度外,其余指标测算值均表现出乳熟型>平衡型>成长型>孕育型。其中,路网密度为乳熟型>成长型>平衡型>孕育型,平衡型站域道路密度小于成长型,可能与道路长度的增速低于道路面积的增速有关,西安市在2016年将交通建设用地面积占市区面积调整升至15.6%,虽呈现出较快的发展态势,但交通建设的扩容比扩长增密力度大,存在大量的“断头”路。功能混合度为孕育型>平衡型>成长型>乳熟型,这可能与站域发展程度有关,地铁站点开通时间早且空间发展接近成熟的站域土地腾挪困难,功能设施类型较为单一,而处于规划建设中的站域土地利用结构更加灵活多样。
4 结论和讨论
4.1 结论
本文基于人群活动和建成环境2个维度构建指标体系,利用百度热力图、POI等多源数据,运用熵值法、综合评价等方法,通过研究西安市145个地铁站域活力及其时空间特征,结果发现:
(1) 地铁站域综合活力不足,数量随着活力等级的提高先增加后减少,第三、四等级活力的地铁站域的数量和占比高于第一、二、五等级活力,站域活力在空间分布上不均衡。
(2) 时间分布特征上,地铁站域的工作日和休息日活力呈现明显的“上升、稳定和衰退”的演变特征,但两者在3个阶段的起始时间、持续时长、活力强度方面均显现出一定的差异。相比工作日而言,在活力上升期,休息日活力值起点低,时间相对延后,持续时间长;在活力稳定期,休息日早于工作日且地铁站域活力更强;活力衰退期稍早于工作日。
(3) 空间分布特征上,地铁站域活力呈现中心—外围的空间结构,空间分布不均衡,中心强、四周弱。从不同地铁线路来看,贯穿西安南北方向的2号地铁线站域平均活力最强,其次为东西方向的1号地铁线站域,东北—西南方向的3号线地铁站域活力相对略弱。各条线路首尾段的站域活力值普遍较低,地铁线开通时间早的站域活力值高。地铁换乘站域、旅游区地铁站域、大学聚集区接驳站域活力强。
(4) 活力评价的指标作用不同。功能混合度、地铁可达性、人群活动热度是地铁站域活力构成的的核心要素,公交站点密度、容积率、地铁连通性、路网密度、功能密度是地铁站域综合活力组成的重要因素,建筑占地密度则是构成地铁站域活力的一般因素。
(5) 地铁站域的类型可分为4类:孕育型、成长型、平衡型、乳熟型,在空间上呈现中心—外围分布特点。核心城区中乳熟型集中分布,平衡型站域分散分布,主城区中4种类型站域交错分布,外围区域则主要分布孕育型和成长型站域。
4.2 讨论
根据4类地铁站域的发展特征,未来更新改造的侧重有所不同。乳熟型地铁站域应进一步优化,在规划设计中,鼓励发展TOD社区的混合型社区模式,通过微改造的手段植入多元功能来增强功能混合度,并充分挖掘空间具有更新潜力的特征元素,创建新的活力源,实现成熟型站域目标。平衡型地铁站域缺乏突出的优势,应全面提升各项指标发展质量,在基础设施建设完善的基础上,进一步发展居住区便民服务的居住区中心和居民商圈,并通过增加或创造一定的就业岗位,提高地铁站点和站域内的综合服务能力等吸引人口;在相对薄弱的交通路网方面,通过合理采用立体化的设计,例如修建立体交通网和在固定时间增设大量交通接驳系统。成长型和孕育型的地铁站域应逐步改造各项指标,提高用地强度,合理配置地铁站域内不同类型设施的数量和规模,优化土地利用结构和产业结构,增设地铁换乘线路和共享单车、公交站点,提高通达性水平等。
本文在已有城市空间活力研究的基础上,科学合理地构建了系统精细化的评价指标体系,结合大数据技术,深入分析了西安市地铁站域活力。在指标选取上,和以往研究如叶锺楠等[14]和周雨霏等[16]基于百度热力图数据的地铁站域活力测量指标研究具有明显差异,得到地铁站域活力呈现中心强四周弱、线路首尾段活力低于其他站域的结论,与付栋文等[13]利用POI密度和区位测度的南昌地铁站周边空间活力研究相一致,但又进一步发现不同路线和不同性质的地铁站域活力显著不同。本文主要从物质环境方面解释站域活力的影响因素,功能混合度、地铁可达性、人群活动热度是西安市地铁站域活力的核心组成部分,不同于徐磊青等[15]从空间微观品质分析对轨交站域活力的影响以及徐婉庭等[2]指出的影响北京市地铁站域活力的街道属性因素。本文无论是在理论研究的完善还是在对研究区域的探索方面都发挥着重要的补充作用,为未来地铁站域的更新与规划提供了一些新思路,但受现阶段数据获取等条件的限制,也存在一些不足。例如,人群活动热度是地铁站域活力热度构成的核心要素,且地铁站域活力的日变化特征和通勤时间具有明显的耦合关系,未来可进一步聚焦到轨道交通的通勤流向及其空间格局对城市活力的影响。此外,地铁主要解决城市客流,因此,场站选择更多地与居住区分布相关,其规模与城市其他功能用地的相互关系(尤其是与工作地、大型商业空间、公共服务设施等)是决定场站服务力和吸引力的关键,未来可结合问卷调查和访谈数据、手机信令数据等,探索和构建场站、人群活动与建成环境之间的交互关联,深入挖掘和明晰地铁站域活力的影响机制和作用路径,结合实际为城市空间高质量发展进一步提供科学有价值的发现和建议。
致谢
真诚感谢匿名评审专家在论文评审中所付出的时间和精力,对完善研究思路、指标选取、文字表述等方面提出的宝贵意见和建议,使本文获益匪浅。
参考文献
轨道站点地区TOD规划管理中的指标控制
[J].
Indices control of TOD planning management
北京地铁站域活力影响因素探讨
[J].
Discussion on influencing factors of vitality of Beijing subway station area
基于多源数据的地铁站域活力评价方法研究
[J].
Research on the method of metro station vitality evaluation based on multi-source data
Seoul's Wi-Fi hotspots: Wi-Fi access points as an indicator of urban vitality
[J].
Assessing urban quality: A proposal for a MCDA evaluation framework
[J].DOI:10.1007/s10479-017-2738-2 [本文引用: 1]
长江中游城市群城市活力水平空间格局及影响因素
[J].
DOI:10.3969/j.issn.1004-9479.2020.01.2018442
[本文引用: 1]

地理“大数据”的出现为研究城市问题提供了新的契机。基于兴趣点(POI)和位置服务(LBS)的地理“大数据”,采用空间计量模型、数理统计分析等方法,尝试探讨了长江中游城市群城市活力水平及其影响因素。结果表明:①长江中游城市群城市活力整体处于较低水平,武汉、南昌和长沙中心地位突出,城市群边缘形成片状活力“洼地”的空间格局;②长江中游城市群城市活力与经济发展水平存在耦合关系,低度耦合城市少,较高度耦合和高度耦合城市较多;③高校资源、经济密度、基础设施水平和信息化程度4个因素是影响长江中游城市群城市活力的主要因素,各因素的影响效应具有空间异质性。
Spatial pattern and influencing factors of urban vitality in the middle reaches of the Yangtze River
DOI:10.3969/j.issn.1004-9479.2020.01.2018442
[本文引用: 1]
The emergence of geographic “big data” provides a new opportunity to study urban issues. Based on the geographic “big data” of interest point (POI) and location service (LBS), spatial measurement model and mathematical statistics analysis are used to explore the urban vitality level and its influencing factors in the UAMRYR. The results show that: (1) the urban vitality of the urban agglomerations in the UAMRYR is at a low level, and the centers of Wuhan, Nanchang and Changsha are prominent, and the spatial pattern of flaky vitality is formed at the edge of the urban agglomeration. (2) There is a coupling relationship between urban vitality and economic development level in the UAMRYR, and there are few low-coupling cities. There are more cities with higher degrees of coupling and highly coupled cities.(3)The four factors of university resources, economic density, infrastructure level and informatization degree are the main factors affecting the urban vitality of the UAMRYR. The influence effect of each factor has spatial heterogeneity.
内蒙古城市活力时空格局及影响因素研究
[J].
DOI:10.3969/j.issn.1004-9479.2023.03.2020892
[本文引用: 1]
城市活力作为刻画城市社会经济发展的重要指标,其定性定量分析已成为研究热点。基于POI数据与夜间灯光遥感数据,运用空间可视化和空间统计分析方法对内蒙古城市白天及夜间活力水平、规模、结构及时空耦合进行测度,并深入分析其空间格局及影响因素。结果表明:①内蒙古城市大部分城市活力态势不佳,两极分化明显,活力规模位序转换显著,呈现非均衡化发展特征;②活力强度整体上以“扎赉特旗-阿拉善左旗”为分界,形成“南高北低”的分布格局。时空耦合强度呈层状由市中心逐渐向外递减扩散;③经济密度、三产占比、信息化程度、科技实力4个因素对内蒙古城市活力空间分异格局的影响较为显著,均具有明显的时空依赖特征。依据研究结果,结合内蒙古城市发展实际,提出相应政策建议。
A study on the spatiotemporal pattern of urban vitality in Inner Mongolia and its influencing factors
DOI:10.3969/j.issn.1004-9479.2023.03.2020892
[本文引用: 1]
The qualitative and quantitative analysis of urban vitality, as an important indicator of urban social and economic development, has become a research hotspot. Based on POI data and remote sensing data of night light, this paper used spatial visualization and spatial statistical analysis methods to measure the level, scale, structure and spatio-temporal coupling of daytime and night urban vitality in Inner Mongolia, and further analyzed the influencing factors of its spatial pattern. The results show that: (1) Most cities in Inner Mongolia are not very dynamic, and the phenomenon of polarization is obvious. The change of the order of vitality scale is significant, showing the characteristics of unbalanced development. (2) The distribution pattern of vitality intensity was "high in the south and low in the north", which was divided by "Zhalainte Banner-Alashan Left Banner". The spatial and temporal coupling intensity is layered and gradually diffused from the downtown to the outside. (3) The economic density, the proportion of tertiary industries, the degree of informatization, and the strength of science and technology have a significant impact on the spatial pattern of urban vitality in Inner Mongolia, all of which have obvious spatio-temporal dependence characteristics. Based on the research results and the actual urban development in Inner Mongolia, the corresponding policy suggestions are put forward.
街道活力的量化评价及影响因素分析: 以成都为例
[J].
Quantitative evaluation on street vibrancy and its impact factors: A case study of Chengdu
基于手机信令数据的城市滨水空间活力研究: 以苏州金鸡湖为例
[J].
Research on urban waterfront space vitality based on mobile phone Signaling data: A case study of Jinji Lake in Suzhou
基于多源数据的城市公园时空活力与影响因素测度: 以南京为例
[J].
Spatiotemporal vitality and influencing factors of urban parks based on multi-source data: A case study of Nanjing
基于居民时空行为的社区日常活动空间测度及活力影响因素研究: 以南京市沙洲、南苑街道为例
[J].
DOI:10.18306/dlkxjz.2021.04.004
[本文引用: 1]
新时期人本导向的社区生活圈规划转型关注居民的日常活动对社区空间的利用情况,从而反映出居民对社区公共服务设施的使用需求。但目前研究较少关注不同类型居民的差异化时空行为特征,不能有效应对社区居民的差异化需求。论文结合行为地理学的理论,利用手机信令数据,基于居民出行活动的频率和密度测度其核心活动空间和弹性活动空间,分析不同类型人群日常活动特征。以南京市沙洲和南苑街道为例,划定不同社区中,青少年、青年、中年和老年群体的日常活动空间,并从日常活动范围和活力的视角分析居民对社区空间利用的基本特征及群体间差异。研究结果表明,居民的日常活动空间表现出层次性、共享性和方向性,且不同年龄群体的日常活动空间存在显著差异;进一步利用相关性检验分析不同群体社区活力的影响因素,提出考虑不同群体活动空间和设施需求的公共服务设施差异化供给策略。研究有助于完善基于居民时空间行为测度社区日常活动空间的方法,丰富对社区居民差异化行为需求的认知。实证研究的结论对基于居民差异化空间和设施需求的社区公共服务设施配置具有一定指导意义。
Measurement of community daily activity space and influencing factors of vitality based on residents' spatiotemporal behavior: Taking Shazhou and Nanyuan streets in Nanjing as examples
DOI:10.18306/dlkxjz.2021.04.004
[本文引用: 1]
In the new era of China's development, people's needs for living space have become diversified. At the community level, the transformation of the planning of a human-oriented community life circle needs to pay attention to residents' daily activities to use the community space, thereby reflecting residents' use of community public service facilities. This demands to identify the daily activity space of residents. However, current research has paid little attention to the differentiated spatial and temporal behavior characteristics of different types of residents, and cannot effectively respond to the diverse needs of community residents. Based on the theory of behavioral geography, this research proposed a method of using mobile phone signaling data to measure the core activity space and flexible activity space based on the frequency and density of residents' travel activities, and then analyze the characteristics of daily activities of different types of people. Taking Shazhou and Nanyuan streets in Nanjing City as examples, the daily activity space of adolescent, youth, middle-aged, and elderly resident groups in different communities was delineated, and the basic characteristics of residents'use of community space were analyzed from the perspective of daily activity range and vitality differences among groups. The research results show that the daily activity space of residents shows hierarchical, sharing, and directional features, and there are significant differences in the daily activity space of different age groups. Further, by using the correlation test to analyze the influencing factors of the vitality of different groups of the communities, we proposed a differentiated supply strategy for public service facilities that considers the activity space and facility needs of different groups. This research is helpful for improving the method of measuring the daily activity space of community based on the spatiotemporal behavior of residents, and enriching the understanding of the diverse behavior needs of community residents. The conclusions of the empirical research have certain guiding significance for the allocation of community public service facilities based on residents' diverse space and facility needs.
地铁站域地下商业空间活力影响因素及活力提升策略研究
[J].
A study on the factors influencing the spatial vitality of underground commercial space in metro area and the strategies to improve the vitality
基于POI数据的城市轨道交通站点活力研究
[J].
DOI:10.16503/j.cnki.2095-9931.2021.06.008
[本文引用: 2]
为促进城市轨道交通站点设施与周边业态在空间布局上协同发展,从站点周边区域服务设施数量与教育、医疗等社会公共服务获取便利性这两个维度出发,利用兴趣点数据构建了轨道交通站点周边空间活力评价模型。以南昌市为例,利用ArcGIS软件与Python,对其轨道交通站点活力分布特征进行了定量分析,然后对轨道交通站点进行聚类。结果表明,南昌市轨道交通站点周边空间活力分布不够均衡,老城区的轨道交通站点活力总体优于其他区域,线路首末段站点活力多数低于中间段站点。此外,不同类别站点的周边空间活力存在显著差异,活力显著较低的站点数量占比大,高达33%;活力相对均衡的站点数量占比较小,仅为20%。根据站点活力评价结果,从提升公共交通导向式土地开发(Transit Oriented Development, TOD)效益层面出发,对南昌市轨道交通站点周边设施建设规划提出针对性建议。
Vitality of urban rail transit stations based on POI data
DOI:10.16503/j.cnki.2095-9931.2021.06.008
[本文引用: 2]
In order to promote the coordinated development of urban rail transit station facilities and surrounding business in spatial layout, based on the two dimensions of the number of service facilities around stations and the convenience of access to social public services such as education and medical treatment, a vitality evaluation model of the surrounding space of urban rail transit stations was constructed by using POI(Point of Interest) data. Taking Nanchang as a study case, the vitality distribution characteristics of urban rail transit stations were quantitatively analyzed by ArcGIS and Python, then the urban rail transit stations were clustered. The results show that the spatial vitality distribution around the urban rail transit stations in Nanchang is extremely uneven. The vitality of rail transit stations in the old urban area is generally bigger than that of stations in other regions, and the vitalities of the start and end stations of the lines are mostly lower than those in the middle sections. In addition, there are significant differences in the surrounding space vitality of different types of stations. The number of stations with significantly low vitality accounts for a large proportion, up to 33%; the number of stations with relatively balanced vitality accounts for a small proportion, only 20%. Based on the results of site vitality evaluation, from the perspective of improving the benefits of urban rail transit TOD(Transit Oriented Development), some planning suggestions for surrounding facilities construction of the urban rail transit in Nanchang are proposed.
基于网络数据的轨道交通站点周边空间使用量化研究: 以上海地铁10号线沿线为例
[J].
Quantitative study on space use around urban rail transit station based on network data: A case of Shanghai metro line 10
公共空间密度、系数与微观品质对城市活力的影响: 上海轨交站域的显微观察
[J].
The impact of density, ratio and microcosmic quality of public space on urban vitality: Microscopic observation of Shanghai rail transit station areas
基于热力图数据的轨道交通站点服务区活力测度研究: 以深圳市地铁为例
[J].
Evaluating vitality of metro station service area with heat map: A case study on Shenzhen subway
TOD与可持续发展
[J].
Transit-Oriented and sustainable development
基于百度热力图的街道活力时空分布特征分析: 以江西省南昌市历史城区为例
[J].
Analysis of temporal and spatial distribution characteristics of street vitality based on Baidu thermal diagram: The case of the historical city of Nanchang City, Jiangxi Province
基于多源数据的城市活力空间特征及建成环境对其影响机制研究: 以深圳市为例
[J].
DOI:10.13284/j.cnki.rddl.003406
[本文引用: 2]
采用城市POI、手机信令数据及夜间灯光遥感数据,以深圳市为例,构建城市活力度量指标分析城市活力的空间特征。构建“5D”指标体系度量城市建成环境,并运用地理探测器,探究建成环境对城市活力的影响机制。结果表明:1)深圳市城市综合活力显示出“南强北弱,西强东弱”的空间分异特征,空间分布极不均衡。城市综合活力最主要反映的是社会活力。2)城市综合活力、经济活力、社会活力、文化活力均受到建成环境的显著影响。高POI密度、高建筑密度、高平均建筑层数和高土地利用混合度对城市活力具有显著促进作用。3)居住人口密度与路网密度、土地利用混合度与路网密度等交互作用对城市活力产生更为积极的影响。4)在影响机制中,建筑密度、平均建筑层数为底层支撑因素,POI密度、土地利用混合度为直接驱动因素,居住人口密度为诱发因素,距行政区中心距离、交叉口密度、路网密度、地铁站点密度和公交站点密度为调节因素。
Spatial features of urban vitality and the impact of built environment on them based on multi-source data: A case study of Shenzhen
DOI:10.13284/j.cnki.rddl.003406
[本文引用: 2]
As a key index to evaluate whether a city is attractive or has a healthy, comprehensive, and sustainable development potential, urban vitality is critical to the future development and construction of a city. Exploring the mechanism of how the built environment influences urban vitality from the perspective of urban morphology can be conducive to future urban space planning and design and can provide city planners with quantitative and scientific decision-making support. This study uses urban POI, cellular signaling, and nighttime light remote sensing data from Shenzhen to measure its cultural, social, and economic vitality, which constitutes a comprehensive vitality assessment of the city. Spatial features of these urban vitalities were then analyzed to further illustrate their distribution patterns. Using Bivariate Moran's I method, the spatial autocorrelations between economic, social, and cultural vitality were calculated. From the five dimensions of Density, Design, Diversity, Distance to Transit, and Destination Accessibility, the 5D detection index system was constructed to measure the urban built environment. This study also used GeoDetector to detect and analyze the spatial differentiation between various built environmental factors and comprehensive, economic, social, and cultural vitality and to explore the mechanism of the influence of the built environment on urban vitality. The results show that: 1) The spatial distribution of comprehensive vitality is extremely uneven in Shenzhen, with a higher vitality in the southern and western regions of Shenzhen city and a lower vitality in the northern and eastern regions. Areas with higher comprehensive vitality usually developed along the main roads and metro lines and are distributed in strips along the coastline of central-southern and western Shenzhen. The high-value areas of the urban comprehensive vitality center are primarily concentrated in city- or district-level commercial centers, and employment centers. Comprehensive vitality in Shenzhen reflects social vitality. 2) Urban comprehensive, economic, social, and cultural vitality are significantly affected by the built environment, as indicated by the 5D system. High POI and building density, average building floors, and land use entropy, have significant positive impacts on urban vitality. However, residential population density did not have a significant impact on each aspect of urban vitality. 3) Some interactions between built environment factors had a greater impact on urban comprehensive vitality, such as residential population density, road network density, land use entropy, and road network density. Overall, the interaction between building density, average building floors, land use entropy, and other factors, have a more positive impact on each aspect of urban vitality. 4) The presentation of urban comprehensive vitality is the result of multiple dimensions and factors. In the influencing mechanism of urban comprehensive vitality, building density and average building floors were the fundamental factors. POI density and land use entropy were the direct driving factors. Residential population density was an inducing factor. Distance from the administrative center, intersection density, road network density, metro station density, and bus station density were adjustive factors. The research results therefore provide valuable suggestions for the optimal allocation of resources and the rational layout of urban functional facilities in Shenzhen.
基于大数据的上海中心城区建成环境与城市活力关系分析
[J].
DOI:10.13249/j.cnki.sgs.2020.01.008
[本文引用: 1]
运用大众点评数据、出租车到达数据与文化设施POI数据测度城市活力的经济、社会和文化维度,在街区和街道层面分析城市活力的空间结构特征,建立计量模型分析城市建成环境对城市活力的影响关系。结果表明:①上海中心城区城市活力表现出明显的空间差异,主要表现为由中心向四周递减、浦西优于浦东的总体特征;②街区和街道尺度影响城市活力的建成环境因素存在差异;③街区尺度建成环境对城市社会、经济和文化活力的影响存在差异:提升人口密度对经济活力具有正面影响,过高的人口密度可能不利于社会和文化活力发展;增加POI密度、路网密度和POI混合度有利于城市活力的提升;建筑层数和建筑密度的增加会降低街区的社会活力和文化活力,但会提升街区的经济活力;交通可达性有利于经济活力的提升。
Relationship between built environment and urban vitality in Shanghai downtown area based on big data
DOI:10.13249/j.cnki.sgs.2020.01.008
[本文引用: 1]
Research on urban vitality has drawn more attention from different disciplines and perspectives such as urban geography, urban planning and urban government. Urban vitality is not only an important symbol of urban sustainable development, but also an important factor for cities to retain high-skilled talents, which could improve the competitiveness of the city. Studying urban vitality is conducive for us to re-understanding the city in a new perspective and improving urban human-oriented planning and management for the government, especially for some megacities and international cities which contain a large population. Urban vitality, consisting of economic vitality, social vitality and cultural vitality, reflects the level of urban development capacity and quality of life, which is also closely related to the citizens. In order to discover the urban vitality in Shanghai, this paper uses multi-source data, including dianping’s data which counts the number of businesses in the studying area to reflect the economic vitality, urban taxi arrival data in one week to reflect the social vitality and cultural facilities data in the studying area to reflect cultural vitality, to measure urban vitality from two scale: both block and sub-district level. Based on this comprehensive measurement, this article intends to analyze the spatial outcome characteristics of urban vitality in different blocks and sub-districts. This article also establishes a regression models for analyzing the impact mechanism of urban built environment which consists of multiple elements on urban vitality. It is found that the urban vitality of Shanghai is higher in the central area, decreasing from the central area to the surrounding area in the city. In the meanwhile, the value of urban vitality in Puxi area is higher than Pudong area, which means the daily activities and communication in Puxi area are more dynamic than these in Pudong area. Apart from differences between Puxi and Pudong areas, there are also distinctions regarding to the factors of built environments effecting the urban vitality between block level and street level. On the block level, it is found that the built environments effect significantly to different types of urban vitality and the comprehensive vitality. What’s more, for each vitality, the effect shows in different ways. Specifically, the increase of population density will influence the urban vitality by firstly in an active way then in a passive one. Especially for social and cultural vitality, the high density of population is not beneficial. For the facilities, increase of POI density and road network density presenting completeness and POI mixing degree presenting the variety of land use will promote all kinds of the vitality and comprehensive vitality. In the respect of the design, the increase of average building layers and building density will reduce the social vitality and cultural vitality, but will enhance the economic vitality and comprehensive vitality of the block at the same time. And in terms of the access to public transportation, the distance to the nearest bus station will increase the economic vitality of the block. According to the discoveries about the spatial pattern and the effecting factors of urban vitality, this article proves improving the built environment is meaningful to the development of urban.
基于大数据的城市功能区人口时空聚散模式研究
[J].
Study on spatiotemporal aggregation and dispersion patterns of population in different urban functional areas based on big data
利用地理标签数据感知城市活力
[J].
DOI:10.11947/j.AGCS.2020.20190051
[本文引用: 1]
高度活跃的城市是社会稳定发展的基础。基于地理标签感知的城市活力能够量化城市发展现状,探索城市活力的影响机制,为精细化城市治理提供技术支撑。传统城市活力研究依赖于街区的活力调查,时间长,费用高。本文研究利用兴趣点和社交媒体签到等地理标签数据,提出了城市活力度量指标,探索性分析城市活力的分布模式。基于土地利用、道路和建筑物等数据计算建成环境指标,构建城市活力和建成环境之间的普通线性回归与空间自回归模型,揭示了影响城市活力的建成环境因素。基于深圳市的试验结果表明:兴趣点和社交媒体签到数据能够较好地指示城市活力。深圳市的城市活力主要受商业用地、工业用地、土地混合利用以及路网密度、地铁站点密度的影响。住宅用地和建筑物占地密度对基于POI的城市活力具有显著影响。
Sensing urban vibrancy using geo-tagged data
DOI:10.11947/j.AGCS.2020.20190051
[本文引用: 1]
Promoting neighborhood vibrancy is vital for urban development. Recently, geotagged data provide unprecedented opportunities for discovering urban vibrancy patterns and their affecting mechanism. However, traditional urban vibrancy studies rely on fields survey therefore are time-consuming and highly-cost. This study constructs two urban vibrancy indices using point-of-interest and social media check in data. The spatial patterns of urban vibrancy are explored with spatial auto-regression analytic. Ordinary regression models (OLS) and spatial autoregression models (SAM) are established for revealing the influences of built environment on urban vibrancy by using geospatial data such as land use, roads and buildings. An empirical study in Shenzhen was implemented. The results show that:commercial land, industry land, mixed land use, the road density, and metro stations are five main factors highly influencing Shenzhen vibrancy. Residential land use and building footprints only have significant effects on vibrancy exhibited by POI. These exploratory findings demonstrate that urban vibrancy should be assessed and improved for different consideration.
再论“空间句法”
[J].
On "Space syntax"
Quantitative assessment method on urban vitality of metro-led underground space based on multi-source data: A case study of Shanghai inner ring area
[J].
深圳市轨道交通结构与商业活力空间关联分析
[J].
Spatial correlation between rail transit structure and commercial vitality in Shenzhen
DOI:10.2307/141859 URL [本文引用: 1]
中国城市化水平的综合测度及其动力因子分析
[J].
Comprehensive evaluation and the driving factors of China's urbanization
DOI:10.11821/xb200904001
[本文引用: 1]
From the essential meaning of urbanization, this paper establishes a comprehensive evaluation index system, including four aspects changing: population, economy, society and land. Based on the method of entropy, the measure and evolution of China's urbanization are analyzed since 1981. The results show that China's comprehensive urbanization level continues improving. Economic growth and geographical landscape are the main features of rapid evolution of urbanization, followed by the population urbanization, and the medical care level of social urbanization is the least advanced. The evolution of all the four subsystems has unique characteristics. The analysis of multiple regression model shows that the driving factors have been diversified. The market force is the most powerful driving force of China's urbanization, followed by intrinsic force, administration force, exterior force. From different stages of urbanization, the effects of market force, exterior force and the administration force on urbanization are increasing, while intrinsic force is decreasing. China's urbanization is the main endogenous process, hence more policies should be formulated to strengthen the market economy reform and coordinate urban and rural development.
基于多源夜间灯光数据的城市活力与城市扩张耦合关系研究: 以海峡西岸城市群为例
[J].
Research on the coupling relationship between urban vitality and urban sprawl based on the multi-source nighttime light data: A case study of the west Taiwan Strait urban agglomeration
Space syntax: Standardised integration measures and some simulations
[J].DOI:10.1068/b200347 URL [本文引用: 1]
基于位置服务数据的城市活力研究: 以北京市六环内区域为例
[J].
Study on urban vitality based on LBS data: A case of Beijing within 6th ring road
