

海洋经济是高质量发展战略要地,中国海洋经济发展要从追求经济总量扩张的单一维度向经济发展、社会公平、生态环境改善等多维度协调发展转变。海洋经济全要素生产率作为反映海洋发展结构优化、技术进步、管理创新的重要指标,是高质量发展的核心体现,也是促进其发展的重要动力,具有实现发展与驱动转型双重属性[1]。而全要素生产率的提高不能仅仅依靠资本、劳动力等传统要素驱动,要坚持系统论和全局观,不断探索与发现海洋经济增长新的驱动力。习近平总书记强调,“按照客观经济规律调整完善区域政策体系,发挥各地区比较优势,促进各类要素合理流动和高效集聚,加快构建高质量发展的动力系统”。中国海洋发展研究中心发文指出:西方国家海洋科技对海洋经济增长的贡献率已达60%以上,然而,中国海洋科技贡献率多年来却一直徘徊在30%左右,目前中国海洋经济发展模式仍相对落后,海洋经济高质量发展驱动力仍不清晰①(①
目前经济增长动力方面研究已取得长足发展,主要从3个方面展开:第一,研究内容。早期学者们将经济增长动力主要聚焦在自然资源,如Musibau等[2]发现了自然资源禀赋对西非经济增长的促进效应。近年来,学者们开始关注知识、社会对经济的驱动作用。如Zhou等[3]、李小克等[4]强调了技术进步对经济增长的影响;Rahman等[5]、Zhang等[6] 则验证了人力资本对经济增长的作用;Woodhouse[7]、 Sabatino[8]、孙才志等[9]分别研究了澳大利亚、意大利、中国的社会资本与经济发展之间的关系。新制度经济学者则将制度变量内生化,认为制度也是经济增长的重要动力[10-11]。第二,研究方法。学者们主要运用了DEA模型、Weaver-Thomas模型、PVAR模型等多种方法。如黄金川等[12]利用DEA模型的Malmquist指数方法对城市全要素生产率增长率进行测算并分析增长动力;陈修颖等[13]以Weaver-Thomas模型为依托,分析了浙江省数字经济增长动力。第三,研究尺度。经济动力研究多聚焦于县域经济[14]、农村经济[15]、省域经济[16]等层面和工业经济[17]、向海经济[18]等部门,后又将经济动力研究扩展到港口经济[19]、畜牧业[20]等领域。
现有研究从不同尺度和视角探究不同组织经济增长的动力机制,是对现有关于动力机制研究的有益补充。但仍存在不足:一是缺乏自然、知识、社会、制度4类资本对经济增长共同驱动机制和效应分析,且对制度和社会资本关注较少。但自然资本是发展的基础动力,知识资本提供持续动力,社会资本发挥新生动力,制度资本增强关键动力,海洋经济发展需要4类资本共同驱动,缺一不可。二是较少采用考虑外部环境因素的超越对数生产函数形式的随机前沿(Translog-SFA)模型分析要素驱动经济发展的区域异质性。随机前沿分析由于考虑了生产的非效率,更接近于现实,得到广泛应用,同时采用超越对数生产函数,形式更加灵活且易于对全要素生产率进行分解。三是当前驱动力分析主要集中于农村经济、企业经济、省域经济等层面,有关海洋经济发展驱动力研究较少,与海洋经济发展现实需求脱节。本文针对上述不足创新性地选取自然、知识、社会和制度4类资本及外部环境因素共29个指标构建海洋经济全要素生产率动力指标体系,在考虑区域异质性特征基础上采用Translog-SFA模型实证分析海洋经济全要素生产率的时空演化特征,辨识其驱动力,最终归纳出培育高质量发展动力源的路径,以期为推动海洋经济高质量发展和区域协同发展提供新思路。
1 理论机制
自然资本是发展的基础动力,知识资本提供持续动力,社会资本发挥新生动力,制度资本增强关键动力,海洋经济发展需要这4类资本共同驱动,基于此,探讨这4类资本如何驱动海洋经济发展(图1)。
图1
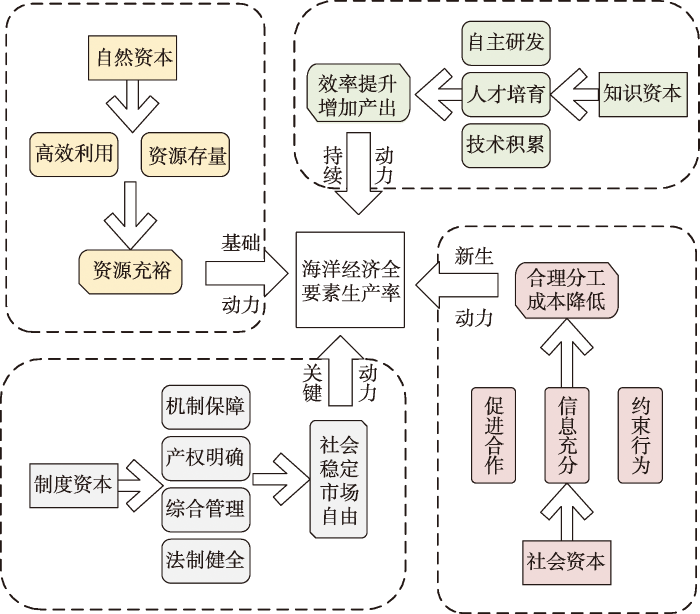
图1
海洋经济全要素生产率的理论机制
Fig.1
Dynamic mechanism of total factor productivity of the marine economy
自然资本。古典经济学认为自然资源禀赋是经济增长的动力,是社会发展的必要性资源。Habakkuk等[21]研究发现,丰富的自然资源禀赋推动了美国经济快速增长,以致赶超英国。然而若经济长期依赖于自然资源,会产生一系列负面效应,即出现“资源诅咒”。但资源开发部门的生产要素配置效率决定了是否会发生资源诅咒效应[22]。当资源开发部门的生产要素配置效率低于生产规模报酬水平时,在依赖自然资源发展的地区,劳动力会大量转移到低效率部门,从而降低制造业部门和研发部门的产出,对创新产生挤出效应,最终阻碍经济增长。反之,劳动力则会趋于流向对技术贡献率较高的制造业部门和研发部门,从而提高技术水平,规避资源诅咒的发生。
知识资本。知识资本包含人力、技术和研发资本等投入要素,因此,从这3个方面分析影响机制。① 研发资本:研发资本投入作用于生产研发部门,从而改进自主研发能力,提高技术存量和研发效率,提升产出。② 人力资本:劳动力投入具有边际收益递减的特性,但优质的人力资源可以在生产管理过程中应用先进知识、技能和经验,提高劳动效率,使整体产出规模报酬递增。③ 技术资本:技术资本为生产提供原始的知识和技术经验积累,在积累到一定程度后进行自主研发,并将研发成果应用于现实生产,提高全要素生产率。此外,技术经验和知识都具有外部性,可以引进或模仿更加先进的技术,扩大生产规模。
社会资本。社会资本主要表现为非正式制度形式[23],如社会网络和信任,通过影响参与人的激励、预期和行为来影响增长。主要有以下几种路径:① 社会资本丰富的地区,公共信任程度高,能聚集不同专业的人群,推进合作,提高效率;② 社会网络完善的地区,信息充分、迅速共享,能协调人们的行动,社会成员也能及时掌握社会的新思想、新动态,进而萌发更多新思路和拥有更多机会;③ 社会资本能促进地区统一规范的建立,约束行为,也能提高该地区对高素质人才的需求,进而提高人力资本水平。
制度资本。制度在经济增长过程中同样具有举足轻重的地位[24]。制度的影响主要通过4种方式来实现:① 制度通过建立要素机制和惩戒机制保障要素高效流动,合理调整要素比例,减少无效率分工和交易摩擦,提升产出效率;② 良好的制度安排可以健全法制,有效限制政府的不当行为和垄断企业的非理性行为,推进市场有序发展;③ 良好的制度设计有助于明确界定产权,将负外部性内部化,改善社会的总体效用水平;④ 良好的制度能够加强海洋综合治理,推进海洋管理工作法制化,促进海洋经济绿色发展。
2 方法和数据
2.1 中国海洋经济增长动力研究方法
假设一个厂商在理想状况下(没有任何效率损失)的产出水平为f(z)——给定投入要素z的最大产出,亦称“理论产出”或“产出边界”。经济个体的“实际产出”和“理论产出”之间的偏离程度称为效率损失[27]。现实中,实际产出q总是低于理论产出 f(z),产出效率(TE)为:
式中
由于现实生活中会产生一些不可抗的随机因素,因此需要增加一个随机干扰项:
式中:
式中:ui=-ln TEi ≥0,指无效率项,则TEi=exp(-ui)。
多数情况下,会施加约束条件
2.2 中国海洋经济增长动力模型设定
经过多年发展,1995年Battese等[28]在初始SFA基础上引入其他环境影响变量,从而可以一步直接获得生产函数和技术效率影响因素的参数估计结果,计算更加简便。
目前,SFA常用的生产函数有Cobb-Douglas生产函数和Translog生产函数。式(5)是Translog生产函数的一般形式,当
式中
2.3 指标选取与数据来源
2.3.1 海洋经济全要素生产率动力指标体系构建
在已有研究中,没有统一的标准来选择海洋经济全要素生产率的投入产出指标。事实上,海洋生产总值(GOP)通常被用作产出指标[29-30],而投入指标因研究背景不同而有所不同。如Ren等[30]从资本、劳动力角度考虑海洋经济的投入;Guo等[29]、Teixeira等[31]从劳动力、技术和资本角度考虑投入。基于古典经济学中生产函数理论及邓路等[32]、孙才志等[33]的研究,本文从自然资本、知识资本、社会资本和制度资本角度考虑海洋经济的投入,这4类资本比传统要素投入更为全面,不仅包括资源、劳动力等传统要素,也包括信息、知识等新型要素,并对其进行明确分类,便于发掘海洋经济发展阶段中主要驱动力及目前各个地区主要驱动力。此外,外部环境对海洋经济全要素生产率的影响也不容忽视,而包容性和协调性反映社会经济环境的公平度和协调度,因此,本文从这2个方面考虑外部环境因素(表1)。
表1 海洋经济全要素生产率驱动要素指标体系
Tab.1
| 目标层 | 准则层 | 指标层 | 指标含义 | 指标指向 |
|---|---|---|---|---|
| 产出 | 海洋经济发展 | 海洋生产总值 | 表征经济发展水平 | 正向 |
| 投入 | 自然资本 | 水资源总量 | 表征水资源量 | 正向 |
| 海水养殖产量 | 表征生物资源量 | 正向 | ||
| 海洋原油产量 | 表征矿产资源量 | 正向 | ||
| 海洋天然气产量 | 正向 | |||
| 海洋化工产品产量 | 表征化学资源量 | 正向 | ||
| 沿海地区旅游社总数 | 表征旅游资源量 | 正向 | ||
| 知识资本 | 海洋发明专利授权数 | 表征科技水平 | 正向 | |
| 海洋科研机构科技论文发表数 | 正向 | |||
| 技术市场成交额 | 正向 | |||
| 15岁以上人口文盲、半文盲率 | 表征教育水平 | 负向 | ||
| 海洋科研机构从业人员 | 表征人才数量 | 正向 | ||
| 海洋专业研究生毕业生 | 正向 | |||
| 社会资本 | 信息网络指数① | 表征信息网络 | 正向 | |
| 每万人拥有社会组织数 | 表征组织网络 | 正向 | ||
| 各地区客运量 | 表征人际网络 | 正向 | ||
| 原保险保费收入 | 表征组织规范程度 | 正向 | ||
| 社会捐赠总额/国内生产总值 | 表征道德规范程度 | 正向 | ||
| 沿海地区信任指数② | 表征社会信任程度 | 正向 | ||
| 制度资本 | 对外开放指数③ | 表征对外开放水平 | 正向 | |
| 非国有产权比重④ | 表征产权结构 | 正向 | ||
| 在线政府指数⑤ | 表征在线服务水平 | 正向 | ||
| 涉海地方性法律立法数 | 表征法制程度 | 正向 | ||
| 政府支出占国内生产总值比重 | 表征市场化程度 | 负向 | ||
| 污染治理项目数 | 表征环境保护程度 | 正向 | ||
| 外部环境变量 | 包容性 | 基尼系数 | 表征居民收入差距 | 负向 |
| 恩格尔系数 | 表征居民生活水平 | 负向 | ||
| 贫困率⑥ | 表征贫困程度 | 负向 | ||
| 协调性 | 区域发展差异系数⑦ | 表征区域发展差异 | 负向 | |
| 海陆经济协调度⑧ | 表征海陆经济协调 | 正向 |
注:① 信息网络指数=宽带用户年均资费×1/2+移动用户年均资费×1/2,宽带用户年均资费为宽带服务收入与宽带用户数的比值,移动用户年均资费为移动用户营业收入与用户数的比值;② 沿海地区信任指数具体表示为
其中:① 自然资本主要是指地区所拥有的海洋自然资源量,是地区海洋经济发展的基础。在考虑有关海洋资源分类基础上,结合数据可获得性,综合水、生物、矿产、化学和旅游资源量5个方面来表征地区海洋资源总量。② 知识资本体现地区发展效率和发展潜力,是经济发展的软实力。美国哈佛大学教授Griliches[34]最早将知识资本作为一种生产要素加入到总生产函数中,随后对人力资本、技术资本与企业生产率的关系进行研究,因此,本文从技术资本、人力资本2个方面选取指标,其中海洋发明专利授权数、海洋科研机构科技论文发表数、技术市场成交额反映了地区的科技创新能力,15岁以上人口文盲、半文盲率反映了地区的教育水平,海洋科研机构从业人员、海洋专业研究生毕业生数则是用来衡量地区的人才充裕程度[35]。③ 社会资本通过创造、维持社会关系和社会组织来增强地区经济发展潜力。Putnam[36]在研究中指出,社会资本的构成要素包括社会网络、社会信任和社会规范。其中信息网络指数、每万人拥有社会组织数、各地区客运量三者共同构成地区的社会网络。原保险保费收入、社会捐赠总额与生产总值之比[9]二者构成社会规范。沿海地区信任指数表征社会信任程度[37]。④ 制度资本是区域海洋经济发展的必要条件。制度质量数据来源于Gwartney等[38],其文章从5个方面测度了制度质量:政府规模、法律结构、产权保护、货币制度、对外贸易及市场监管。考虑数据可得性及与海洋经济关系密切度,选取以下6个指标,其中:对外开放指数反映地区对外开放程度;非国有产权比重反映地区的产权结构;在线政府指数反映政府的在线服务水平;涉海地方性法律立法数表示地区法制程度;政府支出占国内生产总值比重表征市场化程度,是负向指标,比重越小,政府干预程度越低,市场化程度越高;污染治理项目数反映地区的污染治理力度[39]。⑤ 外部环境变量从包容性和协调性2个方面选取。其中:包容性增长的本质是促进社会公平,保障所有经济主体、尤其是穷人的基本社会福利,因此,从居民收入差距、收入水平、贫困度3个方面选取包容性指标;采用用区域差异系数和海陆经济协调度反映地区的协调性发展水平。
2.3.2 数据来源
本文研究对象为中国沿海11个省份(港澳台地区数据暂缺),研究时段为2000—2020年,数据来源于《中国海洋统计年鉴》《中国区域经济统计年鉴》《中国科技统计年鉴》《中国统计年鉴》《中国环境年鉴》,各地区统计年鉴、各地区人民检察院官网以及法律之星网(
3 实证分析
3.1 沿海地区4类资本要素禀赋水平的时空分异
基于海洋经济可持续发展的区域动力系统指标体系,运用熵值法测度2000—2020年间中国沿海地区自然资本、知识资本、社会资本和制度资本4类资本要素禀赋水平的变动趋势。
(1) 从时间和空间2个维度分析4类资本要素禀赋的综合得分
时序分析:如表2所示,沿海地区资本要素禀赋在2000—2020年间平稳上升,没有明显波动。前5年间增速最为缓慢,这时期处于海洋经济探索发展时期,资源开发利用能力、科技水平、海洋管理水平等仍处于较低水平。2006—2010年属于海洋经济快速发展时期,海洋经济初具规模,产业体系日趋完善,但这一时期环境保护观念不足,环境破坏较为严重。2011年至今处于转型发展阶段,党中央多次强调心系海洋、识海兴海、建设海洋强国,推动海洋经济高质量发展。
表2 中国沿海各地区4类资本综合得分
Tab.2
| 地区 | 2000年 | 2005年 | 2010年 | 2015年 | 2020年 | 2000—2020年 增长率/倍 | |||||||||
|---|---|---|---|---|---|---|---|---|---|---|---|---|---|---|---|
| 得分 | 排名 | 得分 | 排名 | 得分 | 排名 | 得分 | 排名 | 得分 | 排名 | ||||||
| 广东 | 0.2429 | 1 | 0.2991 | 1 | 0.4244 | 1 | 0.5019 | 1 | 0.5779 | 1 | 1.38 | ||||
| 浙江 | 0.1642 | 2 | 0.2020 | 6 | 0.3250 | 5 | 0.3533 | 6 | 0.4075 | 5 | 1.48 | ||||
| 山东 | 0.1612 | 3 | 0.2361 | 2 | 0.3786 | 2 | 0.4283 | 2 | 0.4577 | 2 | 1.84 | ||||
| 上海 | 0.1574 | 4 | 0.2206 | 3 | 0.3414 | 3 | 0.3695 | 4 | 0.4332 | 4 | 1.75 | ||||
| 天津 | 0.1536 | 5 | 0.2021 | 5 | 0.2867 | 8 | 0.3558 | 5 | 0.3909 | 6 | 1.55 | ||||
| 江苏 | 0.1386 | 6 | 0.2060 | 4 | 0.3247 | 6 | 0.3704 | 3 | 0.3781 | 7 | 1.73 | ||||
| 福建 | 0.1385 | 7 | 0.1902 | 7 | 0.3350 | 4 | 0.3210 | 8 | 0.4416 | 3 | 2.19 | ||||
| 辽宁 | 0.1264 | 8 | 0.1774 | 8 | 0.3030 | 7 | 0.3435 | 7 | 0.3731 | 8 | 1.95 | ||||
| 广西 | 0.1082 | 9 | 0.1353 | 9 | 0.2267 | 10 | 0.2847 | 9 | 0.3178 | 9 | 1.94 | ||||
| 河北 | 0.0943 | 10 | 0.1318 | 10 | 0.2157 | 11 | 0.2488 | 11 | 0.3064 | 11 | 2.25 | ||||
| 海南 | 0.0658 | 11 | 0.1082 | 11 | 0.2565 | 9 | 0.2716 | 10 | 0.3088 | 10 | 3.69 | ||||
| 均值 | 0.1410 | 0.1917 | 0.3107 | 0.3499 | 0.3994 | 1.83 | |||||||||
空间格局分析:2000—2020年沿海各省份资本禀赋差异逐渐增大,可能原因是区位、政策的影响使得发达地区发展速度和质量迅速提升,远远超过落后地区,而落后地区由于自身资源不足、技术水平不高、社会资本缺乏等原因导致发展速度较慢。广东、山东、福建发展水平位于前列,河北、广西、海南属于落后地区。其中广东连续20年居全国首位,但增速慢;浙江省资本禀赋增速较慢,排名不增反降;海南一直处于较低水平,但增速较快。
(2) 各类资本的时空分异
时序分析:如图2所示,各类资本要素禀赋均在2000—2020年呈上升态势,资本积累速度大体呈现“慢—快—慢”的发展趋势。其中自然资本得分均值由2000年0.11平稳上升到2020年0.30,增长0.19,增速最小。知识资本由0.14上升到0.45,增长0.31。社会资本由0.08增长到0.45,增长0.37,增速最大,尤其在2006—2010年,可能原因是“十一五”期间,国家提倡保障民生、绿色发展,社会各方面均衡发展,社会积累水平快速提升。制度资本由0.23增加到0.43,增长0.20。各资本要素禀赋随时间推移差异缩小,体现各地区之间要素流动加快。
图2
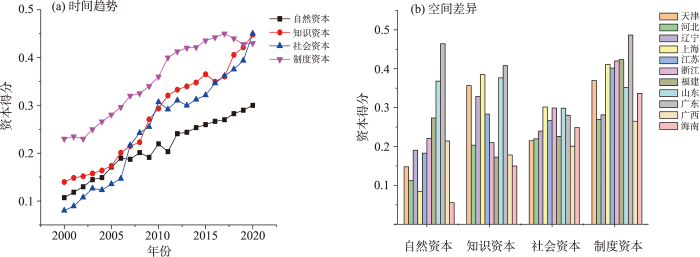
图2
4类资本得分空间差异和时间趋势
Fig.2
Spatial differences and temporal trends in the four types of capital scores
空间格局分析:各类资本的地区要素禀赋存在较大差异。其中自然资本地区禀赋差异最大,社会资本差异最小。在自然资本方面,广东、山东最为丰富,两者均属于海域资源富集地区,资源开发利用比例高;上海、海南最为匮乏,从各指标得分看,上海市海水养殖产量(0.0007)、海洋化工产品产量(0.0006)不足,海南省海洋天然气产量(0.0002)最低。在知识资本方面,广东、上海较为丰富,二者凭借优质教育资源及大批高水平海洋研究平台和机构,科技创新水平快速提升;福建、海南较为缺乏,福建省海洋专利授权数(0.0016)、科研机构从业人员(0.0079)短缺,海南专利授权数(0.0004)、科技论文发表数(0.0012)、从业人员(0.0018)均不足。在社会资本方面,上海、浙江、山东较为充足,三地大力发展各项社会事业,健全和完善多层次、广覆盖的社会保障体系;天津、广西较为不足,天津社会组织数(0.0104),广西信息网络指数(0.0109)、社会捐赠(0.0025)较低。在制度资本方面,广东、福建较为充裕,开放程度及市场化水平高,管理模式不断创新;河北、广西较为贫乏,河北对外开放指数(0.0036)、涉海地方性法律立法数(0.0018)得分低,广西非国有产权比重(0.0225)、在线政府指数(0.0138)最低。
3.2 海洋经济全要素生产率测度
依据SFA模型,运用Frontier 4.1软件测度2000—2020年间沿海11个省份海洋经济全要素生产率变动趋势,结果如图3所示。
图3
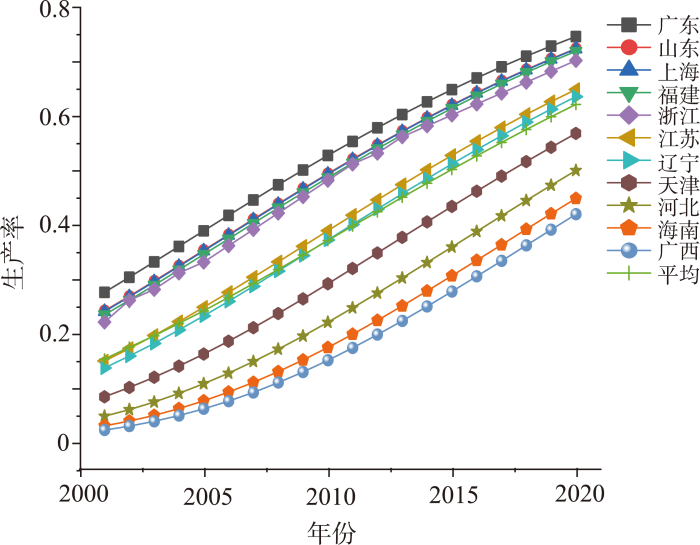
图3
沿海地区海洋经济全要素生产率
Fig.3
Total factor productivity of the marine economy in coastal areas
从整体上看,① 沿海地区平均海洋经济全要素生产率逐年增加,在2020年达到0.62,说明海洋经济不断向前发展,但仍属于中等水平。② 2020年广东海洋经济全要素生产率达到0.74,而广西只有0.42,体现了沿海区域差异明显,空间分布不均。③ 沿海各地区海洋经济全要素生产率排名没有变化,说明海洋经济发展有一定的“路径依赖”问题,难以“跨越性”发展。原因可能在于,2003年颁布《全国海洋经济发展规划纲要》并在“十二五”和“十三五”时期发布相关的海洋经济发展规划,充分提高海洋的重要地位,贯彻落实海洋强国战略,但中国海洋经济发展仍面对重大挑战,产能过剩问题仍然存在,国际市场需求依然乏力,体制机制尚不完善。
分区域来看:参考现有研究成果[32],采用自然断裂点与人工辅助相结合的方法,将海洋经济全要素生产率测算结果分为3个梯队:广东、山东、上海、福建、浙江组成第一梯队,得分均高于0.65,海洋经济规模好;其次是江苏、辽宁、天津组成的第二梯队,得分均值在0.5~0.65之间,海洋经济规模较好;最后是河北、海南、广西组成的第三梯队,得分均值在0.4~0.5之间,海洋经济规模有待提升。但河北、广西和海南增速均达到10%以上,高于其他省份。
3.3 海洋经济全要素生产率的动力机制
3.3.1 分时段研究沿海地区驱动要素
基于2000—2020年沿海各区域的面板数据,根据SFA模型识别中国海洋经济可持续发展区域动力。分时间、空间2个维度分析,2012年十八大召开,中国经济发展逐渐步入新常态,发展核心由“高速”转为“高质”,中国海洋经济发展的动力机制发生了重大变化,故以2012年为界分2个时期讨论其驱动力。空间上由于研究时段较短导致分省研究样本量不足,最终计算结果的γ值较小且不显著,表明技术非效率项不存在,评价结果可靠性不足。因此,按照自然资源部对海洋经济圈的划分标准,将沿海11个省份划分为北部海洋经济圈(河北、辽宁、天津、山东)、中部海洋经济圈(江苏、上海、浙江)及南部海洋经济圈(福建、广东、广西、海南)3个区域研究海洋经济全要素生产率的驱动力。2000—2020年沿海地区海洋经济全要素生产率驱动要素测算结果如表3所示。
表3 2000—2020年沿海地区海洋经济全要素生产率驱动要素测算结果
Tab.3
| 变量 | 系数估计值 | T检验值 | 变量 | 系数估计值 | T检验值 |
|---|---|---|---|---|---|
| 0.75**/-0.18 | 2.25/-0.75 | 0.32/0.48 | 1.01/1.22 | ||
| 0.58*/0.67** | 1.75/2.57 | 0.25/0.27*** | 0.39/2.61 | ||
| 0.51/0.54** | 1.64/2.32 | 0.26***/-1.33 | 6.55/-1.59 | ||
| 0.14*/0.57** | 1.77/2.07 | 基尼系数 | 0.57*/0.88** | 1.66/1.98 | |
| -0.42/0.15 | -0.61/0.26 | 恩格尔系数 | 0.58*/0.46** | 1.78/2.42 | |
| 0.32*/0.71* | 1.74/1.87 | 贫困率 | 0.42*/0.21*** | 1.82/2.63 | |
| 0.31***/1.24*** | 4.57/5.15 | 区域发展差异 | 0.27*/0.42 | 1.92/1.31 | |
| 0.41/1.22** | 1.32/2.54 | 海陆协调度 | -0.51***/-0.54*** | -4.46/-5.02 | |
| 0.29***/0.47*** | 3.56/4.34 | σ2 | 0.02***/0.03*** | 4.32/5.34 | |
| 0.14/0.25*** | 1.42/3.25 | γ | 0.88***/0.87*** | 51.98/51.69 | |
| 0.18***/-0.25 | 3.96/-0.43 |
注:***、**、*分别表示通过1%、5%、10%显著性水平检验;“/”左、右边分别表示2000—2012、2013—2020年测算结果。下同。
(1) 2000—2012年,海洋经济全要素生产率主要由自然资本驱动。这与经济发展阶段相符,经济增长最初阶段是依靠海洋资源禀赋,发挥比较优势。中国享有主权和管辖权的海域面积约300万km2,大陆海岸线长达1.84万km,其富含着各种海底矿产资源、生物资源、旅游资源等。2010年全国油气新增产量近85%源于海洋,2011年中国海洋原油产量达4661万t,天然气产量167亿m3,水资源量达到6365亿m3,且拥有22561个海洋生物物种。同时广东、福建、山东等多个地区在海洋经济发展规划中强调加强自然资源开发利用,推动海洋经济全要素生产率提高。
自然资本的一次项系数为正且显著,二次项系数为负但不显著,说明短期自然资本投入提高能够促进海洋经济全要素生产率,但长期来看,提高自然资本投入反而会导致全要素生产率下降,而长期的知识、社会和制度资本投入能够促进海洋经济发展。这说明自然资源虽是海洋经济的基础,但资源是有限的,必须通过发展科技、社会合作、政府支持来提高利用效率。4类资本的交叉项均为正数,说明其两两之间为互补关系,但只有自然资本和知识资本、自然资本和制度资本、社会资本和制度资本之间的影响是显著的,提高自然资本的同时提高知识资本能够提高海洋全要素生产率。在外部环境因素中,恩格尔系数最大且为正,说明居民生活水平低对全要素生产率损害最大。
(2) 2013—2020年海洋经济发展主要由知识资本和制度资本驱动。如理论机制所述,经济长期依赖自然资源会出现“资源诅咒”,重点依赖资源发展的经济模式难以为继,海洋经济发展模式转变为主要依靠产业结构优化、知识资本投资和制度质量提升。2016年国家为更好地指引海洋科技事业发展,专门出台《全国科技兴海规划(2016—2020年)》,规划阐明中国科技兴海的指导思想、基本原则和总体目标。2017年《国家海洋经济发展“十三五”规划》强调要依靠科技创新促进海洋经济发展,提升海洋科技支撑力度,借助科技力量扩大海洋产业竞争力。至2020年中国沿海地区海洋发明专利数已达到3119件,海洋科研机构从业人员达到28151人。
自然资本的一次项系数为负,二次项系数为正,但影响均不显著,说明目前海洋环境污染、生态破坏、利用率低的问题仍阻碍着海洋经济的发展,但长期来看,随着科技提高、政府支持使得利用效率提高,环境污染减少,自然资本仍会促进全要素生产率提高。自然与制度、社会与制度的交叉项均为负值,说明其两两为替代关系,但均不显著,其余交叉项均为正值,说明两两互补。在外部环境因素中,恩格尔系数、贫困率对海洋经济全要素生产率损害较2000—2012年有所减小,海陆协调的促进作用增强,但基尼系数最大,说明居民收入差距对海洋经济全要素生产率损害加剧。
3.3.2 分区域研究沿海地区驱动要素
(1) 北部经济圈海洋经济全要素生产率驱动要素测算结果
如表4所示,北部经济圈2000—2012、2013—2020年2个时间段均主要由自然资本驱动,但自然资本驱动力在减小。如理论机制所述,自然资源是海洋经济发展的必要性资源,若资源开发部门的生产要素配置效率不理想时,依赖资源发展的地区会阻碍资源流入创新部门,进而阻碍经济发展。北部经济圈属于资源型经济区,富饶的自然资源为经济发展和区域合作奠定了基础。其中,矿产资源丰富,已探明的就有70多种,且拥有26处国家5A级景区。北部经济圈产业多为资源密集型产业,虽短期会促进海洋经济发展,长期看其效率低下会负面影响该地区的制度质量,这与邓宏图等[24]的研究结果一致,且在发展过程中出现了高能耗、高污染、低产能等问题,产业结构升级步伐缓慢导致北部经济圈驱动力转变慢,目前仍依靠自然资源驱动,但随着政府对海洋经济重视度不断提高,科技水平持续增强,社会资本积极参与,使得自然资源驱动力逐步缩小。
表4 北部经济圈的海洋经济全要素生产率驱动要素测算结果
Tab.4
| 变量 | 系数估计值 | T检验值 | 变量 | 系数估计值 | T检验值 |
|---|---|---|---|---|---|
| 0.49**/0.44*** | 1.98/4.24 | 0.24**/1.36 | 2.15/1.63 | ||
| 0.24**/0.39*** | 2.24/3.58 | 0.39*/-0.57 | 1.66/-0.72 | ||
| 0.21/0.34** | 1.14/2.57 | 0.27*/0.57*** | 1.75/4.17 | ||
| -0.09/0.26** | -0.87/1.99 | 基尼系数 | 0.40**/0.86** | 2.39/1.96 | |
| -0.24/0.38 | -1.09/0.85 | 恩格尔系数 | 0.35**/0.21** | 2.05/2.43 | |
| 0.24/0.67** | 0.28/2.37 | 贫困率 | 0.24*/0.14** | 1.75/2.16 | |
| 0.19**/0.21*** | 2.02/2.94 | 区域发展差异 | 0.20/-0.12 | 0.95/-0.99 | |
| 0.56/0.50*** | 1.48/7.01 | 海陆协调度 | -0.49***/-0.41*** | -5.89/-4.75 | |
| 0.79***/0.66 | 7.26/0.87 | σ2 | 0.01***/0.02*** | 2.91/2.78 | |
| 0.34***/1.04* | 6.82/1.66 | γ | 0.95***/0.96*** | 29.23/28.44 | |
| -0.57/0.55*** | -1.52/4.87 |
2000—2012年社会资本和制度资本驱动作用小。主要是由于:第一,北部地区海洋管理体制尚不完善,保障机制尚不健全,政府海洋服务能力较低;第二,民众海洋观念较为薄弱,多受传统观念影响,逻辑思维或止于实用、或止于传统教条、或止于权威,使社会道德状态陷入了囚徒困境。2013—2020年驱动力增强,主要是由于《天津市海洋经济和海洋事业发展“十三五”规划》《山东省海洋生态环境保护规划(2018—2020年)》等多个文件颁布使得各省海洋环保意识增强,政府对海洋重视度提高。同时党的十八大以来北部地区不断重视积累社会资本,推动社会资本与政府合作,使其管理体制不断完善。如理论机制所述,良好的制度安排能够引导要素高效流动,合理调整要素比例,提升产出效率。外部环境因素中,基尼系数的系数增大,说明区域居民收入差距对全要素生产率损害加大。恩格尔系数和贫困率减小,说明随着居民生活水平提高和贫困率降低,其对全要素生产率损害减小。海陆经济协调度的促进作用减小。
(2) 中部经济圈海洋经济全要素生产率驱动要素测算结果
如表5所示,中部经济圈在2000—2012年主要由自然资本驱动,原因是该阶段属于中国海洋经济快速发展时期,海洋经济初具规模。2003年国务院发布《全国海洋经济发展规划纲要》,标志着中国对海洋经济的认识开始突破传统的“资源观”,但由于政策时滞性,该时期仍由自然资本驱动。2013—2020年属于海洋经济转型发展时期,如理论机制所述,若资源开发部门效率低下时,将资源趋于流向对技术贡献率较高的部门,可以规避资源诅咒。中部经济圈区域内自然资源利用率低,资源消耗大,因此将发展动力转向社会资本。如理论机制所述,丰富的社会资本能够信息共享,合作共赢,约束行为,从而合理配置资源,提升发展效率。学术界、新闻界以及金融、教育、科技等领域广泛深入互动,开展和成立各种学术会议、论坛以及研究机构,且由上海市牵头,联合江浙两省出台《上海大都市圈空间协同规划》使得区域整体战略意识深入人心。《2006—2020年国家信息化发展战略》的出台也使得该地区信息产业高速发展,信息网络广泛普及。直至2020年该区域每万人拥有社会组织数达37个,客运量达183090万人,均高于其他经济圈。互联网普及率也已高达94%,推动着该地区海洋经济的发展。
表5 中部经济圈的海洋经济全要素生产率驱动要素测算结果
Tab.5
| 变量 | 系数估计值 | T检验值 | 变量 | 系数估计值 | T检验值 |
|---|---|---|---|---|---|
| 0.48***/-0.50 | 3.46/-0.38 | 0.19**/0.31*** | 2.51/6.24 | ||
| 0.29*/0.41** | 1.85/2.23 | 0.29*/0.54** | 1.85/2.48 | ||
| 0.34**/0.62** | 2.24/2.52 | -0.07/0.38*** | -1.44/3.86 | ||
| 0.21**/0.35** | 2.42/2.51 | 基尼系数 | 0.19/0.07* | 1.63/1.81 | |
| 0.42*/0.39** | 1.75/2.06 | 恩格尔系数 | 0.84*/0.13 | 1.78/1.17 | |
| 0.24*/0.49*** | 1.86/4.14 | 贫困率 | -0.30/1.30* | -0.63/1.86 | |
| 0.47/0.80* | 1.10/1.82 | 区域发展差异 | 0.10/2.01* | 0.56/1.74 | |
| 0.17**/-0.01 | 1.97/-0.33 | 海陆协调度 | -1.85***/1.01 | -2.77/0.53 | |
| 0.44/0.67 | 0.64/0.76 | σ2 | 0.001***/0.001*** | 6.24/6.86 | |
| 0.17**/0.29 | 2.14/0.15 | γ | 0.99***/0.99*** | 325.61/397.22 | |
| 0.48***/-1.66 | 7.65/-1.34 |
随着时代发展,知识资本、制度资本驱动力在不断增强。如理论机制所述,海洋科技研发和人才培育能够使得地区拥有较高自主研发能力和充裕的专业人才,同时由于外部性引进更先进的技术,增加产出。较高创新能力的上海市以打造开放式国际领先的“全球海洋创新中心”为目标,带动加快海洋科技向创新引领型转变[40],持续推动创新要素集聚,设立海洋学科重点实验室,同时形成一套科学规范的人才选拔、聘用制度,推动产学研深度融合。2020年中部经济圈海洋专业研究生毕业数达到1155人,技术市场成交额达5074.4亿元,均高于其他海洋经济圈。外部环境因素中居民收入差距对海洋经济全要素生产率损害作用减小,居民收入水平提高使得其对海洋经济的损害作用变得不显著。
(3) 南部经济圈海洋经济全要素生产率驱动要素测算结果
如表6所示,2000—2012年南部经济圈主要由自然资本驱动。南部经济圈海域辽阔,资源丰富,在海洋经济高速发展阶段与其他经济圈相同,均由自然资本驱动。2013—2020年转变为主要由制度资本驱动,如理论机制部分所述,良好的制度能够通过机制保障、健全法制、明确产权、综合管理使得资源合理配置、市场有序发展、社会效用提升,经济绿色发展。作为中国对外贸易主阵地,该地区拥有大量发展机会和政策优惠,开放水平较高,汇集各种生产要素。《全国海洋经济发展“十三五”规划》和《广东省推进粤港澳大湾区建设三年行动计划(2018—2020年)》指出,推进深圳建设全球海洋中心城市,支持南沙新区科技兴海产业示范基地,不断加强法制建设,健全产权制度。海南、广西具有地处“21世纪海上丝绸之路”重要交汇点的独特区位优势,与沿线国家交流合作更加便利,至2020年该区域对外开放指数已达到0.65。
表6 南部经济圈的海洋经济全要素生产率驱动要素测算结果
Tab.6
| 变量 | 系数估计值 | T检验值 | 变量 | 系数估计值 | T检验值 |
|---|---|---|---|---|---|
| 0.46**/-0.29* | 2.24/-1.92 | 0.24**/3.52*** | 1.97/6.22 | ||
| -0.28/0.32** | -1.36/2.48 | 0.66***/0.45 | 5.24/0.57 | ||
| 0.24**/0.36* | 1.98/1.65 | 0.57*/0.64*** | 1.88/3.92 | ||
| 0.33*/0.51*** | 1.68/5.63 | 基尼系数 | 1.32*/0.19 | 1.72/1.63 | |
| -0.33*/0.75** | -1.76/2.10 | 恩格尔系数 | 0.59/0.33* | 1.42/1.88 | |
| -0.12/0.45** | -0.78/2.46 | 贫困率 | -0.26/0.29* | -0.63/1.95 | |
| 0.68***/2.26** | 2.79/2.29 | 区域发展差异 | 0.39/0.12 | 0.89/1.24 | |
| 0.24**/0.14*** | 2.39/6.51 | 海陆协调度 | -2.14**/-3.13*** | -2.45/-7.25 | |
| 0.45***/1.24*** | 3.41/9.60 | σ2 | 0.03**/0.01*** | 2.01/3.36 | |
| 0.68*/-2.25 | 1.76/-1.43 | γ | 0.81***/0.83*** | 37.25/36.88 | |
| 0.32**/0.68*** | 2.16/5.68 |
自然资本对海洋经济全要素生产率的驱动逐渐下降,原因是一方面,外向经济是依赖于资源及劳动力丰裕形成的低成本优势。如今,低成本优势不再存在,大批资本向其他低成本国家转移。另一方面,南部海洋经济圈作为中国对外开放和参与经济全球化的重要区域,承接了大量高污染密集型产业,由此导致区域经济发展与生态环境之间的矛盾越来越尖锐。知识资本和社会资本驱动力增强,说明随着海洋经济转型发展,区域综合创新能力增强,投入转化能力提升,社会中逐步建立起信任、合作、互惠、共享的价值观,以及相互关怀和交流的关系网络。外部环境因素中居民收入差距的损害作用变得不显著,海陆协调度的促进作用增大。
4 结论与政策启示
4.1 结论
本文利用Translog-SFA模型测度沿海地区海洋经济全要素生产率,通过构建自然、知识、社会、制度4类资本及外部环境因素的评价指标体系来识别发展的动力机制。主要结论如下:
(1) 时间维度上,资本要素禀赋在2000—2020年呈上升态势,各类资本积累速度大体呈现“慢—快—慢”的发展趋势。空间维度上,各类资本的地区要素禀赋存在较大差异,其中自然资本地区要素禀赋差异最大,社会资本地区禀赋差异最小。
(2) 时间维度上,沿海地区平均海洋经济全要素生产率逐年增加,2020年达到0.62,说明海洋经济在不断向前发展但仍属于中等水平。空间维度上,沿海地区差异明显,空间分布不均。排名没有变化,说明有一定的“路径依赖”问题,难以“跨越性”发展。
(3) 2000—2012、2013—2020年沿海地区海洋经济全要素生产率主要驱动力分别为自然资本、知识资本。北部、中部、南部经济圈2000—2012年主要驱动力均为自然资本,2013—2020年主要驱动力分别为自然资本、社会资本、制度资本,自然资本驱动力减小,知识资本、社会资本和制度资本驱动力增强。
4.2 政策启示
海洋是促进人类发展的新引擎,在国家发展中的战略地位更加突出,党的二十大报告中也明确指出,发展海洋经济,保护海洋生态环境,加快建设海洋强国。实现海洋经济高质量发展为建设海洋强国奠定基础,应统筹兼顾、综合施策,加快培育高质量发展的动力源。
第一,有效开发利用海洋资源,全面释放供给能力,增强经济高质量发展基础动力。自然资本对海洋经济全要素生产率驱动作用逐渐减小,资源利用不足、要素配置扭曲等问题突出。2021年12月,国务院批复同意《“十四五”海洋经济发展规划》,要求以有条件的全国海洋经济发展示范区为依托,打造海洋资源保护利用创新试验平台。同时应充分考虑区域差异,采取因地制宜、分类施策的方式,增强中央政府引领与地方整合的能力,逐渐加深资源开发合作的深度和广度,以实现全国海洋资源优势互补,区域内海洋经济协作共赢。
第二,促进学校教学、人才培养、研发应用等方面协调互动,以激发高质量发展持续动力。知识资本驱动作用虽逐渐提升,但仍与西方国家有较大差距,中国海洋自主创新能力仍不足。各地区应积极引进高素质海洋类人才,增加高层次人才培养规模。同时二十大报告提出“集聚力量进行原创性、引领性科技攻关,坚决打赢关键核心技术攻坚战”。需增加对基础技术、前沿技术、颠覆性科技等发展资金支持,加快实施一批具有战略性、全局性、前瞻性的国家重大科技项目,从而实现中国创新经济快速增长。
第三,重视社会资本培育和积累,发挥高质量发展新生动力。近年来社会资本快速积累,对海洋经济全要素生产率驱动作用大幅提升,高水平的社会资本将成为社会、经济和谐健康发展的必要条件。因此,应结合地区实际水平,各地区建立和完善适合的社会信用制度及诚信体系,积极引导社会成员形成正确的价值观,提升社会信任度。应完善交通运输网络、计算机网络等,加强社会沟通合作。建立地区统一规范,加强非正式制度的约束作用。鼓励并提供更多渠道使公民积极参与社会管理,提升社会责任感和民族认同感,增加社会资本积累。
第四,推动制度创新,提高制度质量,增强高质量发展关键动力。制度资本已成为南部经济圈海洋发展主要驱动力。党的二十大报告明确指出:“扎实推进依法行政,转变政府职能,优化政府职责体系和组织结构,提高行政效率和公信力,全面推进严格规范公正文明执法。”一方面,政府在社会经济中有强大管控能力,防止市场失衡及社会两极分化,需要党建立起有效的内在监督和制衡机制;另一方面,政府在整个市场运行中应让市场进行资源基础性配置,从主导型政府转变为服务性政府,把投资拉动转变为市场创新驱动,实现经济发展升级换代和可持续性。
第五,海洋经济不能仅仅追求高速发展,也应实现包容性和协调性增长。党的二十大报告指出:“增进民生福祉,提高人民生活质量。健全基本公共服务体系,增强均衡性和可及性,扎实推进共同富裕。”首先,国家应综合运用宏观调控手段,调整国民收入分配关系,兼顾效率与公平,提高百姓生活水平,减小贫富差距,努力实现共同富裕;其次,应充分贯彻陆海统筹发展战略,统一规划,整体设计,保证资源要素在海陆之间自由流动和合理配置;最后,应继续发挥各地区优势,通过健全市场机制、合作机制、互助机制、扶持机制,逐步缩小区域发展差距。
参考文献
结构转换、全要素生产率与高质量发展
[J].
Structural transformation, total factor productivity and high-quality development
Natural resources endowment: What more does West Africa need in order to grow?
[J].
Driving force for China's economic development under industry 4.0 and circular economy: Technological innovation or structural change?
[J].
中国全要素生产率演变的测度和多重效应分解: 偏向性技术进步视角
[J].
Measurement and multiple effect decomposition of China's total factor productivity growth: A perspective based on directed technological change
Exploring the driving factors of economic growth in the world's largest economies
[J].
Measures of human capital and the mechanics of economic growth
[J].
Social capital and economic development in regional Australia: A case study
[J].DOI:10.1016/j.jrurstud.2005.07.003 URL [本文引用: 1]
Economic resilience and social capital of the Italian region
[J].
中国沿海地区海洋经济效率与社会资本的交互响应关系
[J].
DOI:10.18402/resci.2022.06.11
[本文引用: 2]

社会资本作为生产性要素,是社会、经济和谐健康发展的必要条件。为探究社会资本与海洋经济效率的交互响应关系,本文利用SBM超效率模型对2000—2018年沿海11省(市、自治区)的海洋经济效率进行测度,采用熵值法对社会资本进行量化分析,最后运用基于向量自回归(VAR)模型的脉冲响应分析和方差分解考察二者的动态关系。结论如下:①海洋经济效率整体水平低下,有较大的发展潜力;时间上呈现持续上升的波动发展态势,总体呈现大幅度增长;空间上区域差异明显,差距呈现“扩大—缩小—扩大”的“N”型发展趋势。②社会资本方面,研究期内各省(市、自治区)社会资本呈波动上升的发展态势,各省(市、自治区)社会资本水平差异明显,并呈现不断扩大趋势。③从脉冲响应结果来看,各省(市、自治区)社会资本对海洋经济效率均产生促进作用且作用方式不同,主要取决于社会资本积累水平的差异;依据作用方式和响应程度可划分为短期波动型、持续波动型和平稳型3种类型;海洋经济效率与社会资本形成相互促进的发展模式。④从方差分解来看,社会资本在海洋经济发展中的作用日益明显,其中社会网络的贡献度最大,其次是社会信任,最后是社会规范。本文认为,高水平的社会资本将成为海洋经济和谐健康发展的先决条件,未来应积极提升社会资本在海洋经济领域的贡献水平。
Interactive response relationship between marine economic efficiency and social capital in China's coastal areas
DOI:10.18402/resci.2022.06.11
[本文引用: 2]
As a productive factor, social capital is a necessary condition for the harmonious and healthy development of society and economy. In order to explore the interactive response relationship between social capital and marine economic efficiency, this study used slacks-based measure (SBM) super efficiency model to measure the marine economic efficiency of 11 coastal provinces (municipalities and autonomous regions) from 2000 to 2018, and the entropy method was used for quantitative analysis of social capitals. Finally, impulse response analysis and variance decomposition based on a vector autoregression (VAR) model were used to investigate the dynamic relationship between them. The conclusions are as follows: (1) The overall level of marine economic efficiency is low and has great development potential. Temporally, it showed a fluctuating development trend of continuous rise, and the overall growth was significant. There are obvious regional differences spatially, and the regional gap presents an N-shaped development trend of “expanding, narrowing and expanding”. (2) During the study period, the social capital of provinces and cities showed a fluctuating and rising development trend, and the social capital level of provinces and cities was significantly different, showing a growing trend. (3) The impulse response results indicate that the social capital of provinces and cities can promote the efficiency of marine economy in different ways, which mainly depends on the difference of social capital accumulation level. According to the action mode and response degree, it can be divided into three types: short-term fluctuation type, continuous fluctuation type, and stable type. Marine economic efficiency and social capital formation promote each other. (4) From the perspective of variance decomposition, the role of social capital in marine economic development is becoming increasingly more important and the contribution of social network is the largest, followed by social trust, and finally social norms. This article holds that a high level of social capital will become a prerequisite for the harmonious and healthy development of marine economy. In the future, we should actively improve the contribution level of social capitals in the field of marine economy.
Do institutional quality and financial development affect sustainable economic growth? Evidence from South Asian countries
[J].DOI:10.1016/j.bir.2021.03.005 URL [本文引用: 1]
从要素驱动到创新驱动: 制度质量视角下的经济增长动力转换与路径选择
[J].
From factors driven to innovation driven: Switch of economic growth impetus and selection of pathway based on the perspective of institutional quality
2000—2013年中国城市群经济绩效动态实证分析: 基于DEA和Malmquist生产率指数法
[J].
DOI:10.18306/dlkxjz.2017.06.004
[本文引用: 1]
在全球化和新型城镇化大背景下,城市群是辐射面最广、潜力最大、活力最强的核心增长极,但其高速成长背后是各类要素的大量投入,客观评估城市群经济绩效对于推动中国城镇化持续健康发展意义深远。在总结既有研究的基础上,选取中国13个典型城市群为样本,以2000-2013年为研究时段,采用资本、土地、劳动、科技和经济五大要素长时间序列数据,在全要素生产率(TFP)分析框架下,通过数据包络分析方法(DEA)静态评价时间截面的城市群投入产出效率,进而运用Malmquist生产率指数法动态分析城市群TFP年际变化,探讨其时空格局和内在演化机制。研究发现:城市群经济绩效进步明显,但空间分布仍不均衡;科技进步贡献的滞后在一定程度上抵消了通过规模扩张和资源配置优化带来的正效应,只有长三角、珠三角和京津冀三大城市群初步实现依靠科技进步促进发展,表明各城市群所处发展阶段和动力机制差异显著。据此,提出针对不同地区、不同发展阶段城市群的发展策略。
The dynamics and empirical analysis of input and output efficiency of urban agglomerations in China, 2000-2013: Based on the DEA model and Malmquist index method
DOI:10.18306/dlkxjz.2017.06.004
[本文引用: 1]
With the enormous radiation range, great potential and vigor, urban agglomerations are deemed as the core growth pole both at present and in the future under the background of globalization and new-type urbanization in China. Behind the seemingly ever-growing urban agglomerations, however, massive input elements such as resource, labor, capital, and other factors are needed. It is of profound significance to evaluate the economic performance of urban agglomerations, which may vigorously promote the sustainable and healthy development of urbanization. How to objectively evaluate the efficiencies such as industry scale concentration, resource allocation, and technological change of urban agglomerations has become an important question. Therefore, in this study we applied the data envelopment analysis (DEA) model to quantitatively measure the input and output efficiency of typical urban agglomerations in China from 2000 to 2013, based on time series data including capital input, urban construction land increment, labor supply, scientific-technological investment, and economic output value. Moreover, we analyzed urban agglomerations' total factor productivity index (TFP) dynamically by means of Malmquist productivity index method and lucubrated their spatial and temporal differentiation patterns, mechanisms of change, influencing factors, and other related contents. The results show that the urban agglomerations' stationery cross-section input and output efficiency made significant strides but an unbalanced spatial distribution pattern remained. In 2000, the average comprehensive technological efficiency was only 73.1% of the optimal level with barely three large urban agglomerations achieved the optimal DEA efficiency. After years of steady development, the corresponding index reached 96.8% of the optimal level with eight urban agglomerations achieved the optimal DEA efficiency. However, from the perspective of dynamic time series analysis, urban agglomerations' TFP decreased by 6% from 2000 to 2013 mainly due to the poor performance of technology change index. Unlike the disappointing performance of technology change index, other indices such as comprehensive technological efficiency change index, pure technological efficiency change index, and scale efficiency change index all shaped up, indicating that the level of resource allocation and utilization efficiency rose steadily during this period. The lag of the contribution of technological progress to a certain extent offset the positive effects brought by the expansion of urban agglomeration and the optimization of resource allocation. Specifically, only the Yangtze River Delta, the Pearl River Delta, and Beijing-Tianjin-Hebei urban agglomerations gained ascending contribution of technological progress, which illustrates that the current development stages and dynamic mechanisms of urban agglomerations in China maintained diversified characteristics. To conclude, this article puts forward a series of specific suggestions to optimize the development of urban agglomerations in China, namely, moderately expanding the scale of urban agglomerations, placing emphasis on input and output efficiency leaning against technological changes and transforming the present unbalanced regional development situation.
数字经济增长动力与区域收入的空间分布规律
[J].
DOI:10.11821/dlxb202108005
[本文引用: 1]
为探究数字经济增长的动力构成、地域差异以及与区域收入之间的空间分布规律,本文以中国数字经济创新高地浙江省为样本,构建了数字经济增长动力要素指标体系,并首先提出了数字经济“增长动力指数”构想。借助Weaver-Thomas模型、灰色关联分析以及GIS分层设色法,从地级市层面对浙江省数字经济增长的主导动力构成进行空间可视化分析,并验证了其与区域收入的关联性。结果表明:① 浙江省数字经济增长动力类型特征呈弱波动状态。② 从整体空间格局来看,数字经济增长呈现以杭州和宁波为核心的“双核心”空间格局现象,产业供给动力主导型主要分布在浙西南地区;市场需求动力主导型、信息应用动力主导型及创新驱动动力主导型主要分布在浙西北地区。③ 数字经济“增长动力指数”与区域收入之间存在较强的关联性,较高的数字经济增长动力指数对应的地区收入也处于较高水平,反之亦然。数字经济主导动力结构的变化正在形成一种复杂多样的区域经济增长行为模式。
Spatial distribution of digital economic growth dynamics and regional income
DOI:10.11821/dlxb202108005
[本文引用: 1]
To explore the dynamic digital economy growth, regional differences, and the spatial distribution of regional income, this study takes Zhejiang Province, China's digital economy innovation highland, as a research sample, constructs the index system of dynamic factors of digital economic growth, and proposes the concept of a Digital Economy Growth Driving Index (DEGDI). Using the Weaver-Thomas model, grey correlation analysis, and GIS hierarchical coloring method, the paper analyzes the dominant driving force of digital economic growth in Zhejiang at the city level and verifies its relevance with regional income. The research results show that: (1) The dynamic characteristics of digital economic growth in this province fluctuates in a small range. (2) From the spatial pattern, the digital economic growth presents a "double core" phenomenon, in which Hangzhou and Ningbo are the cores. The industry-supply leading type is mainly distributed in the southwest of Zhejiang; the market-demand-driven, information-application-driven, and innovation-driven types are mainly found in the northwest part of the province. (3) There is a strong correlation between the DEGDI and regional income. The higher the DEGI, the higher the regional income, and vice versa. The change of the leading dynamics structure of the digital economy is forming a complex and diverse regional economic growth behavior mode.
长三角县域三次产业协调发展的空间特征及动力机制
[J].
Spatial characteristics and mechanism of the coordinated development of three industries at county level in the Yangtze River Delta
苏南地区农村发展进程及其动力机制: 以苏州市为例
[J].
Rural development process and driving mechanism of South Jiangsu, Eastern China: A case study of Suzhou City
DOI:10.11820/dlkxjz.2010.01.017
[本文引用: 1]
<p>South Jiangsu is one of the most rapidly developing areas in the eastern coastal region of China in recent three decade years. South-Jiangsu model, characterized by township and village enterprises, is a successful type of rural territorial development in China. It proves a huge success of China's reform and opening policy. It has an important theoretical and practical significance for understanding rural territorial development and finding approaches to new countryside construction to analyze thoroughly the rural development process and its driving forces mechanism in south-Jiangsu model. In this paper, the rural development process and driving forces mechanism of Suzhou region, a typical representative of south-Jiangsu model, were studied. An exponential growth trend of Suzhou’s GDP was seen during 1978-2006 with an average annual growth rate of 14.4%. The proportion of agriculture production value declined from 28.1% to 1.9%, and that of the tertiary industry increased from 16.2% to 32.7%. The proportion of agricultural labor in rural area declined from 75.5% to 16.8%. The urban and rural income gap of Suzhou city is widening but far smaller than that of the whole country. The ratio of urban to rural income of Suzhou city increased from 1.27 in 1978 to 2.0 in 2006. Rural non-agricultural industries and population growth greatly promoted rural urbanizing process of Suzhou city. Urban construction land in Suzhou city had increased 4.7 times during 1989-2006. Industrialization, urbanization, upgrading of industrial structure and institutional innovation are the four main driving forces in the rural development process of Suzhou city, and finally, their driving mechanism to rural development were analyzed in the paper.</p>
江苏省区域经济极化及其动力机制定量分析
[J].
Quantitative analysis of regional economic polarization and dynamical mechanisms in Jiangsu Province
DOI:10.11821/xb200405018
[本文引用: 1]
This paper employs a number of recently developed economic polarization measures, on the basis of the analysis of the studies on regional economic polarization at home and abroad, and uses consistent data of gross domestic production per capita to quantitatively evaluate the variety characteristics of regional economic inequality and polarization in Jiangsu province since the economic reforms and opening up of 1978 in China for the first time. It shows that regional economic polarization increases with the widening of the regional economic difference. Using a polarization index based on inequality decompositions, we make a qualitative and quantitative analysis of the influences of the regional economic polarization in regional development policy and strategy, township industrialization and foreign direct investment from top-down, bottom-up and exterior of regional development. This paper discusses the factors that account for the changing regional inequalities and polarization in Jiangsu province and argues that the top-town driving factors are likely the most important aspects affecting regional economic polarization in Jiangsu province. Spatially, regional economic polarization in Jiangsu province shows obviously two aspects of dividing from north to south and from urban to rural.
中国工业经济增长动力机制转换
[J],
The dynamic mechanism transform of China's industrial economic growth
向海经济发展动力机制及其完善路径
[J].
The motive mechanism of seaward economic development and its improvement path
Spatial expansion regular pattern and driving factors of estuarine and coastal harbors
[J].
Influencing factors of spatial variation of national marine ranching in China
[J].
American and British technology in the nineteenth century
[M].
自然资源开发、内生技术进步与区域经济增长
[J].
Natural resource exploitation, endogenous technological progress and regional economic growth
社会资本、非正式制度与经济发展
[J].
Social capital, informal institution and economic development
学历分布、制度质量与地区经济增长路径的分岔
[J].
Degree distribution, institutional quality and the path bifurcation of regional economic growth: The long-term effects of historical factors
Formulation and estimation of stochastic frontier production function models
[J].DOI:10.1016/0304-4076(77)90052-5 URL [本文引用: 1]
Efficiency estimation from Cobb-Douglas production functions with composed error
[J].DOI:10.2307/2525757 URL [本文引用: 1]
随机边界模型: 进展及Stata应用
[J].
Stochastic boundary model: Progress and Stata application
A model for technical inefficiency effects in a stochastic frontier production function for panel data
[J].DOI:10.1007/BF01205442 URL [本文引用: 1]
Driving forces on the development of China's marine economy: Efficiency and spatial perspective
[J].
Research on China's marine economic growth pattern: An empirical analysis of China's eleven coastal regions
[J].DOI:10.1016/j.marpol.2017.10.021 URL [本文引用: 2]
Economic growth, human capital and structural change: A dynamic panel data analysis
[J].DOI:10.1016/j.respol.2016.04.006 URL [本文引用: 1]
民间金融、制度环境与地区经济增长
[J].
Private finance, institutional environment and regional economic growth
数字经济时代下的中国海洋经济全要素生产率研究
[J].
DOI:10.18306/dlkxjz.2021.12.001
[本文引用: 1]
数字经济时代,数据成为新的核心生产要素。为探究数据要素在海洋经济全要素生产率变动过程中的实际价值增值过程,论文基于内生增长模型的演变规律,构建了包含数据生产要素的投入—产出指标体系,并依托DDF-Luenberger指数及其分解模型,测度2006—2018年间中国沿海11个省市区(不含港澳台地区)的海洋经济全要素生产率及各项要素的生产率变动情况。研究结果表明:① 整个研究期内中国沿海各地区数据要素化水平均实现不同程度增长,但区域间数字鸿沟问题依旧不容忽视。② DDF-Luenberger指数测度结果显示,2006年以来沿海各地区海洋经济全要素生产率均实现正向变动,且阶段性特征明显。③ 单项要素绩效测度结果显示,数据要素层面:仅仅拥有数据资源只是具备了将其转化为现实生产力的潜在可能,全要素数据生产率变动依旧更多地依赖于数字技术变动;劳动要素层面:数字经济的发展对于劳动力技能的提升表现出强者愈强的“马太效应”,研究期内沿海各地区全要素劳动生产率均呈上升态势;资本要素层面:全要素资本生产率变动呈现出明显的时间及空间差异化特征;资源要素层面:沿海省市全要素资源生产率大体上实现了正向变动且阶段性特征明显。
Total factor productivity of marine economy in China in the era of digital economy
DOI:10.18306/dlkxjz.2021.12.001
[本文引用: 1]
Based on the external conditions of technological progress and market demand upgrading in the process of high-quality development and the evolution of production factors, the factors of production in a digital economy are no longer limited to the traditional factors of production of labor, land, and capital. As knowledge and information, data have become the new core factor of production. However, data do not spontaneously generate economic value, and their impact on the economy does not break away from the framework of the traditional endogenous growth theory. They integrate technology flow, material flow, capital flow, and talent flow effectively, which render many factors in the traditional economic growth theory with new meanings. Therefore, it is necessary to appropriately expand the existing theoretical system. Based on the evolution of the endogenous growth model, this study constructed an input-output indicator system including data factor to measure the total factor productivity of marine economy in 11 coastal provinces of Chinese mainland (excluding Hong Kong, Macao and Taiwan) and the productivity changes of each factor from 2006 to 2018 using the directional distance function (DDF)-Luenberger index and its decomposition model. The results show that: 1) The performance of data factor in all coastal areas of Chinese mainland increased to different degrees, but the digital divide between these areas during the study period still cannot be ignored. 2) The measurement results of the DDF-Luenberger index show that since 2006, the total factor productivity of marine economy in all coastal areas has increased, and the stage characteristics are obvious. 3) The results of single factor performance measurement show that: with regard to the data factor, having large amounts of data only indicate the potential to transform them into real productivity, and the change of total factor data productivity still depends more on the change of digital technology. With regard to the labor factor, the development of digital economy shows the Matthew effect in the improvement of labor skills. During the study period, the total factor labor productivity in all coastal areas showed an upward trend. With regard to the capital factor, the change of total factor capital productivity shows obvious temporal and spatial differentiation characteristics. With regard to the resource factor, in general, the total factor resource productivity of coastal provinces shows positive changes with obvious stage characteristics.
Issues in assessing the contribution of research and development to productivity growth
[J].DOI:10.2307/3003321 URL [本文引用: 1]
开放经济下知识资本与全要素生产率: 国际经验与中国启示
[J].
A study on knowledge capital and total factor productivity under open economy: International evidence and implication for China
Bowling alone: America's declining social capital
[J].
社会资本与产业结构调整: 基于区域和结构效应的分析
[J].
Analysis of social capital and adjustment of industrial structure based on regional and structural effects
The concept and measurement of economic freedom
[J].DOI:10.1016/S0176-2680(03)00007-7 URL [本文引用: 1]
经济制度和我国经济增长效率的实证研究
[J].
An empirical study of the economic institution and the efficiency of economic growth
中国三大海洋经济圈海洋经济发展区域差异与分布动态及影响因素
[J].
DOI:10.31497/zrzyxb.20220409
[本文引用: 1]
考察中国海洋三大经济圈海洋经济发展区域差异,探究其分布动态演进规律,识别其空间非均衡的影响因素及空间溢出效应,为“十四五”期间优化海洋经济发展空间布局、推动区域海洋经济协同均衡发展提供决策参考。利用Dagum基尼系数及其分解方法考察三大海洋经济圈海洋经济发展区域相对差异的程度、来源及演变态势,在此基础上,进一步应用Kernel密度估计方法刻画其绝对差异的分布动态演进过程,并将空间效应纳入研究框架,应用空间计量分析方法识别海洋经济发展空间非均衡的影响因素及空间溢出效应。研究发现:三大海洋经济圈海洋经济发展均呈现稳定上升态势,但三者之间存在显著的分级现象;三大海洋经济圈空间非均衡程度显著,超变密度是造成三大海洋经济圈整体区域差异的主要来源;三大海洋经济圈海洋经济发展水平“极化效应”显著,呈现不同极化特征和分布延展性;三大海洋经济圈海洋经济发展存在显著的空间依赖性,总体表现为空间正相关。
Study on regional differentiation, distribution dynamics and influencing factors of marine economic development in three major marine economic circles of China
DOI:10.31497/zrzyxb.20220409
[本文引用: 1]
This paper examines the spatial differentiation characteristics and distribution dynamics of marine economic development in China's three major marine economic circles and identifies the influencing factors of its spatial disequilibrium and spatial spillover, which can provide decision-making reference for optimizing the spatial layout of marine economic development and promoting the coordinated and balanced development of regional marine economy during the 14th Five-Year Plan period (2021-2025). We use Gagum Gini coefficient and its decomposition method to investigate the degree, source and evolution trend of regional relative differences in marine economic development in the three marine economic circles (hereafter three circles). The kernel density estimation method is further used to describe the distribution dynamic evolution process of absolute difference. And we apply spatial econometric analysis to identify the key factors of marine economic development and spatial spillover effects. The results show that: (1) The development level of marine economy in the three circles has shown a steady upward trend, however, there is a significant differentiation among the three. The overall development level of marine economy shows a spatial pattern of eastern circle > northern circle > southern circle. (2) There is a significant spatial disequilibrium degree of the three circles, with a rising fluctuation trend and a deeping regional imbalance. The degree of regional difference between the southern and northern circles is the largest, and the degree of regional difference in the southern circle is the first among the three circles. The overall difference is mainly due to the cross overlapping effect between groups, and the contribution of intra-group difference is higher than that of inter-group difference. (3) The "polarization effect" of the marine economic development level of the three circles is significant, which presents different types of polarization trends. The three major circles as a whole and the northern circle have gradually strengthened from polarization to multipolar differentiation. The spatial agglomeration effect of the eastern circle is enhanced. The southern circle has always shown a multi-level differentiation trend. (4) There is significant spatial dependence in the development of marine economy in the three circles, and the overall performance is characterized by positive spatial correlation. Capital, labor force, innovation driven, marketization and opening-up have positive regional spillover effect, while environmental regulation has negative regional spillover effect. Capital, labor force, innovation-driven force and marketization have significant positive interregional spillover effects, while environmental regulation and opening-up have no significant interregional spillover effects.
