

针对长江流域高温,如2013年长江中下游历史罕见的极端高温干旱,众多学者从外强迫方面探讨[5],并从中高纬度的极涡、阻塞高压、中纬度的西太平洋副热带高压(以下简称西太副高)和南亚高压等大尺度环流系统角度及大气遥相关方面诊断分析[8⇓⇓⇓⇓⇓-14],指出偏强偏西的副热带高压和偏强偏东的南亚高压控制是主因[15-16],同时东亚—西太平洋从北向南的“负—正—负”波列分布对于副高位置和强度有重要作用[17]。2022年夏季,长江流域出现超越2013年、突破历史的大范围极端高温过程,此次高温形成的大气环流及可能成因,与历史高温过程的成因是否一致,值得深入分析。因此,本文基于长江流域日气温资料和NCEP/NCAR逐日再分析资料,从大气环流角度及Rossby波能量频散角度揭示2022年长江流域高温过程的可能成因,以期进一步加深对长江流域高温过程形成机制的认识,提升长江流域夏季高温天气过程的预测能力。
1 资料和方法
1.1 资料
本文采用资料包括:① NCEP/NCAR逐日再分析资料[18],其水平分辨率为2.5°×2.5°,垂直方向17层,研究所用的要素场包括高度场、风场、温度场和地表气压场,下载网址为
1.2 波作用通量水平分量(T-N通量)
式中:p为气压(hPa);U=(u,v)为基本流场;
在西风条件下,T-N通量为一矢量,方向与能量传播方向相同,也与波群速矢量方向相同,向量绝对值大小与能量传送的速度成正比。
1.3 区域性高温过程
采用气象行业标准《区域性高温过程监测指标》(征求意见稿)[24],区域性高温过程的确定如下:
(1) 某日,将日最高气温≥35 ℃的相邻站点(2个站点间距离≤250 km)判定为1个组群;1 d内,允许有多个组群存在;
(2) 将站点数占有效监测站数(站点不缺测)的百分比≥n(推荐n=3%)的组群判定为1个区域性组群;1日内,允许有多个区域性组群存在;
(3) 某日某区域性组群内至少有50%的站点与前一日某区域性组群内站点重合,则判定该区域性组群持续;否则判定该组群结束;
(4) 某个区域性组群持续m天及以上(推荐m=5),则判定其为一次区域性高温过程。
区域性高温过程开始日判定:符合区域性高温过程判定指标中(4)的区域性群组持续的首日,为区域性高温过程开始日。
区域性高温过程结束日判定:区域性高温过程开始后,符合区域性高温过程判定指标(3)中区域性组群结束的首日为区域性高温过程结束日。
《区域性高温过程监测和评价方法》中区域性高温过程综合强度Z的计算方法为:
式中:T为区域性高温过程持续时间长度;
2 长江流域夏季高温过程特征
图1
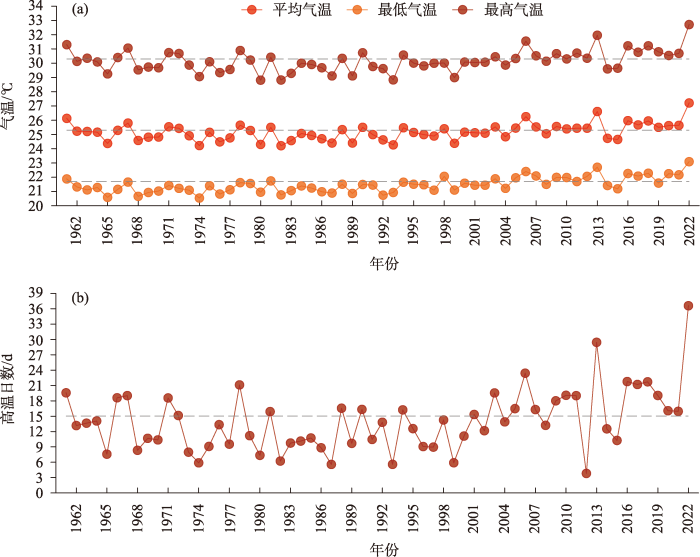
图1
1961—2022年夏季长江流域夏季气温和高温日数的逐年变化
注:图a、b中虚线均为平均值。
Fig.1
Temperature and days of maximum temperature in the Yangtze River Basin in summers of 1961-2022
依据区域性高温过程的定义,统计出长江流域1961—2022年共出现145次高温过程。基于定义,判断出2022年长江流域高温过程开始日为6月21日,结束日为8月29日,本次高温过程无中断地持续70 d,为1961年以来持续时间最长的。
从极端性看,2022年高温过程期间,平均最高气温共有607个站点排历史同期首位,其中重庆北碚(45.0 ℃)、江津(44.7 ℃),湖北竹山(44.6 ℃)等8站日最高气温达44 ℃及以上。日最高气温 ≥35 ℃、≥37 ℃、≥40 ℃的日数主要分布在四川盆地至长江中、下游(图2),其中≥40 ℃的日数10 d以上的主要位于川东南、重庆和鄂西北(图略)。
图2
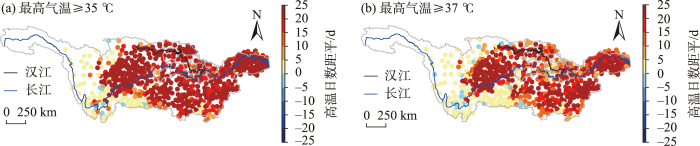
图2
长江流域2022年夏季高温过程期间日数距平分布
Fig.2
Average days of anomaly of maximum temperature in the Yangtze River Basin during the regional high temperature process in 2022
从范围上看,2022年高温过程期间,长江流域日最高气温≥35 ℃区域覆盖流域站数的89.3%, ≥37 ℃的区域占83.4%(图3),日最高气温≥40 ℃的有384个站点,占54.9%,均为1961年以来最广,特别是40 ℃以上覆盖范围远远高于历史时期次高年(2013年,31%)。
图3
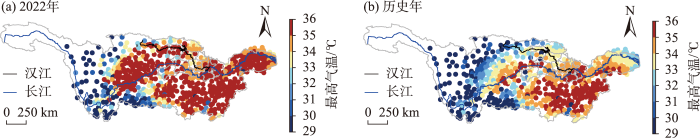
图3
区域性高温过程期间平均最高气温
Fig.3
Average maximum temperature during the regional high temperature process
综上,2022年长江流域高温过程持续时间最久、极端性最强、高温控制范围最广,对比历次高温过程综合强度发现,2022年的高温过程综合强度超越2013年,排名第一。
图3为2022年和历史年夏季长江流域高温天气过程期间平均最高气温空间分布。可明显看出,高温过程的平均最高气温都呈现出西低东高,且在四川盆地东部、长江中下游都存在异常中心。但2022年对历史年明显偏高,且前者相对后者偏高1 ℃以上站点达466个,其中偏高2 ℃以上站数为245个。NCEP再分析资料的1000 hPa温度距平合理地反映出了长江流域区域性高温过程期间平均气温异常高(图4),同时也反映出了2022年和历史时期高温过程的平均温度差异较大,2022年温度大部偏高2 ℃以上,长江中下游沿江地区甚至超过3 ℃,但历史高温过程的温度距平仅为1 ℃。由此可见,2022年高温过程相较历史高温过程的异常程度偏大。
图4
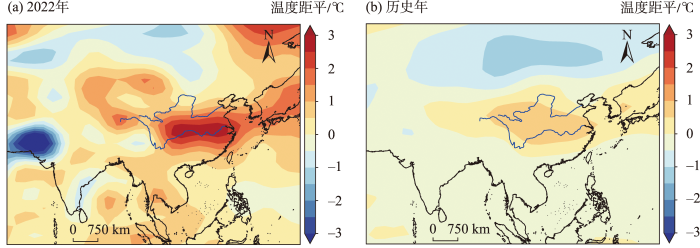
图4
NCEP/NCAR再分析资料在区域性高温过程期间的1000 hPa日平均温度距平
Fig.4
Average temperature anomaly on NCEP/NCAR 1000 hPa during the regional high temperature process
3 高温过程的大气环流及成因分析
3.1 大气环流系统配置
图5a、5c、5e为2022年长江流域高温过程出现时的大气环流系统。同期对流层中高层在整个长江流域上空为异常明显的反气旋距平环流(反气旋环流),但在垂直结构上存在差异。对流层高层200 hPa上,强大的反气旋位于长江流域的北部上空(图5a);对流层500 hPa上的反气旋相对高层有所减弱且南移,控制长江流域上游东部至下游(图5c);至对流层低层850 hPa上反气旋强度进一步减弱,且中心东移南下,长江流域下游位于反气旋的西北侧,长江中游北部位于高度负异常区,位于气旋性环流南侧(图5e)。东北半球上空的大气环流在中高纬度位势高度距平场呈现出较为明显的两脊一槽型分布,欧洲北部、东西伯利亚为明显的反气旋,贝加尔湖至巴尔喀什湖为明显的气旋,且这种波列自对流层高层至低层都较为稳定,表现出明显的正压结构。
图5
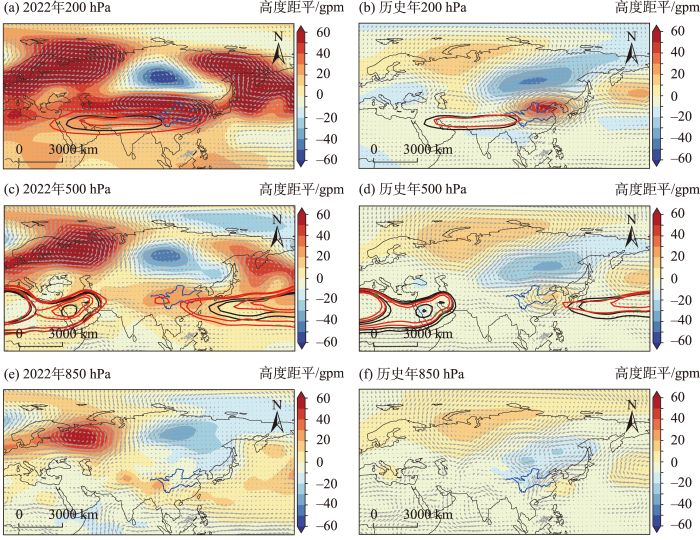
图5
长江流域高温过程大气环流系统配置特征
注:图a、b中红线为南亚高压12560 gpm线,黑线为南亚高压30年均值12560 gpm线;图c、d中红线为西太副高5880 gpm线,黑色为西太副高30年均值5880 gpm线。填色为高度距平场(gpm),矢量为风(m/s)。
Fig.5
Atmospheric circulation structure for the regional high temperature process in the Yangtze River Basin
通过长江流域高温过程期间25°~35°N平均纬向的垂直运动合成图(图6a、6b)和100°~120°E平均垂直运动合成图(图6c、6d)可知,长江流域上空以下沉运动为主,且相较历史高温过程,2022年长江流域上空的下沉运动更为明显。这种运动与长江流域上空异常的反气旋对应,即在长江流域上空异常的反气旋控制下,对地面温度有2个方面的作用:一是大气的下沉运动会异常强,而下沉运动会使得大气绝热增温;二是反气旋控制时,空中云量会明显减少,大大减弱了云对太阳的反射作用,从而影响到达地面的太阳辐射,使得到达地面的太阳短波辐射增加(图7)。长江流域2022年高温过程期间平均到达地面的总向下太阳辐射通量增加明显,且流域上空下沉运动异常偏强。对比历史年高温过程与2022年到达地面总的向下太阳辐射通量(图7a、7b),两者差异并不大,但两者的上升、下沉运动的差异较大,即2022年长江流域上空的下沉运动远强于历史年,可见,反气旋控制下的下沉运动使得大气绝热加温对于2022年的高温极端性贡献更大。
图6
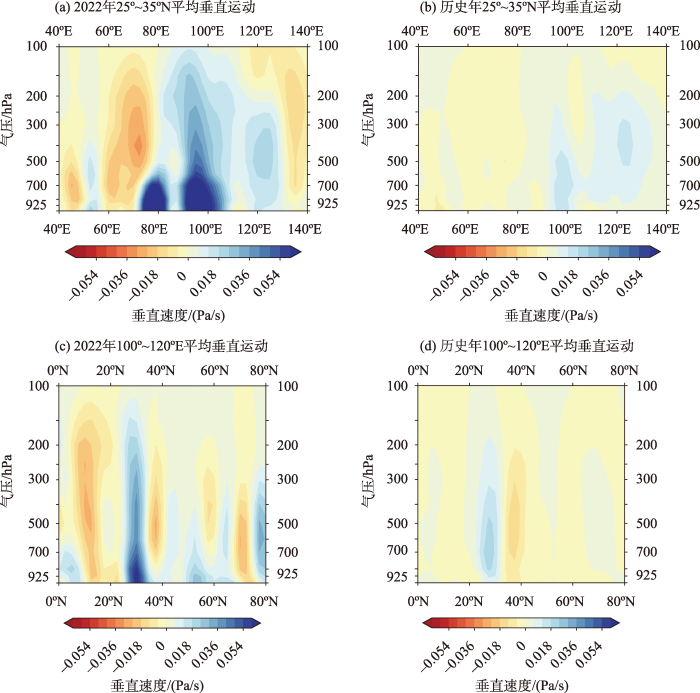
图6
长江流域区域性高温过程垂直运动的异常平均垂直剖面图
Fig.6
Vertical cross-section of omega anomalies for the regional high temperature process in the Yangtze River Basin
图7

图7
长江流域区域性高温天气过程期间平均到达地面的总向下太阳辐射通量距平合成
Fig.7
Anomalies for the average downward solar radiation flux reaching the Earth's surface during the regional high temperature process in the Yangtze River Basin
3.2 西太副高及南亚高压的逐日变化
此外,与历史相比,2022年长江流域高温天气过程期间,对流层中层500 hPa上(图5c),副热带地区高压也类似于南亚高压,5880 gpm线呈现出2个特点:强度异常强,中心达到5905 gpm;西太副高偏北、西伸脊点异常偏西,北非副高、伊朗高压东伸脊点明显偏东。此外,副高体庞大,控制范围广,尤其是西太副高,控制了长江中下游,5880 gpm线闭合线甚至出现在长江上游局部,这足以说明2022年西太副高的强盛。
副高的东西活动与南亚高压的东西进退有着“相向而行、相背而去”的关系[25-26],在此分析副高和南亚高压在高温过程期间逐日的演变情况、高温的逐日发展(图8)。从6月14日左右,200 hPa上南亚高压12560 gpm线开始出现,6月19日后12560 gpm线持续东扩,中心强度增强,至6月底南亚高压中心已达12600 gpm,南亚高压持续东扩,至7月底8月初最东扩至140°E。与此同时,500 hPa上5880 gpm线分为两路,其中一路(北非副高及伊朗高压的东段)自西向东逐渐发展,另一路(西太副高的西段)自东向西发展,两者在7月中旬中后期5880 gpm线形成短暂的合体,7月末至8月底,5880 gpm线稳定而持续地控制长江流域上空,形成环北半球高压带。
图8
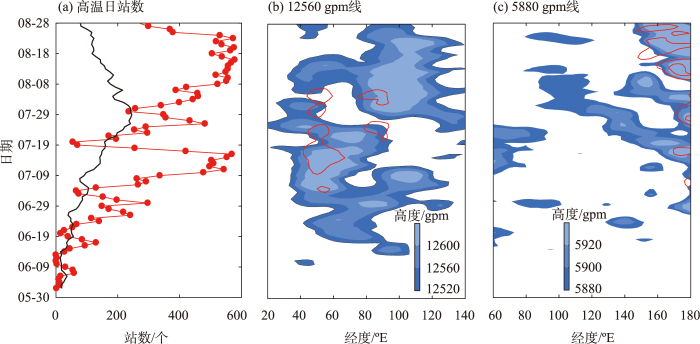
图8
2022年6月1日—8月28日逐日高温日站数及27.5°~40°N平均纬向平均的12560 gpm线和5880 gpm线的逐日演变
注:图a中红线为2022年,黑线为气候平均;图b和c中红色表示气候平均,蓝色填色为2022年。
Fig.8
Daily number of high temperature stations and changes of averaged lines along 27.5°~40°N of 12560 gpm and 5880 gpm from 1 June to 28 August in 2022
从强度上和持续性上看,对流层高层至低层都在7月上旬末至中旬、7月下旬至8月南亚高压及副热带高压强度达到最大,对应逐日高温站数超过400个站,这也是2022年长江流域高温峰值破纪录、过程持续最久、范围控制最广的直接原因。
3.3 波作用量通量频散
北半球夏季对流层的Rossby波能量频散与大气的遥相关相联系,同时也对影响中国的关键环流系统的形成、维持及极端气候事件的发生具有重要作用[27]。本文通过分析500 hPa上的T-N通量,来研究Rossby波能量频散与大气环流演变。
图9
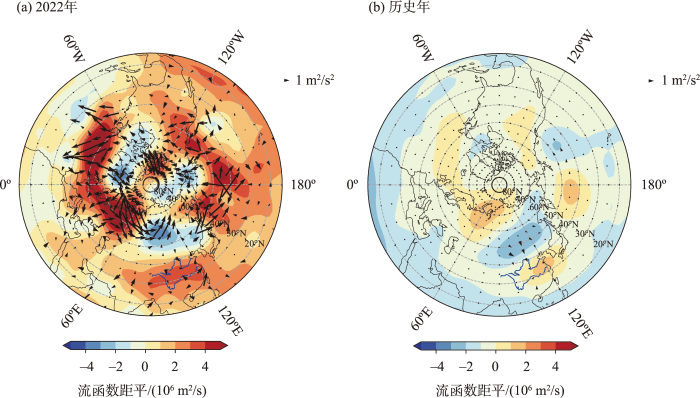
图9
长江流域区域性高温天气过程期间高温过程500 hPa波作用通量和流函数距平
注:矢量为波作用通量(106 m2/s2),填色为流函数(106 m2/s)。
Fig.9
Atmospheric circulation structure for the 500 hPa wave activity flux and related stream function anomalies during the regional high temperature process in the Yangtze River Basin
从波作用量通量可见,Rossby波能量在西欧上空集聚并向东传播,不仅使得西欧地区位势高度场异常增强,同时随着Rossby波能量沿西风波导区向下游频散,特别是在东西伯利亚,使得东西伯利亚高度正高度异常维持与增强。可见,源自欧洲西部经贝加尔湖向东频散的Rossby波能量,对欧亚地区中高纬自西向东“正—负—正”高度距平场异常中心的形成与维持起重要的作用。同时注意到,在副热带地区,尤其是长江流域上空以北受到来自偏北和偏西的能量频散维持,而长江以南受到来自偏南地区的能量频散,由此可见,长江流域上空有Rossby波能量的异常辐合,这为长江流域上空反气旋环流异常维持与增强提供能量,促使西太副高异常发展、持续控制长江流域,进而导致极端高温事件的发生及持续。
4 结论与讨论
本文基于NCEP/NCAR逐日再分析资料和长江流域699个站点逐日温度资料,诊断分析了2022年夏季长江流域高温过程的环流特征及成因。得到以下结论:
(1) 2022年夏季长江流域发生了1961年以来范围最广、强度最强、持续时间最久、强度指数排名第一的高温过程事件。
(2) 造成长江流域高温过程发生的范围大、时间长、极端性强的直接原因主要是东亚大气环流持续异常,最直接表现为南亚高压异常偏东偏强,同时西太平洋副热带高压异常偏西偏强,两者相向运动,打通连接,形成深厚的暖高压,长时间控制了长江流域上空。在高压控制下,长江流域上空的下沉运动异常强,配合到达地面的太阳辐射相对历史同期增加明显,即下沉运动的绝热加热和太阳辐射加热偏强,使得长江流域高温过程发生期间,高温极端性强。
(3) 欧洲西部经贝加尔湖向东频散的Rossby波能量,使得欧亚地区中高纬自西向东维持两脊一槽波列分布,北半球中高纬度表现出稳定的三波型,同时长江流域上空至整个副热带地区为能量辐合区,利于副高的持续发展和维持,为长江流域上空异常正高度距平、反气旋的维持提供能量。
本文分析了2022年长江流域夏季高温过程发生的大气环流背景、大气运动及波能量频散传输情况,简析了造成高温的主要原因。众所周知,异常事件的发生往往是不同纬度环流异常协同作用影响的结果,这些环流异常又与不同外强迫因子密切关联。本文仅着眼于中纬度的西太平洋副热带高压及南亚高压,没有从高、低纬度的环流系统出发,探寻不同纬度的环流协同作用,也没有从海温、积雪等下垫面外强迫的角度深入挖掘,进一步探寻引发环流异常的原因,在未来研究中尚需进一步深入、加强,以期提升高温过程的预测能力。
参考文献
2019年4-6月云南持续性高温天气的大气环流异常成因
[J].
Possible causes of persistently extreme-hot-days-related circulation anomalies in Yunnan from April to June 2019
The North China/northeastern Asia severe summer drought in 2014
[J].
DOI:10.1175/JCLI-D-15-0202.1
URL
[本文引用: 1]

In summer 2014, north China and large areas of northeastern Asia (NCNEA) suffered from the most severe drought of the past 60 years. This study indicates that the East Asian summer precipitation in 2014 exhibited a tripole anomaly, with severe negative anomalies in NCNEA, strong positive anomalies in south China, South Korea, and Japan, and intense negative anomalies in the western North Pacific. Along with the severe tripole precipitation anomalies, there were strong intensities of the Silk Road pattern, the Pacific–Japan pattern, and the Eurasian teleconnection pattern, which were responsible for the strong precipitation anomaly in 2014 through changes to the western Pacific subtropical high (WPSH) and the East Asian trough. Further analysis indicates that the sea surface temperature (SST) in the North Pacific was nearly the warmest in the past 60 years and, together with the strong SST warming in the warm pool region, thus caused the strong Pacific–Japan teleconnection pattern, southward positioning of the WPSH, and weakened East Asian summer monsoon. Additionally, the summertime sea ice cover in the Arctic Ocean was anomalous, resulting in high SST in the Laptev–Kara Sea and, hence, triggering a strong Eurasian teleconnection pattern and contributing to the severe drought of NCNEA. Furthermore, the intense warming over the European Continent and Caspian Sea favored the Silk Road pattern, also contributing to the southward positioning of the WPSH and the NCNEA drought. The NCNEA severe drought was therefore the joint result of Pacific SST anomalies, Arctic sea ice anomalies, and warming over the European Continent and Caspian Sea.
1960—2016年黄土高原干旱和热浪时空变化特征
[J].
DOI:10.18306/dlkxjz.2020.04.006
[本文引用: 1]
基于1960—2016年黄土高原49个气象台站日最高气温和月降水数据,论文利用百分位高温阈值和标准化降水指标对黄土高原干旱和热浪时空变化特征进行了分析,识别并探讨了干旱和热浪同时发生事件的演变规律。结果表明:① 黄土高原热浪频次整体呈增加趋势,日高温热浪增加趋势最大,增速达到0.29次/a,1995年之后增加趋势更为明显,显著增加区域集中在山西东北部、青海省东部和甘肃中南部;② 1960—2016年黄土高原旱涝指数呈下降趋势,即表现为由涝转旱,20世纪90年代初为旱涝变化的转折点,年旱涝指数下降趋势显著区占整个研究区的62%,其中黄土高原沟壑区南部、陕北南部、山西南部、甘肃东部干旱趋势较为明显;③ 干旱和热浪同时发生事件总体呈现增加趋势,增速为0.66次/10 a,其中1960—1979年呈下降趋势,降速为-0.26次/a,1980—2002年呈增加趋势,2003年之后变化趋势较为平稳;空间上,山西东部、陕北南部和甘肃东南部发生频次较高,并且显著增加区主要位于山西东北部、甘肃中东部和宁夏北部。
Spatiotemporal changes of droughts and heatwaves on the loess plateau during 1960-2016
DOI:10.18306/dlkxjz.2020.04.006
[本文引用: 1]
Based on daily maximum temperature and monthly precipitation data of 49 meteorological stations on the Loess Plateau during 1960-2016 and using the 90th percentile of the temperature as extreme temperature thresholds and standardized precipitation index (SPI), this study examined the spatiotemporal variation characteristics of heatwaves and droughts and the dynamics of concurrent droughts and heatwaves across the Loess Plateau. The results show that: 1) The occurrence frequency of heatwaves presented an increasing trend on the Loess Plateau during the recent 57 years with a liner tendency of 0.29 times/a, of which a significant increasing trend was detected after 1995. The significantly increasing areas were mainly distributed in the northeast of Shanxi Province, eastern Qinghai Province, and southern and central Gansu Province. 2) Standardized precipitation index (SPI) showed a downward trend in the recent 57 years, indicating a trend from water-logging to drought, and the early 1990s was a turning point. Particularly, areas with the declining trend of SPI12 accounted for 62% of the whole study area, and regions with significant drought were mainly distributed in the south of the gully areas of the Loess Plateau, the southern part of Northern Shaanxi, the south of Shanxi Province, and the east of Gansu Province. 3) The simultaneous occurrence frequency of droughts and heatwaves showed an overall increasing trend, with a growth rate of 0.66 times/10 a. From 1960 to 1979 it showed a declining trend of -0.26 times/a, then an increasing trend of 0.52 times/a from 1980 to 2002, while a steady increasing trend was detected after 2003. Spatially, the high incidence of droughts and heatwaves was observed in the eastern of Shanxi, the south of Northern Shaanxi, and the southwest of Gansu; areas with increasing trend were mainly concentrated in the northeast of Shanxi, central and eastern Gansu, and northern Ningxia.
1960—2016年秦岭—淮河地区热浪时空变化特征及其影响因素
[J].
DOI:10.18306/dlkxjz.2018.04.006
[本文引用: 1]
基于134个气象站点1960-2016年逐日最高温和相对湿度数据,辅以趋势分析、空间分析和相关分析等方法,对秦岭—淮河地区热浪时空变化特征进行分析,探讨了赤道东太平洋海温异常与热浪变化的相关关系。结果表明:①近57年秦岭—淮河地区热浪呈现“非线性、非平稳和阶段性”的变化过程,年代变化可分为3个阶段:1960-1972年热浪呈现东西分异,分界线大致位于112°E,以东地区热浪异常偏多,以西地区则“高低交替”波动;1973-1993年热浪维持“低位波动”,并在20世纪80年代中期呈现快速增加;1994-2016年,关中平原、秦巴山区、巫山山区和四川盆地热浪维持“高位波动”,黄河下游、淮河平原和长江下游热浪则经历从“相对偏多”向“相对偏少”的转变;②在影响因素方面,最高温波动变化是秦岭—淮河地区热浪频次年代变化的主导因素,相对湿度变化的影响相对较弱;③近57年来关中平原热浪年代变化与赤道太平洋西部海温异常关系更为密切,长江流域与东部海温异常关系更为密切;对于黄河下游和秦巴山区的热浪变化与不同分区赤道太平洋海温异常关系均较弱。
Spatiotemporal variability of heat waves and influencing factors in the Qinling-Huaihe region, 1960-2016
DOI:10.18306/dlkxjz.2018.04.006
[本文引用: 1]
In the context of global warming, the likelihood of concurrent heat waves is expected to increase in most parts of China, which will have social and environmental impacts. However, heat wave characteristics are likely to vary regionally. Based on maximum daily temperature and relative humidity data from 134 meteorological stations for the 1960-2016 period, the spatiotemporal variation in heat waves was investigated for the Qinling-Huaihe region. We also analyzed the relationship between El Ni?o-Southern Oscillation (ENSO) and heat waves. We found that the heat waves in the past 57 years in the study region can be characterized as non-smooth and non-linear. Three distinct phases of decadal change were identified. During the first phase (1960-1972), with 112°E as the dividing line, heat waves were highly variable with alternating highs and lows in the western part of the region, but occurred at high frequency in the eastern part. During the second phase (1973-1993), heat waves showed low-amplitude fluctuations across the entire region, and rapidly increased in the mid-1980s. The third phase (1994-2016) saw high-amplitude fluctuations in heat waves in the western part of the region, but heat waves decreased in the eastern part. Our results show that over the entire region, the extremes in heat have been more sensitive to daily maximum temperature than regional relative humidity changes. Thus, the cooling of daily maximum temperature along the Huai River led to a decreasing heat wave spatial extent. There was also a notable difference in the relationship between ENSO and heat waves in the Qinling-Huaihe region: a strong positive correlation in the north and a weak negative correlation in the south were observed. Particularly, heat waves on the Guanzhong Plain have been closely related to Ni?o 4, whereas the relationship has been weak along the lower reach of the Yangtze River. The Ni?o 1+2 and Ni?o 3 indices showed significant negative correlations with heat waves across the lower reach of the Yangtze River. In the lower reach of the Yellow River and Qinling-Daba Mountains, the variations in heat waves have been weakly correlated with equatorial Pacific sea surface temperature anomalies. In addition, there has been more close relationship between temperature anomalies of equatorial Western Pacific and decadal variation of heat waves on the Guanzhong Plain in recent decades, which has contributed to enhanced warming on the Guanzhong Plain and along the lower reach of the Yangtze River.
我国及北半球多地遭遇极端高温
[N].
China and many places in the northern hemisphere have suffered from extreme high temperatures
2022年夏季中国高温干旱气候特征及成因探讨
[J].
Characteristics and causes of the hot-dry climate anomalies in China during summer of 2022
Relative contributions of external SST forcing and internal atmospheric variability to July-August heat waves over the Yangtze River Valley
[J].
2013年长江中下游夏季高温干旱演变过程及环流异常成因简析
[J].
Evolution and abnormal causes for high temperature and drought in the middle and lower reaches of Yangtze River in summer of 2013
2013年夏季长江中下游地区高温干旱的大气环流特征及成因分析
[J].
DOI:10.7522/j.issn.1000-0534.2016.00129
[本文引用: 1]
利用1981-2013年长江中下游地区90个气象观测站的逐日气温和降水资料、NCEP/NCAR逐日再分析资料及ERSSTv4海温资料,对2013年夏季发生于长江中下游地区的异常高温干旱事件基本特征及其可能影响机制进行了讨论。结果表明:(1)降水量较同期偏少49.43%,7月中、下旬出现旱情并逐步发展,8月上、中旬旱情最为严重,整体呈现中到重旱,局部地区达到特旱,气温偏高5℃以上;(2)受负EAP/PJ(东亚太平洋型/东亚日本型)遥相关型影响,西太平洋副热带高压(下称西太副高)面积偏大、西伸脊点异常偏西、强度偏强,长期控制长江流域,是诱发此次高温干旱的直接成因;东亚夏季风偏强、副热带西风急流偏北,致使长江流域暖湿空气偏强而冷空气不足,加之下沉气流影响,不利于形成降水。(3)8月第1候至第2候,受负"Silk Road"(丝绸之路)遥相关型影响,源自北大西洋的Rossby波沿急流波导区向东频散至东亚-太平洋地区,加强了负EAP/PJ遥相关型中高纬度两个高度异常中心,对其形态的维持与发展起着重要作用,将西太副高的异常发展推向鼎盛时期;(4)西太平洋暖池区海温异常偏高是负EAP/PJ遥相关型长期维持的重要原因;而7月北大西洋海温异常偏高与西风急流异常偏北密切相关,是影响东亚季风系统各成员配置的又一可能成因。
Analysis of atmospheric circulation characteristics and mechanism of heat wave and drought in summer of 2013 over the middle and lower reaches of Yangtze River Basin
DOI:10.7522/j.issn.1000-0534.2016.00129
[本文引用: 1]
Based on the daily temperature and precipitation data of 90 stations from 1981 to 2013 in the middle and lower reaches of Yangtze River (MLRYR) in China, the NCEP/NCAR daily reanalysis data and monthly NOAA Extended Reconstructed Sea Surface Temperature v4 (ERSSTv4) data, the general characteristics and effect mechanism of the continuous hot-dry weather occurred in MLRYR during the summer of 2013 had been investigated. The results were shown as follows:(1) The rainfall was less 49.43% than the historical average. A drought was started in the middle and last dekad of July and then developed gradually, the most severe drought was happened in the first and middle dekad of August while the whole MLRYR was caught in moderate to severe drought, some local areas of MLRYR were reached special drought with the daily mean temperature on the high side 5℃. (2) Affected by the negative phase of EAP (East Asia Pacific)/PJ (Pacific Japan) teleconnection, WPSH (western Pacific subtropical high) was larger, stronger and the position was westward than normal, controlled MLRYR for a long time, which was one of the most direct reasons for why the heat wave and drought happened. Because of the strong EASM (East Asian summer monsoon) and northward EASWJ (East Asian subtropical westerly jet), the warm-moist and cold-dry air did not match in MLRYR, combined with the descending motion effects, which was not conducive to the formation of precipitation. (3) By the influence of "Silk Road"teleconnection from August 1st to 2nd pentad, Rossby waves originated from the North Atlantic along the westerly jet stream waveguide dispersed to East Asia-Pacific region, enhanced two height anomaly centers at middle and high latitude of the negative phase of EAP/PJ teleconnection, which played an important role in the maintenance and development of its morphology, and prompted the abnormal development of the WPSH to the peak period. (4) The high SST anomaly in the warm pool of the Western Pacific is the main reason for the long-term maintenance of negative EAP/PJ teleconnection. While the anomalous high SST in the North Atlantic Ocean in July is closely related to the westerly jet anomaly, which is an another possible cause for the configuration of the East Asian monsoon system.
长江中下游地区2011年冬春连旱及2013 年夏季高温干旱环流特征及其与Rossby 波活动的联系对比分析
[J].
A comparison of the Rossby wave activities and circulation features of the drought in winter-spring of 2011 and in summer of 2013 over mid-lower reaches of the Yangtze River Basin
Teleconnections in the geopotential height field during the northern hemisphere winter
[J].DOI:10.1175/1520-0493(1981)109<0784:TITGHF>2.0.CO;2 URL [本文引用: 1]
Convective activities in the tropical Western Pacific and their impact on the Northern Hemisphere summer circulation
[J].
The east Asia/Pacific pattern teleconnection of summer circulation and climate anomaly in East Asia
[J].
Understanding a hot summer in central eastern China: Summer 2013 in context of multi-model trend analysis
[J].
2013年浙江省夏季异常高温天气特征及其成因分析
[J].
Characteristics and causes of an extremely high-temperature event in the summer of 2013 in Zhejiang Province
2013年夏季湖南省持续高温干旱变化特征及其成因分析
[J].
Characteristic and formation analysis of a persistent high temperature and drought event in Hunan Province during summer season in 2013
两湖流域盛夏持续性旱涝过程诊断分析
[J].
Diagnosis of persistent drought/flood events in Two Inner Lakes' region of China
DOI:10.46267/j.1006-8775.2022.002
URL
[本文引用: 1]
By deriving the discrete equation of the parameterized equation for the New Medium-Range Forecast (NMRF) boundary layer scheme in the GRAPES model, the adjusted discrete equation for temperature is obviously different from the original equation under the background of hydrostatic equilibrium and adiabatic hypothesis. In the present research, three discrete equations for temperature in the NMRF boundary layer scheme are applied, namely the original (hereafter NMRF), the adjustment (hereafter NMRF-gocp), and the one in the YSU boundary-layer scheme (hereafter NMRF-TZ). The results show that the deviations of height, temperature, U and V wind in the boundary layer in the NMRF-gocp and NMRF-TZ experiments are smaller than those in the NMRF experiment and the deviations in the NMRF-gocp experiment are the smallest. The deviations of humidity are complex for the different forecasting lead time in the three experiments. Moreover, there are obvious diurnal variations of deviations from these variables, where the diurnal variations of deviations from height and temperature are similar and those from U and V wind are also similar. However, the diurnal variation of humidity is relatively complicated. The root means square errors of 2m temperature (T2m) and 10m speed (V10m) from the three experiments show that the error of NMRF-gocp is the smallest and that of NMRF is the biggest. There is also a diurnal variation of T2m and V10m, where T2m has double peaks and V10m has only one peak. Comparison of the discrete equations between NMRF and NMRF-gocp experiments shows that the deviation of temperature is likely to be caused by the calculation of vertical eddy diffusive coefficients of heating, which also leads to the deviations of other elements.
The NCEP/NCAR 40-year reanalysis project
[J].DOI:10.1175/1520-0477(1996)077<0437:TNYRP>2.0.CO;2 URL [本文引用: 1]
On the three-dimensional propagation of stationary waves
[J].DOI:10.1175/1520-0469(1985)042<0217:OTTDPO>2.0.CO;2 URL [本文引用: 1]
A formulation of a wave-activity flux for stationary Rossby waves on a zonally varying basic flow
[J].DOI:10.1029/97GL03094 URL [本文引用: 2]
A formulation of a phase-independent wave-activity flux for stationary and migratory quasigeostrophic eddies on a zonally varying basic flow
[J].DOI:10.1175/1520-0469(2001)058<0608:AFOAPI>2.0.CO;2 URL [本文引用: 1]
2018年夏季辽宁异常高温干旱的环流特征及成因
[J].
Analysis of circulation characteristics and cause of anomalous high temperature and drought in summer of 2018 over Liaoning
夏季亚洲南部100毫巴流型的变化及其与西太平洋副热带高压进退的关系
[J].
The 100 mb flow patterns in southern Asia in summer and its relation to advance and retreat of the west-pacific subtropical antcyclone over the far east
南亚高压强度年代际变化及其与热带副热带海温关系
[J].
The interdecadal variation of south Asian high and its association with the SST of tropical and subtropical regions
