

冻害是影响植物生长发育和繁殖的严重自然灾害之一[1]。冻害诱导冰核在质外体中形成,从而对细胞膜造成物理损伤,导致细胞脱水死亡[2]。植物芽、叶和花遭受冻害将导致植物光合能力下降、果实产量减少,进而使得群落生产力降低,并造成巨大的生态和经济损失[3⇓-5]。有研究表明,仅一次0 ℃以下的霜冻事件就可能导致植物高达90%的产量损失[6]。一般而言,植物在冬季休眠期内的抗冻性较强,甚至能耐受零下几十度的低温[7],因此较少遭受冻害[8]。然而,随着春季回暖,气温逐渐升高,植物的抗冻能力经过脱锻炼后迅速降低[9]。因此,在植物春季展叶或开花期间突发气温骤降等事件时,植物极易受冻害的影响[10]。评估植物在春季遭遇的冻害风险对制定气候变化的响应和适应策略具有重要意义。
过去几十年,气候变化已导致欧洲地区植物的春季冻害发生了明显变化[11]。如对欧洲中部13种植物春季叶和花的冻害模拟研究发现,由于终霜冻日提前速率大于植物物候提前速率,霜冻时段整体缩短,植物的冻害风险降低[12]。这一结论在后续研究中也得到了进一步验证[7,13]。但与此相反,对瑞士地区13种乔木和灌木的冻害模拟结果显示,1950—2011年各物种春季冻害主要呈增大趋势[14],这一结论也得到了部分研究的支持[15]。有学者尝试对中国典型站点的植物冻害进行探讨,结果显示,1976—2016年中国香港等特定站点的植物冻害变得更加频繁[16],但温带地区大部分站点的植物冻害反而有所减弱[17-18]。由此可见,植物春季冻害变化的方向和幅度根据研究物种和研究区域的不同存在较大差异。
这种差异的可能原因是气候增暖对植物春季冻害的影响具有双重性。首先,春季气温持续升高导致全球大部分地区霜冻日数减少,霜冻强度降低、最后一次发生霜冻事件的日期即终霜冻日大幅提前[19]、植物遭遇冻害的潜在时段缩短[20]。例如,中国577个气象站点的观测记录显示,1961—2007年霜冻日数平均每年减少0.34 d[21-22]。在此影响下,植物遭受的冻害风险可能呈减小趋势。然而,春季增温同时使植物春季物候发生的积温需求能更快满足,导致春季物候期显著提前[23]。例如,通过对中国1263条物候变化序列的荟萃分析显示,1960—2011年木本植物春/夏季物候平均每年提前0.23 d,并且提前幅度在1980年代以后更大[24]。植物春季物候的提前将导致植物的叶和花在春季回暖前更早地暴露在低温环境中,也更易遇到强烈的冻害事件[25-26],进而导致植物的冻害风险增大。因此,植物冻害变化取决于冻害发生强度、频率与植物物候变化的权衡关系。
中国地域辽阔,气候复杂。不同气候区初、终霜冻日期及其年际变化差异明显[22],且植物春季物候在南方地区的提前幅度显著大于北方[24]。在此综合影响下,植物冻害可能呈现较大的空间差异。目前,国内仅有少数研究在有限的站点结合植物物候变化开展了植物冻害风险分析[18],仍缺乏对植物冻害在全国时空分布格局的系统评估。本文基于中国物候观测网(www.cpon.ac.cn)的物候记录和日平均温度、最低温度格网数据,模拟了1980—2018年4种中国典型落叶阔叶木本植物(榆树、刺槐、白蜡、垂柳)在全国的物候变化和春季冻害变化。本文的目标是:① 揭示在升温导致的霜冻事件变化和物候变化的综合影响下,植物叶春季冻害变化的时空格局,识别冻害的种间差异;② 探究植物叶最大冻害发生时间的变化及其与植物物候的关系。本文研究结果可为准确评估植物冻害风险、针对不同区域制定气候变化的响应和适应策略提供参考。
1 数据与方法
1.1 研究区概况和数据
本文的研究对象(榆树、刺槐、白蜡、垂柳)均为中温带针叶与落叶阔叶混交林、暖温带落叶阔叶林的优势物种,在中国分布广泛(表1、图1)。榆树、垂柳和白蜡原产于中国,经长期适应,对干冷气候的忍耐力相对较强;而刺槐是一种原产于北美的温带树种,18世纪末引入中国,抗冻性相对较差[27]。选择这4种植物为研究对象有良好的地域代表性,且能较好地反映植物抗冻性和冻害变化的种间差异。此外,本文从中国物候观测网获取了各物种1963—2018年的展叶始期观测数据。这4种植物在中国物候观测网的物候观测记录最丰富,因此,以这4种植物为研究对象建立的物候模型代表性较强、精度较高。根据中国物候观测方法,展叶始期定义为观测植株出现第一批有一、二片的叶片平展的时间[28]。综合中国木本植物分布图集[29]、全球生物多样性信息网络(Global Biodiversity Information Facility,GBIF)、中国数字植物标本馆(Chinese Virtual Herbarium,CVH)的记录可识别各物种在中国无分布的省份(表1)。本文将各物种有分布记录的省份作为该物种的理论分布区。在后续分析中,仅对各物种在理论分布区内的物候和冻害变化格局进行研究。
表1 研究涉及的物种信息
Tab.1
| 物种名 | 拉丁名 | 站点数量/个 | 观测站点 | 记录数量/条 | 平均展叶始期(序日) | 无分布省份 |
|---|---|---|---|---|---|---|
| 榆树 | Ulmus pumila | 53 | 蚌埠、保定、北安、北京、承德、贵阳、哈尔滨、汉中、杭州、合肥、呼和浩特、呼玛、虎林、黄山、霍山、鸡西、济南、佳木斯、酒泉、昆明、拉萨、民勤、牡丹江、南昌、南充、南京、嫩江、齐齐哈尔、秦皇岛、沈阳、石家庄、太原、天津、潍坊、乌鲁木齐、乌苏、武功、西安、西宁、锡林浩特、邢台、熊岳、徐州、延安、伊春、宜昌、银川、鄞县、榆林、原平、张家口、长春、郑州 | 545 | 4月13日(104.8) | 海南 |
| 刺槐 | Robinia pseudoacacia | 49 | 蚌埠、保定、北京、常德、承德、贵阳、哈尔滨、杭州、合肥、衡阳、呼和浩特、黄山、吉安、济南、昆明、拉萨、民勤、牡丹江、南昌、南充、南京、南平、嫩江、秦皇岛、沈阳、石家庄、太原、天津、屯溪、潍坊、武功、武汉、西安、西昌、西宁、信阳、邢台、熊岳、徐州、雅安、延安、宜宾、宜昌、银川、榆林、原平、张家口、长春、郑州 | 568 | 4月12日(103.0) | 海南 |
| 垂柳 | Salix babylonica | 54 | 蚌埠、保定、北安、北京、承德、福州、贵阳、桂林、哈尔滨、杭州、合肥、衡阳、呼和浩特、虎林、黄山、鸡西、济南、佳木斯、昆明、柳州、牡丹江、南昌、南充、南京、南平、嫩江、平湖、秦皇岛、厦门、沈阳、石家庄、太原、天津、屯溪、潍坊、武功、武汉、西安、西昌、西宁、信阳、邢台、熊岳、宿县、雅安、延安、宜宾、银川、鄞县、榆林、原平、张家口、长春、郑州 | 522 | 3月20日(80.9) | — |
| 白蜡 | Fraxinus hinensis | 19 | 保定、北京、贵阳、哈尔滨、呼和浩特、昆明、柳州、南昌、秦皇岛、太原、天津、乌鲁木齐、乌苏、西安、邢台、熊岳、延安、银川、郑州 | 195 | 4月7日(98.4) | 西藏、新疆、青海 |
注:序日指从1月1日起的日数;“—”表示该物种在所有省份区域均有分布;未包含港澳台地区数据。
图1
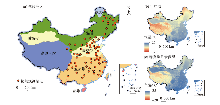
图1
研究区气候分区[30]和气候标准时段(1981—2010年)气候背景
注:本图基于自然资源部标准地图服务网站下载的审图号为GS(2019)1823号的标准地图制作,底图无修改。下同。
Fig.1
Climate zones and climatic background of the study area during the standard period (1981-2010)
1.2 研究方法
1.2.1 冻害时段和冻害程度计算
式中:LT50为植物叶片春季的抗冻性(温度);TLUD, TLUD+1,…, TLFD表示展叶始期到终霜日的逐日最低温度;min表示整个时段日最低温度的最小值。FD越大,表明植物叶片遭受的春季冻害越大。FD出现的日期称为最大冻害时间(occurrence time of maximum frost damage, TMFD)。若出现多个最大冻害时间,则记录为第一次出现的时间。若植物在展叶始期到7月15日之间未发生冻害事件,则植物的冻害程度记为0。冻害时段和冻害程度计算方法示意如图2所示。
图2

图2
冻害时段和冻害程度的示意图
注:图中红色和蓝色分别表示2个不同物种的物候期。
Fig.2
Schematic diagram of the period and degree of frost damage
式中:LT50i和LT50BJ分别为植物叶片春季在地点i和北京的抗冻性,Ti和TBJ分别为地点i和北京的春季多年平均温度。校正系数α表示春季温度平均每高1 ℃,抗冻性减小的绝对值,单位为℃/℃。本文参考Li等[40]在欧洲北部、中部和南部测定的欧洲白桦(Betula pendula Roth)抗冻性差异和3个区域的春季温度差异,将α设置为0.05。利用式(2)模拟各物种叶片春季在全国不同区域的抗冻性。
1.2.2 春季物候期模拟和检验
式中:y为展叶始期,xt是第t天的日平均气温,Rf(xt)是驱动单元,Tl为临界温度,t0是驱动单元开始累积的时间,a、b、f是模型参数,
1.2.3 时空格局分析
分别以年份为自变量,各物种展叶始期和冻害程度为因变量进行回归分析,回归系数即为展叶始期和冻害的年际变化趋势。通过对最低温度数据进行滑动t检验分析发现,1985—2015年,全国平均最低温度在每一年的前后2个时段(如1980—1985年和1986—2018年)都呈现显著差异(P<0.001)。因此考虑将1980—2018年分为2个长度相近的时段,即1980—1999年和2000—2018年,并对这2个时段的植物最大冻害时间进行比较。同时,为比较植物冻害程度及最大冻害时间变化的空间格局,按照气候分区分别进行统计,并比较各气候分区间的差异。由于各物种在热带地区的冻害可能不明显,因此,仅对寒温带、温带、亚热带、暖温带和高原气候区5个气候分区进行统计。
2 结果与分析
2.1 春季物候变化的时空格局
图3
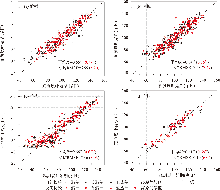
图3
不同气候区春季物候模型的拟合效果
注:**表示P<0.01。下同。
Fig.3
Performance of the TSC model in simulating the leaf unfolding date of the species for different climatic regions
表2 不同区域春季物候模型参数
Tab.2
| 物种名 | 气候分区 | a | b | f | Tl | t0 |
|---|---|---|---|---|---|---|
| 榆树 | 温带 | 241.31 | 69.49 | 7.67 | 0.66 | 30 |
| 暖温带 | 232.60 | 58.12 | 8.16 | 0.71 | 22 | |
| 亚热带 | 170.26 | 15.18 | 9.53 | 3.86 | 28 | |
| 高原气候区 | 197.04 | 160.74 | 4.28 | 0.75 | 17 | |
| 刺槐 | 温带 | 236.35 | 183.39 | 8.88 | 1.80 | 24 |
| 暖温带 | 173.75 | 66.65 | 8.49 | 3.73 | 28 | |
| 亚热带 | 254.95 | 51.44 | 7.94 | 2.44 | 24 | |
| 高原气候区 | 182.82 | 186.12 | 4.59 | 1.08 | 16 | |
| 垂柳 | 温带 | 172.33 | 15.59 | 9.28 | 0.01 | 29 |
| 暖温带 | 171.21 | 15.51 | 7.96 | 0.01 | 25 | |
| 亚热带 | 170.28 | 15.32 | 4.61 | 0.04 | 23 | |
| 高原气候区 | 174.43 | 17.62 | 9.15 | 0.01 | 30 | |
| 白蜡 | 温带 | 318.42 | 29.05 | 4.48 | 0.25 | 21 |
| 暖温带 | 176.98 | 111.96 | 9.70 | 2.48 | 27 | |
| 亚热带 | 213.23 | 26.67 | 5.83 | 1.38 | 28 |
利用构建的TSC模型模拟了各物种1980—2018年在不同区域的展叶始期(图4)。总体而言,榆树、刺槐和白蜡的平均展叶始期集中在4月下旬,且在空间上呈现显著的南早北晚特征,空间上的标准差约1个月。相比之下,垂柳的展叶始期相对较早(主要集中在4月中旬),且南北差异更加明显(标准差约40 d)。从变化趋势的空间格局上看,各物种展叶始期在大部分区域均呈现提前趋势,提前趋势显著(P<0.05)且提前幅度大于1 d/a的区域占总面积的近60%。各物种展叶始期显著推迟的区域面积不超过总面积的20%,这些区域主要位于青藏高原的西北部和北部边缘。
图4
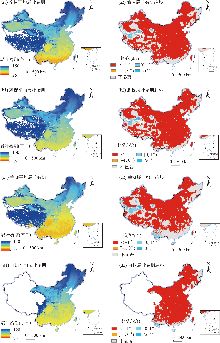
图4
各物种平均展叶始期及展叶始期变化趋势的空间格局
注:本图基于中国物候观测网的观测数据进行模拟,覆盖全国范围。下同。
Fig.4
Spatial pattern of mean LUD and trend in LUD for each species
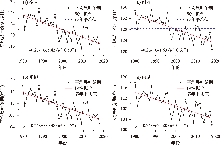
各物种平均展叶始期的年际变化相似,最晚的展叶始期出现在1980年和1988年,最早的展叶始期发生在2009年和2018年(图5)。值得注意的是,所有物种展叶始期在2010—2012年间均出现一个小的峰值。在此时段内,各物种展叶始期大多晚于其多年平均值。就变化趋势而言,1980—2020年各物种展叶始期总体呈显著提前趋势,提前幅度达到0.24~0.27 d/a。
图5
2.2 植物春季最大冻害时间变化
除冻害程度外,各物种叶片发生最大冻害的时间在1980—1999年和2000—2018年2个时段也呈现明显差异(图6)。在前一时段,各物种在全国的平均最大冻害时间为5月4日(序日:126),标准差14.5 d;在后一时段,平均最大冻害时间提前了约一周(4月27日,序日:119),标准差和前一时段基本一致。频率分布结果显示,各物种最大冻害时间提前的区域面积占比达到72.22%~83.03%。其中,榆树、刺槐、垂柳最大冻害时间提前幅度主要集中在0~10 d,占比分别达到48.2%、53.2%和32.7%。而白蜡最大冻害时间提前10~25 d的区域最多。最大冻害时间推迟的区域面积占比仅约为1/6。
图6

除亚热带外,各物种在不同气候分区的最大冻害时间均主要呈提前趋势(图7)。其中,各物种在温带地区最大冻害时间的提前最明显,2000—2018年比1980—1999年平均提前8.3 d。其次为暖温带(平均提前6.2 d)、亚热带(平均提前5.2 d)、高原气候区(平均提前3.9 d)和寒温带(平均提前3.4 d)。此外,最大冻害时间变化也呈现明显的种间差异。其中,白蜡最大冻害时间的提前幅度最大,在所有气候分区平均提前8.6 d。其他3个物种最大冻害时间的提前幅度约为白蜡的1/2(4.4~4.9 d)。
图7
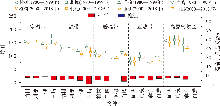
图7
不同气候分区最大冻害时间变化
注:图中每个物种线段长度表示最大冻害时间变化标准差。
Fig.7
Changes in the occurrence time of maximum frost damage for different climatic zones
2.3 植物春季冻害变化的时空格局
图8显示了不同物种叶片春季冻害的多年平均值和变化趋势。总体上,榆树、刺槐的春季冻害程度相对较高,特别是在东北50°N以北、天山北部以及青藏高原西缘部分地区。这2个树种最大冻害分别达到2.37、2.78 ℃,平均冻害分别为0.11、0.10 ℃。相较而言,垂柳和白蜡的春季冻害程度较低。垂柳的最大冻害出现在青藏高原西部和北部边缘地区,最大冻害程度约为榆树和刺槐的1/4(0.63 ℃),平均冻害仅为榆树和刺槐的约1/5(0.02 ℃)。白蜡的冻害程度总体最低,最大冻害为0.42 ℃,平均冻害(0.003 ℃)远低于其他物种。各物种冻害的年际波动也较为相似。最低冻害均发生在1988年前后,而2001、2014和2018年是3个冻害峰值年份。就年际趋势而言,榆树、刺槐和垂柳的年平均冻害程度显著增大(P<0.05),而白蜡的冻害变化不显著。
图8
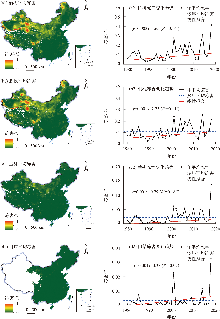
图8
各物种多年平均冻害的空间格局及冻害的年际变化
注:*、**分别表示P<0.05、P<0.01。
Fig.8
Spatial pattern of multiyear mean frost damage and interannual variations in frost damage for each species
不同气候分区下,各物种的平均冻害呈现较大差异(图9)。其中,春季冻害在寒温带地区最为显著(榆树和刺槐的平均冻害超过0.4 ℃),在温带、暖温带和高原气候区域较少(平均值不到0.2 ℃),在亚热带地区极少发生。就冻害的变化趋势来看,榆树和垂柳在寒温带地区冻害增加的比例最大,其次为温带、高原气候区和暖温带。刺槐在高原气候区冻害增加的比例近10%,在寒温带、温带和暖温带区的冻害增加的比例均在3%~6%之间。白蜡仅在暖温带地区的冻害有所增加,冻害增加的比例约为0.5%。相比之下,榆树和刺槐的春季冻害在温带、暖温带和高原气候区的少数地区有所减少,这些地区占比均不足1%。
图9
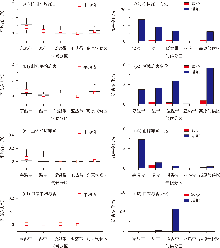
图9
不同气候分区平均冻害及其变化趋势
Fig.9
Mean frost damage and trend in frost damage for each climatic zone
3 讨论
植物在长期适应环境过程中通过自身的变异和自然选择获得了对低温的适应能力,即植物的抗冻性。在整个生命周期内,植物抗冻性受温度和光周期调控,呈周期性变化,这是植物降低冻害风险的一种适应策略[15,44]。总体而言,植物在初秋暴露在短日照环境下,木质部导管的水分被抽回,以防枝干发生冰冻时出现水膨胀而开裂;当温度降低至0 ℃以下,植物经过抗冻锻炼,抗冻性显著增强[42]。在早春萌芽之前,植物经历一段时期的冷激后,芽开始对气温变暖和日照增长变得敏感,随着气温回升,植物抗冻性逐渐减弱[8,45]。这种植物抗冻性的周期性变化与植物物候密切相关。已有研究提出植物抗冻性变化拐点和植物物候期近似对应,春季当芽的鳞片开始脱落(芽膨大)后,抗冻性开始下降,当超过一半的小枝的叶子展叶时,植物抗冻性达到最弱水平[17]。因此,植物冻害通常更易发生在抗冻性最弱的展叶阶段。植物叶的春季冻害基本可表征其全年的最大冻害。
早在1986年,Cannell等[46]就提出冻害假说(frost damage hypothesis),指出虽然随着气候增暖,霜冻事件发生的频率减少、程度降低,终霜日提前,在一定程度上降低了植物冻害的概率,但气候变暖将同时导致树木过早萌芽,从而增大植物在早春霜冻期间遭受的冻害。后续大量研究对这一假说进行了论证。例如,对美国东北部和芬兰等地区木本植物的冻害分析结果显示,随着全球温度升高,植物物候期提前将导致植物遭受的冻害概率增大[47-48]。本文的结果同样显示,榆树、刺槐和垂柳的展叶始期提前,年平均冻害程度均呈现显著增大趋势,进一步证实了物候提前导致植物冻害增大的负面效应。但值得注意的是,白蜡的年平均冻害程度变化并不明显,主要原因包括2个方面:首先相比于榆树和刺槐,白蜡春季叶的抗冻性(-4.9 ℃)更强,因此当暴露于程度较轻的霜冻事件中时,白蜡遭受的损伤相对较小。其次,白蜡的展叶始期(平均观测日期为4月7日)比垂柳(3月20日)晚半个多月,气候增暖使垂柳可能提前在2月底到3月初展叶,此时的低温环境较为严酷。而白蜡展叶时的环境仍相对较为温和,因此其遭受的早春冻害较小。综上所述,气候增暖背景下,展叶始期较早或抗冻性较弱的物种往往面临冻害事件时更加脆弱,冻害风险更高。
从本文的结果还可看出,各物种叶片发生最大冻害的平均时间为4月下旬到5月上旬,其中在北方大部分地区集中在3—4月,说明在大部分地区最大冻害仍发生在春季,特别是早春。春季气温回升后,因寒潮导致的突然急剧降温,即“倒春寒”现象,极易造成植物叶片冻伤。相比之下,夏季的温度变化较为平稳,极端低温较少,因此,植物叶片在夏季的最大冻害通常小于春季。但值得注意的是,青藏高原和东北部分地区由于春夏季温度整体较低,植物展叶较晚,因此叶的最大冻害主要发生在春末夏初。此外,本文还发现植物叶片的最大冻害时间呈现提前的趋势,与植物展叶始期的变化趋势相一致。这进一步证实在当前气候变化条件下,展叶始期提前是决定植物叶片冻害风险增大的决定性因素[15]。
本文结果的不确定性体现在物候模型构建和植物抗冻性的区域校正2个方面。首先,木本植物春季物候虽然主要受温度影响,但有研究表明,在干旱、半干旱地区,降水对春季物候也同时存在直接和间接的影响[53]。因此,在物候模型中仅考虑温度对春季展叶始期的影响可能在干旱、半干旱地区造成一定的不确定性。其次,植物对本地气候条件的适应性导致其在不同地区的抗冻性差异,虽然这种区域性差异主要体现在秋、冬季,而在春、夏季较小[37]。例如,Li等[40]通过实验发现欧洲北部、中部和南部三种不同生态型的欧洲白桦(Betula pendula Roth)的抗冻性在6月的差异小于0.3 ℃,而在12月的抗冻性相差高达近8 ℃。本文在模拟植物抗冻性变化时,考虑了植物对本地气温条件的适应性所导致的抗冻性区域差异,即生长在较冷区域的抗冻性整体要强于生长在较暖区域的个体[10,39],并尝试通过校正系数α近似对植物在不同区域的抗冻性进行校正。然而,有研究发现,高原地区植物的抗冻性还与水分条件相关,可能原因是暴露在低温下的植物可能会表现出与暴露在干旱下的植物相似的生理反应,即细胞脱水,植物可同时通过渗透调节来应对水分短缺和低温带来的压力[54]。因此,干旱可能会在一定程度上增强植物抗冻性。未考虑干旱对植物抗冻性的影响也可能造成一定的不确定性。未来研究中,需进一步开展植物物候和抗冻性的控制实验,揭示不同气象环境要素对植物物候和抗冻性的耦合影响机制,从而实现植物物候和植物冻害更精准的预估。
4 结论
本文基于物候观测数据和气象数据分析了1980—2018年4种广布落叶阔叶木本植物的展叶始期、叶的冻害程度和最大冻害发生时间的变化,主要结论如下:
(1) 时空耦合模型可较好地模拟各物种的展叶始期,交叉检验中均方根误差为5.20~8.03 d。模拟的展叶始期主要呈提前趋势,提前趋势显著(P<0.05)且提前幅度大于1 d/a的区域占总面积的近60%。
(2) 相比于1980—1999年,各物种在2000—2018年的最大冻害时间提前的区域占72.22%~83.03%。其中,榆树、刺槐、垂柳最大冻害时间提前幅度主要集中在0~10 d,白蜡最大冻害时间提前10~25 d的区域最多。就不同气候区而言,各物种在温带地区最大冻害时间提前最多(8.3 d),其次为暖温带、亚热带、高原气候区和寒温带。此外,白蜡最大冻害时间的平均提前幅度最大(8.6 d),其他3个物种最大冻害时间的提前幅度仅约为白蜡的1/2。
(3) 榆树、刺槐和垂柳的最大冻害分别达到2.37、2.78和0.63 ℃,主要分布在东北50°N以北、天山北部以及青藏高原西缘部分地区。白蜡的最大冻害仅为0.42 ℃,平均冻害也远低于其他物种。榆树、刺槐和垂柳叶的年平均冻害均呈显著的增大趋势(P<0.05),而白蜡叶的冻害变化不显著。就不同气候分区而言,榆树和垂柳在寒温带地区冻害增加的比例最大,其次是温带、高原气候区和暖温带。刺槐在高原气候区冻害增加的比例近10%,在寒温带、温带和暖温带区的冻害增加的比例均在3%~6%之间。白蜡仅在暖温带地区的冻害有所增加。
参考文献
大兴安岭植被变绿速率对霜冻的响应研究
[J].
DOI:10.18306/dlkxjz.2021.05.010
[本文引用: 1]

气候变暖降低了霜冻发生的频率,但生长季延长使植被更容易暴露在霜冻中。同时,植被物候和光合初级生产力的变化导致植被变绿速率发生改变。大兴安岭是中国对气候变化最为敏感和最早做出响应的地区之一,该区域霜冻对不同植被变绿速率的影响还未得到充分研究。论文使用NOAA气候数据记录归一化植被指数数据,分析了1982—2019年大兴安岭地区植被变绿速率的时空变化特征。以霜冻天数和霜冻强度为指标,探讨从春季开始到植被生长季旺季开始的时间段内霜冻对植被变绿速率的影响。结果表明:研究时段内霜冻天数与强度均呈下降趋势,平均下降速率分别为-0.24 ± 0.07 d/a和-0.036 ± 0.015 ℃/(d·a)。霜冻天数的减少和霜冻强度的减弱加速了森林生态系统的植被变绿速率,却也同时减缓了草原生态系统的植被变绿速率。不同生态分区的植被变绿速率对霜冻响应不同,大兴安岭北段山地落叶针叶林区和北段西侧森林草原区的植被变绿速率与霜冻天数的偏相关系数分别为-0.42(P<0.05)和-0.48(P<0.01),与霜冻强度的偏相关系数分别为-0.49(P<0.01)和-0.36(P<0.05),霜冻对植被变绿速率的影响显著。研究突出了霜冻对植被变绿速率的影响,结果可为理解区域植被对气候变化的响应提供有用参考。
Response of velocity of vegetation greenup to frost in the Greater Khingan Mountains
DOI:10.18306/dlkxjz.2021.05.010
[本文引用: 1]
Although climate warming reduces the frequency of frost, the longer growing season increases the vulnerability of plants to frost. At the same time, changes of vegetation phenology and primary photosynthetic productivity lead to changes in the vegetation greenup rate. The Greater Khingan Mountains is one of the most sensitive and earliest responding regions to climate change in China. Further study of the impacts of frost on vegetation greenup rates in this region is insufficient. This study reconstructed the vegetation greenup rate in the Greater Khingan Mountains, following which the responses of vegetation greenup rate to frost were analyzed in detail. National Oceanic and Atmospheric Administration (NOAA) Climate Data Record (CDR) Normalized Difference Vegetation Index (NDVI) data were used to study the spatiotemporal variations in vegetation greenup rates in the Greater Khingan Mountains from 1982 to 2019. This study used frost days and intensity indices to analyze the effect of frost on the rates of vegetation greenup from the beginning of the spring to the beginning of the peak vegetation growth season. The results show that during the study period, the frost days and intensity showed a downward trend, and the average decline rates were -0.24 ± 0.07 d/a and -0.036 ± 0.015 ℃/(d·a), respectively. Although decreases in frost days and frost intensity resulted in the acceleration of the greenup of forest ecosystems, the grassland ecosystem greenup rate was reduced at the same time. The response of vegetation greenup rate to frost differed among the different ecological regions. The response of vegetation greenup rate to frost events is obvious in the western forest grassland area (IIB3) and mountain deciduous and coniferous forest area (IA1) in northern Greater Khingan Mountains, and the partial correlation coefficients between the vegetation greenup rate and frost days were -0.42 (P<0.05) and -0.48 (P<0.01), respectively; and the partial correlation coefficients between the vegetation greenup rate and frost intensity were -0.49 (P<0.01) and -0.36 (P<0.05), respectively. This study highlights the effect of frost on vegetation greenup rate, and the results can provide a useful reference for understanding the response of regional vegetation to climate change.
植物响应低温胁迫的分子调控机制
[J].
Molecular regulation mechanism of plant response to cold stress
Growing-season frost is a better predictor of tree growth than mean annual temperature in boreal mixedwood forest plantations
[J].DOI:10.1111/gcb.v26.11 URL [本文引用: 2]
苹果花期冻害气象指标和风险评估
[J].
Meteorological disaster index and risk assessment of frost injury during apple florescence
1971—2020年西南茶区灌木型茶树晚霜冻害危险性时空演变特征
[J].
DOI:10.13287/j.1001-9332.202111.012
[本文引用: 1]
研究晚霜冻害危险性时空演变特征,对于优化区域农业生产布局和品种调优具有科学的指导意义。本研究利用西南茶区65个气象站点1971—2020年逐日气象数据,结合霜冻终日和茶芽萌发初日的变化特征及其相互关系,构建西南茶区灌木型茶树春梢晚霜冻害概率指数和冻害强度指数,分析西南茶区灌木型茶树晚霜冻害危险性时空演变特征。结果表明:1971—2020年,西南茶区霜冻终日和茶芽萌发初日均呈显著提前趋势,且霜冻终日的提早速率快于茶芽萌发初日的提早速率,萌发后的茶芽暴露于晚霜冻害的天数总体呈不显著下降趋势。西南茶区大部分区域灌木型茶树晚霜冻害危险性呈下降趋势,但贵州茶区呈不显著上升趋势。四川茶区西部边缘山区、贵州茶区西部与云南茶区东北部交界处等地灌木型茶树晚霜冻害危险性一直较高,四川盆地区、云南茶区南部和贵州茶区南部等地晚霜冻害危险性一直较低。云南茶区北部、中东部地区等区域晚霜冻害危险性呈明显下降趋势;而贵州茶区中部和东部区域灌木型茶树晚霜冻害危险性明显增加。
Spatiotemporal evolution characteristics of the late frost damage risk to shrubby tea trees in tea region, Southwest China from 1971 to 2020
DOI:10.13287/j.1001-9332.202111.012
[本文引用: 1]
Understanding the spatiotemporal evolution characteristics of the risk of late frost damage has scientific guiding significance for optimizing the regional agricultural production layout and varie-ty tuning. Based on the daily meteorological data of 65 weather stations in the southwest China tea region from 1971 to 2020, we analyzed variation characteristics of the last frost date (LFD), tea bud open date (BOD), and their relationships, constructed frost damage probability index and frost damage severity index of spring shoots of shrubby tea trees, and analyzed the spatiotemporal evolution chara-cteristics of the late frost damage risk of shrub tea trees in the southwest tea region. The results showed that both the BOD and LFD had a significant ahead of trend from 1971 to 2020 and the early rate of the LFD was relatively faster than that of the BOD in the southwest tea region. The number of days that the tea buds were exposed to late frost damage after germination showed an non-significant declining trend. The risk of late frost damage of shrubby tea trees in most parts of the southwest tea region showed a declining trend, but Guizhou tea planting region showed an insignificant increasing trend. The risk of late frost damage to shrubby tea trees was high in the western marginal mountai-nous areas of Sichuan tea region, and the junction of Guizhou and Yunnan tea region. The risk of late frost damage was at low level in Sichuan Basin, southern Yunnan tea region, and southern Guizhou tea region. The risk of late frost damage to shrubby tea trees in the northern and central-eastern parts of Yunnan tea region showed an obvious decreasing trend, but increased significantly in the central and eastern parts of Guizhou tea region.
Climate change and spring frost damages for sweet cherries in Germany
[J].
DOI:10.1007/s00484-017-1443-9
PMID:28965141
[本文引用: 1]
Spring frost can be a limiting factor in sweet cherry (Prunus avium L.) production. Rising temperatures in spring force the development of buds, whereby their vulnerability to freezing temperatures continuously increases. With the beginning of blossom, flowers can resist only light frosts without any significant damage. In this study, we investigated the risk of spring frost damages during cherry blossom for historical and future climate conditions at two different sites in NE (Berlin) and SW Germany (Geisenheim). Two phenological models, developed on the basis of phenological observations at the experimental sweet cherry orchard in Berlin-Dahlem and validated for endodormancy release and for warmer climate conditions (already published), were used to calculate the beginning of cherry blossom in Geisenheim, 1951-2015 (external model validation). Afterwards, on the basis of a statistical regionalisation model WETTREG (RCP 8.5), the frequency of frost during cherry blossom was calculated at both sites for historical (1971-2000) and future climate conditions (2011-2100). From these data, we derived the final flower damage, defined as the percentage of frozen flowers due to single or multiple frost events during blossom. The results showed that rising temperatures in this century can premature the beginning of cherry blossom up to 17 days at both sites, independent of the used phenological model. The frequency and strength of frost was characterised by a high temporal and local variability. For both sites, no significant increase in frost frequency and frost damage during blossom was found. In Geisenheim, frost damages significantly decreased from the middle of the twenty-first century. This study additionally emphasises the importance of reliable phenological models which not only work for current but also for changed climate conditions and at different sites. The date of endodormancy release should always be a known parameter in chilling/forcing models.
Will tree species experience increased frost damage due to climate change because of changes in leaf phenology?
[J].
DOI:10.1139/cjfr-2014-0282
URL
[本文引用: 2]
In temperate zones, trees tend to unfold their leaves earlier due to climate warming. However, changes in the timing of the bud development also affect the dynamics of the cold-hardening process, which may increase frost injuries endured by trees because new leaves unfold at a period when frost events can still occur. This possible increase in frost damage in response to climate change is known as the “frost-damage hypothesis”. In this study, we have tested this hypothesis by forcing a process-based frost-injury model with process-based phenological models for 22 North American species with two Intergovernmental Panel on Climate Change storylines. Using a simplified parameterization of the frost-injury model, we found that risk of frost injury changed with climate change for all species. In fact, frost injury decreased for the vast majority of the species, but this trend varied across species and throughout each species’ distribution. We further explored the variability of response among species using their phenological and geographic characteristics. The interspecific trends depicted here show what could be the implications of climate change on the ecophysiology of boreal and temperate trees and highlight the importance of process-based models in studying the complexity of long-term impacts of climate change on species biology.
Frost hardening and dehardening potential in temperate trees from winter to budburst
[J].
DOI:10.1111/nph.14698
PMID:28737248
[本文引用: 2]
We investigated how deciduous trees can adjust their freezing resistance in response to temperature during the progress of the ecodormancy phase, from midwinter to budburst. We regularly sampled twigs of four different temperate deciduous tree species from January to the leaf-out date. Using computer-controlled freezers and climate chambers, the freezing resistance of buds was measured directly after sampling and also after the application of artificial hardening and dehardening treatments, simulating cold and warm spells. The thermal time to budburst in forcing conditions (c. 20°C) was also quantified at each sampling as a proxy for dormancy depth. Earlier flushing species showed higher freezing resistance than late flushing species at either similar bud development stage or similar dormancy depth. Overall, freezing resistance and its hardening and dehardening potential dramatically decreased during the progress of ecodormancy and became almost nil during budburst. Our results suggest that extreme cold events in winter are not critical for trees, as freezing resistance can be largely enhanced during this period. By contrast, the timing of budburst is a critical component of tree fitness. Our results provide quantitative values of the freezing resistance dynamics during ecodormancy, particularly valuable in process-based species distribution models.© 2017 The Authors. New Phytologist © 2017 New Phytologist Trust.
Differential response of oak and beech to late frost damage: An integrated analysis from organ to forest
[J].
Warmer temperatures affect the in situ freezing resistance of the Antarctic vascular plants
[J].Although positive effects on growth and reproduction of Antarctic vascular plants have been reported under warmer temperatures, it could also increase the vulnerability of these plants to freezing. Thus, we assessed in situ whether warming decreases the freezing resistance of Colobanthus quitensis and Deschampsia antarctica, and we compared the level and mechanism of freezing resistance of these species in the field with previous reports conducted in lab conditions. We assessed the freezing resistance of C. quitensis and D. antarctica by determining their low temperature damage (LT50), ice nucleation temperature (NT) and freezing point (FP) in three sites of the King George Island. Plants were exposed during two growing seasons to a passive increase in the air temperature (+W). +W increased by 1K the mean air temperatures, but had smaller effects on freezing temperatures. Leaf temperature of both species was on average 1.7K warmer inside +W. Overall, warming decreased the freezing resistance of Antarctic species. The LT50 increased on average 2K for C. quitensis and 2.8K for D. antarctica. In contrast, NT and FP decreased on average c. 1K in leaves of warmed plants of both species. Our results showed an averaged LT50 of 15.3 degrees C for C. quitensis, and of -22.8 degrees C for D. antarctica, with freezing tolerance being the freezing resistance mechanism for both species. These results were partially consistent with previous reports, and likely explanations for such discrepancies were related with methodological differences among studies. Our work is the first study reporting the level and mechanisms of freezing resistance of Antarctic vascular plants measured in situ, and we demonstrated that although both plant species exhibited a great ability to cope with freezing temperatures during the growing season, their vulnerability to suffer freezing damage under a warming scenario increase although the magnitude of this response varied across sites and species. Hence, freezing damage should be considered when predicting changes in plant responses of C. quitensis and D. antarctica under future climate conditions of the Antarctic Peninsula.
Divergent trends in the risk of spring frost damage to trees in Europe with recent warming
[J].
DOI:10.1111/gcb.14479
PMID:30338890
[本文引用: 2]
Frost events during the active growth period of plants can cause extensive frost damage with tremendous economic losses and dramatic ecological consequences. A common assumption is that climate warming may bring along a reduction in the frequency and severity of frost damage to vegetation. On the other hand, it has been argued that rising temperature in late winter and early spring might trigger the so called "false spring", that is, early onset of growth that is followed by cold spells, resulting in increased frost damage. By combining daily gridded climate data and 1,489 k in situ phenological observations of 27 tree species from 5,565 phenological observation sites in Europe, we show here that temporal changes in the risk of spring frost damage with recent warming vary largely depending on the species and geographical locations. Species whose phenology was especially sensitive to climate warming tended to have increased risk of frost damage. Geographically, compared with continental areas, maritime and coastal areas in Europe were more exposed to increasing occurrence of frost and these late spring frosts were getting more severe in the maritime and coastal areas. Our results suggest that even though temperatures will be elevated in the future, some phenologically responsive species and many populations of a given species will paradoxically experience more frost damage in the future warming climate. More attention should be paid to the increased frost damage in responsive species and populations in maritime areas when developing strategies to mitigate the potential negative impacts of climate change on ecosystems in the near future.© 2018 John Wiley & Sons Ltd.
Trends of spring time frost events and phenological dates in Central Europe
[J].DOI:10.1007/s00704-002-0704-6 URL [本文引用: 1]
Patterns of late spring frost leaf damage and recovery in a European beech (Fagus sylvatica L.) stand in south-eastern Germany based on repeated digital photographs
[J].
Climate-induced shifts in leaf unfolding and frost risk of European trees and shrubs
[J].Climate warming has advanced leaf unfolding of trees and shrubs, thus extending the growing period but potentially exposing plants to increased frost risk. The relative shifts in the timing of leaf unfolding vs. the timing and intensity of frost events determine whether frost risk changes under climate warming. Here we test whether the frost risk for unfolding leaves of 13 European tree and shrub species has changed over more than 60 years using dynamic state-space models and phenological observations from 264 sites located between 200 and 1900 m a.s.l. across Switzerland. Trees and shrubs currently feature sufficient safety margins regarding frost risk, which increase from early-to late-leafing species and tend to decrease with increasing elevation. Particularly after 1970 to 1990 and at higher elevations, leaf unfolding has advanced across all species. While the time between the last critical frost and leaf unfolding has shifted from predominantly positive trends in the late 1950s and 1960s to a trend reversal since the 2000s, the minimum temperature during leaf unfolding has mostly increased since the 1980s. These dynamic shifts in leaf unfolding and frost risk demonstrate species- and site-specific responses of trees and shrubs to climate cooling and warming.
The interaction between freezing tolerance and phenology in temperate deciduous trees
[J].Temperate climates are defined by distinct temperature seasonality with large and often unpredictable weather during any of the four seasons. To thrive in such climates, trees have to withstand a cold winter and the stochastic occurrence of freeze events during any time of the year. The physiological mechanisms trees adopt to escape, avoid, and tolerate freezing temperatures include a cold acclimation in autumn, a dormancy period during winter (leafless in deciduous trees), and the maintenance of a certain freezing tolerance during dehardening in early spring. The change from one phase to the next is mediated by complex interactions between temperature and photoperiod. This review aims at providing an overview of the interplay between phenology of leaves and species-specific freezing resistance. First, we address the long-term evolutionary responses that enabled temperate trees to tolerate certain low temperature extremes. We provide evidence that short term acclimation of freezing resistance plays a crucial role both in dormant and active buds, including re-acclimation to cold conditions following warm spells. This ability declines to almost zero during leaf emergence. Second, we show that the risk that native temperate trees encounter freeze injuries is low and is confined to spring and underline that this risk might be altered by climate warming depending on species-specific phenological responses to environmental cues.
Mapping and assessment of impacts of cold and frost on secondary forest in the marginally tropical landscape of Hong Kong
[J].DOI:10.1016/j.agrformet.2016.10.008 URL [本文引用: 1]
Reduced frost hardiness in temperate woody species due to climate warming: A model-based analysis
[J].
The decreasing spring frost risks during the flowering period for woody plants in temperate area of eastern China over past 50 years
[J].
DOI:10.1007/s11442-013-1034-6
[本文引用: 2]
<p>The temperate monsoon area of China is an important agricultural region but late spring frosts have frequently caused significant damage to plants there. Based on phenological data derived from the Chinese Phenological Observation Network (CPON), corresponding meteorological data from 12 study sites and phenological modeling, changes in flowering times of multiple woody plants and the frequency of frost occurrence were analyzed. Through these analyses, frost risk during the flowering period at each site was estimated. Results of these estimates suggested that first flowering dates (FFD) in the study area advanced significantly from 1963 to 2009 at an average rate of -1.52 days/decade in Northeast China (<em>P</em><0.01) and -2.22 days/decade (<em>P</em><0.01) in North China. Over the same period, the number of frost days in spring decreased and the last frost days advanced across the study area. Considering both flowering phenology and occurrence of frost, the frost risk index, which measures the percentage of species exposed to frost during the flowering period in spring, exhibited a decreasing trend of -0.37% per decade (insignificant) in Northeast China and -1.80% per decade (<em>P</em><0.01) in North China, implying that frost risk has reduced over the past half century. These conclusions provide important inform</p>
Impacts of recent climate extremes on spring phenology in arid-mountain ecosystems in China
[J].DOI:10.1016/j.agrformet.2018.05.022 URL [本文引用: 1]
Advancing frost dates have reduced frost risk among most North American angiosperms since 1980
[J].
DOI:10.1111/gcb.15380
PMID:33030240
[本文引用: 2]
In recent decades, the final frost dates of winter have advanced throughout North America, and many angiosperm taxa have simultaneously advanced their flowering times as the climate has warmed. Phenological advancement may reduce plant fitness, as flowering prior to the final frost date of the winter/spring transition may damage flower buds or open flowers, limiting fruit and seed production. The risk of floral exposure to frost in the recent past and in the future, however, also depends on whether the last day of winter frost is advancing more rapidly, or less rapidly, than the date of onset of flowering in response to climate warming. This study presents the first continental-scale assessment of recent changes in frost risk to floral tissues, using digital records of 475,694 herbarium specimens representing 1,653 angiosperm species collected across North America from 1920 to 2015. For most species, among sites from which they have been collected, dates of last frost have advanced much more rapidly than flowering dates. As a result, frost risk has declined in 66% of sampled species. Moreover, exotic species consistently exhibit lower frost risk than native species, primarily because the former occupy warmer habitats where the annual frost-free period begins earlier. While reducing the probability of exposure to frost has clear benefits for the survival of flower buds and flowers, such phenological advancement may disrupt other ecological processes across North America, including pollination, herbivory, and disease transmission.© 2020 John Wiley & Sons Ltd.
Recent changes in frost days and the frost-free season in the United States
[J].DOI:10.1175/1520-0477(2002)083<1327:RCIFDA>2.3.CO;2 URL [本文引用: 1]
1961—2007年我国霜冻变化特征
[J].
Characteristics of frost changes from 1961 to 2007 over China
增温和光周期变化对温带典型木本植物展叶始期的影响
[J].
DOI:10.18306/dlkxjz.2022.03.008
[本文引用: 1]
厘清驱动植物物候变化的气候因子对评估全球变化对生态系统的影响具有重要意义。针对欧洲与北美地区木本植物的控制实验表明春季物候变化主要受冷激、驱动温度和光周期影响,但这3个气候因子是否对东亚地区木本植物的春季物候存在相似的作用仍需验证。论文选取了5种典型木本植物(迎春Jasminum nudiflorum、连翘Forsythia suspensa、荚蒾Viburnum dilatatum、玉兰Yulania denudata与东京樱花Cerasus yedoensis),利用生长箱对冬季休眠枝条的展叶过程开展了控制实验。实验设置了3种驱动温度(12 ℃、15 ℃、18 ℃)、3种冷激(3 d、38 d、59 d)以及2种光周期(10 h、14 h)处理,并利用分层贝叶斯模型建立了展叶始期与各影响因子间的关系。结果表明,驱动温度每升高1 ℃导致展叶始期提前2.6 ~ 9.0 d,但展叶始期的温度敏感度随温度和冷激天数的增加而减弱。冷激也是影响木本植物展叶始期的重要因子。与冷激处理3 d相比,冷激处理59 d使展叶始期提前20.3 ~ 66.6 d,但随冷激天数增加,展叶始期对冷激响应的敏感度减弱。光周期延长对展叶始期具有提前效应,但总体小于驱动温度与冷激的影响。光周期由10 h延长至14 h后,展叶始期提前0.3 ~ 12.9 d,且在低冷激处理时光周期的效应更明显。这些结果为理解近几十年来春季物候变化及其对增温的响应提供了科学依据。
Effects of warming and photoperiod changes on the leaf-out date of typical temperate woody plants
DOI:10.18306/dlkxjz.2022.03.008
[本文引用: 1]
Clarifying the climatic factors driving plant phenological changes is vital for assessing the effects of global change on the ecosystem. The previous controlled experiments on European and North American woody plants demonstrated that spring phenological changes were mainly affected by chilling, forcing temperature, and photoperiod. However, it was unclear whether these three climatic factors have similar effects on the spring phenology of East Asian woody plants. In this study, we selected five typical woody plants (Jasminum nudiflorum, Forsythia suspensa, Viburnum dilatatum, Yulania denudata and Cerasus yedoensis) to investigate the leaf-out date of their dormant twigs in growth chambers with controlled environments. We set three forcing temperature treatments (12 ℃, 15 ℃, and 18 ℃), three chilling treatments (3 d, 38 d, and 59 d), and two photoperiod treatments (10 h and 14 h) and monitored the leaf-out date in each treatment. Finally, we established the relationship between the leaf-out dates and the climatic factors using the hierarchical Bayesian model. The results show that 1 ℃ warming in forcing temperature advanced the leaf-out dates by 2.6-9.0 d, but the temperature sensitivity of the leaf-out dates decreased with the increase in forcing temperature and chilling days. Chilling is also an important factor affecting the leaf-out dates of woody plants. Compared with 3 d chilling treatment, 59 chilling days advanced the leaf-out dates by 20.3-66.6 d. However, the sensitivity of leaf-out dates on chilling decreased with the increase in chilling days. Longer photoperiod caused earlier leaf-out dates, but the effect of photoperiod was smaller than that of forcing temperature and chilling. When the photoperiod was extended from 10 h to 14 h, the leaf-out dates were advanced by 0.3-12.9 d, and the effect of photoperiod was more significant in lower chilling treatment. These results provide a scientific basis for understanding spring phenological changes in responses to climate warming over the past decades.
Phenological response to climate change in China: A meta-analysis
[J].
DOI:10.1111/gcb.12648
PMID:24895088
[本文引用: 2]
The change in the phenology of plants or animals reflects the response of living systems to climate change. Numerous studies have reported a consistent earlier spring phenophases in many parts of middle and high latitudes reflecting increasing temperatures with the exception of China. A systematic analysis of Chinese phenological response could complement the assessment of climate change impact for the whole Northern Hemisphere. Here, we analyze 1263 phenological time series (1960-2011, with 20+ years data) of 112 species extracted from 48 studies across 145 sites in China. Taxonomic groups include trees, shrubs, herbs, birds, amphibians and insects. Results demonstrate that 90.8% of the spring/summer phenophases time series show earlier trends and 69.0% of the autumn phenophases records show later trends. For spring/summer phenophases, the mean advance across all the taxonomic groups was 2.75 days decade(-1) ranging between 2.11 and 6.11 days decade(-1) for insects and amphibians, respectively. Herbs and amphibians show significantly stronger advancement than trees, shrubs and insect. The response of phenophases of different taxonomic groups in autumn is more complex: trees, shrubs, herbs and insects show a delay between 1.93 and 4.84 days decade(-1), while other groups reveal an advancement ranging from 1.10 to 2.11 days decade(-1). For woody plants (including trees and shrubs), the stronger shifts toward earlier spring/summer were detected from the data series starting from more recent decades (1980s-2000s). The geographic factors (latitude, longitude and altitude) could only explain 9% and 3% of the overall variance in spring/summer and autumn phenological trends, respectively. The rate of change in spring/summer phenophase of woody plants (1960s-2000s) generally matches measured local warming across 49 sites in China (R=-0.33, P<0.05).© 2014 John Wiley & Sons Ltd.
Extension of the growing season increases vegetation exposure to frost
[J].While climate warming reduces the occurrence of frost events, the warming-induced lengthening of the growing season of plants in the Northern Hemisphere may actually induce more frequent frost days during the growing season (GSFDs, days with minimum temperature < 0 degrees C). Direct evidence of this hypothesis, however, is limited. Here we investigate the change in the number of GSFDs at latitudes greater than 30 degrees N using remotely-sensed and in situ phenological records and three minimum temperature (T-min) data sets from 1982 to 2012. While decreased GSFDs are found in northern Siberia, the Tibetan Plateau, and northwestern North America (mainly in autumn), similar to 43% of the hemisphere, especially in Europe, experienced a significant increase in GSFDs between 1982 and 2012 (mainly during spring). Overall, regions with larger increases in growing season length exhibit larger increases in GSFDs. Climate warming thus reduces the total number of frost days per year, but GSFDs nonetheless increase in many areas.
Leaf-out in northern ecotypes of wide-ranging trees requires less spring warming, enhancing the risk of spring frost damage at cold range limits
[J].DOI:10.1111/geb.v29.6 URL [本文引用: 1]
1981—2010年中国气候区划
[J].
The climate regionalization in China for 1981-2010
DOI:10.1007/s11434-013-5948-2 URL [本文引用: 1]
1963—2018年中国垂柳和榆树开花始期积温需求的时空变化
[J].
DOI:10.11821/dlxb202007009
[本文引用: 1]
积温需求是决定北半球温带地区木本植物开花时间的主要因子。全球变暖使植物在冬季受到的冷激量减少,可能会改变植物开花的积温需求。气候变化导致的中国木本植物开花始期积温需求的时空变化仍不清楚。有鉴于此,本文基于“中国物候观测网”1963—2018年垂柳(Salix babylonica)和榆树(Ulmus pumila)开花始期数据,利用3种积温算法(GDD、GDDS和GDH)系统分析了两种植物开花积温需求的空间格局和在代表性站点的年际变化,构建了基于冷激日数模拟积温需求的模型。主要结论为:垂柳和榆树开花始期的积温需求在低纬度地区大于中纬度地区。站点多年平均积温需求与冷激日数呈显著的负指数关系,即随冷激日数增加,积温需求降低。时间上,3个典型站点(贵阳、西安和牡丹江)垂柳开花积温需求的变化趋势分别达到1.28~1.41 °C·d/a(P < 0.01)、1.63~1.89 °C·d/a(P < 0.01)和0.12~0.58 °C·d/a(仅GDD算法P < 0.05),榆树开花的积温需求在贵阳和西安同样显著增加,但在牡丹江变化不显著。冷激日数随时间减少是两个站点积温需求显著增加的主要原因。因牡丹江冬季气温低,冷激日数多且年际变化小,冷激对积温需求变化的影响不显著。基于时空耦合样本建立的冷激日数—积温需求模型对垂柳开花积温需求的模拟效果较好,R<sup>2</sup>达0.54~0.66。对榆树开花积温需求的模拟效果稍差(R<sup>2</sup>为0.33~0.64)。就不同算法而言,冷激日数对GDD算法得到的积温需求模拟效果更好。本文为量化植物开花积温需求的时空变化及在气候变化背景下的花期预测提供了重要的科学依据。
Spatio-temporal variations in the thermal requirement of the first flowering dates of Salix babylonica and Ulmus pumila in China during 1963-2018
DOI:10.11821/dlxb202007009
[本文引用: 1]
The forcing temperature in spring is the main factor that determines the flowering time of woody plants in the Northern Hemisphere. Global warming has reduced the number of chilling days in winter, which probably alters the thermal requirement of flowering. In the past 50 years, the spatio-temporal changes in the thermal requirement of spring phenology in China remain unclear. Based on the first flowering date (FFD) data of Salix babylonica and Ulmus pumila derived from China Phenological Observation Network during 1963-2018, we used three methods to calculate the thermal requirements of FFD and systematically analyzed their spatial and temporal patterns at representative sites. We also developed chilling days-thermal requirement models to quantitatively simulate the thermal requirement at each site in different years. The results showed that the thermal requirement of FFD exhibited a large spatial difference, with a relatively high value at low latitudes than that at middle latitudes. There was a significant negative exponential relationship between the average thermal requirement and chilling days across sites. The thermal requirements of FFD also changed over time. The trend in thermal requirement of Salix babylonica FFD in Guiyang, Xi'an and Mudanjiang reached 1.28-1.41 °C·d/a (P<0.01), 1.63-1.89 °C·d/a (P<0.01) and 0.12-0.58 °C·d/a (P<0.05) for the growing degree day method, respectively. The thermal requirement of Ulmus pumila FFD also increased significantly in Guiyang and Xi'an, but the trend in Mudanjiang was not significant. The decrease in the number of chilling days was the main reason for the increase in the thermal requirements. Due to the low winter temperature in Mudanjiang, the number of chilling days was large and had a small interannual variation, thus chilling days exerted no significant impact on the thermal requirement. The chilling days-thermal requirement model performed better in simulating the thermal requirement of Salix babylonica FFD, with R 2 of 0.54-0.66. In comparison with Salix babylonica, the model showed a relatively low precision in simulating the thermal requirement of Ulmus pumila FFD, with R 2 ranging from 0.33 to 0.64. Among the three methods, the thermal requirement could be better simulated by the growing degree days method compared with the growing degree days-sigmoid and growing degree hours methods. This study provides an important scientific basis for quantifying the spatio-temporal variation of the thermal requirement of flowering and for predicting the future flowering date of woody plants under the background of climate change.
The first high-resolution meteorological forcing dataset for land process studies over China
[J].The China Meteorological Forcing Dataset (CMFD) is the first high spatial-temporal resolution gridded near-surface meteorological dataset developed specifically for studies of land surface processes in China. The dataset was made through fusion of remote sensing products, reanalysis datasets and in-situ station data. Its record begins in January 1979 and is ongoing (currently up to December 2018) with a temporal resolution of three hours and a spatial resolution of 0.1°. Seven near-surface meteorological elements are provided in the CMFD, including 2-meter air temperature, surface pressure, and specific humidity, 10-meter wind speed, downward shortwave radiation, downward longwave radiation and precipitation rate. Validations against observations measured at independent stations show that the CMFD is of superior quality than the GLDAS (Global Land Data Assimilation System); this is because a larger number of stations are used to generate the CMFD than are utilised in the GLDAS. Due to its continuous temporal coverage and consistent quality, the CMFD is one of the most widely-used climate datasets for China.
Predicting future frost damage risk of kiwifruit in Korea under climate change using an integrated modelling approach
[J].DOI:10.1002/joc.2018.38.issue-14 URL [本文引用: 1]
宁夏酿酒葡萄越冬期冻害时空分布特征
[J].
Spatial-temporal distribution characteristic of freezing damage risk for wine grape during overwintering in Ningxia
Impacts of changing frost regimes on Swedish forests: Incorporating cold hardiness in a regional ecosystem model
[J].DOI:10.1016/j.ecolmodel.2009.05.014 URL [本文引用: 1]
1952—2007年中国白蜡树春季物候时空变化分析
[J].
Temporal and spatial changes of spring phenology of Fraxinus mandshurica in China from 1952 to 2007
Intraspecific variability in frost hardiness of Fagus sylvatica L
[J].DOI:10.1007/s10342-015-0862-6 URL [本文引用: 1]
Cold tolerance of tree species is related to the climate of their native ranges
[J].DOI:10.1111/jbi.12411 URL [本文引用: 3]
Ecotype-dependent control of growth, dormancy and freezing tolerance under seasonal changes in Betula pendula Roth
[J].DOI:10.1007/s00468-002-0214-2 [本文引用: 2]
Simulating changes in the leaf unfolding time of 20 plant species in China over the twenty-first century
[J].
DOI:10.1007/s00484-013-0671-x
PMID:23689929
[本文引用: 1]
Recent shifts in phenology reflect the biological response to current climate change. Aiming to enhance our understanding of phenological responses to climate change, we developed, calibrated and validated spatio-temporal models of first leaf date (FLD) for 20 broadleaved deciduous plants in China. Using daily meteorological data from the Chinese Meteorological Administration and the Community Climate System Model, version 3 (CCSM3) created using three IPCC scenarios (A2, A1B and B1), we described the FLD time series of each species over the past 50 years, extrapolating from these results to simulate estimated FLD changes for each species during the twenty-first century. Model validation suggests that our spatio-temporal models can simulate FLD accurately with R² (explained variance) >0.60. Model simulations show that, from 1952 to 2007, the FLD in China advanced at a rate of -1.14 days decade⁻¹) on average. Furthermore, changes in FLD showed noticeable variation between regions, with clearer advances observed in the north than in the south of the country. The model indicates that the advances in FLD observed from 1952-2007 in China will continue over the twenty-first century, although significant differences among species and different climate scenarios are expected. The average trend of FLD advance in China during the twenty-first century is modeled as being -1.92 days decade⁻¹ under the A2 scenario, -1.10 days decade⁻¹ under the A1B scenario and -0.74 days decade⁻¹ under the B2 scenario. The spatial pattern of FLD change for the period 2011-2099 is modeled as being similar but showing some difference from patterns in the 1952-2007 period. At the interspecific level, early-leafing species were found to show a greater advance in FLD, while species with larger distributions tended to show a weaker advance in FLD. These simulated changes in phenology may have significant implications for plant distribution as well as ecosystem structure and function.
Fitting models predicting dates of flowering of temperate-zone trees using simulated annealing
[J].DOI:10.1046/j.1365-3040.1998.00299.x URL [本文引用: 2]
Plant science: Phenology under global warming
[J].
DOI:10.1126/science.1186473
URL
[本文引用: 1]
In most temperate tree species, phenological events such as flowering and autumnal cessation of growth are not primarily controlled by temperature.
European deciduous trees exhibit similar safety margins against damage by spring freeze events along elevational gradients
[J].
DOI:10.1111/nph.12452
PMID:23952607
[本文引用: 1]
Minimum temperature is assumed to be an important driver of tree species range limits. We investigated during which period of the year trees are most vulnerable to freezing damage and whether the pressure of freezing events increases with increasing elevation. We assessed the course of freezing resistance of buds and leaves from winter to summer at the upper elevational limits of eight deciduous tree species in the Swiss Alps. By reconstructing the spring phenology of these species over the last eight decades using a thermal time model, we linked freezing resistance with long-term minimum temperature data along elevational gradients. Counter-intuitively, the pressure of freeze events does not increase with elevation, but deciduous temperate tree species exhibit a constant safety margin (5-8.5 K) against damage by spring freeze events along elevational gradients, as a result of the later flushing at higher elevation. Absolute minimum temperatures in winter and summer are unlikely to critically injure trees. Our study shows that freezing temperatures in spring are the main selective pressure controlling the timing of flushing, leading to a shorter growing season at higher elevation and potentially driving species distribution limits. Such mechanistic knowledge is important to improve predictions of tree species range limits.© 2013 The Authors. New Phytologist © 2013 New Phytologist Trust.
Climatic warming, spring budburst and frost damage on trees
[J].DOI:10.2307/2403090 URL [本文引用: 1]
Reconstructing patterns of temperature, phenology, and frost damage over 124 years: Spring damage risk is increasing
[J].Climate change, with both warmer spring temperatures and greater temperature fluctuations, has altered phenologies, possibly leading to greater risk of spring frost damage to temperate deciduous woody plants. Phenological observations of 20 woody species from 1993 to 2012 in Trelease Woods, Champaign County, Illinois, USA, were used to identify years with frost damage to vegetative and reproductive phases. Local temperature records were used in combination with the phenological observations to determine what combinations of the two were associated with damage. Finally, a long-term temperature record (1889-1992) was evaluated to determine if the frequency of frost damage has risen in recent decades. Frost < or = -1.7 degrees C occurred after bud-break in 14 of the 20 years of observation. Frost damage occurred in five years in the interior and in three additional years at only the forest edge. The degree of damage varied with species, life stage, tissue (vegetative or reproductive), and phenological phase. Common features associated with the occurrence of damage to interior plants were (1) a period of unusual warm temperatures in March, followed by (2) a frost event in April with a minimum temperature < or = -6.1 degrees C with (3) a period of 16-33 days between the extremes. In the long-term record, 10 of 124 years met these conditions, but the yearly probability of frost damage increased significantly, from 0.03 during 1889-1979 to 0.21 during 1980-2012. When the criteria were "softened" to < or = -1.7 degrees C in April and an interval of 16-37 days, 31 of 124 years met the conditions, and the yearly damage probability increased significantly to 0.19 for 1889-1979 and 0.42 for 1980-2012. In this forest, the combination of warming trends and temperature variability (extremes) associated with climate change is having ecologically important effects, making previously rare frost damage events more common.
Predicting spring phenology and frost damage risk of Betula spp. under climatic warming: A comparison of two models
[J].Timing of bud burst and frost damage risk for leaves of Betula spp. in response to climatic warming in Finland was examined with two models. In the first model, ontogenetic development in spring was triggered by an accumulation of chilling temperatures. The second model assumed an additional signal from the light climate. The two models gave radically different estimates of frost damage risk in response to climate warming. The chilling-triggered model forecast a significant and increasing risk with increased warming, whereas the light-climate-triggered model predicted little or no risk. The chilling-triggered model is widely applied in phenological research; however, there is increasing experimental evidence that light conditions play a role in the timing of spring phenology. Although it is not clear if the light response mechanisms are appropriately represented in our model, the results imply that reliance on a light signal for spring development would afford a degree of protection against possible frost damage under climate warming that would not be present if chilling were the sole determinant. Further experimental tests are required to ascertain the light-related mechanisms controlling phenological timing, so that credible model extrapolations can be undertaken.
Making sense of the early-2000s warming slowdown
[J].DOI:10.1038/nclimate2938 [本文引用: 1]
Continuous advance in the onset of vegetation green-up in the Northern Hemisphere, during hiatuses in spring warming
[J].
Summary for policymakers // IPCC. Global Warming of 1.5 ℃
[R].
Declining global warming effects on the phenology of spring leaf unfolding
[J].DOI:10.1038/nature15402 [本文引用: 1]
Precipitation impacts on vegetation spring phenology on the Tibetan Plateau
[J].
DOI:10.1111/gcb.12961
PMID:25926356
[本文引用: 1]
The ongoing changes in vegetation spring phenology in temperate/cold regions are widely attributed to temperature. However, in arid/semiarid ecosystems, the correlation between spring temperature and phenology is much less clear. We test the hypothesis that precipitation plays an important role in the temperature dependency of phenology in arid/semiarid regions. We therefore investigated the influence of preseason precipitation on satellite-derived estimates of starting date of vegetation growing season (SOS) across the Tibetan Plateau (TP). We observed two clear patterns linking precipitation to SOS. First, SOS is more sensitive to interannual variations in preseason precipitation in more arid than in wetter areas. Spatially, an increase in long-term averaged preseason precipitation of 10 mm corresponds to a decrease in the precipitation sensitivity of SOS by about 0.01 day mm(-1). Second, SOS is more sensitive to variations in preseason temperature in wetter than in dryer areas of the plateau. A spatial increase in precipitation of 10 mm corresponds to an increase in temperature sensitivity of SOS of 0.25 day °C(-1) (0.25 day SOS advance per 1 °C temperature increase). Those two patterns indicate both direct and indirect impacts of precipitation on SOS on TP. This study suggests a balance between maximizing benefit from the limiting climatic resource and minimizing the risk imposed by other factors. In wetter areas, the lower risk of drought allows greater temperature sensitivity of SOS to maximize the thermal benefit, which is further supported by the weaker interannual partial correlation between growing degree days and preseason precipitation. In more arid areas, maximizing the benefit of water requires greater sensitivity of SOS to precipitation, with reduced sensitivity to temperature. This study highlights the impacts of precipitation on SOS in a large cold and arid/semiarid region and suggests that influences of water should be included in SOS module of terrestrial ecosystem models for drylands. © 2015 John Wiley & Sons Ltd.
Drought increases the freezing resistance of high-elevation plants of the Central Chilean Andes
[J].
DOI:10.1007/s00442-016-3622-5
PMID:27053321
[本文引用: 1]
Freezing temperatures and summer droughts shape plant life in Mediterranean high-elevation habitats. Thus, the impacts of climate change on plant survival for these species could be quite different to those from mesic mountains. We exposed 12 alpine species to experimental irrigation and warming in the Central Chilean Andes to assess whether irrigation decreases freezing resistance, irrigation influences freezing resistance when plants are exposed to warming, and to assess the relative importance of irrigation and temperature in controlling plant freezing resistance. Freezing resistance was determined as the freezing temperature that produced 50 % photoinactivation [lethal temperature (LT50)] and the freezing point (FP). In seven out of 12 high-Andean species, LT50 of drought-exposed plants was on average 3.5 K lower than that of irrigated plants. In contrast, most species did not show differences in FP. Warming changed the effect of irrigation on LT50. Depending on species, warming was found to have (1) no effect, (2) to increase, or (3) to decrease the irrigation effect on LT50. However, the effect size of irrigation on LT50 was greater than that of warming for almost all species. The effect of irrigation on FP was slightly changed by warming and was sometimes in disagreement with LT50 responses. Our data show that drought increases the freezing resistance of high-Andean plant species as a general plant response. Although freezing resistance increases depended on species-specific traits, our results show that warmer and moister growing seasons due to climate change will seriously threaten plant survival and persistence of these and other alpine species in dry mountains.
