

维护道路交通系统的畅通运行是统筹推进基础设施高质量建设的重要内容,也是建设交通强国的重要目标。但交通系统在运行过程中可能会受到如地震、洪水、雨雪等自然灾害以及人为造成的交通事故的干扰,这在一定程度上会降低道路设施的通行能力,使得出行者在出行过程中具有一定程度的不确定性,进而可能造成出行者无法实现其出行目的[1-2]。因此,维护道路交通系统的畅通运行是“十四五”时期统筹推进基础设施建设、加快建设交通强国的重要举措。尤其在青藏高原地区,道路交通系统畅通运行存在诸多难点,需要在交通评价中给予格外的关注。一方面,受经济社会发展滞后以及复杂自然环境的双重约束,青藏高原地区的交通基础设施技术等级普遍不高,容易受雨季、雪季等季节性因素影响[3];另一方面,青藏高原地区一年中不是雨季即为雪季,季节性影响持续时间长,雪季、雨季不仅容易造成路面湿滑、道路边界掩盖难辨等问题,且容易带来道路灾害和交通事故,导致通行能力下降,甚至局部地区存在大雪封路长达数月的情况[4]。因此,对青藏高原地区道路网络的评价,需要充分考虑雨雪季节变化的影响。本文在青藏高原地区的交通可达性评价中充分考虑雨雪季节的影响,希冀更准确地反映这一特殊地区的实际通行能力,这对完善交通优势度评价方法和提高青藏公路可达性评价的准确性具有重要的理论意义。
可达性也称通达性,Hansen[5]认为可达性实质是“交通网络中节点之间相互作用之后的机会大小”,即通过一种特定的交通系统从某一起点位置到达目的地的便利程度。随着地理信息技术的快速发展,部分学者从空间视角阐释可达性,认为空间可达性是指由出发地到达目的地的便捷性,即区域间互动机会的潜力[6-7]。提高空间可达性是优化空间环境和维护空间正义的重要举措,根据考虑的主体不同可将可达性评价分为4大类,即基于设施的可达性[8-9]、基于区位的可达性[10-11]、基于个人的可达性[12-13]和基于效用的可达性[14-15]。虽然可达性的定义和测度方式并不一致,但均考虑出行成本以及需求特征,并将机会分布和空间阻抗结合在一起。然而,空间可达性受自然条件的限制较大,尤其是恶劣天气对道路速度的影响已成为学者关注的热点话题;相关研究主要集中于雨天、雪天和雾天,均指出恶劣天气对交通流特征存在影响[16⇓⇓⇓-20]。此外,已经有学者开始关注恶劣天气对山区公路的交通流特征(流量与速度)的影响,但研究结果多讨论不同恶劣天气对交通流量和车辆运行速度的降低比例[21-22]。青藏高原地区作为世界独特的“人口—地理—生态—交通”单元,其交通网络的优化是协调地区人地关系的重要组成部分,目前有关青藏高原地区交通研究主要聚焦区域产业发展的交通运输门槛[23]、交通路线与分区[24]、交通通达性时间演化[25]以及交通优势度空间分布特征[3]等。
纵观已有研究,不难发现,部分研究已开始关注恶劣天气对道路速度的影响,针对不同的标准划定恶劣天气,为恶劣天气影响下交通事故发生时可以更高效地进行应对与处理提供了一定的理论基础。但在此基础上,现有研究仍存在如下不足:一方面,虽逐步关注恶劣天气对交通流特征存在着重要影响,但在交通可达性评价体系中鲜少考虑雨雪天气的影响;另一方面,青藏高原地区被称为地球上最独特的综合单元,为典型的高海拔、高寒、生态脆弱的特殊类型地区;然而,目前针对青藏高原全域交通可达性精细化评价的研究仍相对较少,尤其在可达性评价中较少考虑季节性。鉴于此,本文基于多源数据,综合考虑降水与积雪天气以及坡度和海拔等地形特征的影响,根据恶劣天气的等级对道路速度和行人速度进行分等级折减,计算受雨雪影响可达性的波动比例,进而评价青藏高原地区的公路可达性,以期为青藏高原地区提高交通路网的稳定性与优化交通路网布局提供科学参考。
1 研究设计
1.1 研究区概况
青藏高原(25°59′37″~39°49′33″N、73°29′56″~104°40′20″E)被称为“世界屋脊”“亚洲水塔”“地球第三极”,坐落于中国西部地区(图1),主要包括青海省和西藏自治区全域以及云南省、四川省、甘肃省、新疆维吾尔自治区的部分边缘地区;南起喜马拉雅山脉,北至昆仑山、阿尔金山和祁连山,西起帕米尔高原和喀喇昆仑山脉,东及秦岭山脉西段和黄土高原接壤处,面积为258万km2。受经济社会发展和自然生态环境的双重约束,青藏高原地区的公路网络相对落后,国道中存在断头路和低等级公路,等外公路占比高;干线公路规模不足、覆盖不广、深度不够,高等级公路匮乏且运输能力较差。主要对外交通干线为川藏公路G318、中尼公路、G219新藏公路、G317川藏北线以及G214滇藏公路。其中,川藏北线、新藏公路等进出藏公路等级低,部分路段地质灾害严重,5条国道中仍有大约12%的路段尚未铺设沥青或水泥。此外,部分既有公路进出藏通道自然灾害频发,G317和G318川藏交界路段地处横断山脉,塌方、泥石流、冬季路面结冰状况时有发生。
图1

图1
青藏高原的地理区位与范围
注:本图基于自然资源部标准地图服务网站下载的审图号为GS(2019)1822号的标准地图制作,底图无修改。下同。
Fig.1
Location of the Qinghai-Tibet Plateau
1.2 数据来源与预处理
道路数据主要包括Open-Street-Map官方网站上公布的2020年的路网数据和第二次青藏高原综合科学考察调研所获取的道路数据。POI数据为2020年7月青藏高原地区医疗服务、商业服务、交通服务、城市功能4大类设施,每条POI数据主要包含设施的分类、名称、坐标以及具体地址等信息。数字高程数据(DEM)来源于中国科学院资源环境科学与数据中心(
1.3 研究方法
本文在时间成本计算中考虑海拔与坡度对道路速度和行人速度的影响,分别计算雨季和雪季的公路可达性,并与未考虑雨雪天气的结果进行对比,揭示雨雪天气对公路可达性的影响[27]。本文采用的可达性为地点i的最短时间可达距离,定义为Ti,其公式为:
式中:tij为两节点(栅格)之间的最短可达时间;j为区域内除i以外的另一节点;n是区域内存在的节点数量。最短可达时间越短,可达性越高。
1.4 指标选择及权重赋值
对于偏远的西部山区而言,方便快捷地获取医疗服务、商业设施服务、城市功能服务意义重大[30-31],据此本文基于1 km×1 km的栅格评价到医疗设施、商业设施、行政设施、交通设施4类POI的可达性。表1展现了第一级设施类型和第二级设施类型。结合第二次青藏高原综合科学考察的实地调研,发现使用微信、支付宝等App进行支付已较为普及,故金融保险服务类别中不包含自动取款机以及居民非基本金融需求的证券公司和保险公司的POI。城市功能服务主要考虑到县级政府驻地和地级市政府驻地的可达性。交通设施服务中主要考虑铁路出行和飞机出行方式,其理由如下:青藏高原地区的机动化水平较高,部分城市千人汽车拥有量高于国内一线城市[32];其次,根据科考调研,民航和铁路是青藏高原地区主要的对外交通方式,近60%的居民希望乘坐飞机出行,另有约30%的居民选择铁路。
表1 青藏高原地区交通可达性评价指标
Tab.1
| 设施类型 | 包含的POI类型 | POI数量/个 |
|---|---|---|
| 医疗服务设施 | 诊所 | 2915 |
| 综合医院 | 1538 | |
| 商业服务设施 | 购物服务:商场、超级市场、便民商店/便利店 | 17211 |
| 金融保险服务:银行 | 2202 | |
| 城市功能服务 | 县级政府驻地 | 161 |
| 地级市政府驻地 | 19 | |
| 交通设施服务 | 火车站站点 | 64 |
| 机场 | 19 |
本文依托第二次青藏高原综合科学考察的调查问卷,基于出行频次调查结果对不同子设施进行权重赋值[33]。截至2021年9月1日,共收回有效问卷547份,问卷内容包括基本信息、交通出行、公共服务、能源、居住生活支撑服务等方面。其中交通出行模块中设置的相关问题包括每月出行次数、出行目的及出行方式等。根据问卷调查结果,本文研究的医疗服务、商业服务、城市功能及交通服务4类设施的权重分别为0.3822、0.1059、0.0691、0.4428。
1.5 参数及道路速度设定
1.5.1 坡度和海拔对道路速度的折损参数
参考《中华人民共和国公路工程技术标准 (JTGB01—2014)》中关于等级公路下坡度限制最大速度的设定,基于青藏高原地区DEM数据生成坡度,采用赋值方法依据坡度数据对Va1进行速度的重新设定,进而得到经过坡度校正后的公路速度Va2,关于坡度对道路速度的影响系数赋值参考文献[3]。
根据坡度数据,参考相关研究[29],计算人行走每1 km速度的栅格数据,即每一栅格存放着人走这1 km所用的速度,记为Vb1。其中,Vb1是步行速度,单位为km/h;S是坡度。
参考既有文献[27],本文对不同海拔范围设定不同的步行速度折扣系数,与Vb1相乘得到经过海拔校正后的各坡度行走速度Vb2。具体地,按0~3000、3001~4000、4001~5000、5001~6000、6000 m以上5个海拔区间分别施加100%、80%、60%、40%和20%的修正系数。之后将Va2和Vb2叠加,每个栅格内的速度为max(Va2, Vb2),从而得出具有速度值的栅格图层,进而得到最终的时间成本栅格。
1.5.2 雨雪季划分及参数设置
雨雪天气通过改变道路行车速度影响交通通达性,降低道路的平均自由流速度。青藏高原地区分为明显的旱季与雨季,其内部降水量的时空差异较为明显;海拔平均在4000 m以上,是北半球中低纬度之间最高、积雪覆盖最大的地区[34]。本文参考高兴川等[25]的研究成果,对高速公路、国道、省道、县道和其他道路分别赋值速度为100、80、60、30、20 km/h,然后依据时间成本栅格考虑雨季和雪季的时间折扣。根据既有研究,雨季按降雨强度是否达到小雨、中雨、大雨强度分别设置折扣系数为2.32%、4.01%和8.57%[22];雪季按积雪深度是否达到小雪(3 cm)和中雪(5 cm),设置折扣系数10%和20%[35]。在上述参数设置基础上再考虑坡度和海拔影响,从而得到正常情况、雨季和雪季3种情景下的时间成本[36-37],进而计算到4类设施的可达性。通过不同季节可达性与正常可达性的比较来反映对应的季节性波动程度:
式中:L为季节波动指标,T1为雨季或雪季情景下的最大通行时间成本,T0为不考虑雨雪季的通行时间成本。
2 结果与分析
2.1 雨季公路可达性的分布差异
2.1.1 雨季公路可达性结果
整体上,青藏高原地区到医疗、商业和城市功能等设施的最短时间与未考虑降水影响的情况变化不大,但部分地区如喜马拉雅山脉南源和雅鲁藏布江大峡谷附近存在可达性受降水影响变差的情况(图2)。
图2
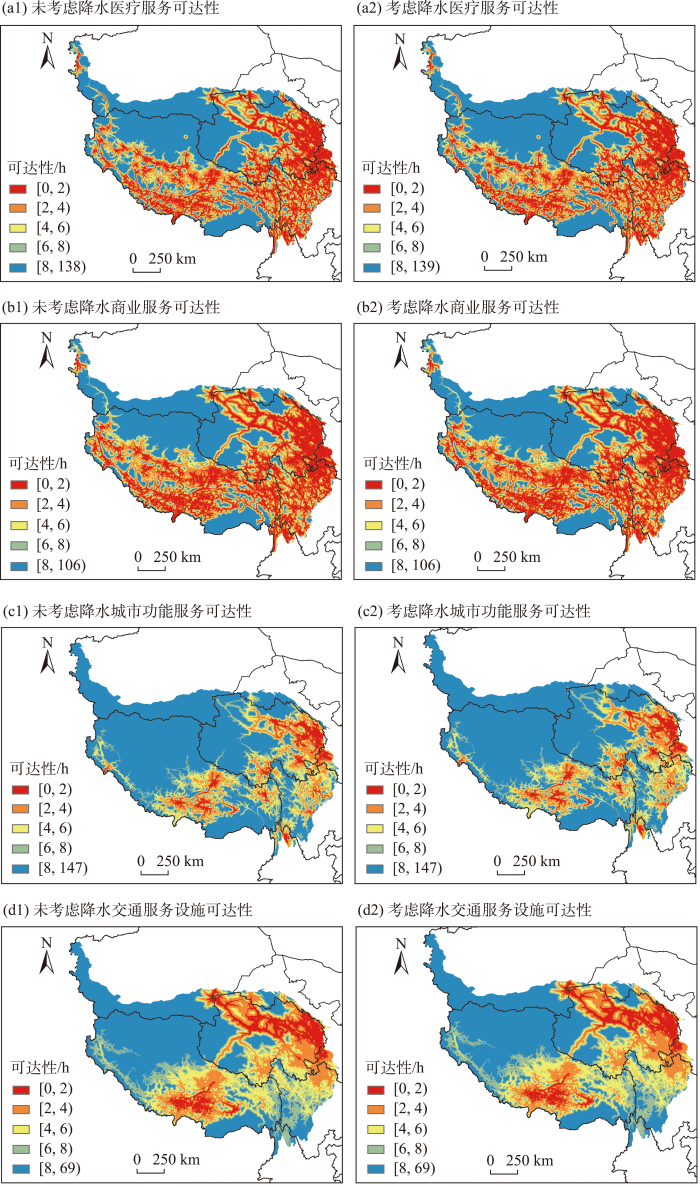
图2
未考虑降水情况下的分设施可达性(a1、b1、c1、d1)与考虑降水影响的分设施可达性(a2、b2、c2、d2)
Fig.2
Accessibility of different facilities without considering the impact of precipitation (a1, b1, c1, and d1) and considering the impact of precipitation (a2, b2, c2, and d2)
具体来看,到医疗服务设施的最短时间的极大值为137.984 h,最小值为0,平均值为15.677 h,标准差为23.708 h;相较于未考虑降水影响,到医疗服务设施的最短时间的最大值增加了0.359 h,平均值增加0.021 h。到商业服务设施的最短时间的极大值为105.420 h,最小值为0,平均值为13.010 h,标准差为19.770;相较于未考虑降水影响,到商业服务设施的最短时间的最大值未变,平均值增加0.016 h。到城市功能服务设施的最短时间的最大值为146.378 h,最小值为0,平均值为22.104 h,标准差为27.379 h,相较于未考虑降水,到城市功能服务设施的最短时间的最大值未变,平均值增加0.022 h。到交通服务设施的最短时间最大值为68.407 h,最小值为0.0103 h,平均值为12.061 h,标准差为12.802 h;相较于未考虑降水,到交通服务设施的最短时间的最大值未变,平均值增加0.011 h。
通过计算到达各服务设施的最短时间,以 [0, 2)、[2, 4)、[4, 6)、[6, 8) h等范围计算不同可达性时段地区的面积占青藏高原全域总面积的比重,将未考虑降水影响的结果和考虑降水影响的结果进行横向对比(表2)。结果显示:青藏高原全域的可达性受降水影响而降低的比例较小,整体可达性降低地区的占比不超过1%;其中,受降水影响,青藏高原地区到城市功能服务设施有近0.026%的地区、到交通服务设施有近0.021%的地区、到商业服务设施有近0.015%的地区、到医疗服务设施有近0.014%的地区无法在8 h内到达。
表2 雨季分设施的不同可达性范围的面积占比
Tab.2
| 设施类别 | 可达性范围/h | 占青藏全域总面积的比重/% | ||
|---|---|---|---|---|
| 未考虑降水影响 | 考虑降水影响 | 降水影响的变化 | ||
| 医疗服务设施 | [0, 2) | 21.827 | 21.814 | -0.013 |
| [2, 4) | 17.678 | 17.676 | -0.002 | |
| [4, 6) | 11.821 | 11.822 | 0.001 | |
| [6, 8) | 7.763 | 7.762 | -0.001 | |
| ≥8 | 40.911 | 40.926 | 0.014 | |
| 商业服务设施 | [0, 2) | 25.887 | 25.875 | -0.013 |
| [2, 4) | 19.969 | 19.970 | 0.001 | |
| [4, 6) | 11.581 | 11.578 | -0.002 | |
| [6, 8) | 6.995 | 6.994 | -0.001 | |
| ≥8 | 35.568 | 35.584 | 0.015 | |
| 城市功能服务设施 | [0, 2) | 3.912 | 3.911 | -0.001 |
| [2, 4) | 9.978 | 9.976 | -0.003 | |
| [4, 6) | 12.116 | 12.105 | -0.011 | |
| [6, 8) | 11.124 | 11.113 | -0.011 | |
| ≥8 | 62.870 | 62.896 | 0.026 | |
| 交通服务设施 | [0, 2) | 7.700 | 7.700 | 0 |
| [2, 4) | 15.989 | 15.989 | 0 | |
| [4, 6) | 16.018 | 16.014 | -0.003 | |
| [6, 8) | 14.851 | 14.833 | -0.017 | |
| ≥8 | 45.443 | 45.464 | 0.021 | |
具体来看,到城市功能服务设施的最短时间在[0, 2)、[2, 4)、[4, 6)、[6, 8) h的范围受降水影响均有所减少,其中减少比例最多的范围是[4, 6)、[6, 8) h,均为0.011%。到交通服务设施的可达性在[4, 6)、[6, 8) h的范围受降水影响有所减少,其中减少比例最多的范围是[6, 8) h,为0.017%。到商业服务设施的可达性在[0, 2)、[4, 6)、[6, 8) h范围内有所减少,其中减少比例最多为[0, 2) h,为0.013%。到医疗服务设施的最短可达时间在[0, 2)、[2, 4) h范围内的面积占比减少最多,其中[0, 2) h减少0.013%,[2, 4) h减少0.002%。
2.1.2 雨季公路可达性变化
从总可达性计算结果来看(图3),未考虑降水影响的总可达性的极小值为0.012 h,极大值为74.184 h,平均值为10.367 h。考虑降水影响的雨季的总可达性最小值为0.011 h,最大值为74.079 h,平均值为10.356 h。因此,受降水影响,青藏高原全域的雨季总可达性的平均值增加了0.011 h。从空间分布来看,雨季可达性结果与未考虑降水情况的可达性结果分布基本一致;其中,雨季总可达性的最大值相较于未考虑降水情况增加了0.105 h。从研究结果来看(表3),不考虑雨季影响时,青藏高原地区约有33.589%的国土面积在8 h范围内无法达到最近服务设施,考虑雨季影响则这一比例增加至33.609%,即有0.021%的国土面积从8 h可达变为了不可达,总体结果变化不大。
图3
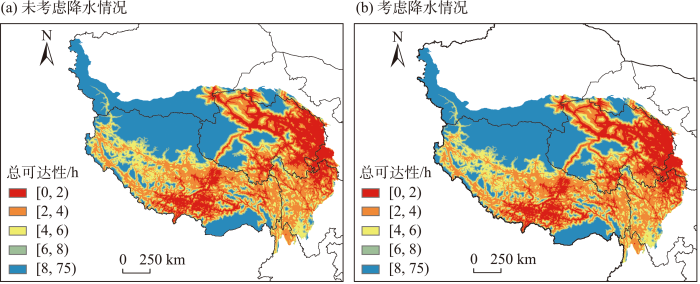
图3
未考虑降水情况下的总可达性(a)和考虑降水影响的雨季总可达性(b)
Fig.3
Total accessibility without considering the impact of precipitation (a) and total accessibility in the rainy season considering the impact of precipitation (b)
表3 雨季不同可达性范围的总可达性结果对比
Tab.3
| 可达性/h | 占青藏全域总面积的比重/% | ||
|---|---|---|---|
| 未考虑降水影响 | 考虑降水影响 | 降水影响的变化 | |
| [0, 2) | 16.237 | 16.235 | -0.002 |
| [2, 4) | 26.394 | 26.369 | -0.025 |
| [4, 6) | 15.784 | 15.789 | 0.005 |
| [6, 8) | 7.997 | 7.998 | 0.001 |
| ≥8 | 33.589 | 33.609 | 0.021 |
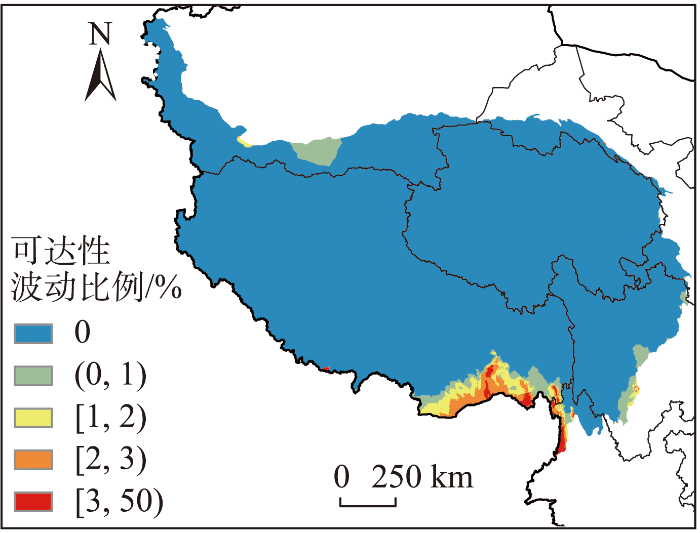
计算雨季可达性相较于未考虑降水影响的可达性季节波动情况(图4),结果显示:受降水影响,青藏高原地区的可达性波动幅度较小,最小值为0,最大值为45%,平均值为0.07%。从分布来看,可达性受降水影响最大的地区主要聚集在珠穆朗玛峰附近及雅鲁藏布江大峡谷附近地区。从影响范围来看,可达性受降水影响的波动比例在1%以下的地区占比为97.100%;[1%, 3%)范围内地区面积占比为2.500%;[3%, 7%)范围内地区面积占比为0.386%;波动比例超过7%的地区面积占比仅为0.014%。
图4
2.2 雪季公路可达性的分布差异
2.2.1 雪季公路可达性
受积雪影响,青藏高原全域到医疗、商业和城市功能等设施的平均最短时间较未考虑积雪影响的情况均有所增加,即受积雪影响可达性存在变差的情况(图5)。
图5
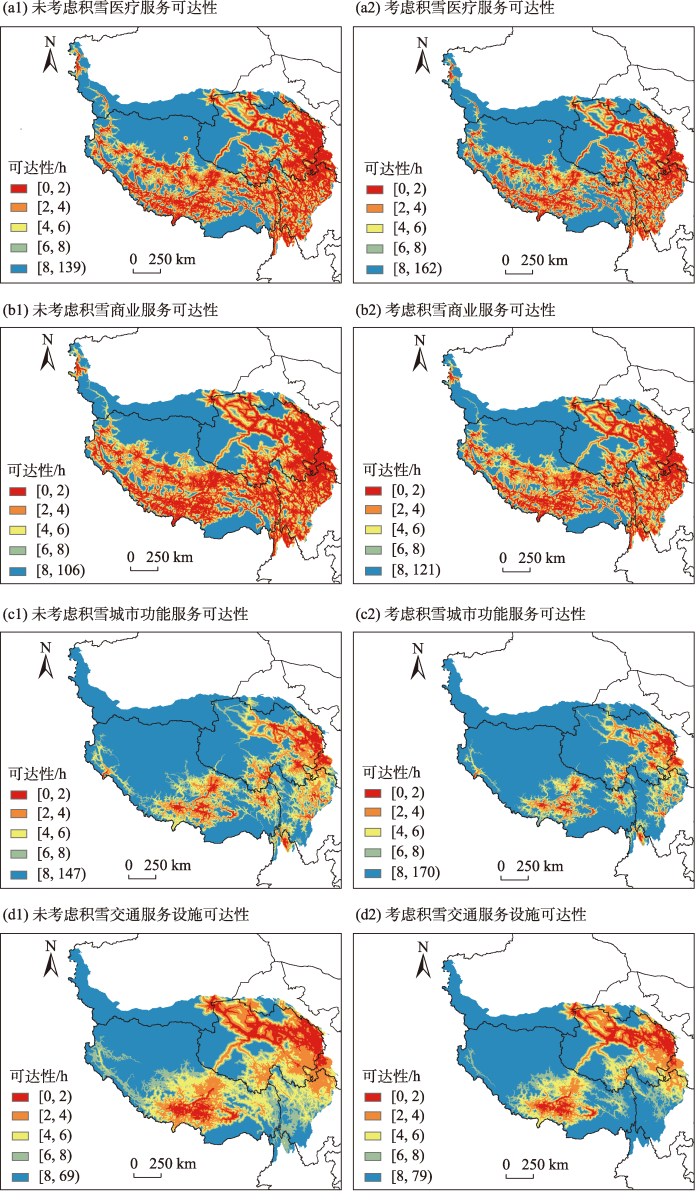
图5
未考虑积雪情况下的分设施可达性(a1、b1、c1、d1)与考虑积雪影响的分设施可达性(a2、b2、c2、d2)
Fig.5
Accessibility of different facilities without considering the impact of snow cover (a1, b1, c1, and d1) and considering the impact of snow cover (a2, b2, c2, and d2)
具体来看,到医疗服务设施的平均最短时间的极大值为161.28 h,极小值为0,平均值为18.57 h,标准差为27.36 h;相较于未考虑积雪影响,到医疗服务设施的平均最短时间的最大值增加了23.65 h,平均值增加2.91 h。到商业服务设施的平均最短时间的最大值为120.91 h,最小值为0,平均值为15.42 h,标准差为22.81 h;相较于未考虑积雪影响,到商业服务设施的平均最短时间的最大值增加了15.48 h,平均值增加2.43 h。到城市功能服务设施的平均最短时间的最大值为169.02 h,最小值为0,平均值为26.54 h,标准差为31.68 h;相较于未考虑积雪影响,到城市功能服务设施的平均最短时间的最大值增加了22.64 h,平均值增加4.46 h。到交通服务设施的平均最短时间最大值为78.43 h,最小值为0.0131 h,平均值为14.61 h,标准差为14.83 h;相较于未考虑积雪影响,到城市功能服务设施的平均最短时间的最大值增加了10.02 h,最小值增加0.00271 h,平均值增加2.56 h。
计算到各服务设施的平均最短时间,以[0, 2)、[2, 4)、[4, 6)、[6, 8) h等范围计算不同可达性时段地区的面积占青藏全域总面积的比重,将未考虑积雪影响的结果和考虑积雪影响的结果进行对比(表4)。结果显示:受积雪影响,到医疗服务设施的可达性降低比例最多的范围为[0, 2) h,该区域面积占青藏高原全域面积的17.40%,比未考虑积雪影响的情景减少了4.43%。到医疗服务设施可达性在 [2, 4) h范围内的地区面积占青藏高原全域面积的15.72%,比未考虑积雪影响的情景下减少了1.96%。到医疗服务设施可达性在[4, 6) h范围内的地区面积占青藏高原全域面积的11.72%,比未考虑积雪影响的情景下减少了0.10%。此外,受积雪影响到医疗服务设施的平均最短时间超过6 h的地区所占比重超过50%,比未考虑积雪影响的情景下增加了6.48%。
表4 雪季分设施的不同可达性范围的面积占比
Tab.4
| 设施类别 | 可达性 范围/h | 占青藏全域总面积的比重/% | ||
|---|---|---|---|---|
| 未考虑积雪影响 | 考虑积雪 影响 | 积雪影响的变化 | ||
| 医疗服务设施 | [0, 2) | 21.83 | 17.40 | -4.43 |
| [2, 4) | 17.68 | 15.72 | -1.96 | |
| [4, 6) | 11.82 | 11.72 | -0.10 | |
| [6, 8) | 7.76 | 8.33 | 0.57 | |
| ≥8 | 40.91 | 46.83 | 5.92 | |
| 商业服务设施 | [0, 2) | 25.89 | 20.16 | -5.73 |
| [2, 4) | 19.97 | 18.65 | -1.32 | |
| [4, 6) | 11.58 | 12.37 | 0.79 | |
| [6, 8) | 6.99 | 8.00 | 1.00 | |
| ≥8 | 35.57 | 40.83 | 5.26 | |
| 城市功能服务设施 | [0, 2) | 3.91 | 2.63 | -1.28 |
| [2, 4) | 9.98 | 6.32 | -3.66 | |
| [4, 6) | 12.12 | 8.84 | -3.28 | |
| [6, 8) | 11.12 | 9.35 | -1.77 | |
| ≥8 | 62.87 | 72.85 | 9.98 | |
| 交通服务设施 | [0, 2) | 7.70 | 5.68 | -2.02 |
| [2, 4) | 15.99 | 11.72 | -4.27 | |
| [4, 6) | 16.02 | 11.61 | -4.41 | |
| [6, 8) | 14.85 | 11.87 | -2.98 | |
| ≥8 | 45.44 | 59.13 | 13.68 | |
受积雪影响,到商业服务设施的可达性降低比例最多的范围在[0, 2) h和[2, 4) h范围内,其中平均最短时间在2 h范围内地区面积所占比重比未考虑积雪影响的情景下减少了5.73%,这说明受积雪影响,青藏高原多出近6%的地区无法在2 h范围内到达最近的商业服务设施。在[2, 4) h范围内的地区面积比重比未考虑积雪影响的情景减少了1.32%。同时,相比未考虑积雪影响,受积雪影响到商业服务设施的平均最短时间超过4 h的地区所占比重有所增加,其中平均最短时间超过8 h的地区范围拓展最多,增加比例为5.26%。
整体上看,考虑积雪影响时,到城市的可达性在[0, 2)、[2, 4)、[4, 6)、[6, 8) h 对应的国土面积均有所减少,其中减少比例最多的是[2, 4) h,这一区间的国土面积占全域的比例从9.98%减少为6.32%,下降了3.66个百分点;而区间[0, 2)、[4, 6)、[6, 8) h则分别减少了1.28%、3.28%和1.77%。此外,超过8 h仍不可达的国土面积则从62.87%增加至72.85%,这意味着考虑积雪影响,青藏高原地区将多出近10%的国土面积无法在8 h 内到达最近城市服务。
到交通服务设施的可达性在[0, 2)、[2, 4)、 [4, 6)、[6, 8) h的范围受积雪影响均有所减少,其中减少比例最多的范围是[4, 6) h。考虑积雪影响,青藏高原地区将多出约14%的国土面积无法在8 h 内到达最近交通设施。具体地,青藏高原地区在2 h范围内可到达最近交通服务设施的地区减少2.02%,[2, 4) h范围内减少4.27%,[4, 6) h范围内减少4.41%,[6, 8) h范围内减少2.98%。
2.2.2 雪季公路可达性的变化
图6
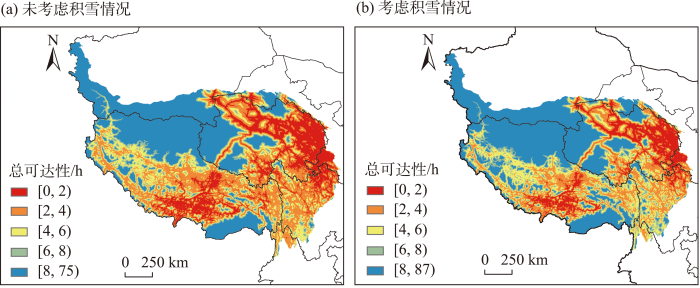
图6
未考虑积雪情况下的总可达性(a)和考虑积雪影响的总可达性(b)
Fig.6
Total accessibility without considering the impact of snow cover (a) and considering the impact of snow cover (b)
表5 雪季不同可达性范围的总可达性结果对比
Tab.5
| 可达性/h | 占青藏全域总面积的比重/% | ||
|---|---|---|---|
| 未考虑积雪影响 | 考虑积雪影响 | 积雪影响的变化 | |
| [0, 2) | 16.24 | 10.83 | -5.41 |
| [2, 4) | 26.39 | 20.85 | -5.54 |
| [4, 6) | 15.78 | 18.14 | 2.36 |
| [6, 8) | 7.99 | 10.55 | 2.56 |
| ≥8 | 33.59 | 39.62 | 6.03 |
计算雪季可达性相较于未考虑积雪影响的可达性季节波动情况(图7)。结果显示:青藏高原地区受积雪影响可达性波动的最小值为0.71%,最大值为116.1%,平均值为24.5%。从分布来看,青藏高原范围内可达性受积雪影响最严重的地区主要聚集在西藏东部、青海南部和四川西部,多分布在横断山区、唐古拉山脉、巴颜喀拉山脉等地形区内。从影响范围来看,可达性受积雪影响的波动比例在[0.71%, 17.5%)范围内的地区的面积占比为28.701%;在[17.5%, 26.1%)范围内的面积占比最大,为35.790%;在[26.1%, 35.9%)范围内的面积占比为22.141%;在[35.9%, 50.1%)范围内的面积占比为10.109%;在50.1%及以上的地区面积占比为3.259%。
图7

3 结论与讨论
3.1 结论
本文基于多源数据,以青藏高原地区为案例地,综合坡度、海拔等地形特征对交通流特征的影响,采用成本—距离法,评价降水、积雪等恶劣天气影响下的公路可达性,测度受雨雪影响可达性波动的阈值范围并勾勒其空间分布格局。主要结论如下:
(1) 雨季青藏高原地区全域到医疗、商业、城市功能和交通服务设施的最短时间与未考虑降水影响的情况差异较小,但喜马拉雅山脉南源和雅鲁藏布江大峡谷附近存在受降水影响可达性变差的情况。青藏高原地区全域的雨季总可达性的平均值增加0.011 h,但受降雨影响,无法在8 h、2 h、4 h范围内到达最近服务设施的地区分别多出0.021%、0.001%、0.025%。。
(2) 青藏高原地区可达性受降水影响最大的地区主要聚集在珠穆朗玛峰附近以及雅鲁藏布江大峡谷附近地区。具体来看,可达性受降水影响的波动比例在1%以下的地区占比为97.100%,[1%, 3%)范围内的地区的面积占比为2.500%,在[3%, 7%)范围内的面积占比为0.386%,波动比例超过7%的地区的面积占比仅为0.014%。
(3) 青藏高原地区全域在雪季到医疗、商业、城市功能和交通服务设施的最短时间较未考虑积雪影响的情况均有所增加。受积雪影响,青藏高原地区全域雪季总可达性的最短可达时间平均增加了2.04 h。雪季可达性结果在[0, 2) h范围和[2, 4) h范围内可达地区的面积明显小于未考虑积雪影响的可达性结果。但受降雪影响,多出5.41%的地区无法在2 h内到达最近服务设施,多出5.54%的地区无法在[2, 4) h范围内到达最近服务设施。
(4) 青藏高原可达性受积雪影响最严重的地区主要聚集在西藏东部、青海南部和四川西部,多分布在横断山区、唐古拉山脉、巴颜喀拉山脉等地形区内。可达性受积雪影响的波动比例在[0.71%, 17.5%)范围内的地区的面积占比为28.701%;在[17.5%, 26.1%)范围内的面积占比最大,为35.790%;在[26.1%, 35.9%)范围内的面积占比为22.141%;在[35.9%, 50.1%)范围内的面积占比为10.109%;在50.1%及以上地区的面积占比为3.259%。
3.2 讨论
在交通可达性的评价中,需要在空间上考虑道路网络的连接数量、交通干线的技术等级及其影响程度,以及从宏观角度衡量特定区域的通达性态势[38]。由于青藏高原地区存在的地面交通距离、快速可达以及与运量之间的矛盾,决定了其不能依靠或较难依靠地面交通大通道来实现快速可达。因此,需要建设布局合理的高原地区民航体系。青藏高原地区受积雪影响,可达性降低比例较大,受影响较严重的地区主要分布在西藏东部、青海南部和四川西部等,建议以规定符合高原区域特征的可达性时间为阈值,作为通用机场有效服务半径进行优化布局,发展高原机场相关机型和航线。
本文主要考虑雨雪季的时间变化对青藏高原地区交通可达性的影响,这对于构建交通可达性评价体系具有重要意义。本文降水数据为地区降水量的月均值,这削弱了日降水量和短时强降水的影响,故本文中降水对道路速度的影响评价仍然偏低。此外,降水对公路灾害的发生具有显著的影响,特别是高山峡谷地区引发泥石流、滑坡等问题的影响较大,在未来的研究中需要给予以更多的关注。
参考文献
高速公路雾天人工和智能网联车混行交通流仿真
[J].
DOI:10.16265/j.cnki.issn1003-3033.2022.07.1109
[本文引用: 1]

为提高雾天行车安全性,以智慧高速主线为研究对象,分析混行下能见度降低造成安全速度下降、智能网联车(CAVs)驾驶模式降级和换道动机趋于保守的驾驶行为变化情况,建立含纵向跟驰和横向换道规则雾天单向高速公路元胞自动机模型(CAM),通过仿真对模型予以校验,并分析交通流特性和事故概率。结果表明:轻雾、中雾、重雾和浓雾时,车辆降级占比为52.3%、60%、63%和67.3%,2 h换道次数为161、131、104.3和69(×10<sup>2</sup> veh),自由流最大速度为90、76.8、62.6、46.8 km/h,临界密度为42、40、38、36 veh/km,且随渗透率变小愈加明显;事故概率随渗透率变大而大幅减少,渗透率达到50%以上时,事故概率较人工车辆(HVs)下降不低于52.9%。
Simulation of mixed traffic flow with HVs and CAVs on freeways in foggy weather
DOI:10.16265/j.cnki.issn1003-3033.2022.07.1109
[本文引用: 1]
In order to improve driving safety in foggy weather, with a section of smart freeway as a research object, changes in driving behaviors under mixed traffic flow were analyzed, including decrease of safe speed, degradation of CAVs driving mode, and conservative lane-changing due to decrease in visibility. Then, a CAM of one-way freeway was established, where rules of longitudinal car-following and lateral lane-changing were designed. Finally, the model was validated through simulation, and traffic flow characteristics and accident probabilities were analyzed. The results indicate that under light fog, medium fog, heavy fog and dense fog conditions, the degradation ratios of CAVs are 52.3%, 60%, 63%, and 67.3%, lane-changing times during two hours are 161, 131, 104.3 and 69 (×102 veh), maximum free flow velocity is 90, 76.8, 62.6 and 46.8 km/h, and critical density is 42, 40, 38 and 36 veh/km, respectively, and they become more and more obvious with the decrease of permeability. Moreover, accident probability decreases greatly with increase of permeability, and it reduces by at least 52.9% when penetration reaches 50% compared to HVs environment.
基于微观动力学参数的高速公路特征路段事故风险分析
[J/OL].
Analyzing traffic crash risk of freeway characteristics based on micro-kinetic parameters
青藏高原市域综合交通优势度评价及空间特征: 以林芝市为例
[J].
DOI:10.18306/dlkxjz.2021.08.007
[本文引用: 3]
青藏高原的特殊性长期约束着交通设施的建设与功能,科学评价其交通状况具有重要意义。论文以林芝市为例,考虑自然特征、多种交通方式及交通稳定性,构建综合交通优势度评价体系进行实证探讨。研究发现:① 综合交通优势度以巴宜区、米林县、工布江达县得分较高,其中中心乡镇尤其明显,分别在内部交通功能、对外交通功能、区位优势度方面具有优势,察隅县、墨脱县综合交通优势度及各分项得分均较低,G318、林拉公路、米林机场等重点交通设施影响突出;② 林芝市综合交通优势度的县域差距及空间极化效应趋于增强,但中心—外围结构的空间完整性被地形等因素隔离破坏,边境地区成为林芝市综合交通优势度最为薄弱的环节;③ 综合交通优势度与人口分布具有一定匹配性,多数乡镇二者之间呈协调水平,但以初、中级协调为主,边境和自然条件约束明显的地区尚需考虑优化。根据林芝市特点,改进后的综合交通优势度评价更好地揭示了区域交通薄弱地区,对青藏高原或其他类似特殊地域单元的交通设施评价具有参考意义。
Comprehensive traffic advantage degree and its spatial characteristics at the prefecture level on the Qinghai-Tibet Plateau: A case study of Linzhi City
DOI:10.18306/dlkxjz.2021.08.007
[本文引用: 3]
The unique natural environment of the Qinghai-Tibet Plateau has restricted the construction and function of its transportation infrastructure. In order to evaluate the traffic facilities on the Qinghai-Tibet Plateau, taking Linzhi City, a typical area of southeastern Tibet with high altitude and uneven terrain, as an example and considering the natural characteristics, various transport modes, transport stability, and location advantage, this study established an evaluation system of comprehensive traffic advantage degree to empirically examine the situation in 2015 and 2020. The results show that: 1) Bayi District, Milin County, and Gongbujiangda County, especially their central towns, have much higher scores in internal traffic function, external traffic function, and location advantage degree, while the values of traffic advantage and many of its indicators in Chayu County and Motuo County are low, and the impact of some key transportation infrastructures such as the G318 Highway (national highway), Linzhi-Lhasa Highway, and Milin Airport is prominent. 2) The results of spatial difference analysis show that the comprehensive traffic advantage degree of Linzhi City is unbalanced, and the county-level gap and spatial polarization effect tend to increase. However, the core-periphery spatial structure is fragmented and interrupted by terrain factors of extreme difference in altitude, and the border area of Linzhi City becomes the weakest part with regard to the comprehensive traffic advantage degree. 3) There is a certain degree of matching between the comprehensive traffic advantage degree and the population distribution as shown by the linear trend line and coupling coordination relationship. Bayi District, Milin Town, and Gongbujiangda Town have reached the high-quality coordination level. However, most of the towns are at the preliminary or intermediate coordination level, while in the border area and areas with severe natural constraints, the coordination degree urgently needs to be optimized. Methodologically, by superimposing regional natural attributes, expanding the evaluation dimension of traffic advantage degree, and integrating various modes of transportation, the comprehensive traffic advantage evaluation conforms to the actual situation of the study area. Regional transport evaluation that incorporates the consideration of natural environment characteristics has practical significance for supporting territorial planning and transportation infrastructure evaluation and management, especially for regions such as the Qinghai-Tibet Plateau.
青藏高原多年冻土区公路修筑技术之进展
[J].
Advances in road construction technology in the permafrost region of the Qinghai-Tibet Plateau
How accessibility shapes land use
[J].DOI:10.1080/01944365908978307 URL [本文引用: 1]
The measurement of accessibility: Some preliminary results
[J].DOI:10.1007/BF00165245 URL [本文引用: 1]
Modeling accessibility of screening and treatment facilities for older adults using transportation networks
[J].
DOI:10.1016/j.apgeog.2018.02.013
PMID:29556112
[本文引用: 1]
Increased lifespans and population growth have resulted in an older U.S. society that must reckon with the complex oral health needs that arise as adults age. Understanding accessibility to screening and treatment facilities for older adults is necessary in order to provide them with preventive and restorative services. This study uses an agent-based model to examine the accessibility of screening and treatment facilities via transportation networks for older adults living in the neighborhoods of northern Manhattan, New York City. Older adults are simulated as socioeconomically distinct agents who move along a GIS-based transportation network using transportation modes that mediate their access to screening and treatment facilities. This simulation model includes four types of mobile agents as a simplifying assumption: walk, by car, by bus, or by van (i.e., a form of transportation assistance for older adults). These mobile agents follow particular routes: older adults who travel by car, bus, and van follow street roads, whereas pedestrians follow walkways. The model enables the user to focus on one neighborhood at a time for analysis. The spatial dimension of an older adult's accessibility to screening and treatment facilities is simulated through the travel costs (indicated by travel time or distance) incurred in the GIS-based model environment, where lower travel costs to screening and treatment facilities imply better access. This model provides a framework for representing health-seeking behavior that is contextualized by a transportation network in a GIS environment.
基于高速公路流的东北大都市区边界识别与结构特征研究
[J].
DOI:10.13249/j.cnki.sgs.2019.06.008
[本文引用: 1]
利用高速公路收费站数据分析东北大都市区的空间边界与中心-外围结构特征。研究发现,① 中心城市高速公路流随距离的分布符合距离衰减规律,随规模位序的累积分布符合“二八定律”,但在具体的指标阈值上却表现出显著差异。② 四大都市区在空间上相连,以较小的国土面积承载了区域主要的社会经济活动。沈阳都市区和大连都市区在城镇关联体系中已实现融合;沈阳都市区、长春都市区、哈尔滨都市区间的空间联系则相对松散。③ 高速公路流空间下,各大都市区中心-外围空间结构表现出空间圈层、功能廊道和边界切割的典型特征。
Spatial boundaries and structural characteristics of metropolitan areas in northeast China: A study using the data of expressway flows
DOI:10.13249/j.cnki.sgs.2019.06.008
[本文引用: 1]
Spatial boundaries and structural characteristics of metropolitan areas are of great significance for understanding the interactive relationship between cities and regions. Using the data of expressway flows, this paper explored the core-periphery spatial linkages patterns with the indexes of spatial linkages intensity and temporal distance to the central city. On this basis, the spatial boundaries of the metropolitan areas in Northeast China were identified and the characteristics of core-periphery structures were discussed. This article shows that, firstly, the expressway flows of central cities conform to the law of distance attenuation and the Pareto's principle. But the threshold values of different central cities show significant differences, indicating that the agglomerating and radiating effects of the central cities on the surrounding areas have the differences in distance, intensity and direction. Secondly, Shenyang metropolitan area, Changchun metropolitan area, Harbin metropolitan area, and Dalian metropolitan area, where most of the social and economic activities in Northeast China agglomerated, are geographically neighbored. Comparing with Changchun metropolitan area and Harbin metropolitan area, Shenyang metropolitan area and Dalian metropolitan area have a higher density of economic activities and closer spatial linkages, and have integrated as a whole in the urban system network, while the linkages among Shenyang metropolitan area, Changchun metropolitan area and Harbin urban area are relatively loose. Thirdly, under the space of expressway flows, the core-periphery spatial structures of the metropolitan areas show typical characteristics of spatial layers, functional corridors and boundary effect, which have a great impact on the regional economic organization. In future, the development of the metropolitan areas in the Northeast China should focus on solving the restrictive effect of the administrative boundary, promoting the organic combination of the metropolitan areas around Harbin-Dalian axis, and finally forming a regional cooperation system in the form of urban agglomeration or megalopolis.
Public transport accessibility accounting for level of service and competition for urban opportunities: An equity analysis for education in Santiago de Chile
[J].
交通发展、时空压缩与产业区位效应: 以公路建设为例
[J].
Transport development, time-space compression and industrial location effect: Evidence from highway construction
Urban expansion and differential accessibility by car and public transport in the Greater Kumasi city-region, Ghana: A geospatial modelling approach
[J].
Accessibility of movement challenged persons and challenges faced by their escorting family members: A case study of Dhaka, Bangladesh
[J].
人口流动视角下中国地级以上城市空间联系格局与影响因素
[J].
The spatial contact pattern and influencing factors of cities above the prefecture level in China from the perspective of population mobility
到达车站的步行时间对老年人公交选择的影响
[J].公共交通是老年人重要的出行方式,到达车站的步行时间是公交服务质量的重要组成部分. 以出发地到车站的步行时间表征车站可达性,基于陈述性偏好调查数据,利用随机系数Logit 模型研究步行时间对老年人公交选择行为的影响. 研究表明:随机系数Logit 模型比传统的多元Logit 模型具有更高的拟合度. 随机系数Logit 模型的效用函数中,车内时间系数为非随机变量,步行时间系数为随机变量;性别、年龄、是否拥有电动车、教育程度、月收入是否大于3 000 元、是否经常使用公交等个人统计学属性,以及老年人对身体状况的主观感知、老年人对体育活动的态度等心理因素,对老年人步行时间价值具有显著影响.
Effect of bus stop walking time on elderly's bus choice
Public transportation is an important way for the elderly to travel, and walking time to the station is an important part of the quality of public transport services. Taking walking time from the origin to the bus station, and based on the stated preference data, this paper analyzed the impact of walking time on the elderly's bus choice behavior with the random parameters Logit model. Through analysis, it was found that the random parameters Logit model fitting the data much better than the multinomial Logit model. The parameter of in-vehicle time was non- random, while the parameter of walking time was random. Furthermore, the elderly's demographic characteristics including gender, age, motorcar ownership, education, monthly income (greater than 3 000 yuan or not), had a significant impact on the parameter of walking time. So did the latent psychological factors, such as psychological factors towards physical activity, perceived physical functioning.
协同考虑脆弱性与可靠性的城市道路网络设计
[J].
Urban road network design with balance between vulnerability and reliability
Impact of cold and snow on temporal and spatial variations of highway traffic volumes
[J].DOI:10.1016/j.jtrangeo.2007.12.003 URL [本文引用: 1]
Study of rainfall impacts on freeway traffic flow characteristics
[J].DOI:10.1016/j.trpro.2017.05.180 URL [本文引用: 1]
雨天环境下高速公路交通流特性及模型研究
[J].
Traffic flow characteristics and models of freeway under rain weather
降雨对城市道路行程速度的影响
[J].以北京市实时天气数据和基于浮动车的城市道路行程速度、交通运行指数数据为基础,对比分析降雨天气和正常天气的行程速度、指数、降雨量等数据指标.然后从降雨强度、时间段、拥堵等级等角度展开对城市道路运行参数的分析,建立降雨天气速度预测修正模型,并进行模型验证.研究得出,在夜间降雨强度达到中雨及以上时,快速路、主干路、次支路的速度下降百分比分别为:8.8%、4.8%、5.9%,分别得出高峰和平峰时降雨强度与行程速度下降之间的关系;得出在全路网不同拥堵等级下降雨强度与行程速度下降之间的关系.最后对速度预测模型进行实测验证.结果表明,该模型可以对降雨天气条件下的行程速度进行有效预测,预测的平均误差在5%以内.
Impact of rainfalls on travel speed on urban roads
By utilizing Beijing real-time weather data, travel speed on urban roads and traffic performance index (TPI) based on floating car data (FCD), this paper analyzes and compares travel speed, TPI and rainfalls under rainfall weather and normal weather. Then, the operating parameters of urban roads are analyzed from the perspectives of precipitation intensity, time periods and congestion levels. Further, the correction model for speed prediction is developed and validated. The study shows that travel speeds on the expressway, major arterial and collector decrease by 8.8%, 4.0% and 5.9% respectively when the precipitation intensity reaches the moderate rain level or above at night, and further derives the relationships between the precipitation intensity and the travel speed reduction during the peak and non- peak hours. In addition, the relationships between the precipitation intensity and the travel speed reduction under different congestion levels are also obtained. Finally, application examples are presented to validate the proposed model, which shows that the model can effectively predict the travel speed under the rainfall weather, and the average prediction error is less than 5%.
暴雨对快速路速度—密度关系影响的实证分析
[J].研究了暴雨对不同车道数的城市快速路交通运行的影响.首先估算了暴雨下自由流车速、通行能力等关键参数下降幅度;然后利用最小二乘法标定了6 种连续型速度—密度模型,最后评价了模型估计关键参数能力和预测车速能力.研究表明:暴雨下路段的自由流车速和通行能力下降幅度、模型估计关键参数能力和预测车速能力都随车道数不同而不同.因此有必要区分暴雨对不同车道数快速路路段的影响.
Empirical analysis of speed-density relationships for urban expressway under rainstorm condition
This paper investigates the impacts of rainstorm condition on traffic operation of multi-lane urban expressways. Firstly, reductions in free- flow speed and capacity are calculated. Secondly, six oneregime speed-density models are calibrated by least square method. Finally, best models for key parameter estimation and for operating speed prediction are assessed. Results show that reductions in free-flow speed and capacity, and the abilities to estimate key parameter and to predict operating speed vary with different number of lanes under rainstorm condition. Therefore, it necessitates distinguishing rainstorm' s impacts on urban expressway segments with different number of lanes.
恶劣天气对高原山区高速公路交通流特征的影响分析
[J].
An impact analysis of bad weather on traffic flow characteristics of plateau mountain expressway
降雨强度对山区高速公路运行车速的影响研究
[J].
Study of the effect of rainfall intensity on operating speeds on mountain highways
青藏高原产业发展的交通运输门槛研究
[J].
Threshold study on transportation and industrial development in Qinghai-Tibet Plateau
DOI:10.11849/zrzyxb.2000.04.009
[本文引用: 1]
It is very clear that the transport is one of the most important factors for economic development in the Qinghai Tibet Plateau where the poor transport infrastructure has affected local economic development.In Qinghai Tibet Plateau,high transportation cost and long transport distance of the products has not only limited the competitiveness of local enterprises,but also raised market price of the products from other parts of the country.However,in some areas,there are partly development potentials for some industries due to the superior natural resources and relative favorable transport conditions.In this paper,the relationship between transportation cost and economic development is discussed.The development strategies of comparative advantage and unbalanced development should be properly worked out for local economic development.For example,according to the transportation cost,developing local cement industry is benefit for local economy in Tibet.Some key natural resources,such as salt,chromite,and so on,should be developed as key sectors in some areas.
基于GIS的青藏高原史前交通路线与分区分析
[J].
DOI:10.18306/dlkxjz.2018.03.014
[本文引用: 1]
青藏高原自然环境恶劣,但并非是生命的禁区。确切证据表明,末次冰消期人类已扩张至高原地区,并通过长期实践形成了较为稳定的交通路线格局。通过构建自然因子模拟—遗址分布校正方法,利用GIS得到青藏高原史前交通路线模拟结果,再结合考古证据对模拟路线进行印证。依据模拟结果将高原分为以下4个区:东北区、东南区、西南区以及西北无人区。其中东北区路线遗址点密度高,落入路线内的遗址点数量占总数的88.56%。路线形成于旧石器时期,其方向为东西向,密切联系东北区的内部,并向外沟通黄土高原与北方地区,其形成与发展为彩陶、粟黍、小麦的传播以及丝绸之路的形成奠定了基础。东南区路线为南北走向,北与黄河上游地区连接,南与四川盆地、云贵高原沟通,加强了南北方地区的文化交流,是民族融合与交流的大走廊。西南区位于高原的腹心地带,模拟的路线体现了人类对青藏高原主体的征服,其线路总长度4602.32 km为3个区域内最长,是人类向高原进军的第2条重要通道。西北无人区主要为高寒荒漠区,其自然环境极端恶劣不适宜人类生存,故无路线分布。
GIS-based analysis of traffic routes and regional division of the Qinghai-Tibetan Plateau in prehistoric period
1976—2016年青藏高原地区通达性空间格局演变
[J].
DOI:10.11821/dlxb201906009
[本文引用: 2]
青藏高原地区是地球上最独特的地理—生态—人口—交通单元,区域内交通网络的发展特征及规律是人地关系协同发展的一个重要切入点,对青藏高原地区交通网络开展研究具有重要意义。据此,分析1976-2016年青藏高原地区交通网络演化特征,并以省会、地级市、县级市和县城为节点,采用网络分析的时间距离计算模型探讨其通达性演变过程。研究表明:① 青藏高原地区交通网络复杂性、区域连通性增强,初步形成格状交通网络;② 青藏高原地区中心城市、县城之间的平均最短通达时间已极大缩短至11.89 h、18.84 h,呈自东向西逐渐增大的空间格局,时空收敛效应显著,通达性变化程度与其初始值有关;③ 中心城市为该地区的发展极,其与周围城市通达状况有极大提高,可达时间平均值下降到16.49 h;④ 中心城市和县城交通圈演变过程一致,青藏高原地区各地到最近城市、县城的通达时间不断缩小,沿重要交通干线已形成中心城市4 h、县城2 h短时交通圈连片分布格局,湟水河谷地、一江两河地区逐渐形成交通廊道,乡镇对外交通联系得到改善。
Evolution of accessibility spatial pattern of the Qinghai-Tibet Plateau in 1976-2016
DOI:10.11821/dlxb201906009
[本文引用: 2]
The Qinghai-Tibet Plateau is a unique geography-ecology-population-traffic region on the earth. The characteristics and regularities of the transport network development are an important breakthrough for the coordinated development of man-land relationship, which is of great significance to the research in the Qinghai-Tibet Plateau. Accordingly, this paper analyzes the evolution of transport network in this region between 1976 and 2016, and explores its accessibility using a temporal distance calculation model based on network analysis by taking provincial capitals, prefecture-level cities and counties as transport nodes. Results suggest that, first, transport network is more complex and the regional connectivity is gradually enhanced in the plateau, preliminarily forming a grid-like transport network; second, the average minimum accessibility time between anchor cities and between counties has been vastly reduced to 11.89 hours and 18.84 hours, manifesting a gradually growing spatial pattern from east to west and remarkable effects of time-space convergence; third, anchor cities are the poles of regional development, with average accessibility time to around cities reduced to 16.49 hours, indicating that anchor cities tied with others have been improved; fourth, the traffic circles of anchor cities and counties are evolving consistently, accessibility time from various places in the study area to their nearest cities or counties are decreasing, presenting a contiguous pattern of short-time traffic circle with 4-hour access to central cities and 2-hour access to counties along important arterial roads, thus improving external transport connection of towns. And traffic corridors are gradually formed in the Huangshui River Valley, and the Middle Region of "One River and Two Streams" in Tibet.
Snow depth derived from passive microwave remote-sensing data in China
[J].
DOI:10.3189/172756408787814690
URL
[本文引用: 2]
In this study, we report on the spatial and temporal distribution of seasonal snow depth derived from passive microwave satellite remote-sensing data (e.g. SMMR from 1978 to 1987 and SMM/ I from 1987 to 2006) in China. We first modified the Chang algorithm and then validated it using meteorological observation data, considering the influences from vegetation, wet snow, precipitation, cold desert and frozen ground. Furthermore, the modified algorithm is dynamically adjusted based on the seasonal variation of grain size and snow density. Snow-depth distribution is indirectly validated by MODIS snow-cover products by comparing the snow-extent area from this work. The final snow-depth datasets from 1978 to 2006 show that the interannual snow-depth variation is very significant. The spatial and temporal distribution of snow depth is illustrated and discussed, including the steady snow-cover regions in China and snow-mass trend in these regions. Though the areal extent of seasonal snow cover in the Northern Hemisphere indicates a weak decrease over a long period, there is no clear trend in change of snow-cover area extent in China. However, snow mass over the Qinghai–Tibetan Plateau and northwestern China has increased, while it has weakly decreased in northeastern China. Overall, snow depth in China during the past three decades shows significant interannual variation, with a weak increasing trend.
Evaluation of rural roads construction alternatives according to seasonal service accessibility improvement using a novel multi-modal cost-time model: A study in Nepal's remote and mountainous Karnali Province
[J].
区域交通基础设施可达性研究进展
[J].
DOI:10.11820/dlkxjz.2013.05.012
[本文引用: 1]
随着中国区域交通基础设施快速发展,可达性研究受到学界与规划界广泛关注.本文通过梳理近20 年来国内外区域交通基础设施可达性研究的发展脉络,从可达性时空变化及其地域效应方面总结国内外区域交通可达性研究的各自特点与发展方向,判断未来国内相关研究主题.综合比较可知,区域交通可达性的空间格局与时空演变研究仍是国内外交通地理学的研究热点问题.国外研究评价指标丰富,空间分辨率不断提高,分析技术方法日益多样,研究内容更趋于多元化,不断拓宽了可达性研究与应用领域.国内研究发展快,但研究指标体系有待完善,空间分辨率仍有待提高,亟待考虑交通需求与政策干预等现实因素.
Research progress on accessibility to regional transportation infrastructure
DOI:10.11820/dlkxjz.2013.05.012
[本文引用: 1]
With the rapid development of regional transportation infrastructure in our nation, the research on accessibility to transportation infrastructure has been increasingly receiving attentions from academia and scholars in planning field. This article attempts to review the literature of domestic and foreign studies on accessibility to regional transportation in the recent 20 years, summarize characteristics and prospects of the studies from the aspects of temporal-spatial variations of accessibility and the aspects of its regional spatial effect, and predict hot topics of the related domestic research in the future. Through systematically comparing the similarities and differences of domestic and foreign research, we conclude that the research on temporal variations of regional accessibility is still an important topic at home and abroad. As shown in the related foreign literature, there are numerous evaluation indicators; spatial resolutions of accessibility have been continuously improved; more and more analytical technique and methods are being developed. When simulating accessibility, more complex and realistic factors are taken into account, such as traffic congestion, transfer, etc. Foreign research tends to be more diversified, and continues to explore new fields and new applications, such as spillover effect, etc. In the related domestic literature, the research develops quickly and adopts foreign research methods and ideas, but more studies on index system are needed and spatial resolution needs to be further improved. We should also consider more important realistic factors in accessibility research, such as traffic demand and policy intervention etc.
Three presentations on geographical analysis and modeling:Non-isotropic geographic modeling; speculations on the geometry of geography; and global spatial analysis
[R].
贫困山区农村衰落的特征及诊断: 以重庆市酉阳县为例
[J].
DOI:10.18402/resci.2017.06.02
[本文引用: 1]
自然资源禀赋差,土地人口承载力低,交通不便,公共服务基础设施差,是贫困山区的基本特征,贫困山区也因此成为人口和产业离心区、生态脆弱区。本文以重庆市酉阳县为例,选取典型村,采用参与式评估、遥感影像和GIS相结合的方法,从微观尺度分析贫困山区农村土地利用演变特征,揭示农村衰落的原因和规律。结果表明:①研究区农村衰落程度严重,植被覆盖率升高,耕地向林草地转变;同时,耕地面积萎缩、聚拢,细碎化程度降低;伴随人口过疏化和老龄化,农村建设用地使用率低,经历由单一到多样,再单一的衰减过程,教育等公共基础服务设施缺位严重;②研究区农村衰落的原因包括农业生计资源匮乏、难以实现农业机械化、聚居分散和城乡比较效益大、农民生活追求的提高以及农业政策实施难度大;③建立以人口流失率、常住人口老龄化率、宅基地萎缩率和耕地变化率4个衰落指标为主的农村衰落诊断方法,诊断表明,研究区农村衰落主要发生在边远山区,距离城镇近、区位优越的农村未表现出衰落。当前农村土地整治和扶贫工作应尊重客观规律,科学制定乡村规划,依靠山区生态系统自我修复、引导人口外迁为主,撂荒耕地择优流转,而复垦未来必然衰落的农村居民点,肯定造成过程性浪费。
Characterization and diagnosis of rural decline in poor mountainous areas
DOI:10.18402/resci.2017.06.02
[本文引用: 1]
Few natural resources,a low population capacity,inconvenient traffic and poor public services are characteristics of poor mountainous areas. These areas are centrifugal areas of population and industry that have fragile ecologies. Focusing on seven typical villages in Youyang County in Chongqing City,we analyzed the micro-scale evolution of rural land use to explore rural decline in poor mountainous areas based on participatory rural appraisal methods and remote sensing imagery interpretation. We found that the degree of rural decline in poor mountainous is severe. Along with rural labor flowing into cities and towns and an increasing number of aging people,rural construction land is inefficient,and the diversity of the rural land use changed from simple to richness to simple again. Cultivated land size became smaller,gathered and less fragmented. Meanwhile,the vegetation rate increased due to conversion between cultivated land and woodland. Many reasons,including a lack of agricultural livelihood resources,difficulty in realizing agricultural mechanization,decentralization and the comparative benefits of urban and rural areas were responsible for the decline in rural mountainous areas. A diagnosis index system of rural decline,including population loss rate,rural residential land shrinking rate and reduction in cultivated area was established. This showed that rural decline mainly occurred in remote mountainous villages. We suggest that rural land consolidation and poverty alleviation should obey the object law,making a rural plan scientific. Self-repair of ecosystems should be emphasized in ecological restoration. Cultivated land should be transferred selectively.
基于交通可达性与城市竞争力的城市腹地范围识别: 以长江中游城市群为例
[J].
DOI:10.13284/j.cnki.rddl.003177
[本文引用: 1]
通过构建相应指标体系,采取主成分分析法测度长江中游城市群城市竞争力。在GIS软件支持下,基于时间成本距离栅格的交通可达性分析,利用场强模型,对2015年长江中游城市群31个城市腹地范围进行识别。研究发现:长江中游城市群城市竞争力空间分布差异较大,最大值和最小值相差达5.84倍,与行政级别具有一定关联性。从交通可达性来看,1 h圈空间范围主要集中在中心城市附近,≥3 h圈主要分布在远离省会城市的外围地区,以及岳九咸(岳阳、九江和咸宁)省际交界区。长江中游城市群城市间交通发展缺乏统一规划与协调性,内部交通联系较为薄弱。从空间场强来看,高场强区集中于中心城市及其周边地区,低场强区分布于交通通达性较差的边缘与外围地区,尤其是省际边界地区。场强空间分布与城市竞争力与交通可达性分布具有较强的吻合度,但省际间协同发展程度低。城市腹地范围来看,湖北省大部分城市腹地面积较小,江西省城市腹地面积相对广阔,湖南城市腹地面积居中,三大省会城市腹地面积远超过其他城市,意味着长江中游城市群业已形成以省会城市为多中心的复合型极核发展格局,但内部一体化程度偏弱。从腹地与行政范围的层叠结果来看,城市腹地与市域行政范围吻合度较差,省会城市扩伸率要高于其余城市,而且三大省会城市的域外腹地面积比例远高于其他城市,九江、岳阳、宜昌、常德、新余、景德镇等地域外腹地面积比例也较高。总体来说,长江中游城市群仍停留在子圈内一体化的阶段,还未实现三圈融合和高度一体化发展阶段。
Recognition of urban hinterland based on transportation accessibility and urban competitiveness: A case study on the middle reaches of the Yangtze River
DOI:10.13284/j.cnki.rddl.003177
[本文引用: 1]
Through the construction of a corresponding index system, the competitiveness of cities in the middle reaches of the Yangtze River in 2015 was measured using principal component analysis, and based on their road traffic layers, the accessibility of cities was measured using GIS grid cost distance spatial analysis technology. Then, the entire spatial field strength was simulated using the field strength model, and the hinterland of the cities was extracted according to the maximum principle. This was done to effectively define the spatial scope of the urban agglomeration in the middle reaches of the Yangtze River. The spatial distribution of urban competitiveness in the middle reaches of the Yangtze River was found to be quite different, and the difference between the maximum and minimum values was 5.84, which is related to the administrative level. In terms of accessibility, the 1-h circle mainly concentrates in the vicinity of the central part of the city, and the 3-h circle and above mainly distributes in the periphery far from the provincial capital city as well as in the Yue-Jiu-Xian provincial boundary area. There is a lack of unified planning and coordination regarding inter-city traffic development in the middle reaches of the Yangtze River, and internal traffic links are relatively weak. Regarding spatial field energy, the high field energy area was concentrated in the central city and its surrounding areas, while the low field energy area was distributed in the marginal and peripheral areas with poor traffic accessibility, particularly in the provincial border areas. The spatial distribution of field strength was in good agreement with the distribution of urban competitiveness and traffic accessibility; However, the degree of inter-provincially coordinated development was low. From the perspective of urban hinterlands, the hinterlands of most cities in Hubei Province are smaller, the hinterland of Jiangxi Province is relatively vast, the hinterland of Hunan City is medium sized, and the hinterland of the three provincial capitals is much larger than those of other cities, which means that the urban agglomeration in the middle reaches of the Yangtze River has formed a complex polar nuclear development pattern with the provincial capital cities as the multi-center However, the degree of internal integration is weak. From the overlapping results of the hinterland and administrative scope, the consistency between the urban hinterland and the municipal administrative scope is poor. Cities with an expansion rate that is greater than 1.1 were mainly Wuhan, Changsha, Nanchang, Yichang, Changde, Pingxiang, Xinyu, Jingdezhen, and Yingtan. Cities with an expansion rate above 0.9 and less than 1.1 mainly included Hengyang, Loudi, and Yueyang. In Xiangyang, Tianmen, and Qianjiang, the expansion rate of other cities was less than 0.9. In addition, the proportion of extraterritorial hinterland of the three major provincial capitals was found to be much higher than that of other cities. The proportion of extraterritorial hinterland of Jiujiang, Yueyang, Yichang, Changde, Xinyu, and Jingdezhen was also higher. Generally, urban agglomeration in the middle reaches of the Yangtze River has stayed consistent at the stage of integration within the sub-circle and has not yet realized integration of the three circles or highly integrated development. This study attempted to identify the spatial range of urban agglomerations by using GIS quantitative analysis technology, and we provide reference for optimization and integration of the urban spatial structure of urban agglomerations in the middle reaches of the Yangtze River.
基于累计机会可达性的北京城市公共服务设施复合功能识别
[J].
DOI:10.12082/dqxxkx.2020.190717
[本文引用: 1]
城市时空大数据技术的快速发展和应用,为城市功能区识别提供了新的数据基础和技术手段,但专门关于城市公共服务设施复合功能的研究还相对较少。基于北京市9大类公共服务设施的空间点数据,综合考虑不同类型公共服务设施等级和品质特征,采用累计机会方法对1 km×1 km格网尺度的北京城市公共服务设施可达性进行了综合评价,在此基础上重点分析了北京城市公共服务设施复合功能特征与影响因素。研究表明:① 北京城市公共服务设施累计机会空间分布存在明显的中心集聚特征,但不同类型公共服务设施的空间分布模式和覆盖范围却有所区别;② 北京城市公共服务设施功能区可以划分为单一功能、单一化的复合功能、2种复合功能、3种复合功能和均衡化的复合功能等5大类型;③ 人口密度、距市中心距离、土地价格和经营性为主设施的累计机会可达性是影响北京城市公共服务设施复合功能的重要因素。研究结论对进一步细化城市功能区研究和促进北京城市公共服务设施空间结构优化具有科学启示作用。
Identifying mixed functions of urban public service facilities in Beijing by cumulative opportunity accessibility method
近30年青藏高原雪深时空变化特征分析
[J].
Spatio-temporal variation of snow depth on Tibetan Plateau over the last 30
降雨对山区高速公路运行车速的影响研究
[J].
Study of the effect of rainfall on operating speeds on mountain highways
Road network vulnerability analysis considering the probability and consequence of disruptive events: A spatiotemporal incident impact approach
[J].
