

21世纪以来,全球气候变化、城市化快速扩张和土地退化加剧等不确定性因素导致农作物生产力衰退和粮食产量下降[1⇓-3]。尽管强化耕地可持续集约利用是保障粮食有效供给的重要途径[4-5],但受限于耕作条件和农地规模[6],实现粮食安全目标还需立足于耕地数量管控[7-8]。然而,农业结构调整背景下的耕地“非粮化”倾向加速耕地流失,《关于严格耕地用途管制有关问题的通知》(自然资发〔2021〕166号)中强调“通过统筹林地、草地、园地等其他农用地及农业设施建设用地整治为耕地等方式,补足同等数量、质量的可以长期稳定利用的耕地”[9]。因此,如何系统认识非粮化耕地整治潜力并有效识别其空间边界与阈值范围成为强化耕地保护数量管控的关键环节,对耕地“非粮化”治理和粮食综合生产能力提升具有重要现实意义。
以粮食安全目标为核心的需求牵引是开展耕地“非粮化”治理的核心落脚点[10-11],作为农户自发式逐利行为引起的农用地内部结构变化,在明晰耕地“非粮化”问题来源的基础上,明晰非粮化耕地整治潜力是统筹有限耕地资源供给与多元主体价值需求相协调所需要遵循的重要路径。现阶段,耕地“非粮化”研究内容逐步拓展,在内涵界定方面,耕地“非粮化”通常分为作物种植型[12]、耕作结构型[13]和利用生产型[14]三种类型,兼顾作物种植属性和耕作地类属性双重特征;在定量测度方面,耕地“非粮化”测度方法涉及中宏观层面行政区划尺度的非粮食作物结构占比与微观层面地块尺度的非粮化耕地图斑认定,遥感技术在耕地“非粮化”作物识别与提取中应用广泛[14⇓-16];在时空分异方面,不同研究尺度下耕地“非粮化”态势随时间变化呈现上升趋势[15-16],粮食主产区的耕地“非粮化”程度普遍偏高[17];在机制解析方面,不同类型的耕地“非粮化”空间分异特征受资源禀赋、社会经济和政策制度的作用强度存在差异[18];在效应评估方面,耕地“非粮化”在不同程度上改变了土壤理化性状,威胁着粮食可持续生产能力[19]。整体来说,已有研究综合集成了概念深化、特征挖掘、机理剖析的研究范式。然而,随着耕地“非粮化”日益加剧以及科学认知的不断深化,单纯以耕地“非粮化”特征解析驱动的治理路径无法满足管理部门的现实需求,虽然现有研究已将非粮化耕地整治纳入耕地“非粮化”治理过程[20],但是基于非粮化耕地整治潜力与分区调控的协同治理研究鲜有报道,尤其是统筹资源禀赋支撑和现实条件约束的非粮化耕地整治潜力技术体系构建亟待深入探讨。
耕地“进出平衡”制度有效落实依赖于耕地“非粮化”治理成效显化,其基本前提在于明确非粮化耕地整治潜力的空间支撑及其调控路径。本文以成都平原为研究区,对非粮化耕地整治潜力进行系统解析的基础上,运用资源环境承载能力和国土空间开发适宜性评价的方法识别非粮化耕地图斑理论整治潜力,进而构建规划管控、耕作条件、经济支撑和社会意愿的非粮化耕地现实整治潜力约束评价体系;运用两维图论聚类算法形成非粮化耕地整治潜力分区并提出差异化调控策略,以期为成都平原耕地“非粮化”治理和耕地“进出平衡”制度实施提供科学支撑。
1 研究框架
作为耕地“非粮化”治理的重要支撑,开展非粮化耕地整治潜力现实需求、关键问题和可行性路径的系统解析是确保耕地恢复的重要基础。
从非粮化耕地整治潜力的现实需求来看,第二次全国土地调查(以下简称“二调”)中耕地流出至其他农用地导致耕地“非粮化”愈加明显。由于国家实行最严格的耕地保护制度以及耕地“进出平衡”制度,当耕地面积下降到特定阈值,自然资源管理部门将采取管控措施以遏制耕地在农用地内部的流出态势,并且按照耕地数量管控目标通过非粮化耕地整治将“二调”时期种植非粮食作物的恢复性图斑恢复为粮食作物种植[20]。为突出非粮化耕地在农用地系统中的结构性特征和强化农用地内部之间的结构转换认知,本文将非粮化耕地界定为第三次国土调查(以下简称“三调”)中的即可恢复和工程恢复地类,包括即可恢复和工程恢复的园地、林地、草地、水域和农业设施建设用地等非耕农用地,以作物种植结构和地类图斑结构的双重属性为实际管理需求提供有效支撑。
从非粮化耕地整治潜力的应对策略来看,明确耕地“非粮化”治理路径是应对非粮化耕地整治潜力现实需求和关键问题的重要举措。结合相关农用地整治潜力概念[23⇓-25],非粮化耕地整治潜力可理解为在国家政策牵引和地方需求引导下将特定区域内非粮化耕地整治为耕地的阈值大小。根据阈值大小的可实现程度将其分为理论和现实整治潜力。其中,理论整治潜力是指在考虑农业生产所需的水土光热等要素基础上耕地恢复规模的最大化,可叠加农业生产适宜性评价和生态保护重要性评价结果予以实现;现实整治潜力是指在理论整治潜力测算基础上,统筹规划管控、耕作条件、经济支撑和社会意愿等人为因素介入下耕地恢复规模的最优化;以此为基础,运用两维图论聚类算法形成非粮化耕地整治潜力分区,并通过设定分区调控规则提出挖掘非粮化耕地整治潜力的调控策略(图1)。
图1
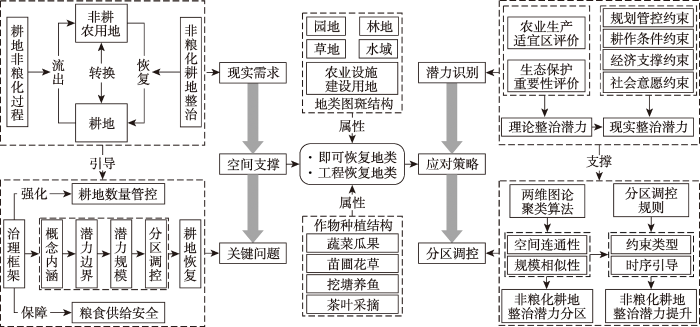
图1
非粮化耕地整治潜力的系统解析
Fig.1
Systematic analysis of consolidation potential of non-grain cultivated land
2 研究区概况与数据来源
2.1 研究区概况
成都平原(103°~104°E、29°~31°N)地处四川省中部,包括成都、德阳、绵阳、雅安、乐山、眉山等6市的部分区域,共计37个县(市、区),总面积为2.77万km2(图2);地势西高东低,属亚热带东南季风气候,岷江和沱江水系发达,年降雨量880.2~1343.3 mm,年均气温15.9~16.9 ℃,年均日照时数780.6~1185.8 h;2020年总人口为2710万人,城镇化率为67.93%,GDP总量为27231.07亿元,粮食作物播种总面积为6753 km2,粮食总产量为301.73万t。根据《四川省国土空间规划(2020—2035年)》战略布局,成都平原作为四川省粮油主产区和天府粮仓建设关键区域,深刻影响全国的粮食生产和农产品供给;然而,成都平原耕地保护面临着“非粮化”的现实困境,2009—2020年成都平原耕地流出至农用地面积3718 km2,占“二调”时期耕地面积的34.52%,严重威胁粮食生产能力提升。因此,以成都平原为例开展非粮化耕地整治潜力与分区调控研究具有重要的区域典型性和现实指导意义。
图2
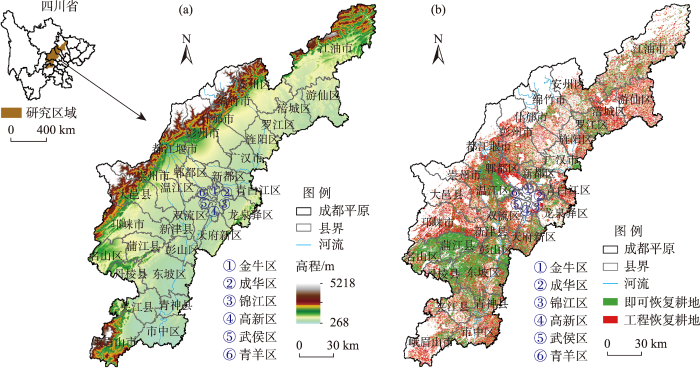
图2
成都平原DEM与非粮化耕地分布
Fig.2
Distribution of DEM and non-grain cultivated land on the Chengdu Plain
2.2 数据来源与处理
本文所需的数据包括土地利用和规划数据、DEM数据、蒸散发量数据、NPP数据、气象数据、生态系统类型数据、耕地质量等别数据和统计数据:① 土地利用和规划数据涵盖2020年“三调”变更数据以及生态保护红线和城镇开发边界,来源于四川省国土整治中心;② 蒸散发量和NPP数据数据分别涉及MOD16A3H和MOD17A3H数据产品,均来源于MODIS数据(
3 研究方法
3.1 非粮化耕地理论整治潜力识别方法
3.1.1 理论整治潜力评价指标体系
为消除生态保护与农业生产之间的潜在冲突,以全域范围为评价对象开展生态保护重要性评价和农业生产适宜性评价,并将农业生产适宜性评价结果扣除生态保护极重要区后形成农业生产适宜区[26-27],旨在为非粮化耕地整治潜力挖掘提供资源环境底线边界。借鉴已有研究[28],构建生态保护重要性和农业生产适宜性评价体系(表1)。生态保护重要性评价围绕生态系统服务功能和生态脆弱性两个方面选取6个指标,分别表征生态系统服务的供给程度和生态要素的脆弱性程度;农业生产适宜性评价围绕地形条件、土壤条件、气候条件和区位条件4个方面选取10个指标,分别表征农业生产过程的立地支撑条件、土壤养分状况、光热组合程度和区位优势特征。在此基础上,采取因子赋值—综合评价法进行基础评价[28],并按照自然断点法将生态保护重要性和农业生产适宜性分别划分为一般重要、重要和极重要以及不适宜、一般适宜和适宜3个等级。
表1 生态保护重要性和农业生产适宜性评价指标体系
Tab.1
| 目标层 | 准则层 | 指标层 | 计算方式 | 权重 | 趋向 |
|---|---|---|---|---|---|
| 生态保护重要性 | 生态系统 服务功能 | 生物多样性维护 | 0.12 | + | |
| 水源涵养 | 0.21 | + | |||
| 水土保持 | 0.22 | + | |||
| 防风固沙 | 0.13 | + | |||
| 生态敏感性 | 水土流失敏感性 | 0.21 | + | ||
| 沙化敏感性 | 0.11 | + | |||
| 农业生产适宜性 | 地形条件 | 坡度 | ArcToolbox/3D Analyst工具/栅格表面/坡度 | 0.12 | + |
| 坡向 | ArcToolbox/3D Analyst工具/栅格表面/坡向 | 0.08 | |||
| 土壤条件 | 土壤质地 | 耕地资源质量分类数据库 | 0.10 | + | |
| 有效土层厚度 | 0.13 | + | |||
| 土壤有机碳 | 0.07 | + | |||
| 气候条件 | 积温 | ArcToolbox/Spatial Analyst工具/插值分析/反距离权重法 | 0.11 | + | |
| 年均降水量 | 0.12 | + | |||
| 区位条件 | 与农村居民点距离 | ArcToolbox/Spatial Analyst工具/距离/欧式距离 | 0.10 | - | |
| 与河流距离 | 0.08 | - | |||
| 与农村道路距离 | 0.09 | - |
注:公式中
3.1.2 理论整治潜力判别方法
本文运用图示法刻画农业生产适宜区和非粮化耕地之间的对应关系以识别非粮化耕地理论潜力(图3)。将农业生产适宜性评价结果中的一般适宜和适宜两个等级视为农业生产适宜区,在此基础上叠加非粮化耕地图斑,形成面向资源环境承载的非粮化耕地整治理论潜力。
图3
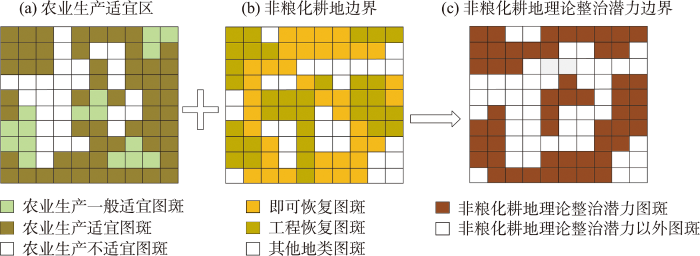
图3
非粮化耕地理论整治潜力识别过程
Fig.3
Identification process of theoretical potential of non-grain cultivated land consolidation
3.2 非粮化耕地现实整治潜力识别方法
3.2.1 现实整治潜力约束评价指标体系
通常来说,除自然环境条件以外,影响非粮化耕地整治潜力的因素还涉及政策性因素和非政策性因素[29-30]。本文遵循全面性、合理性、可行性等原则,以规划管控约束、耕作条件约束、经济支撑约束和社会意愿约束构建非粮化耕地整治现实潜力评价指标体系(表2)。其中,规划管控约束选取生态保护红线和城镇开发边界两项指标,表征规划控制线对非粮化耕地整治过程的用途约束;耕作条件约束围绕利用集聚性和利用稳定性选取4项指标,表征非粮化耕地格局特征和地块属性对整治过程的空间约束;经济支撑约束围绕投资能力和整治成本选取4项指标,表征投入强度和整治难度对非粮化耕地整治过程的资金约束;社会意愿约束围绕政府意愿和农户意愿选取6项指标,表征不同主体之间利益博弈对非粮化耕地整治过程的主观约束。
表2 非粮化耕地整治现实潜力的多因素约束评价指标体系
Tab.2
| 目标层 | 准则层 | 指标层 | 量化方法 | 权重 | 趋向 |
|---|---|---|---|---|---|
| 规划管控约束 | 规划控制线 | 生态保护红线 | ArcToolbox/Spatial Analyst工具/提取分析/裁剪 | 0.50 | |
| 城镇开发边界 | 0.50 | ||||
| 耕作条件约束 | 利用聚集性 | 地块连片度 | 非粮化地块周长/非粮化地块面积 | 0.26 | - |
| 距离现状耕地距离 | 地块距离现状耕地缓冲距离 | 0.18 | + | ||
| 利用稳定性 | 质量等别 | 非粮化地块质量等级 | 0.32 | + | |
| 灌溉保证率 | 耕地质量等别数据缓冲区 | 0.24 | - | ||
| 经济支撑约束 | 投资能力 | 区域人均国内生产总值 | 国内生产总值/总人口 | 0.23 | - |
| 人均一般公共预算收入 | 一般公共预算收入/总人口 | 0.29 | - | ||
| 整治成本 | 恢复性地类面积比重 | 恢复性地类面积/耕地面积 | 0.31 | + | |
| 非粮食作物播种面积比重 | 非粮食作物播种面积/农作物播种面积 | 0.17 | + | ||
| 社会意愿约束 | 政府意愿 | 人均耕地面积 | 耕地面积/总人口 | 0.12 | + |
| 耕地后备资源面积 | 可开发和可垦造耕地后备资源规模 | 0.15 | + | ||
| 耕地净减少规模 | “二调”与“三调”之间耕地减少面积 | 0.22 | - | ||
| 农户意愿 | 农村人均可支配收入 | 工资性收入、经营性收入、转移净收入和财产 净收入之和 | 0.21 | - | |
| 农产品产量比重 | 农产品产量/农作物产量 | 0.16 | + | ||
| 粮食单产水平 | 粮食产量/粮食播种面积 | 0.18 | - |
3.2.2 现实整治潜力测算方法
(1) 政策性因素约束的现实整治潜力测算方法
本文运用ArcGIS软件中的裁剪工具扣除生态保护红线和城镇开发边界内部的非粮化耕地理论整治潜力边界,得到规划管控约束下的非粮化耕地现实整治潜力。其中,将现实整治潜力与理论整治潜力建立比值关系(式1),得到政策性因素的非粮化耕地整治潜力约束系数。
式中:
(2) 非政策性因素约束的现实整治潜力测算方法
对规划管控约束以外的其他约束条件在采用离差标准化(式2和式3)进行无量纲化处理的基础上,采用熵值法计算指标权重,运用加权求和模型(式4)测算耕作条件、经济支撑和社会意愿约束系数,并根据非政策性因素的非粮化耕地整治潜力约束系数与非粮化耕地理论整治潜力的乘积得到各个行政区的非粮化耕地现实整治潜力(式5)。
式中:
3.3 非粮化耕地整治潜力分区方法
两维图论聚类算法能够将GIS的空间分析与树算法相结合,按照单元在性质上亲疏程度进行分类,以“物以类聚”构建最优化分区[31]。本文借助DPS数据处理系统的两维图论聚类算法模块,以规划管控、耕作条件、经济支撑和社会意愿约束下的非粮化耕地现实整治潜力为基础,通过计算标准化后分区单元之间各行政区的欧式距离获取连接边权值(式6),距离越大关系越疏远,距离越小关系越紧密。
式中:
4 结果分析
4.1 非粮化耕地理论整治潜力
4.1.1 非粮化耕地农业生产适宜性分析
成都平原非粮化耕地农业生产本底优势明显,适宜性等级的空间特征沿地形梯度分异(图4)。其中,农业生产适宜区面积为2225.44 km2,占非粮化耕地面积的61.77%,主要分布在名山—丹棱—东坡—蒲江—彭山片区、成都环都市片区以及罗江—涪城—游仙—江油—安州片区,空间布局较为集聚,该区水土光热组合良好,具备农业生产的资源环境优势;农业生产一般适宜区面积为235.70 km2,占比6.54%,邻近分布在适宜区周边,该区域能够满足农业生产基本需求;农业生产不适宜区面积为956.33 km2,占比26.55%,都江堰市和郫都区内比重较高,但空间分布相对零散,该区受地形坡度和区位便捷度影响导致农业生产适宜性欠佳;生态保护极重要区面积为185.32 km2,占比5.14%,主要分布在成都平原盆周低山丘陵地区,该区域水源涵养和水土保持等生态系统服务功能显著,不具备可持续农业生产的资源条件。
图4
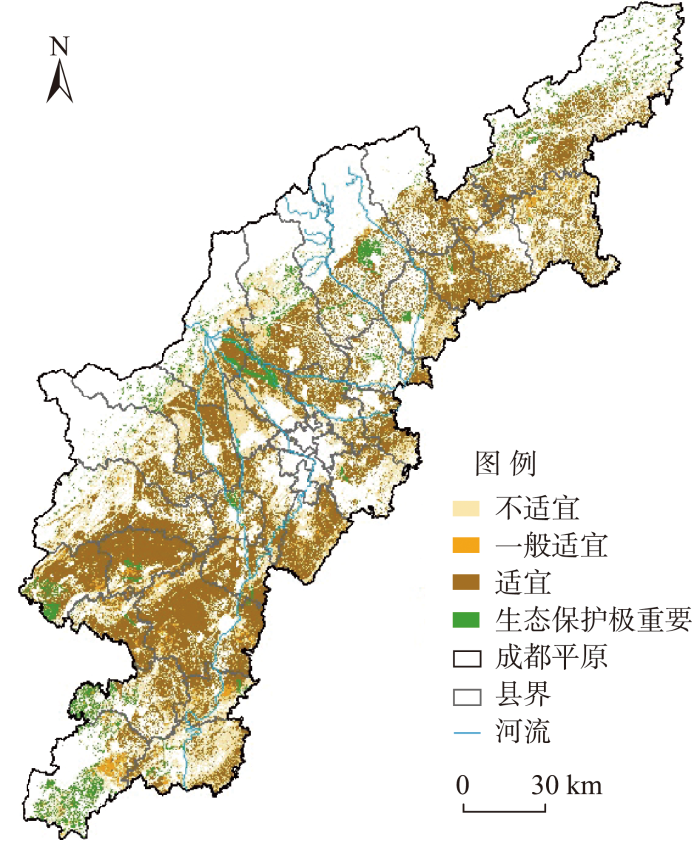
图4
非粮化耕地农业生产适宜性等级
Fig.4
Grade of agricultural production suitability of non-grain cultivated land
4.1.2 非粮化耕地理论整治潜力
成都平原非粮化耕地理论整治潜力受现状非粮化耕地面积影响强烈,并且县(市、区)之间呈现空间不均衡性(图5)。从全域范围来看,成都平原非粮化耕地理论整治潜力面积为2461.14 km2,占现状非粮化耕地面积的68.31%。从不同区域整治潜力面积来看,仅有蒲江县、邛崃市和东坡区3个县(市、区)的理论整治潜力较大,面积均超过150 km2;崇州市、彭山区和名山区3个县(市、区)的理论整治潜力次之,面积介于100~150 km2之间;锦江区、青羊区和金牛区等其余31个县(市、区)的理论整治潜力均低于100 km2。从不同区域整治潜力面积占比来看,蒲江县、东坡区和彭山区等的理论整治潜力面积占比较大,均超过80%;青羊区、高新区和天府新区等的理论整治潜力面积占比次之,介于50%~80%之间;其余县(市、区)的理论整治潜力面积占比均低于50%。总体而言,不同县(市、区)非粮化耕地适宜性支撑和现状规模特征之间的耦合程度综合影响了非粮化耕地理论整治潜力规模大小。
图5
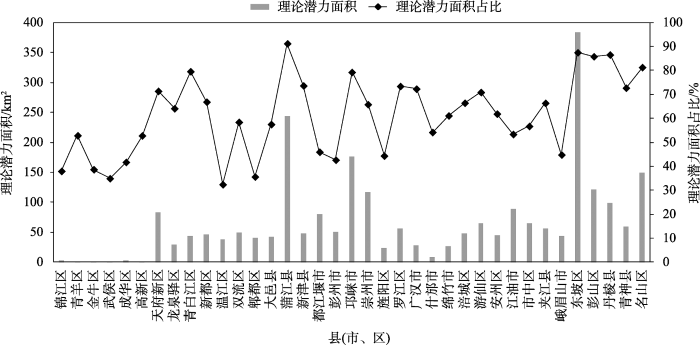
图5
成都平原不同县(市、区)非粮化耕地理论整治潜力
Fig.5
Theoretical potential of non-grain cultivated land consolidation in different counties (cities, districts) on the Chengdu Plain
4.2 非粮化耕地整治现实潜力
4.2.1 非粮化耕地现实整治潜力约束系数分析
以行政区为单元将规划管控、耕作条件、经济支撑和社会意愿约束系数进行空间可视化表达(图6)。
图6
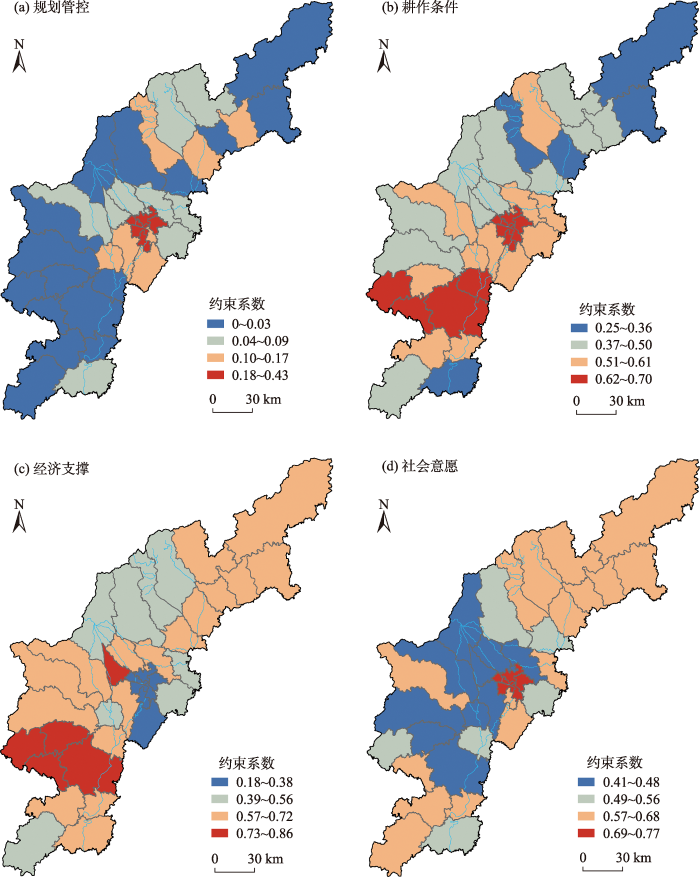
图6
成都平原非粮化耕地现实整治潜力约束系数
Fig.6
Restriction coefficient of actual potential of non-grain cultivated land consolidation on the Chengdu Plain
规划管控约束系数介于0~0.43,空间布局由中心向南北两翼递减。规划管控约束系数高值区分布在锦江区、成华区和青羊区等地,分布广泛的城镇开发边界和非粮化耕地理论整治潜力边界重叠部分较多而导致较高规划管控约束;规划管控约束系数低值区分布在江油市、游仙区、峨眉山和夹江县等地,该地区非粮化耕地理论整治潜力整体较高,但仅有少量非粮化耕地划入城镇开发边界,导致规划管控约束系数较低。
耕作条件约束系数介于0.25~0.70,呈现由南向北间隔式降低的格局特征。耕作条件约束系数高值区分布在中部的锦江区和青羊区等地及南部的丹棱县和东坡区等地,前者由于现状耕地分布零散导致耕作集聚性欠佳,而后者受耕地质量等别和灌溉水平影响不利于耕作稳定性和持续性。耕作条件约束系数低值区分布在游仙区和江油市等地,该地区耕地分布广泛且集中连片,加之耕地质量等别良好,耕作条件对非粮化耕地整治潜力约束不强。
经济支撑约束系数介于0.18~0.86,呈现南部较高、北部次之、中部最低的空间格局。经济支撑约束系数高值区主要分布在蒲江县和东坡区等地,该地区大量恢复性地类面积导致整治成本上升,加之公共预算收入偏低而弱化投资能力,非粮化耕地整治的经济约束显著。经济支撑约束系数低值区主要分布锦江区和青羊区等地,由于非粮化耕地面积较少而使得整治成本较低,同时显著资金供给优势降低了经济支撑约束性。
社会意愿约束系数介于0.41~0.77,呈现中部最高、南北部次之、西部最低的格局特征。社会意愿约束系数高值区分布在锦江区和青羊区等地,该地区经济发达且农产品需求强烈,高价值收益导致农户恢复耕地种植的社会意愿普遍较低。社会意愿约束系数低值区主要分布在郫都区和温江区等地,该区域可供开发的后备资源较多,耕地净流失面积较少,政府部门对非粮化耕地整治的紧迫性略低。
4.2.2 非粮化耕地整治现实潜力分析
从空间分布特征来看,不同约束条件下的非粮化耕地现实整治潜力高值区均集中在蒲江县和东坡区等地,而低值区均分布在锦江区和青羊区等经济发达地区以及绵竹市和广汉市等非粮化耕地面积少量聚集区(图7)。从不同约束类型来看,规划管控约束、耕作条件约束、经济支撑约束和社会意愿约束下的非粮化耕地整治潜力分别为2348.31、1347.89、1676.52和1292.74 km2。究其原因,规划管控约束在其满足自身发展需求的基础上通过空间资源配置最优化而实现对非粮化耕地整治约束的最小化;耕作条件约束注重非粮化耕地与现状耕地之间的空间关联特征,由于原有耕地用途转变导致在耕地恢复过程缺乏一定的可用性支撑;经济支撑约束考虑了不同区域之间的经济发展水平和非粮化耕地规模的差异性,导致在非粮化耕地现实整治潜力挖掘过程存在一定的资金投资和整治成本障碍;社会意愿约束涉及的多主体利益博弈导致非粮化耕地整治过程趋于最大化理性,使得非粮化耕地现实整治潜力最小。
图7
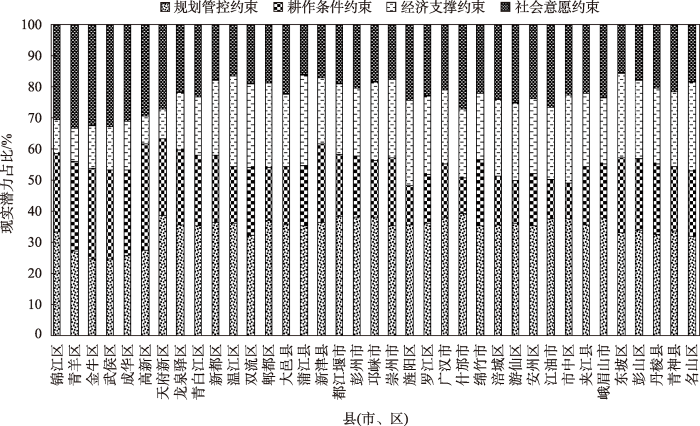
图7
成都平原不同县(市、区)非粮化耕地现实整治潜力面积比例
Fig.7
Proportion of actual potential area of non-grain cultivated land consolidation in different counties (cities, districts) on the Chengdu Plain
4.3 非粮化耕地整治潜力分区调控
4.3.1 非粮化耕地整治潜力分区类型
按照规划管控约束、耕作条件约束、经济支撑约束和社会意愿约束分别形成的成都平原非粮化耕地现实整治潜力为基础进行两维图论聚类分析,得到两维图论聚类图及其对应的成都平原非粮化耕地整治潜力分区图(图8)。37个县(市、区)共形成36条无回路的连接边,连接边的权值介于0.0075~4.2559,结合县(市、区)实际特征对其选取合适的阈值对聚类结果进行分割。考虑到个别县(市、区)的非粮化耕地现实整治潜力过大导致的分区细碎化等问题,选择1.4134作为分割阈值,进而形成5个非粮化耕地整治分区。结合不同研究单元非粮化耕地整治现实潜力的约束类型组合以及未来整治潜力挖掘的时序安排,采用“约束类型+时序引导”的方式命名分区,分别为规划—耕作—意愿约束型适度整治区(Ⅰ区)、规划—耕作—经济约束型潜在整治区(Ⅱ区)、经济—意愿约束型优先整治区(Ⅲ区)、耕作—经济约束型协同整治区(Ⅳ区)和耕作—经济—意愿约束型重点整治区(Ⅴ区)。
图8
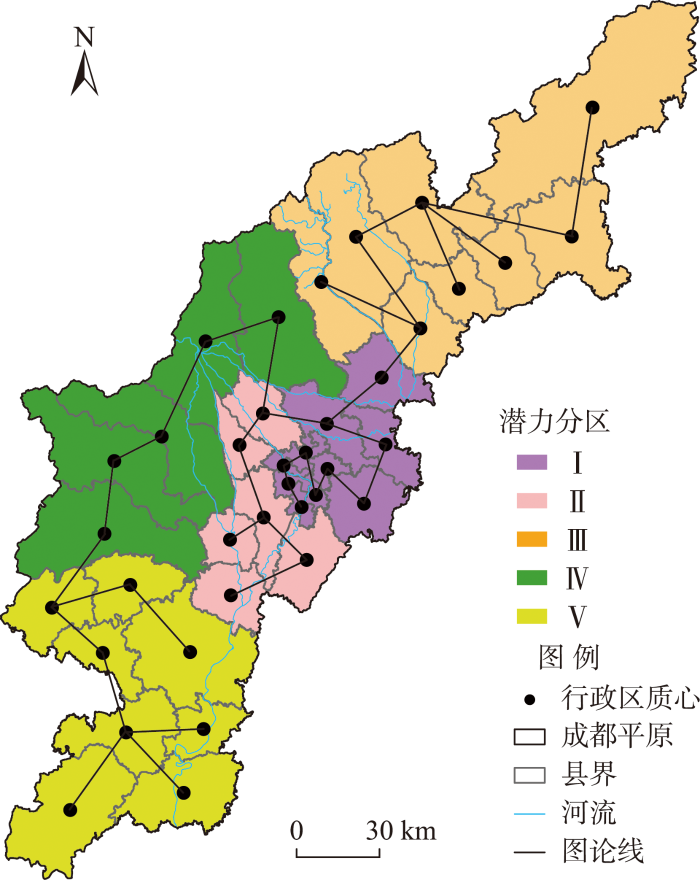
图8
成都平原非粮化耕地整治潜力分区
Fig.8
Zoning of the potential of non-grain cultivated land consolidation on the Chengdu Plain
4.3.2 非粮化耕地整治潜力调控策略
Ⅰ区主要包含锦江区、青羊区和龙泉驿区等10个县(市、区),非粮化耕地面积为228.34 km2,占总面积的6.34%。该区位于成都平原东部经济发达地区,城镇开发边界划定对非粮化耕地整治潜力挖掘产生刚性约束,同时耕作条件和比较收益影响了非耕农用地恢复为耕地的可行性。未来应以改善非粮化耕地的耕作条件为切入点,通过全域土地综合整治等方式选择集中连片度高且邻近现状耕地的地块进行土壤改良,提升非粮化耕地地块质量等别;建立健全农户利益补偿机制,探索提升农户收益的都市粮田景观耕作模式。在此基础上,按照国土空间规划确定的耕地保有量适度进行非粮化耕地整治潜力挖掘。
Ⅱ区主要分布在郫都区、天府新区和彭山区等6个县(市、区),非粮化耕地面积为637.49 km2,占总量面积的17.69%。该区位于成都市中心城区外围,非粮化耕地整治受建设用地扩张影响明显;由于现状耕地规模布局零散和质量等级较低,非粮化耕地整治后的耕作条件受到限制;非粮化耕地规模较大,需要较大的资金投入,限制了非粮化耕地整治潜力挖掘。未来应立足于资金投入,通过设定非粮化耕地整治专项资金等方式缓解耕地恢复的资金障碍,以提升耕地恢复后期的质量,促进布局优化以及作为农户利益补偿来源,并坚持粮食作物和非粮食作物供给最优化的原则开展非粮化耕地整治潜力挖掘。
Ⅲ区主要分布在旌阳区、罗江区和绵竹市等8个县(市、区),非粮化耕地面积为592.10 km2,占总量面积的16.43%。该区位于成都平原北部,非粮化耕地整治面临较高的经济成本和较大的意愿冲突,但是现状耕地规模较大且集中连片程度较高,非粮化耕地整治潜力挖掘的限制性约束条件较少。未来应大力投入资金支撑非粮化耕地整治项目,通过创新社会资本参与的方式实现非粮化耕地整治后期的粮食生产与运营管理,融合多要素投入,综合提升多主体耕作效益,构建集约高效的现代农业生产体系。总体来说,该区亟需按照“应整尽整”的原则,优先进行非粮化耕地整治,最大化恢复耕地面积。
Ⅳ区分布在大邑县、都江堰市、彭州市、邛崃市和崇州市5个县(市、区),非粮化耕地面积为765.50 km2,占总量面积的21.25%。该区位于成都平原西部浅丘地区,受地形坡度影响,耕地种植条件欠佳,原有大量耕地转为非耕农用地,农用地内部结构调整,为非粮化耕地整治增加了投资成本压力。未来应着重进行资金投入,依托高标准农田建设进行土壤改良,优先提升耕作层土壤质地和肥力,保证非粮化耕地整治的资金来源和恢复耕地后期的建设管护,实现非粮化耕地整治的经济投入和耕作条件协同提升。
Ⅴ区主要分布在蒲江县、市中区和夹江县等8个县(市、区),非粮化耕地面积为1379.36 km2,占总量面积的38.29%。该区位于成都平原南部,受农业产业结构调整影响,农作物结构由种植粮食作物转为种植柑橘和茶叶等作物,经济效益显著提升;非粮化耕地分布广泛的现状特征导致耕地“进出平衡”的政策运行过程缺乏足够的资金支撑,同时面临耕作条件欠佳以及政府与农户之间的利益博弈等问题,导致非粮化耕地整治面临严峻挑战。未来应以强化政府引领为支撑,通过资金投入、耕作条件改善和农户利益补偿等方式,充分挖掘非粮化耕地整治潜力,尤其是通过破解关键约束条件,重点推进非粮化耕地整治。
5 结论与讨论
5.1 结论
本文遵循“内涵界定—潜力识别—分区调控”的研究思路,以成都平原为例开展了非粮化耕地整治潜力测算与分区调控的实证研究,主要结论如下:
(1) 成都平原非粮化耕地农业生产条件适宜,适宜区和一般适宜区面积为2461.14 km2,占比68.31%,空间格局呈现“南多北少”的分异特征;相应地,成都平原非粮化耕地理论整治潜力呈现空间不均衡性,理论潜力高值区主要集中在蒲江县、邛崃市和东坡区等地,低值区主要分布在锦江区、青羊区和金牛区等地。
(2) 成都平原非粮化耕地现实整治潜力约束系数对不同县(市、区)的影响强度存在空间差异。规划管控约束、耕作条件约束、经济支撑约束和社会意愿约束系数分别介于0~0.43、0.25~0.70、0.18~0.86和0.41~0.77;与之相对应的,非粮化耕地整治潜力分别为2348.31、1347.89、1676.52和1292.74 km2,多因素约束驱动下的现实整治潜力规模存在显著差别。
(3) 按照“约束类型+时序引导”的命名方式将成都平原非粮化耕地整治潜力分区划分为规划—耕作—意愿约束型适度整治区(Ⅰ区)、规划—耕作—经济约束型潜在整治区(Ⅱ区)、经济—意愿约束型优先整治区(Ⅲ区)、耕作—经济约束型协同整治区(Ⅳ区)和耕作—经济—意愿约束型重点整治区(Ⅴ区),不同分区之间的约束类型组合与整治时序安排确定了差异化的非粮化耕地整治潜力调控策略。
5.2 讨论
以成都平原为例开展非粮化耕地整治潜力测算与分区调控研究是支撑耕地“非粮化”治理的有益探索。非粮化耕地理论和现实整治潜力分别体现了资源禀赋支撑和社会经济约束对耕地恢复过程复杂性认知基础上的逐级剥离。其中,非粮化耕地理论整治潜力通过农业生产适宜区的空间边界识别强调资源环境承载的规模上限,而耕地非粮化耕地现实整治潜力体现在综合集成了规划管控、耕作条件、经济支撑和社会意愿多因素约束下理论潜力可实现程度的规模下限。本文基于非粮化耕地整治潜力结果确立了“约束类型+时序引导”的分区格局。从约束类型来看,成都平原非粮化耕地整治潜力分区涉及双要素约束型和三要素约束型,不同分区之间的约束类型具有同一性和差异性,同一性体现在多个分区类型存在同一个约束条件,差异性体现在不同分区类型之间的约束条件存在差异。换言之,不同约束条件的组合类型阐明了非粮化耕地整治潜力挖掘过程面临着克服多重约束的现实困境。从路径引导来看,成都平原非粮化耕地整治现实潜力规模的空间异质性决定了不同整治分区的优先序情况,具体而言,非粮化耕地整治现实潜力规模较小的东部经济发达地区缺乏一定的资源优势,而成都平原南部的现实潜力规模较大,可将其作为优先整治对象。也就是说,非粮化耕地整治潜力分区的时序引导需要遵循非粮化耕地整治现实潜力规模空间分异的客观规律。
然而,成都平原非粮化耕地理论和现实整治潜力规模存在不同程度的差异,若考虑规划管控、耕作条件、经济支撑和社会意愿多重约束因素的综合作用,成都平原非粮化耕地现实整治潜力规模仅为18.78 km2,表明社会经济约束条件对现实潜力结果影响极为强烈,其影响机制尚需进一步解析;同时,本文提出的成都平原非粮化耕地整治潜力分区调控策略偏向于定性描述,针对不同分区的关键障碍因子还有待于进一步量化剖析。未来研究中还需深化社会经济约束中对非粮化耕地现实整治潜力的限制因子和作用路径研究,强化对耕地“非粮化”治理的管理决策支撑。
参考文献
Climate change impacts on global food security
[J].
DOI:10.1126/science.1239402
PMID:23908229
[本文引用: 1]

Climate change could potentially interrupt progress toward a world without hunger. A robust and coherent global pattern is discernible of the impacts of climate change on crop productivity that could have consequences for food availability. The stability of whole food systems may be at risk under climate change because of short-term variability in supply. However, the potential impact is less clear at regional scales, but it is likely that climate variability and change will exacerbate food insecurity in areas currently vulnerable to hunger and undernutrition. Likewise, it can be anticipated that food access and utilization will be affected indirectly via collateral effects on household and individual incomes, and food utilization could be impaired by loss of access to drinking water and damage to health. The evidence supports the need for considerable investment in adaptation and mitigation actions toward a "climate-smart food system" that is more resilient to climate change influences on food security.
Future urban land expansion and implications for global croplands
[J].
DOI:10.1073/pnas.1606036114
PMID:28028219
[本文引用: 1]
Urban expansion often occurs on croplands. However, there is little scientific understanding of how global patterns of future urban expansion will affect the world's cultivated areas. Here, we combine spatially explicit projections of urban expansion with datasets on global croplands and crop yields. Our results show that urban expansion will result in a 1.8-2.4% loss of global croplands by 2030, with substantial regional disparities. About 80% of global cropland loss from urban expansion will take place in Asia and Africa. In both Asia and Africa, much of the cropland that will be lost is more than twice as productive as national averages. Asia will experience the highest absolute loss in cropland, whereas African countries will experience the highest percentage loss of cropland. Globally, the croplands that are likely to be lost were responsible for 3-4% of worldwide crop production in 2000. Urban expansion is expected to take place on cropland that is 1.77 times more productive than the global average. The loss of cropland is likely to be accompanied by other sustainability risks and threatens livelihoods, with diverging characteristics for different megaurban regions. Governance of urban area expansion thus emerges as a key area for securing livelihoods in the agrarian economies of the Global South.
Arable lands under the pressure of multiple land degradation processes: A global perspective
[J].
耕地集约利用对粮食产量变化影响的定量分析: 以江苏省为例
[J].
The impact of intensive use of agricultural land on grain yields: A case study of Jiangsu Province
Meeting future food demand with current agricultural resources
[J].DOI:10.1016/j.gloenvcha.2016.05.004 URL [本文引用: 1]
山区耕地细碎化对土地利用集约度影响: 以贵州省亚鱼村为例
[J].
DOI:10.18306/dlkxjz.2020.07.003
[本文引用: 1]
为探索耕地细碎化与土地利用集约度之间的关系,论文以贵州省亚鱼村为例,利用无人机高分辨率影像和农户调查数据,在对比不同通勤距离情景耕地细碎化测度模型准确性的基础上,计算农户耕地细碎化指数,并定量分析不同农户耕地细碎化水平对土地利用集约度的影响。结果表明:对比分析6种通勤距离情景耕地细碎化测度结果,发现农户耕作地块到其宅基地的道路网络距离情景下测度耕地细碎化水平准确度更高;这一情景下亚鱼村平均农户耕地细碎化指数是187.98,该村农户耕作通勤时间成本高;随着农户耕地细碎化程度加剧,农业经营中劳动力投入、资本投入和作物产值呈不同程度的下降趋势,其中资本投入中,耕地细碎化对省工性投入的影响最为显著;山区农业人口乡城迁移背景下农村细碎的耕地资源促使农户加快退出农业生产,导致耕地低效利用,甚至撂荒。
Farmland fragmentation and land use intensity in mountain areas: A case study of Yayu Village, Guizhou Province
DOI:10.18306/dlkxjz.2020.07.003
[本文引用: 1]
To explore the relationship between farmland fragmentation and land use intensity, based on unmanned aerial vehicle high-resolution images and household survey data, and by comparing the accuracy of the measurement model of farmland fragmentation under different distance scenarios, this study calculated the farmland fragmentation index for Yayu Village, Guizhou Province and quantitatively analyzed the impact of different levels of farmland fragmentation on land use intensity. The farmland fragmentation measurement results of six distance scenarios show that road network from the farmers' farming plots to their homesteads was more accurate in measuring the level of farmland fragmentation. In this scenario, the average farmland fragmentation index in Yayu Village was 187.98, and time for commuting was high for the farmers. As the degree of farmland fragmentation of farmers intensified, labor input, capital input, and crop output value in agricultural management showed a downward trend in varying degrees. Among the capital inputs, the impact of farmland fragmentation on labor-saving input was most significant. In the context of migration of mountainous agricultural population, the fragmented farmland resources in rural areas had prompted farmers to speed up their withdrawal from agricultural production, resulting in inefficient use of farmland and even land abandonment.
多情景粮食安全底线约束下的中国耕地保护弹性空间
[J].
DOI:10.11821/dlxb2022003014
[本文引用: 1]
科学解析中国耕地数量保多少与如何保等问题对保障国家粮食安全与资源环境可持续发展具有重要意义。面向共享社会经济路径(SSPs)的多情景粮食安全底线约束,本文试图利用耕地保有量、人口预测、粮食需求估算、单产提升潜力衰减等模型方法,依据产能特征—健康状态—耕作条件—利用水平的多维度耕地保护紧迫性评估框架,通过耦合时间序列的数量边界控制与空间尺度的区域规则约束刻画出中国的耕地保护弹性空间。在满足个人基本营养安全与作物单产条件干扰变量恒定的假设前提下,研究发现:① 中国多情景耕地保有量在2020—2100年间呈下降态势,现有耕地数量足以维持长期的粮食安全,但短期内则仅勉强达到理论粮食安全的临界区间1.40×10<sup>8</sup>~1.59×10<sup>8</sup> hm<sup>2</sup>。② 不同维度耕地保护紧迫性在九大农业区划内呈现差异化分布特征,自然条件优越且适宜耕作的黄淮海平原区与长江中下游地区是综合紧迫性高值地块集聚区域。③ 可持续情景与区域冲突情景分别代表粮食安全底线约束下的最小与最大耕地保有量情景,在当前国际形势下,中国应保证短期(2035年内)可休耕量不高于9.29%。④ 基于时空耦合划定的耕地保护弹性空间可分为优先保护、严格管控、休养生息、战略储备、整治修复和特殊保护6类,不同空间的耕地保护弹性强度、目标与任务各有侧重。整体而言,耕地保护弹性空间的划定思路有助于农业结构调整、休耕政策完善等耕地空间规划体系构建,对中国耕地保护制度转型具有借鉴价值。
China's resilience-space for cultivated land protection under the restraint of multi-scenario food security bottom line
DOI:10.11821/dlxb2022003014
[本文引用: 1]
Under new international and domestic situations, scientific analysis of China's cultivated land quantity and its protection ways is of great significance for ensuring national food security and sustainable resources and environment development. This paper analyzes the amount of cultivated land under the constraints of multi-scenario food security within shared social-economic paths (SSPs), using model methods such as cultivated land retention, population forecast, food demand estimation, and yield potential decay. According to the multi-dimensional urgency assessment framework based on productivity characteristics-health status-farming, China's resilience-space for cultivated land protection is delineated by coupling the quantitative boundary control of time series and the regional rules of spatial scale. On the premise of satisfying the assumption of individual basic nutrition security and the constant variables of crop yield conditions, we obtain the following findings. (1) China's multi-scenario cultivated land retention will decline from 2020 to 2100. Existing cultivated land is sufficient to maintain long-term food security, but it barely reaches the critical range of theoretical food security (140 million-159 million hm2) in the short term. (2) The urgency of cultivated land protection in different dimensions presents different distribution characteristics within the nine agricultural zones. The North China Plain and the Middle-lower Yangtze River, which have superior natural conditions suitable for farming, are clusters of high-value plots of comprehensive urgency. (3) The sustainable scenario (SSP1) and the regional conflict scenario (SSP3) represent the minimum and maximum cultivated land retention scenarios under the constraints of food security bottom line. Given the current international situation, China should ensure that the short-term (before 2035) fallow land is not higher than 9.29%. (4) The resilience-space of cultivated land protection delineated based on time and space coupling can be divided into priority protection area, strict control area, rest area, strategic reserve area, comprehensive consolidation area, and special protection area. The flexibility, objectives and tasks of cultivated land protection in different divisions have their priorities. Overall, delineating resilience-space for cultivated land protection facilitates the establishment of spatial planning systems for cultivated land, such as agricultural structure adjustment and fallow policy improvement. This study provide a reference for research on the transformation of China's cultivated land protection system.
多情景模拟下新时代中国耕地保护底线预测
[J].
DOI:10.18402/resci.2021.06.13
[本文引用: 1]
耕地是国家粮食安全的基石,关系到未来中华民族的生存。但究竟需要守住多少耕地才能满足新时代中国粮食需求的底线,一直存在着不同的争论。为此,本文从厘清不同情景下耕地最低保有量需求出发,构建兼顾人口、人均粮食、粮食单产的耕地需求预测模型,模拟完全自给、高度自给、适度自给3种情景的耕地需求量;结合耕地未来可能的变化趋势预测,判定耕地保护的理想能保量、基础应保量、底线必保量。结果表明:①2020、2025、2030、2035年理想能保量要求至少保住19.20亿、18.39亿、18.47亿、16.57亿亩耕地;基础应保量要求至少保住18.49亿、17.72亿、17.78亿、16.12亿亩耕地;底线必保量要求至少保住17.80亿、17.09亿、17.09亿、15.51亿亩耕地。其中基础应保量可作为理性的策略选择。②目前划定15.51亿亩永久基本农田基本能保障2035年粮食自给,但今后若放弃严控政策,则难以满足2030、2035年粮食完全自给的耕地需求。未来应全面细化并继续严格实施耕地保护政策,保障国家粮食安全。
Forecast on China's cultivated land protection baseline in the new era by multi-scenario simulations
DOI:10.18402/resci.2021.06.13
[本文引用: 1]
Cultivated land is the cornerstone of national food security. However, there have been debates about how much cultivated land should be preserved to meet the bottom line of China’s food demand in the new era. Therefore, this study started from clarifying the minimum demand of cultivated land under different scenarios. A prediction model was constructed, which considered population, grain consumption per capita, and grain yield per unit cultivated area. Then, the cultivated land demand was simulated under three scenarios completely self-sufficient, highly self-sufficient, and moderately self-sufficient. Combining with the prediction of the cultivated land change, cultivated land protection was proposed at three levels, including the ideal amount that could be protected (IACP), the basic amount that should be protected (BASP), and the minimum amount that must be protected (MAMP). The results show that: in 2020, 2025, 2030, and 2035, the IACP requires to preserve at least 1.920 billion, 1.839 billion, 1.847 billion and 1.657 billion mu, respectively; the BASP requires to preserve at least 1.849 billion, 1.772 billion, 1.778 billion and 1.612 billion mu, respectively; the MAMP requires to preserve at least 1.780 billion, 1.709 billion, 1.709 billion and 1.551 billion mu, respectively. There into, the BASP of cultivated land may be chosen as a rational strategy of protection. However, if the strict control policy is abandoned in the future, it will be difficult to meet the demand of completely self-sufficient in grain production in 2030 and 2035. Therefore, differentiated,continuous and strict policy of land protection should be implemented to ensure food security in China.
关于严格耕地用途管制有关问题的通知
[EB/OL].
Notice on issues related to strict control of the use of cultivated land
粮食安全视角下中国耕地“非粮化”研究进展与展望
[J].
Progress review on and prospects for non-grain cultivated land in China from the perspective of food security
耕地非粮化的系统认知与研究框架: 从粮食安全到多维安全
[J].
Systematic review and research framework of "non-grain" utilization of cultivated land: From a perspective of food security to multi-dimensional security
中国耕地“非粮化”的时空格局演变及其影响因素
[J].
Spatial-temporal evolution patterns and influencing factors of "non-grain" utilization of cultivated land in China
岩溶槽谷区耕地“非粮化”空间分异特征及驱动机制: 以贵州铜仁万山区为例
[J].
DOI:10.13249/j.cnki.sgs.2022.12.017
[本文引用: 1]
以地处岩溶槽谷地貌的万山区为研究区域,采用空间自相关、热点分析从不同角度分析了“非粮化”耕地的空间结构特征和分布规律,借助地理探测器模型探讨了耕地“非粮化”区域差异驱动因素,并结合岩溶槽谷地形地貌环境研究了耕地“非粮化”的驱动机制。结果表明:① 万山区未耕种“非粮化”耕地较多,并且耕地向林地与园地调整比例较大,在空间分布上存在较强的空间聚集性。② 在众多因素中,距离农村道路的远近是引起区内所有耕地“非粮化”的主导驱动力,导致耕地形成不同的“非粮化”类型。③ 区内“非粮化”耕地的形成与分布受外在驱动力的影响显著,不同“非粮化”耕地类型的主导驱动力不同,但内部之间存在一定的联系。④ 在原始驱动力(地形因素)与外在驱动力(区位因素)并伴随退耕还林还草、生态修复等措施诱导的作用下,槽谷谷底、谷坡、谷顶耕地“非粮化”类型大体相同。
Characteristics and driving mechanism of spatial differentiation of "non-grain" cultivated land in Karst trough valley area: Taking Wanshan District, Tongren, Guizhou as an example
DOI:10.13249/j.cnki.sgs.2022.12.017
[本文引用: 1]
The spatial structure and distribution of “Non-grain” cultivated land in Wanshan area, which is located in karst valley landform, were analyzed by using spatial autocorrelation and hotspot analysis, The driving factors of regional difference of cultivated land non-grain conversion were discussed with the help of the geodetic probe model, and the driving mechanism of cultivated land non-grain conversion was studied in combination with the topography and geomorphologic environment of karst troughs and valleys. The results show: 1) There are more “Non-grain” cultivated land in Wanshan area, and the proportion of cultivated land to woodland and garden land is large, so there is strong spatial aggregation in spatial distribution. 2) Among the many factors, tthe distance from the rural roads is the main driving force, which leads to the formation of different types of “Non-grain” cultivated land. 3) The formation and distribution of “Non-grain” arable land in the region are significantly affected by external driving forces, and different types of “Non-grain” arable land have different driving forces, but there are some internal links between them. 4) Under the influence of the original driving force (topographic factor) and external driving force (location factor) accompanied by measures such as returning farmland to forests and grasslands, ecological restoration, etc., the trough valley low, valley slope and valley top cultivated land “Non-grain” types are roughly the same.
Identifying the driving forces of non-grain production expansion in rural China and its implications for policies on cultivated land protection
[J].
Spatial-temporal characteristics and policy implication for non-grain production of cultivated land in Guanzhong Region
[J].
Quantifying the spatiotemporal dynamics and multi-aspect performance of non-grain production during 2000-2015 at a fine scale
[J].DOI:10.1016/j.ecolind.2019.01.026 URL [本文引用: 2]
中国耕地非粮化空间格局分异及驱动机制
[J].
Spatial pattern differentiation of non-grain cultivated land and its driving factors in China
山东省耕地“非粮化”空间分异特征及其影响因素分析
[J].
Analysis of spatial differentiation characteristics and influencing factors of non-grain cultivated land in Shandong Province
Formation mechanism and sustainable productivity impacts of non-grain croplands: Evidence from Sichuan Province, China
[J].DOI:10.1002/ldr.v34.4 URL [本文引用: 1]
综合适宜性与迫切性的非粮化耕地整治分区方法
[J].
Consolidation zoning method for non-grain cropland integrating suitability and urgency
泰安市设施农用地的时空格局演变与影响因素
[J].
DOI:10.18306/dlkxjz.2023.01.010
[本文引用: 1]
设施农用地是农副产品重要的空间载体。在土地利用转型视角下,区域耕地、非农建设用地规模对设施农用地规模的作用机制及其空间效应尚不明确。论文基于第二、三次全国土地利用调查数据(简称为“二调”和“三调”),运用空间自相关分析、土地利用转移矩阵等方法,系统分析泰安市设施农用地的空间演变特征及其关键影响因素。研究发现:① 二调至三调期间,泰安市设施农用地规模总量相对稳定,但净变化剧烈,耕地、非农建设用地分别是设施农用地主要的转入来源、退出去向;② 泰安市设施农用地呈现出从县城中心向外围推移的规律性,远城区集聚趋势不断加强;③ 二调时期,耕地规模促进设施农用地扩张,而三调时期,耕地规模抑制设施农用地增长,并且在远离县城的乡镇表现更为显著;④ 二调、三调时期非农建设用地均稳定促进设施农用地扩张,这一作用在空间上普遍存在。研究结论可为耕地“非粮化”“非农化”治理以及设施农用地的空间布局调整提供理论支撑。
Spatial and temporal patterns of facility agricultural land in Tai'an City and influencing factors
DOI:10.18306/dlkxjz.2023.01.010
[本文引用: 1]
Facility agricultural land (FAL) is an important spatial carrier of non-grain agricultural production. Under the current land use transition, the impact of regional arable and construction land scales on the scale of FAL and their spatial effects are unclear. Based on the data of the second (2008) and third (2018) national land surveys, this study used spatial autocorrelation analysis and land use transfer matrix to systematically analyze the spatial evolution characteristics of the FAL in Tai'an City and the key influencing factors, in an attempt to provide some theoretical support for the management of "non-grain" and "non-agricultural" transition of arable land and the spatial layout adjustment of FAL. The results show that: 1) During the decade between 2008 and 2018, the total area of FAL in Tai'an City was relatively stable, but the net change was dramatic, and arable land and construction land were the main sources and destinations for transferring FAL, respectively. 2) The FAL showed a spatial pattern of moving from the center of the counties/districts to the periphery, with an increasing trend of agglomeration in distant urban areas. 3) During the second national land survey period, the scale of arable land promoted the expansion of FAL, while during the third national land survey period, the scale of arable land inhibited the growth of FAL and the effect was more significant in townships far away from the county seats. 4) During both the second and the third national land surveys, construction land steadily promoted the expansion of facility agricultural land, and this effect was widespread in space.
耕地利用系统的理论解析与研究框架
[J].
DOI:10.18306/dlkxjz.2022.07.012
[本文引用: 1]
耕地利用系统对全球变化和人类福祉具有巨大影响。论文运用系统科学的理论与方法,探究耕地利用系统的概念、构成、运行、功能和特点,并构建耕地利用系统研究框架,对于深化土地系统科学、解决耕地利用中存在的各种问题具有重要的理论和现实意义。主要结论有:① 耕地利用系统是农业生产经营者在一定数量和质量的耕地上投入适量生产要素种植农作物,进而获得农产品及相应效益的自然—人工复合系统,由耕地子系统、经济子系统及社会子系统构成,具有显性和隐性双重结构。② 耕地利用系统运行及演化是自然生态过程、经济发展过程、社会演化过程耦合行进的结果,并涌现出经济、社会、生态功能,具有复合性、开放性、韧性和多等级性等特征。 ③ 耕地利用系统研究应遵循要素—结构—功能—机制—调控的理论框架,从各要素组成、作用关系及变化特征揭示不同要素的演化特征;从显性与隐性结构2个方面探索耕地利用系统结构及其转型规律;从经济、社会和生态功能3个方面探索功能演化及其对于结构转型的响应特征;从系统对外界环境变化的适应与调整机制、系统要素的相互影响与竞争替代机制、系统运行的信息传导机制、不同等级耕地利用主体协同与组织运行机制、耕地利用功能的涌现机制剖析耕地利用系统运行机制;针对不同情景、不同目标、不同主体,运用情景模拟法、多目标优化法、综合调控平衡法探究耕地利用调控策略。
Theoretical explanation and research framework of cultivated land use system
DOI:10.18306/dlkxjz.2022.07.012
[本文引用: 1]
Cultivated land use system has a great impact on global change and human well-being. This study used the theories and methods of system science to explore the concept, composition, operation, functions, and characteristics of cultivated land use system and constructed the research framework of cultivated land use system, in order to promote the deepening of land system research and solve various problems. The main conclusions are as follows: 1) Cultivated land use system is a compound natural-human system in which agricultural producers and operators invest an appropriate amount of production factors in a certain amount and quality of cultivated land to plant crops, and obtain agricultural products and corresponding benefits. Cultivated land use system consists of cultivated land subsystem, economic subsystem, and social subsystem. It has explicit and implicit structures. 2) The operation and evolution of cultivated land use system is the result of natural ecological processes, economic development processes, and social evolution processes. It also has compound, open, resilient, and multi-level characteristics. 3) The study of cultivated land use system should follow the theoretical framework of element-structure-function-mechanism-regulation. This study revealed the action mechanism of different elements from the composition and influence relationship of various elements; analyzed the structure and transformation of cultivated land use from two aspects of explicit and implicit structure; revealed the impact of functions on structure from three aspects of economic, social, and ecological functions; analyzed the operation mechanism of cultivated land use system from the adaptation and adjustment mechanism of the system to the changes of external environment, the interaction and competition substitution mechanism of system elements, the information transmission mechanism of system operation, the coordination and organization operation mechanism of cultivated land use subjects at different levels, and the emergence mechanism of cultivated land use functions; and used scenario simulation method, multi-objective optimization method, and comprehensive regulation balance method to explore regulation strategies of cultivated land use.
中国农村居民点整理潜力研究综述
[J].
Research on land consolidation potential of rural habitat in China: Review and preview
集成“质量—格局—功能”的中国耕地整治潜力综合分区
[J].
Comprehensive zoning of cultivated land consolidation potential integrating "quality-pattern-function" in China
基于“强度—潜力—难度”综合测度的中国农用地整治实施协调性分析
[J].
DOI:10.11821/dlyj201602007
[本文引用: 1]
农用地整治实施协调性分析可为土地整治的宏观决策与绩效评价提供参考。基于整治强度、整治潜力和整治难度等土地整治实施的核心指标,借助力学平衡模型和地理空间统计分析,综合评判2006-2012年中国农用地整治的实施协调性。结果表明:研究期间中国农用地整治协调度F<sub>合</sub>均值为1.33,核心要素的实施匹配总体上处于拮抗状态,各实施协调度类型在数量占比上无明显差别,实施重点尚不突出;实施偏度θ以过渡型象限(II、V)居多,在协同特征上总体表现为区域农用地整治的强度和潜力间的不匹配;在空间格局上,实施协调度呈显著集聚和空间正相关性,农用地整治实施亟待优化的6类问题区域主要集中在陕甘宁、川渝等西北地区以及长三角、珠三角等地。
The coordination of farmland consolidation implementation in China by comprehensive measure of "intensity, potential and difficulty"
DOI:10.11821/dlyj201602007
[本文引用: 1]
Analyzing implementing coordination and its spatial pattern of farmland consolidation in China synthetically is of great theoretical and practical value for improving land consolidation scientific decision-making. Based on the data acquired from the dataset of consolidation project management during 2006-2012, this paper analyzes the implementation status of farmland consolidation at county level by three core indices i.e., the intensity, the potential and the difficulty of farmland consolidation. Then mechanical balance model is used to build a comprehensive method for evaluating implementation coordination of farmland consolidation in China. Finally combined with the geographical spatial statistical methods, we make a quantitative analysis macroscopically on the implementation coordination of farmland consolidation in China during 2006-2012. The conclusions can be summarized as follows: (1) regions with high consolidation intensity are some traditional agricultural areas in China, high consolidation potential mainly located in semi-humid and semi-arid region, and high consolidation difficulty distributed in complex terrain region or eastern developed areas; (2) the national average of coordination variable Ftotal is 1.33, and all coordination categories have no significant difference on quantity proportion, which indicates the general coordination of farmland consolidation is in the antagonism states and its implementation is still not prominent. Implementation skewness θ is distributed in the I~VI quadrants, in the majority with transitional quadrants (II and V), and collaborative characteristic overall performance for mismatching among the intensity and potential of regional consolidation; (3) coordination variable is significant agglomeration and spatial correlation nationwide. Coupling coordination variable Ftotal and implementation skewness θ, we identify 6 categories of problem areas mainly located in northwest China, Yangtze River Delta and Pearl River Delta, where implementation status of farmland consolidation is urgent to be optimized. Aiming at the existing problem of farmland consolidation implementation, our findings suggest that differential consolidation strategy and mechanism innovation according to planning requirements should be made to further optimize the project schedule, also in view of regional natural resource conditions and socio-economic status.
基于资源环境承载力的农业生产空间评价与布局优化: 以福建省为例
[J].
DOI:10.13249/j.cnki.sgs.2021.02.011
[本文引用: 1]
基于资源环境承载力的农业生产空间评价是新时期国土空间规划中农业空间优化调整的前提,是科学划定农业空间和永久基本农田的必要依据,对保障国家粮食安全和生态安全具有重要意义。构建基于资源环境承载力的农业生产空间评价指标体系,提出资源环境承载力集成方法和农业生产适宜性评价模型,并以福建省为案例开展应用研究。研究表明:农业生产功能指向的资源环境承载力评价包括土地资源类、水资源类、环境类、自然灾害类4种属性的自然要素,依次采用耕种条件、供水条件、环境条件、气象灾害危险性等指标刻画;农业生产适宜性则在承载力分级结果基础上,纳入空间形态类、区位条件类、生产条件类指标,建立适宜性评价模型进行评价;福建省资源环境承载力的高、较高、中等、较低以及低等级比重依次为29.86%、16.27%、12.04%、18.91%和22.91%,高和较高等级区分布于滨海平原、台地及低丘缓坡以及内陆地区的河谷、盆地及山间缓坡区域,全省农业生产适宜区、一般适宜区和不适宜区的比重依次为36.36%、26.76%和36.88%,适宜区具备从事农业生产活动的资源环境综合条件、且田块完整性和耕种便利性优良。案例应用表明,基于资源环境承载力的农业生产空间评价流程可操作性强,可满足农业空间备选区试划需求,已在国土空间规划“双评价”中得到应用;根据承载力与适宜性的“双评价”结果,可按照保留型、整治型和退出型,分类实施农业生产空间优化与整治。
Evaluation on agricultural production space and layout optimization based on resources and environmental carrying capacity: A case study of Fujian Province
DOI:10.13249/j.cnki.sgs.2021.02.011
[本文引用: 1]
The evaluation on agricultural production space based on resources and environmental carrying capacity is a necessary basis for scientifically delineating agricultural space and permanent basic farmland, which of great significance for national food security and ecological security. In this regard, this article puts forward an efficient and reliable method for delineating agricultural space and assessing the production capacity, which integrates the technical frame of resources and environmental carrying capacity evaluation with the model of suitability assessment for agricultural production, taking Fujian Province as a case study. The results indicate that: 1) the evaluation method should include four crucial elements: land resources, water resources, environment, and natural disasters, which are respectively indicated by cultivation condition, water supply condition, environmental condition, meteorological hazards. 2) Based on the results of carrying capacity grading, suitability for agricultural production needs to consider the spatial form, location conditions, and production conditions. 3) The proportion of spaces with high, sub-high, medium, sub-low, and low grades of resources and environmental carrying capacity in Fujian are 29.9%, 16.3%, 12.0%, 18.9% and 22.9%, respectively. The spaces with high and sub-high grade are distributed in coastal plains, terraces, and gentle hillside, as well as valleys and basins in inland areas. 4) The proportion of agricultural production suitable zone, general suitable zone and unsuitable zone are 36.4%, 26.8%, and 36.9%, respectively. The suitable zone has comprehensive resources and environmental conditions for agricultural production activities, with excellent structural integrity and cultivation convenience. 5) As suggested by this study, the method of delineating agricultural production space based on resources and environmental carrying capacity evaluation, can meet the needs of agricultural production space zoning and planning, which has been applied in the national territorial spatial planning. According to the results of the “double evaluations” on carrying capacity and suitability, the layout optimization and land consolidation of agricultural production can be implemented, targeting at types of reserved type, remediation type, withdrawal type, etc.
基于“三类”空间的后备可利用土地资源评价研究: 以山西省介休市为例
[J].
DOI:10.18306/dlkxjz.2021.02.008
[本文引用: 1]
针对当前国土空间规划“双评价”中存在的后备适宜建设用地与后备适宜耕地在城镇、农业空间分布上的重叠性问题,论文在对2类用地进行概念内涵辨析的基础上,尝试构建后备可利用土地资源集成评价方法,探讨不同类型后备可利用土地资源用途的地域导向,并选取山西省介休市作为案例区进行实证应用研究。结果表明:介休市后备适宜建设用地面积较大(45.3 km <sup>2</sup>),但集中连片趋势不明显。人均后备适宜建设用地面积为0.16亩/人。区域后备适宜耕地面积74.1 km <sup>2</sup>,人均后备适宜耕地面积为0.26亩/人。研究区域2类用地具有相似的空间分布格局,即绵山镇、连福镇等地区后备可利用土地资源潜力较大,而城区及周围地区的潜力较小。针对2类用地的重叠性和差异性,介休市城区、各乡镇中心及北部地区的后备可利用土地资源未来可转化建设用地,即未来应被划归城镇空间。连福、绵山、义棠、张兰等乡镇南部地区未来可转化为新增耕地,即应被划归农业空间。
Evaluation of reserve available land resources based on three types of territorial space: A case study of Jiexiu City in Shanxi Province
DOI:10.18306/dlkxjz.2021.02.008
[本文引用: 1]
The spatial distribution of reserve available construction land overlaps with that of reserve available cultivated land in the resources and environmental carrying capacity and territorial development suitability evaluations of current territorial spatial planning. On the basis of elaborating the connotation of relevant concept, this study developed an integrated evaluation method of reserve available land resources, discussed the regional tendency of use of these two types of land, and took Jiexiu City in Shanxi Province as an example. The results are as follows: 1) Reserve available construction land in Jiexiu City had an area of 45.3 km 2, which was 6.1% of the total land area of the city. Its distribution was scattered. The reserve available construction land could be generally divided into three levels: highly suitable, suitable, and less suitable. The corresponding areas were 3.6 km 2, 16.1 km 2, and 25.6 km 2 respectively. The area of reserve available construction land per capita was 0.16 mu. 2) The area of the reserve available cultivated land was 74.1 km 2, which was 10% of the total. The reserve available cultivated land also could be divided into three levels: highly suitable, suitable, and less suitable. The corresponding areas were 21.7 km 2, 26.1 km 2, and 26.3 km 2respectively. The area of reserve available cultivated land per capita was 0.26 mu. There were similar spatial distributions between these two types of land in the study area. The potential of reserve available land resources in Mianshan and Lianfu towns was large, while the potential of the urban area and its surroundings was small. In view of the overlap and difference of spatial distribution between these two types of land, reserve available land resources in the urban area, town centers, and the northern part of the city could be used as construction land preferentially in the future. They should be classified as urban space. Reserve available land resources in the southern areas of Lianfu, Mianshan, Yitang, and Zhanglan towns could be transformed into new cultivated land. They should be classified as agricultural space.
市域国土空间格局多维度分解与传导路径
[J].
DOI:10.31497/zrzyxb.20221104
[本文引用: 2]
国土空间格局对协调区域保护与开发具有重要保障作用,其基本前提在于厘清国土空间格局内涵并构建科学有效的传导路径。由此提出国土空间格局多维度分解与传导路径研究框架,围绕生态保护、农业生产和城镇建设三个方面开展适宜性评价,基于国土空间潜在冲突识别与调解机制实现国土空间重构,运用区位熵识别优势功能分区,进而构建战略格局,并以东营市为例开展案例研究。研究发现:东营市国土空间适宜性表现为“生态保护重要、农业生产和城镇建设适宜”,潜在冲突以中度为主;国土空间重构包括农业空间、生态空间和城镇空间,地理单元的空间分异和行政单元的面积占比差别明显;优势功能分区包含重要生态功能区、农产品生产区、城市化发展区和弹性发展区,提供了分区分类的差别化管控策略;国土空间保护与开发战略格局包括“一心一屏一廊”的生态保护格局、“一圈两区”的开发利用格局和“两带”的弹性发展格局,树立了可持续国土空间利用的目标引领。研究结果可为新时期国土空间规划编制与实施以及协调区域国土资源有效配置提供有益借鉴。
Research on multi-dimensional decomposition and conduction path of territory spatial pattern at the municipal level
DOI:10.31497/zrzyxb.20221104
[本文引用: 2]
Territory spatial pattern plays an important role in coordinating regional protection and development. Its basic premise is to clarify the connotation of territory spatial pattern and build a scientific and effective conduction path of territory spatial pattern. Based on the logic lines of "raster-land category-administrative region-whole area" and "suitability evaluation-territory spatial reconstruction-dominant function identification-regional consistency abstraction", this study develops a research framework for territory spatial pattern scale decomposition and conduction path. Firstly, the suitability of territorial space is assessed in terms of three aspects: ecological protection, agricultural production, and urban construction, with the type, intensity, and spatial pattern of territory spatial potential conflict identified using a model for identifying territory spatial potential conflict. Secondly, the "rigid constraint" and "elastic guidance" planning mechanisms are applied to mediate potential conflicts in territorial space and reconstruct the territorial spatial pattern. Finally, the location entropy model is utilized to determine the dominant function of territorial space and to establish a strategic plan for territory spatial development. Dongying city is used as an example in this research to conduct an empirical study. The results show that: (1) The territory spatial suitability of Dongying is crucial for ecological protection, suitable for agricultural production and urban construction, and the potential conflicts of territorial space are mainly moderate. (2) Ecological space, agricultural space, and urban space are all part of the territory spatial reconstruction. From coastline and coastal areas to inland regions, the boundary between protection and development in geographical units is 19.69 km and 1.6 km, respectively. The proportions of territory spatial reconstruction patterns, on the other hand, vary substantially between counties (cities and districts). (3) Dominant function zones include important ecological function zones, agricultural production zones, urbanization development zones and elastic development zones that provide differentiated control strategies for zoning classification. (4) The ecological protection pattern of "one heart, one screen, and one corridor", the development and utilization pattern of "one circle and two districts," and the flexible development pattern of "two belts" comprise the strategic pattern of territory spatial protection and development, which establishes the goal of sustainable territory spatial utilization. The findings of this study can be used as a guide for developing territory spatial planning and coordinating the effective allocation of regional territory and resources in the New Era.
矿区耕地整治潜力评价与整治分区
[J].
Farmland consolidation potential evaluation and consolidation zoning in mining areas
农村居民点整理潜力综合修正与测算: 以北京市平谷区为例
[J].
DOI:10.11821/xb201204006
[本文引用: 1]
准确测算农村居民点整理增加耕地潜力是科学编制农村土地整治规划的重要前提.本研究针对当前普遍使用的人均建设用地标准法存在计算简单、测算结果偏离实际等问题,以北京市平谷区为例,统筹考虑农村居民点整理的自然适宜性、生态安全性、经济可行性、社会可接受性和规划导向性5 个方面的因素,建立了潜力逐级修正的测算模型.测算模型的相关修正系数利用农用地分等方法、生态用地一票否决制、经济社会指标评价以及概念赋值等方法设定.研究表明,平谷区各乡镇自然适宜性修正系数为0.4757~0.8628,生态安全性修正系数为0.3004~0.8852,经济可行性修正系数为0.3943~0.8939,社会可接受性修正系数为0.4643~0.8165,规划导向性修正系数为0.2877~0.8858,生态安全性和规划导向性因素对农村居民点整理潜力影响的区域差异较其他3 个方面更加显著;潜力经过综合修正后,平谷区农村居民点整理可净增加耕地面积为614.13 hm2,增加耕地系数为10.77%.
Integrated correction and calculation of rural residential consolidation potential: A case study of Pinggu District
