

自2009年《规划》批复以来,对辽宁沿海经济带相关研究和探讨成为学界和业界热点话题。早期研究主要集中在:与东北腹地互动发展[3⇓-5]、滨海旅游[6⇓-8]、港口发展[9-10]、产业结构[11⇓-13]、环境发展[14-15]、滨海湿地资源与水资源[16⇓-18]、城市与资源环境[19]、城市与土地资源利用[20]等方面研究。针对辽宁沿海经济带经济与环境之间发展关系研究居多,高质量发展研究尚处于起步阶段。如关伟等[21]构建辽宁沿海经济带经济与环境协调发展指标体系,进行了协调发展度测算及时空演变分析;张建新[22]从产业、制度、区域及敏感点等不同互动角度,提出适应辽宁沿海地区经济发展与生态环境的良性互动模式,为其生态环境和经济协调发展提供参考;高云鹏等[23]通过灰色预测模型对辽宁沿海经济带经济与环境协调发展态势进行了预测;盖美等[24⇓⇓⇓-28]则从不同的视角对辽宁沿海经济带经济与生态环境、海洋环境、用水效率等关系和海陆经济效率与协调性展开了大量研究。关于辽宁沿海经济带经济系统内部联系的研究不足。仅有潘中艺[29]、刘丹丹等[30]少数学者通过构建城市间经济联系模型,对辽宁沿海经济带城市间经济联系强度进行实证分析以及对辽宁沿海县域经济发展差异的时空变化特征和趋势进行分析。研究城市引力范围及时空演变状况,可以有效发挥城市不同的作用[31],有利于城市及区域合理规划布局,对促进区域经济协调发展有着重要的现实意义[32]。学者们通过改进的引力模型对城市间的相互影响关系及程度进行了探讨[33-34],对辽宁沿海经济带城市间的高质量发展联系研究则相对不足。同时,经济辐射效应是高质量发展的重要内容,已有研究采用威尔逊模型对城市空间影响范围进行了实证分析[35-36]。
综上所述,围绕辽宁沿海经济带的研究已开展多方面有益探索,但仍有如下拓展空间:第一,学者多基于单一领域对辽宁沿海经济带发展现状进行研究,缺乏全面刻画高质量发展水平的优化指标,导致高质量发展水平的综合评价有待改进提升。第二,随着城市的发展,传统引力模型已不能全面反映城市的综合发展,城市空间结构研究方法有进一步改进空间。第三,关于区域辐射效应的研究大多探讨的是经济辐射效应与金融辐射效应,关于高质量发展的辐射效应测度研究较少,无法综合反映中心城市与其他城市空间格局。基于此,本文根据辽宁沿海经济带高质量发展内涵和实际需求,全方位、多维度构建综合评价指标体系,测度2006—2020年辽宁沿海经济带高质量发展状况;采用熵权TOPSIS模型测算辽宁沿海经济带高质量发展水平;从空间关联视角对城市高质量、经济距离等多个方面对传统引力模型进行改进,识别辽宁沿海经济带高质量发展的空间关联及格局;运用威尔逊模型测度辽宁沿海经济带中心和周围城市的高质量辐射力及辐射范围,以期为促进辽宁沿海经济带高质量发展、探索提升路径和缩小区域差异提供一定的理论和实践参考。
1 理论基础与评价指标体系
1.1 辽宁沿海经济带高质量发展理论基础
1.1.1 高质量发展理论梳理
1978年改革开放以来,中国经济持续多年高速增长并取得了辉煌的成就,同时受内部下行压力和外部环境复杂的双向影响,面临经济发展模式动力不足、可持续发展潜力未完全释放等问题[37]。党的十九大明确提出中国经济已由高速增长阶段转向高质量发展阶段;党的十九届五中全会提出以推动高质量发展为主题;党的二十大明确实现高质量发展是中国式现代化的本质要求,说明推动高质量发展已成为中国保持经济持续健康发展的必然要求,具有理论科学与政策科学的双重价值[38]。国内外学者对高质量发展相关主题研究成果丰富。研究早期主要关注经济增长的速度与数量问题[36],随着中国经济增速放缓且转型加速,研究多关注经济增长的效率和质量问题[39-40]。由于全要素生产率是判断经济增长质量的重要指标,高质量发展研究也通过全要素生产率对经济增长的质量和发展效率进行衡量[41]。高质量发展评价指标体系构建是指导区域高质量发展的重要标准,所以科学合理的构建评价指标体系也是学术界重点关注问题。魏敏等[42]基于新时代经济社会主要矛盾,从经济结构、创新驱动、资源配置、市场机制、经济增长、区域协调、产品服务、基础设施、生态文明、成果惠民等方面构建综合指标体系测度中国经济高质量发展水平。钞小静等[43]基于经济增长质量的内涵,构建了综合指标体系测度中国经济增长质量水平。“高质量发展”概念内涵、影响因素、转型路径等内容也得到广泛探讨。赵剑波等[44]从宏观经济、产业、企业3个维度对高质量发展的内涵展开分析;余泳泽等[45]在梳理经济高质量发展内涵基础上,总结了中国经济高质量发展的现实与困境,提出创新驱动、市场化改革、对外开放和提高人民生活质量等一系列发展路径。高质量发展评价对象主要包括宏观、中观和微观3个层面,宏观区域涉及最多,主要为特定区域[46]、流域[47]、城市群[48]、省域[49]和城市[50]。
1.1.2 辽宁沿海经济带高质量发展的内涵
图1
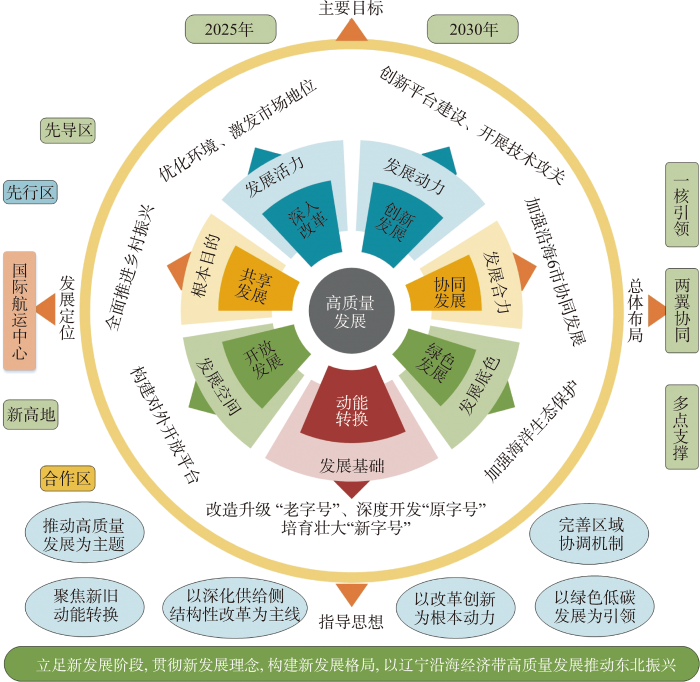
图1
辽宁沿海经济带高质量发展的内涵框架
Fig.1
A framework of the connotation of high-quality development in the Liaoning coastal economic belt
(1) 坚持创新发展,增强高质量发展动力。完善创新投入机制,有利于辽宁沿海经济带各市提升自主创新能力,通过构建技术创新体系促进产业升级;推动国家自主创新示范区等重大科技创新平台建设,营造良好的创新环境;集中优势科研力量突破关键领域核心技术,提高创新效率;创新产出与成果转化效率可带来新经济增长点,为高质量发展提供新动力。
(2) 推进协调发展,凝聚高质量发展合力。高质量发展中的协调发展是经济社会持续健康发展的内在要求,协调发展要统筹城乡、区域、产业等方面,推进经济带经济、政治、文化建设的各个环节协调,推动辽宁沿海经济带协同发展,提升合作效能。
(3) 推动绿色发展,绘就高质量发展底色。加强生态文明建设,深入打好污染防治攻坚战,持续改善沿海生态环境,是辽宁沿海经济带高质量发展的底色。污染物排放和能源消耗造成的环境污染严重,加快发展大气、水污染处理等环保装备产业;加强固体废弃物综合利用,才能持续改善辽宁沿海经济带环境质量。
(4) 加快动能转换,夯实高质量发展基础。辽宁沿海经济带经济发展的高质量不应只体现在经济发展速度提升,更要注重经济发展质量和效益。把实体经济作为经济发展的着力点,遏制高污染高排放项目盲目发展,实施高端化改造;推进资源型产业向产业链价值链中高端发展,推动产业转型升级,加快发展高品质、高附加值产品,提高资本生产率。
(5) 坚持全面深化改革,释放高质量发展活力。发挥市场在资源配置中的决定性作用,推动市场和政府更好结合。鼓励驻辽宁沿海经济带中央企业发挥产业创新转型的引领作用,提高产业本地配套率;加大对高技术产业投资力度,培育新业态,促进高质量发展目标实现。
(6) 加快开放发展,拓展高质量发展空间。充分发挥辽宁沿海经济带沿海沿边区位优势,完善开发开放平台功能,促进区域合作,提升对外开放水平。积极推动辽宁省内“一带一路”综合试验区建设,支持行业龙头企业加强对外合作,持续提升对外开放水平。
(7) 促进共享发展,实现高质量发展根本目的。将满足人民需要作为推动辽宁沿海经济带高质量发展根本目的,补齐民生领域短板,统筹城乡融合发展,增强人民的获得感、幸福感和安全感。创造优质的福利水平、完善基础设施建设,为高质量发展提供重要保障。
1.2 评价指标体系
现有的高质量发展评价,主要围绕创新、协调、绿色、开放、共享5个方面构建指标体系[46]。所谓“高质量发展”理念,高质量发展是在经济、社会、生态等领域均实现更高质量的发展,中国经济正处在转换增长动能、深化改革的关键时期,建设现代化经济体系是夯实高质量发展基础和释放高质量发展活力的重要任务[42]。动能转换是中国经济深化改革转型升级的内在动力与实质要求,从高速增长转向高质量发展是中国经济转型的目标与外在表现,这二者是同步进行、相互促进的[51]。“坚持深化改革开放”等表述已被写入党的二十大报告。推动高质量发展必须坚定不移深化改革开放、深入转变发展方式,以效率变革、动力变革促进质量变革,加快形成可持续的高质量发展体制机制[52]。新旧动能转换和全面深化改革已经成为中国经济高质量发展的现实要求和未来趋势。基于此,本文根据已有高质量发展指标体系[53]、欧盟可持续发展指标体系[54]、区域经济高质量发展研究报告[55]等国内外经典评价指标,从7个维度构建辽宁沿海经济带高质量发展指标体系(表1)。
表1 高质量发展的评价指标体系
Tab.1
| 一级指标 | 二级指标 | 三级指标 | 具体测算指标 | 属性 | 权重 |
|---|---|---|---|---|---|
| 创新发展 | 创新投入 | R&D经费投入强度 | R&D经费支出/GDP | + | 0.013 |
| R&D人员投入强度 | R&D人员数/全部从业人员数量 | + | 0.016 | ||
| 创新产出 | 人均专利占有量 | 发明专利数/总人口 | + | 0.024 | |
| 创新技术成交度 | 技术市场成交额/GDP | + | 0.022 | ||
| 创新效率 | 绿色全要素生产率 | 绿色全要素生产率(SBM模型方法测算) | + | 0.021 | |
| 劳动生产率 | GDP/全部从业人员数量 | + | 0.022 | ||
| 创新贡献 | 创新产品增利度 | 创新产品销售收入/工业企业主营业务收入 | + | 0.019 | |
| 高新技术创收度 | 高技术产业销售收入/GDP | + | 0.015 | ||
| 协调发展 | 城乡协调 | 城乡收入协调水平 | 城镇与农村居民可支配收入之比 | - | 0.017 |
| 城乡消费协调水平 | 城镇居民消费水平/农村居民消费水平 | - | 0.022 | ||
| 产业协调 | 第二产业比较劳动生产率 | 第二产业产值/第二产业劳动力数 | + | 0.022 | |
| 第三产业比较劳动生产率 | 第三产业产值/第三产业劳动力数 | + | 0.028 | ||
| 区域协调 | 人均GDP泰尔指数 | 人均GDP/泰尔指数 | + | 0.045 | |
| 区域发展差异系数 | 构建综合指标熵值法计算 | + | 0.028 | ||
| 港口协调 | 港口城市协调发展度 | 构建港口城市综合指标熵值法计算 | + | 0.017 | |
| 港口产业协调发展度 | 构建港口产业综合指标熵值法计算 | + | 0.017 | ||
| 绿色发展 | 资源消耗 | 单位GDP能源消耗量 | 能源消耗总量/GDP | - | 0.020 |
| 单位GDP电耗 | 电力消耗总量/GDP | - | 0.021 | ||
| 绿色建设 | 建成区绿化覆盖率 | 城市统计年鉴统计整理 | + | 0.011 | |
| 城市人均公园绿地面积 | 城市统计年鉴统计整理 | + | 0.020 | ||
| 生态治理 | 固体废物综合利用率 | 城市统计年鉴统计整理 | + | 0.016 | |
| 生活垃圾无害化处理率 | 无害化处理生活垃圾数量/生活垃圾总量 | + | 0.028 | ||
| 污染排放 | 单位GDP废气排放量 | 二氧化硫排放量/GDP | - | 0.016 | |
| 单位GDP废水排放量 | 废水排放总量/GDP | - | 0.020 | ||
| 单位产出废物排放量 | 一般工业固定废物产生量/GDP | - | 0.013 | ||
| 动能转换 | 结构转型 | 数字经济发展指数 | 构建数字经济综合指标计算 | + | 0.015 |
| 高新技术产值占比 | 高新技术产值/GDP | + | 0.013 | ||
| 方式转变 | 单位GDP能耗下降率 | [(本年单位GDP能耗/上年单位GDP能耗)-1]×100% | + | 0.014 | |
| 资本生产率 | GDP/全社会固定资产投资额 | + | 0.014 | ||
| 产业升级 | 产业结构合理化 | 泰尔指数的倒数 | + | 0.029 | |
| 产业结构高级化 | 第三与第二产业产值比值 | + | 0.023 | ||
| 深化改革 | 体制转轨 | 政府财政比重 | 政府财政支出占总支出比重 | + | 0.020 |
| 市场化程度 | 市场对供求变化敏感程度 | + | 0.018 | ||
| 动力转向 | 万人发明专利授权量 | 万人发明专利授权量 | + | 0.018 | |
| 财政科学技术支出占比 | 财政科学技术支出/当年国家财政支出 | + | 0.023 | ||
| 开放发展 | 开放水平 | 外资依存度 | 利用外商投资总额/GDP | + | 0.019 |
| 外贸依存度 | 进出口总额/GDP | + | 0.030 | ||
| 开放稳定 | CPI波动率 | 居民消费价格指数 | - | 0.021 | |
| PPI波动率 | 生产者物价指数 | - | 0.012 | ||
| 开放效果 | 高技术产品出口贸易总额占比 | 高技术产品出口贸易总额/GDP | + | 0.023 | |
| 对外合作完成营业额占比 | 对外合作完成营业额/GDP | + | 0.018 | ||
| 共享发展 | 福利水平 | 医疗卫生投入比重 | 医疗卫生支出/总人口 | + | 0.019 |
| 高等教育在学比重 | 高等教育在学人数/总人口 | + | 0.014 | ||
| 福利分配 | 劳动者平均报酬 | 劳动者平均报酬 | + | 0.027 | |
| 城镇基本医疗保险参保人数 | 城镇基本医疗保险参保人数 | + | 0.017 | ||
| 基础设施 | 交通设施完善度 | 每万人拥有公交车辆 | + | 0.020 | |
| 文化设施完善度 | 公共图书馆藏量/总人口 | + | 0.023 | ||
| 网络设施完善度 | 人均互联网宽带接入端口数 | + | 0.017 | ||
| 人民生活 | 人均可支配收入 | 居民人均可支配收入 | + | 0.018 | |
| 人均消费支出 | 居民人均消费支出 | + | 0.018 |
2 研究方法与数据来源
2.1 研究区域
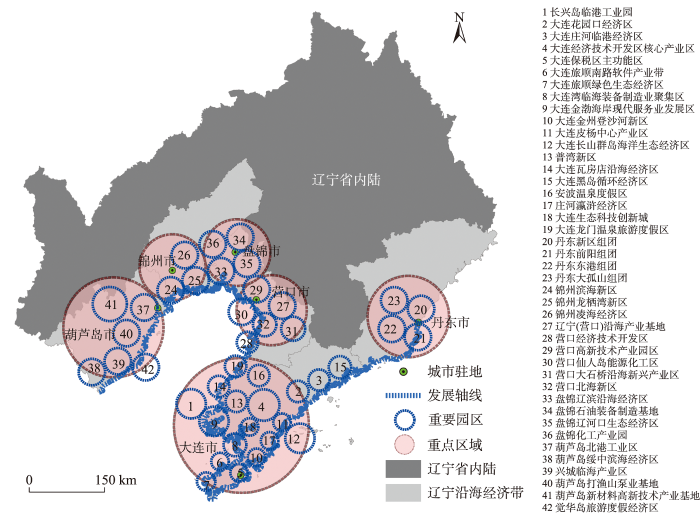
辽宁沿海经济带位于中国环渤海地区和东北地区的重要结合部,由大连、丹东、锦州、营口、盘锦和葫芦岛6个沿海城市所辖行政区域组成[56](图2)。辽宁沿海经济带陆域面积5.65万km2,占全省38%;海域面积6.8万km2,区位优势明显,资源禀赋优良。地理位置优越,地处环渤海经济带和东北亚经济圈,交通畅达,是连接京津唐和东北的咽喉要道,是东北地区唯一的出海口[5]。2020年,沿海6市地区生产总值达到1.2万亿元,占全省48.9%;实现进出口总额705.3亿美元,占全省74.7%;沿海6个港口实现货物吞吐量8.2亿t,集装箱吞吐量1311万标箱,分别占全国5.6%、5.0%[9-10]。2009年辽宁沿海经济带建设上升为国家战略,经过10多年发展,辽宁沿海经济带在产业转型升级、体制创新、开放合作、基础设施建设等方面取得了重要进展和积极成效,经济社会发展迈上新台阶,为高质量发展奠定了良好基础。当前辽宁沿海经济带内部城市发展并不均衡,在经济、产业、环境等方面都存在较大差异,突出表现在产业结构高度雷同、港口城市发展缺乏统一性、现代产业体系不完善、核心城市辐射能力不足等方面[4]。
图2
2.2 研究方法
2.2.1 熵权TOPSIS法
为避免主观因素导致的误差,综合评价区域经济高质量发展,首先利用熵值法对观测数据中包含的信息与变异程度测度,初步确定权重,在此基础上采用TOPSIS法对辽宁沿海经济带高质量发展水平与理想目标的相似程度进行比较与排序 [57]。针对辽宁沿海经济带高质量发展横向比较及评价,熵权TOPSIS法能够客观反映当前辽宁沿海经济带高质量发展水平,因此,选取熵权TOPSIS法来对各指标进行综合评价,测度2006—2020年辽宁沿海经济带高质量发展水平。
2.2.2 改进的引力模型
为准确反映辽宁沿海经济带高质量发展空间联系结构,从以下两个方面修正引力模型:① 引入反映辽宁沿海经济带高质量发展的指数;② 考虑到现实中城市间高质量发展空间联系水平不对等,因此采用高质量发展指数比重来修正经验常数k; ③ 传统的空间距离无法准确反映城市间的相互作用,综合考虑城市间往返的时间成本和货币成本,衡量城市间的经济距离[35]。修正的引力模型如下:
式中:
2.2.3 威尔逊模型
利用简化版的威尔逊模型来进行辽宁沿海经济带核心城市高质量发展辐射效应评价。具体模型为:
式中:
2.3 数据来源
本文数据主要来源于《中国城市统计年鉴》《辽宁省统计年鉴》、各城市统计年鉴、国民统计经济与社会发展统计公报以及国家统计局官方网站。对于缺失的数据采用插值法补齐。绿色全要素生产率基于SBM模型测算得到,劳动生产率、比较劳动生产率、人均GDP泰尔指数、区域发展差异系数、港口城市协调发展度、港口产业协调发展度、数字经济发展指数、产业结构合理化和产业结构高级化等指标采用加权综合评价法将定量指标进行加权求和。
3 实证结果与分析
3.1 辽宁沿海经济带高质量发展综合水平
3.1.1 时序演变特征
运用熵权TOPSIS法计算得到2006—2020辽宁沿海经济带6市高质量发展水平(图3)。总体而言,2006—2020年辽宁沿海经济带高质量发展水平呈现波动上升趋势。研究期间,高质量发展指数具有阶段性特征,2006—2010年为缓慢增长阶段,平均综合水平变动幅度较小,呈稳步增长趋势。2011—2015年为波动增长阶段,该时期主要受国家发展政策和规划影响,以及辽宁沿海经济带建设上升为国家战略后所带来的发展红利,各市转变传统发展模式,新旧动能转换效应显现,显著带动高质量发展水平提升。2016—2020年为稳步增长阶段,辽宁省经济增长乏力,地区生产总值在全国排名较低,2018年后略有上升,使得辽宁沿海经济带高质量发展指数增速趋于平稳。分城市看,高质量发展指数存在明显的差异,其中大连市远高于其他城市,处于领先位置;丹东、营口、盘锦市高质量发展指数总体水平较高,提升幅度较其他城市较大,但与大连有一定差距;葫芦岛、锦州市高质量发展指数较低,波动起伏较大,高质量发展水平有待进一步提升。
图3
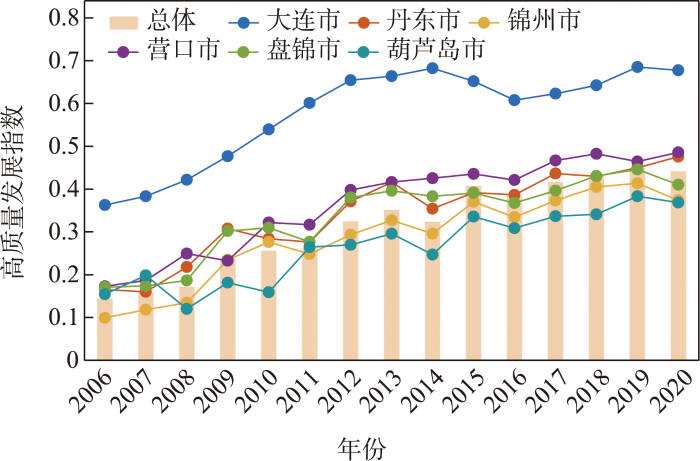
图3
2006—2020年辽宁沿海经济带高质量发展水平
Fig.3
High-quality development level of the Liaoning coastal economic belt during 2006-2020
3.1.2 空间演变特征
为进一步分析辽宁沿海经济带高质量发展的空间分布特点,将6市的高质量发展水平分为高、中高、中等、中低和低5种水平类型(图4)。辽宁沿海经济带高质量发展水平具有阶段性和区域差异性特征,呈现“一核领先,两翼追赶”的空间分布格局。不同城市发展水平存在显著差异,具有“以大连为高地,黄海翼、渤海翼两大低谷连绵区”的空间分布特点。大连市高质量发展水平高于其他城市,其次位于黄海翼的丹东发展水平略高于渤海翼的锦州、葫芦岛、盘锦3市,与经济发展水平相似。总体看,辽宁沿海经济带高质量发展高水平城市少,中等水平及中高水平城市占较多数,需进一步协调推动。2006年大连市高质量发展领先于其他城市,属于中低水平,其他城市均属于低水平,由于大连的地理位置、开放水平、发展结构等方面要优于其他城市,但总体受经济发展水平影响,经济发展质量仍有待提升。2010年,受辽宁沿海经济带建设上升为国家发展战略的影响,沿海6市的经济发展模式调整,提高了整体高质量发展水平,使大连市变为中高水平,其他5市变为中低水平。2015—2020年辽宁沿海经济带高质量发展水平整体变化不大,大连一核引领,处于高水平阶段,两翼协同发展,较多处于中等水平。
图4
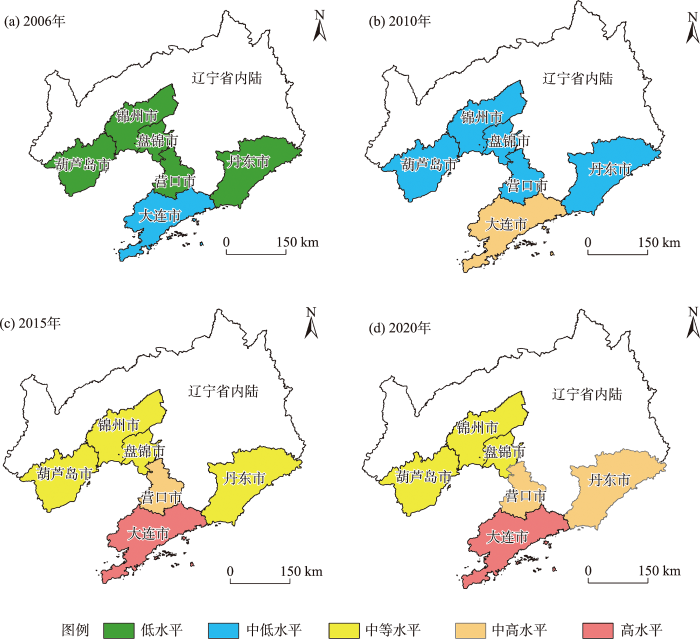
图4
辽宁沿海经济带高质量发展空间演变
Fig.4
Spatial evolution of high-quality development in the Liaoning coastal economic belt
3.2 辽宁沿海经济带高质量发展分维度水平分析
3.2.1 分维度时序演变特征
为总体考察辽宁沿海经济带高质量发展水平变化情况,测算并绘制2006—2020年分维度雷达图(图5)。可见,辽宁沿海经济带高质量发展各子系统水平波动变化,但整体上呈现上升趋势,反映各维度的高质量发展水平在研究期间不断提升,主要的动力来源于协调发展、深化改革和绿色发展,创新发展和共享发展上升最为明显。协调发展一直处于领先的地位。沿海6市推动一体化协调发展,积极吸取经验,高质量发展取得显著成效,港口的整合进一步提升高质量协调发展水平。深化改革和绿色发展处于良好上升趋势,并且2009年起发展较快,2015年起增速减缓。在2006—2015年期间,为应对全国发展大局势,沿海6市采取了一系列产业结构优化升级政策,持续推动绿色建设与生态环境治理,为深化改革和绿色发展的平稳开展奠定基础。动能转换和开放发展具有较大波动性;2006—2013年辽宁沿海经济带动能转换和开放发展指数不断上升,其原因可能是全国经济逐渐复苏,沿海6市积极调整政策,开放水平不断提高,开放较为稳定;2013—2020年则呈“V”型变动,2013—2017年和2017—2020年呈先下降再上升的变化形态,由于2013年后辽宁沿海经济增长乏力,动能转换不足、对外开放水平下降,导致其发展指数下降,2017年十九大报告深化改革加快东北等老工业基地振兴,动能转换和对外开放建设力度增强,发展水平持续向好。创新发展稳定增长,政府加大扶持力度,全面深化创新发展,释放科技发展活力。辽宁沿海经济带民生福利水平不断改善,沿海6市人均可支配收入和人均消费支出不断增加;交通设施完善度、文化设施完善度、网络设施完善度也不断提升。
图5
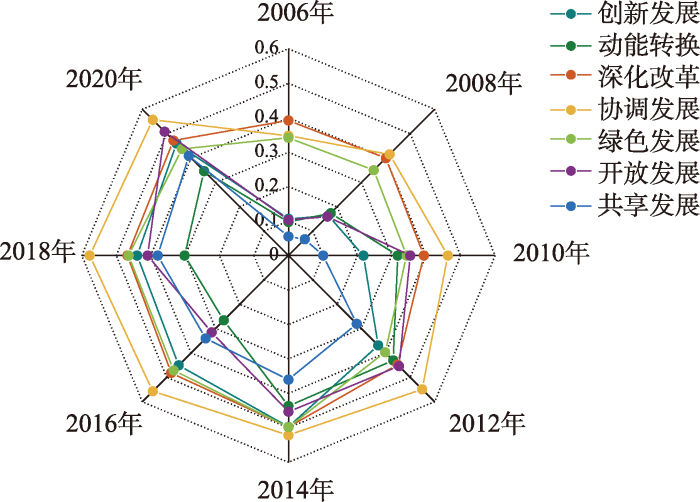
图5
辽宁沿海经济带高质量发展分维度时间演变
Fig.5
Temporal change of high-quality development in the Liaoning coastal economic belt
3.2.2 分维度空间演变特征
选取2006、2010、2015和2020年辽宁沿海经济带高质量发展分维度的评价结果,探究7大维度的空间演化特征(图6)。总体看,动能转换和共享发展呈大连一核引领的空间分异特征,绿色发展和协调发展呈渤海翼领先发展空间分异特征,开放发展和深化改革呈黄海翼领先发展空间分异特征。黄海翼的丹东市是辽宁沿海经济带最东端的起点,经济发展势头强劲。渤海翼的盘锦高质量发展动力来源于绿色低碳转型发展的实施,推进生态保护,为辽宁沿海经济带贡献绿色力量;葫芦岛市面对辽宁沿海经济带和辽西融入京津冀协同发展战略“双重发展”,进一步提高发展水平。大连市高质量发展动力主要来源于创新发展和动能转换水平的提高,大连市经济生产总值不断增长带动了人民的生活水平的提升。港口整合,使得港口功能明晰,进一步激发了港口发展潜力。大连市在创新发展、深化改革方面表现较稳定,对外开放与共享发展方面持续向好,但绿色和协调发展方面表现出回落态势,在绿色和协调发展方面有下降趋势。渤海翼地区在绿色发展方面表现较稳定,在创新发展、深化改革、协调发展方面持续改善,在共享发展方面表现低迷。黄海翼在绿色发展方面改善不明显,在创新发展、动能转换、深化改革及协调发展方面提升显著,发展潜力较大。
图6
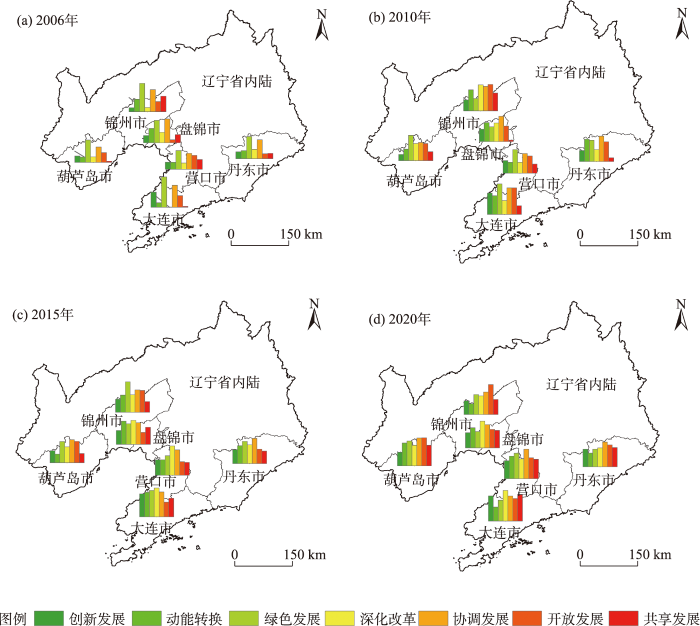
图6
辽宁沿海经济带高质量发展分维度空间演变
Fig.6
Spatial evolution of high-quality development dimensions in the Liaoning coastal economic belt
4 辽宁沿海经济带高质量发展空间联系及辐射效应
4.1 城市的空间联系强度
辽宁沿海经济带内区域高质量发展联系量差异较大,空间分布特征明显(表2)。① 以大连为“龙头”城市,高质量发展联系不均衡。大连市对其他城市的引力远远大于其他城市彼此间的引力,且大连市对其他城市隶属度远高于其他城市对大连的隶属度,表明大连在经济带中起着带动其他城市发展的作用;锦州、营口与盘锦市间的引力和隶属度较大。总体空间分布说明经济带内局部城市间的经济联系较大。由于大连市“一城独大”现象严重,各城市的经济发展严重依赖大连;空间距离远与交通不便导致城市间发展联系不足,经济带整体经济联系不够密切。② 丹东和葫芦岛市是两个重要的经济发展区域。大连市对葫芦岛、丹东市的隶属度和引力值相对较高,同时丹东市对大连市的引力值也最大,说明丹东市与大连市之间联系密切,是经济带内重要的发展区域。③ 营口和盘锦是两个重要“节点城市”。在大连、锦州和葫芦岛几个城市间,大连对葫芦岛市的引力大于大连对营口市的引力,而营口市对盘锦市的引力远大于大连对锦州的引力,表明在地理区位影响下,营口市不仅和大连市的联系量较大,同时与盘锦市的经济关联紧密。
表2 辽宁沿海经济带高质量发展空间联系
Tab.2
| 城市 | 指标 | 大连 | 丹东 | 葫芦岛 | 锦州 | 盘锦 | 营口 |
|---|---|---|---|---|---|---|---|
| 大连 | 引力值 | — | 60197.33 | 91814.42 | 63586.03 | 14.31 | 56603.87 |
| 隶属度 | — | 0.6126 | 0.3696 | 0.2024 | 0 | 0.1417 | |
| 丹东 | 引力值 | 85736.43 | — | 59.05 | 79.58 | 26871.20 | 6869.13 |
| 隶属度 | 0.1911 | — | 0.0002 | 0.0003 | 0.0414 | 0.0172 | |
| 葫芦岛 | 引力值 | 168757.49 | 76.21 | — | 13784.20 | 135650.23 | 27719.50 |
| 隶属度 | 0.3761 | 0.0008 | — | 0.0439 | 0.2089 | 0.0694 | |
| 锦州 | 引力值 | 115204.84 | 101.23 | 13587.46 | — | 243060.20 | 19600.04 |
| 隶属度 | 0.2568 | 0.0010 | 0.0547 | — | 0.3744 | 0.0491 | |
| 盘锦 | 引力值 | 23.63 | 31168.76 | 121923.96 | 221628.48 | — | 288637.22 |
| 隶属度 | 0.0001 | 0.3172 | 0.4908 | 0.7055 | — | 0.7226 | |
| 营口 | 引力值 | 78937.99 | 6725.95 | 21031.64 | 15086.48 | 243652.89 | — |
| 隶属度 | 0.1759 | 0.0684 | 0.0847 | 0.0480 | 0.3753 | — |
从高质量发展的空间联系网络结构看,2006—2020年网络密度和网络结构复杂程度逐年提高,空间联系强度等级也不断提高(图7)。受辽宁沿海经济带高质量发展政策的影响,国家及相关政府从多方面确立辽宁沿海经济带今后的发展方向,促进了各城市之间协调发展。2006年锦州、盘锦和营口市具有地域邻近性优势,空间联系等级相对其他城市较高。2010年受《规划》影响多方面取得重要进展和显著成效。2015—2020年与大连市空间联系强度最大的城市主要是丹东、葫芦岛市,表明影响最大的是核心城市附近城市,对边缘城市引力较弱。大连市对周边城市的引力最强;发展也会受到限制,导致城市综合发展水平相对滞后。为进一步提升城市空间联系强度等级,需创新辽宁沿海经济带、沈阳经济区、辽西北三大区域协调互动发展机制,加快大连东北亚国际航运中心建设。
图7
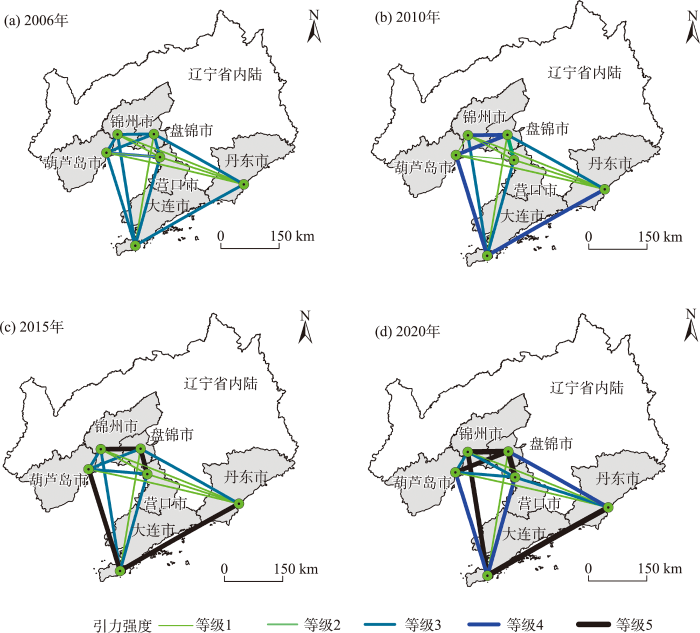
图7
辽宁沿海经济带高质量发展空间网络结构
Fig.7
Spatial network structure of high-quality development in the Liaoning coastal economic belt
4.2 城市的空间联系结构分析
表3 辽宁沿海经济带高质量发展联系特征
Tab.3
| 指标 | 大连市 | 营口市 | 丹东市 | 葫芦岛市 | 锦州市 | 盘锦市 |
|---|---|---|---|---|---|---|
| 对外辐射 | 448.66 | 199.43 | 98.27 | 148.42 | 314.16 | 649.25 |
| 对外依赖 | 272.22 | 455.43 | 119.62 | 345.99 | 391.55 | 663.38 |
| 差值 | 176.44 | -256.00 | -21.35 | -197.57 | -77.39 | -14.13 |
图8
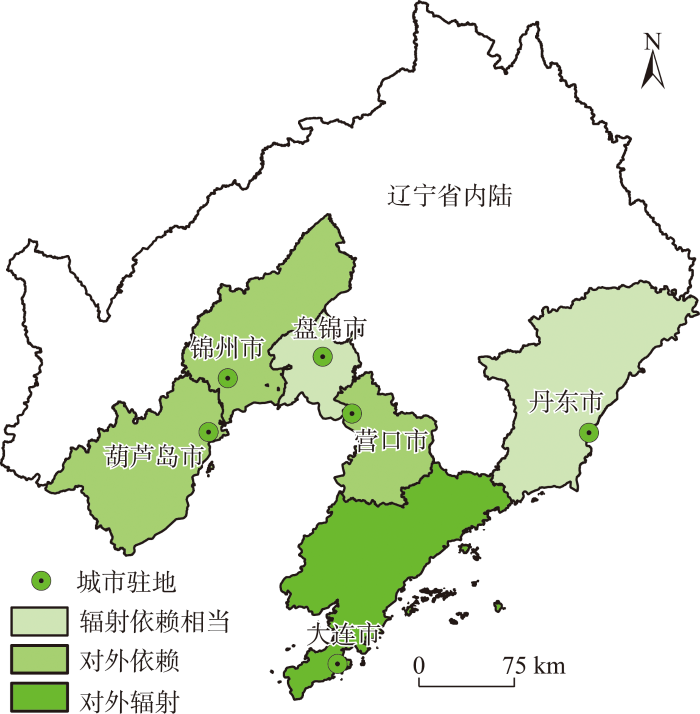
图8
辽宁沿海经济带城市类型分类结果
Fig.8
City type classification of the Liaoning coastal economic belt
由表3和图8可知:大连是唯一对外经济辐射型的城市。作为辽宁沿海经济带的“龙头”城市,具有空间位置、产业基础和人才资源等方面的优势。作为对外经济辐射型城市,大连充分利用其自身的优势,带动沿海经济带建成东北地区产业结构优化的先导区和经济社会发展的先行区,推动区域协同发展。葫芦岛、锦州、营口市为对外依赖型,这3个城市均表现对外部呈极强的依赖性,营口表现出高度依赖大连的特征,表明营口与大连市不可分离性,其发展需重视与大连的优势互补。锦州和葫芦岛市属于多城市依赖型;锦州市是东北陆海新通道,横向牵引辽宁沿海经济带,畅通盘锦、葫芦岛市,并与京津冀经济圈紧密互动。锦州、葫芦岛市在完善自身发展的同时,需重视与所依赖的地区间的合作,提高城市高质量发展水平。盘锦和丹东为辐射依赖相当的复合型城市,表现为对某些城市辐射较大,而对其他城市依赖较大。盘锦和丹东市均表现出对大连较高的依赖特性,城市发展对大连的需求性较高;盘锦对营口和锦州的辐射较大,各城市均有自身优势,也对周围城市高质量发展具有一定的吸引力。对于辐射依赖相当的复合型城市,应重视与辐射城市组团发展,调整优化结构,增强城市间的联系,同时重视与依赖城市间的联系,通过合理规划城市产业布局,最终实现辐射与依赖相平衡,以推动辽宁沿海经济带高质量发展的目标。
4.3 引力格局划分与总体布局分析
根据辽宁沿海经济带高质量发展要求及引力格局,结合区域差异形成“一核引领、两翼协同、多点支撑”的高质量发展格局(图9)。
图9
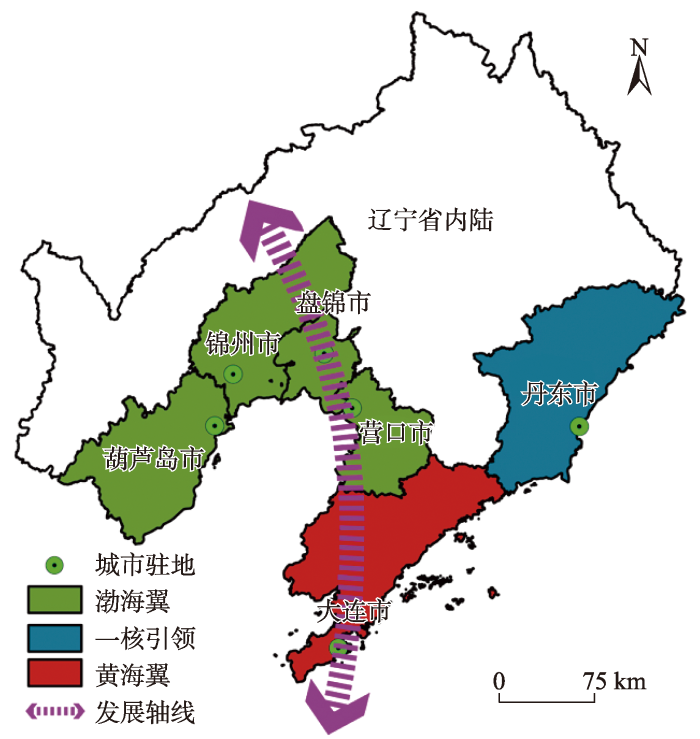
图9
辽宁沿海经济带引力格局划分
Fig.9
Gravity pattern division of the Liaoning coastal economic belt
(1) 一核引领。充分发挥大连市的区位、经济、资源、开放等综合优势,强化辐射带动,打造高质量发展主引擎。进一步促进产业优化升级,建设世界级石化和精细化工产业基地、具有国际影响力的先进制造基地、信息技术产业基地,同时加快建设现代海洋城市。
(2) 统筹推动“渤海翼”营口、盘锦、锦州、葫芦岛市和“黄海翼”丹东两翼协同发展,为高质量发展奠定基础。支持“渤海翼”锦州、营口、盘锦三市建设辽河三角洲高质量发展试验区,推动“黄海翼”大连庄河、丹东东港协同发展。推进“一核”与“两翼”优势产业统筹培育、资源要素统筹配置、基础设施统筹建设、公共服务统筹布局,促进形成布局合理、衔接高效的发展格局。
(3) 高质量发展多点支撑。推动大连金普新区,辽宁自贸试验区大连片区和营口片区,大连大窑湾、大连湾里和营口综合保税区,丹东边境经济合作区,大连、营口和盘锦市跨境电子商务综合试验区等明确重点发展方向,培育壮大特色优势产业集群。
4.4 辐射范围测度与分析
为进一步研究辽宁沿海经济带的辐射效应,对具有对外辐射能力的城市进行辐射范围的测算。从辽宁沿海经济带城市分类结果来看,大连为唯一对外经济辐射型的城市,由此计算得出2006—2020年辽宁沿海经济带高质量辐射半径(表4)。
表4 2006—2020年大连市高质量辐射半径
Tab.4
| 年份 | 辐射半径/km | 年份 | 辐射半径/km | 年份 | 辐射半径/km |
|---|---|---|---|---|---|
| 2006 | 194.124 | 2011 | 210.899 | 2016 | 211.263 |
| 2007 | 195.965 | 2012 | 213.726 | 2017 | 212.080 |
| 2008 | 199.133 | 2013 | 214.197 | 2018 | 213.112 |
| 2009 | 203.197 | 2014 | 215.105 | 2019 | 215.259 |
| 2010 | 207.297 | 2015 | 213.591 | 2020 | 214.873 |
由表4可知,大连市的辐射半径在波动中增加,空间辐射范围也呈对外扩张趋势,辐射作用范围由2006年的194.124 km增加至2020年的214.873 km,覆盖的城市也较多。大连市作为东北经济第一城的地位很稳固,2021年前3季度数据显示,大连市GDP依然位列东北城市第1名;辽宁沿海的区域经济发展架构中,北方重要的港口城市、副省级城市大连起到了引领作用。虽然大连市的辐射范围很广,但具体是否可以转化为各城市的高质量发展增长动能还取决于各城市对大连高质量辐射的接受能力。相较于东南沿海地区,辽宁沿海的区位优势没有得到充分发挥,导致其发展速度比东南沿海发达省份要慢。在推进高质量发展方面,大连市的整体的产业结构要迈向更高级,在服务业的发展、现代农业转型、构建现代产业体系等方面,做出应有的辐射和带动作用。
5 结论与建议
5.1 结论
(1) 研究期内辽宁沿海经济带高质量发展水平呈小幅波动上升趋势,总体处于平稳状态;城市发展水平空间差异显著,呈“以大连为高地,黄海翼、渤海翼两大低谷连绵区”的空间分布特点。
(2) 分维度看,高质量发展的7大维度均表现出波动上升的时间演变规律,主要的动力来源于协调发展、深化改革和绿色发展;创新发展、动能转换和共享发展呈大连一核引领的空间分异,绿色发展和协调发展呈渤海翼领先发展空间分异特征,开放发展和深化改革呈黄海翼领先发展空间分异特征。
(3) 辽宁沿海经济带内区域高质量发展联系强度差异较大,空间分布特征明显。以大连为“龙头”城市,高质量发展联系不均衡;网络密度和网络结构复杂程度逐年提高,空间联系强度等级也不断提高,仍需提升城市空间联系强度。
(4) 辽宁沿海经济带高质量发展的引力格局应提升大连市的示范带动作用,需要加快构建“渤海翼”和“黄海翼”协同发展,形成“一核引领、两翼协同、多点支撑”的高质量发展格局。
5.2 建议
根据辽宁沿海经济带高质量发展特征,结合空间联系及辐射效应分析,提出以下建议:
(1) 根据辽宁沿海经济带高质量测算结果,辽宁沿海经济带高质量发展潜力还未得到充分释放。政府应注重其发展质量的多维度评价,转变传统且单一的发展评价标准,着重关注辽宁沿海经济带发展质量,倡导辽宁沿海经济带创新、协调、绿色、开放、共享发展,并为辽宁沿海经济带高质量发展提供政策支持与战略支撑。辽宁沿海经济带各市间高质量发展驱动因素各异,建议如下:大连要继续发挥创新发展、动能转换和共享发展的优势,并注重区域内部协调及绿色发展;渤海翼”要继续发挥绿色发展和协调发展的带动作用,并加大科技创新力度,推动内部新旧动能转换,促进发展成果共享;“黄海翼”要继续深化改革开放,重视人才队伍建设,培育新兴产业,提高地区经济发展质量,从而保障辽宁沿海经济带高质量发展潜力得到充分释放。
(2) 辽宁沿海经济带需要构建“一核引领、两翼协同、多点支撑”的高质量发展格局。具体来说,必须加快提升核心城市的示范带动作用,充分发挥大连区位优势独特、经济实力雄厚、创新资源富集、开放层次较高等综合优势,增强辐射能力,以现代海洋强市建设为统领,以海洋经济发展为关键引擎,重点突出创新发展、对外开放及深化改革方面的优势价值。积极改善创新环境,吸纳和集聚更多创新要素资源,增强自主创新能力,在智能城市建设重点领域、特色示范区等范畴大胆探索、加快城市创新新模式和新经验。大力推进对外开放水平,加大提升对外开放水平,稳定外贸基本盘、打造外贸发展新动能,引导要素合理配置,高效流动,彰显大连城市吸引力。注重以科技创新为牵引力,增强大连经济扩散效应,以科技创新推动辽宁沿海经济带产业升级,努力提升本土品牌竞争力和话语权。加快绿色低碳转型,扎实推进碳减排,增强城市整体性、系统性和生长性。
(3) 根据现有辽宁沿海经济带高质量发展联系及发展格局,需要积极探索各类型城市的差别化发展。首先,要明确大连战略定位,充分发挥引领带动作用,增强其经济辐射能力,依靠多领域、多层次间地区合作打破要素及资源流动的行政区划壁垒,充分发挥其区域增长极作用。其次,辽宁沿海经济带地区间要因地制宜,统一规划,注重整体效能,积极探索“渤海翼”及“黄海翼”协同、创新、改革、开放的新发展模式,依靠交通及港口物流枢纽建设为其提供联系条件,并通过城市功能及人才、信息资源的对接,推动构建高效、协同的辽宁沿海经济带高质量发展联系网络。最后,注重传统产业转型升级、新兴产业培育、海陆经济统筹发展,积极构建多点支撑、多元发展的产业发展新格局,从而推动创新驱动、体制改革、协调发展、绿色发展、对外开放、共享发展等方面处于东北地区领先地位。
(4) 与时俱进,多措并举。清除体制机制障碍,加强区域内外开放合作,加快产业结构调整,加速工业智能化升级。摆脱传统路径依赖,通过数字互联、空间互动催生辽宁沿海地区新的产业链,培育新的增长极,同时避免战略趋同。把握好产业梯度转移实际,积极打造开发开放枢纽。支持辽宁沿海经济带国家科研院所做好改革工作,提供具有竞争力的薪酬待遇。明确“兴辽英才”计划对辽宁沿海经济带支持,积极引进海内外高层次人才,畅通海外科学家入境工作通道。重视高技能人才队伍建设,加强教学、实践、产业有效衔接,培养一批“辽宁工匠”。
参考文献
辽宁沿海经济带发展进入新阶段
[N].
The development of Liaoning coastal economic belt has entered a new stage
潮涌黄渤海扬帆新航程
[N].
Tidal surge Yellow Bohai sail new voyage
辽宁沿海经济带与内陆腹地互动发展的实证研究
[J].
Empirical study on interactive development between coastal economic belt and hinterland in Liaoning Province
辽宁沿海经济带与东北腹地互动发展关系论证: 为铸就国家重量级战略区域提供强力引擎
[J].
Research on the mutual developing relationship between Liaoning coastal economic belt and the northeast hinterland: Setting the regional engine to construct important national strategic area
承载力视角下辽宁省滨海旅游业发展现状分析: 基于DP政策战略矩阵
[J].
Analysis on the development of coastal tourism in Liaoning Province from the perspective of bearing capacity: Based on DP policy strategy matrix
基于点—轴理论的辽宁沿海经济带旅游空间结构研究
[J].
Study on the tourism spatial structure of Liaoning coastal economic zone based on pole-axis theory
辽宁沿海经济带“全域旅游”发展研究
[J].
Research on the development of 'global tourism' in Liaoning coastal economic belt
基于港城可达性的辽宁沿海港口腹地市场潜力分析
[J].
Analysis of Liaoning coastal port market potential based on city and port accessibility
辽宁沿海经济带港口拉动城市发展的脉冲响应分析
[J].
An impulse response analysis on relationship between port and city of Liaoning coastal economic zone
辽宁沿海经济带产业分工研究
[J].
DOI:10.11821/dlyj201401009
[本文引用: 1]

为反映区域产业分工现状,利用变异系数与空间洛伦茨曲线、空间基尼系数相结合,在产品层次上,对辽宁沿海经济带产业分工现状进行定量研究并提出相应的协调发展建议。结果表明:辽宁沿海经济带农业和采掘业依据自身比较优势发展相应产业,产业分工较为明确;制造业在行业层次存在同构现象,但在产品层次上,各地差异化发展明显,区域产业分工逐步显现;第三产业内部结构亟待调整,其中基础服务业与个人消费服务业发展较为完善,但生产和市场服务业中的金融、物流和专业技术服务业与公共服务业中的公共管理服务业发展相对滞后,影响工业化进程的推进与产业结构的升级。在此基础上,针对各产业分工结果,提出相应的协调发展建议。
The study on division of labor in Liaoning coastal economic belt
DOI:10.11821/dlyj201401009
[本文引用: 1]
With the accelerating of globalization and regional economic development, industrial isomorphism as a practical problem on spatial division attracts the widespread concerns of academic communities. Ordinarily, industrial isomorphism is considered harmful to the process of regional integration. A regional division which has complementary advantages will do help to format economic agglomeration and coordinate regional development. In order to reflect the regional industrial division status more accurately, this paper used a comprehensive method which combined the Variation Coefficient with the Lorenz Curve and Geordie coefficient to quantitatively study the industrial division status of Liaoning coastal economic belt at the product level and proposed the suggestions of coordinated development. The results show that: (1) in the agriculture and excavating industry, all regions develop the competitive industries according to their comparative advantages, and the industrial division is relatively clear; (2) in manufacturing, the structures are similar on the industry level, but on the product level, all regions develop differently and industrial division is emerging; (3) the internal structure of the tertiary industry needs to be adjusted, basic services and personal consumer services develop more perfectly, and some parts of production and market services and public services lag behind, especially finance, logistics, professional technical services and public management services which affect the process of industrialization promoting and the industrial structure upgrading. And finally we propose the coordinated development suggestions according to the industrial division results: the agriculture and excavating industry should expand industrial scale, promote characteristic development and improve product added-value; in manufacturing, industrial division is gradually appearing, and the future development should focus on the competitive industrial clusters, including transport equipment, general equipment manufacturing and petrochemical industry and metallurgy industry clusters; the internal structure of the tertiary industry should be adjusted, the logistic industry and the financial industry should be enhanced and a modern logistic network and financial service system should be built. The public management services should also be developed so as to optimize the regional allocation of resources, innovate management system and promote regional sustainable development.
辽宁省海洋经济产业结构及空间模式演变
[J].
Study on the evolution pattern of marine industry functional structure and spatial structure in Liaoning Province
辽宁沿海经济带产业结构分析
[J].辽宁沿海经济带开发开放上升为国家战略之后不仅使其成为全省经济总量扩张承载的重要区域,而且还肩负着辽宁转变经济发展方式、加大产业结构调整的重要使命。在应用“三轴图”法研究辽宁沿海经济带产业结构的变化及其轨迹的基础上,利用SSM模型及其计算公式对辽宁沿海经济带产业结构进行比较分析,认为营口、丹东、锦州等城市的第一产业竞争力较强,其第二产业的发展水平都较高,尤以大连、营口两市为突出,锦州、营口两市的第三产业发展速度较快。依据分析结果并结合辽宁“十二五”经济社会发展战略,提出辽宁沿海经济带加快转变经济发展方式、加大产业结构调整的对策建议。
Analysis on the industrial structure in Liaoning coastal economic belt
As the development and opening of Liaoning coastal economic belt has become part of China’s national strategy, this region will act as a major battle field of expanding Liaoning’s economic size, and furthermore, it will undertake the task of transforming Liaoning’s economic growth mode and accelerating the adjustment of Liaoning’s industrial structures. Based on the analysis of the changes and the development of the industrial structures in Liaoning coastal economic belt by means of threeaxis graph method, this paper conducts a contrastive analysis through SSM model and its formulation and concludes that, the primary industry in Yingkou, Dandong, and Jinzhou enjoys comparatively stronger competitiveness, other six cities, especially Dalian and Yingkou, boast of relatively developed secondary industry, and Jinzhou and Yingkou predominate others in tertiary industry. According to the findings here and Liaoning’s 12nd FiveYear Plan of Economic and Social Development, this paper finally puts forward some suggestions on how to accelerate transformation of the mode of economic development and on how to intensify efforts to adjust industrial structures.
基于生态系统健康的辽宁省海洋生态承载力评价
[J].
DOI:10.11849/zrzyxb.2014.02.007
[本文引用: 1]
针对自然生态系统和传统承载力研究中评价标准相对单一的问题,提出基于生态系统健康的海洋生态承载力概念,探讨其内涵和基本特征,建立计量模型,提出生态承载力评价指标体系和标准的确定方法。以辽宁省为研究区域,构建了适合该区域的基于系统健康的生态承载力评价指标体系、权重和评价标准,对2000—2010 年的海洋生态承载力水平进行深入分析。结果表明,辽宁省海洋生态承载力指数呈波浪式上升,其健康等级从不健康升到亚健康。其中资源承载力长期处于亚健康;生态弹性力从不健康到亚健康,2010 年达到健康;人类活动潜力则一直处于不健康状态,最近两年有所好转。今后应加强海洋生态承载力各指标的优化,提高生态承载力水平和健康等级,实现海洋经济的可持续发展。
Assessment of marine ecological carrying capacity in Liaoning Province based on ecosystem health
DOI:10.11849/zrzyxb.2014.02.007
[本文引用: 1]
With the growing popularity of marine issues, some scholars are concerned about the marine carrying capacity closely. An assessment of marine ecological carrying capacity can provide an overall impacts resulting from the marine ecological construction. Therefore research on the theories and methods of the marine carrying capacity are significant for the regional sustainable development. This paper introduces the model of ecosystem health to establish the general measuring indicators for Liaoning marine ecological carrying capacity and conducts a decade-long research on Liaoning marine system. The concept of the marine ecological carrying capacity based on ecosystem health is investigated to overcome the shortcomings of the traditional studies that are not convenient to use in practice due to their relatively simple assessment standards and conclusions. A corresponding conceptual model and computation model of the marine ecological carrying capacity are further proposed to analyze impacts of the marine ecological construction. In addition, the established methods of index system and the assessing standards for the marine ecological carrying capacity assessment are proposed. For example, the marine ecological carrying capacity of Liaoning Province is studied. An index system, weights and corresponding appraisal standards for the marine ecological carrying capacity are established for analyzing the marine ecological carrying capacity deeply between 2000 and 2010 in this area. The results demonstrate that marine ecological carrying capacity index rises up, its index rose from 0.0724 in 2000 to 0.2184 in 2010, and the state of ecosystem increased from un-health level to sub-health level. The resource and environment carrying capacity remains sub-health level for a long time. Its index rose from 0.0432 in 2000 to 0.1670 in 2010. The ecological resilience index rose from 0.0510 in 2010 to 0.1249 in 2010, and the state of ecosystem increased from un-health level to sub-health level and reached the health level in 2010. The potential human activities remain un-health level and this situation takes a turn for the better in almost two years. Its index is continuous declining between 2002 and 2006, their state of health level before 2009 had been in the unhealthy state, only in 2009 and 2010 it was in the sub-health state. For the sustainable marine economy, many more efforts should be made in terms of marine industrial structure adjustment, pollution control and marine technology. In future, we must strengthen the marine ecological carrying capacity index optimization to improve the level of ecological carrying capacity and health level and realize the sustainable development of marine economy. This research put forward method for measuring the ecosystem health related marine ecological carrying capacity in view of the fact that some data are not available, the selection of indicators is not so comprehensive, but this paper helps broaden the field of vision and makes human activities greatly reflected in marine ecological carrying capacity.
基于多中心理论的辽宁沿海经济带环境治理模式研究
[J].
Study of environment management system of Liaoning coastal economic zone based on multi-center theory
辽宁沿海经济带滨海湿地资源的开发与保护研究
[J].
Development and protection about Liaoning coastal economic zone of coastal wetland resource
辽宁沿海经济带水资源边际效益测度及影响因素分析
[J].
The marginal benefit of water resource measure and its influence factors in Liaoning coastal economic belt
DOI:10.11849/zrzyxb.2015.01.007
[本文引用: 1]
Water shortage has become a bottleneck to restrict the sustainable development of China's economy, especially in the Liaoning Coastal Economic Belt (LCEB). So the research on marginal effect of water resources is important and necessary for the sustainable development of LCEB. The theory of marginal effect is the cornerstone of this paper. To quantitatively analyze the impact of water resources on the regional output value based the three industries, the paper took water resource as the factors of production. And, in this study, the Cobb-Douglas function was employed in the computation of marginal revenues of water in LCEB over the period of 2002-2011. The results indicated that, in 2002-2011, the marginal effect of three industries increased year after year, and the marginal effects of agriculture, industry and the tertiary industry water was 4.11, 82.30 and 154.93 yuan/m<sup>3</sup> respectively. The marginal effect of agriculture water was significantly less than that of industry and the tertiary industry water. Due to the different nature of the three industries, their influence factors are abundant and varied. To investigate the key factors of marginal effect for water resources, multiple linear regression model was built based on the results. Our model showed that the influence factors exactly revealed the impact of marginal effect of water resources, and the factors had both positive and negative effects. The results showed that: the factors that affected agricultural water were the water consumption of agricultural output value per ten thousand yuan, the influence of government, the yield per unit area, and the amount of fertilizer consumption; the factors affected marginal effect of industry were the water consumption of industrial output value per ten thousand yuan, the amount of industrial wastewater emission, the influence of government, and the degree of market demand; the factors affect marginal effect of the tertiary industrial water were the water consumption of the tertiary industry output value per ten thousand yuan, the level of urbanization, the influence of government, and park green area per capita.
辽宁沿海经济带水资源承载力研究
[J].
Research on water resources carrying capacity of Liaoning coastal economic zone
辽宁沿海经济带城市化水平与资源环境压力的关联分析
[J].
Urbanization level of resources and environmental pressures associated in Liaoning coastal economic belt
城市化与土地资源利用的协调度及优化配置研究: 以辽宁沿海经济带为例
[J].
Optimal allocation model and quantitative analysis of coordination relation between urbanization and land-use: A case study of Liaoning coastal economic zone
辽宁沿海经济带经济与环境协调发展度的时空演变
[J].
The analysis of spatiotemporal evolution of economic and environmental coordination development degree in Liaoning coastal economic belt
DOI:10.11821/yj2012110012
[本文引用: 1]
The coordinated development between economy and environment is key to keep the sound development of regional integrated system.Economic and environmental coordination development degree is one of the important quantitative indicators for measuring capacity for sustainable development in a region.Based on drawing lessons from the existing research results and the research methods, this article constructs an evaluation index system of economic and environmental coordination development degree in Liaoning coastal economic belt consisting of six cities, and uses the model of coordination development degree for calculation and spatiotemporal evolution analysis of coordination development degree in the study area.Results are shown as follows.In the temporal evolution, the trend presents a "V"-shaped pattern in regional comprehensive coordination degree, with a steady rise in this belt.Development level of the six cities is higher, reaching the intermediate level.In the spatial evolution, the six cities can be divided into three types, and the eastern and southern cities are more harmonious than the western and northern ones, but the gap between their urban spaces is gradually narrowing.In addition, from these aspects of the macro-regulation, the upgrading of the industrial structure, regional layout optimization and the improvement of environmental protection threshold, the paper analyzes the reason for the spatiotemporal evolution of economic and environmental coordination development degree in Liaoning coastal economic belt, and pointed out that, driven by the above factors, economic comprehensive development levels and environmental strength have increased.And due to the industrial isomorphism and fragile coastal ecology, changing the mode of economic growth and promoting the harmonious development of regional economy and environment are still the main tasks in the future.
辽宁沿海地区经济发展与生态环境良性互动模式研究
[J].
Study on the benign interaction model between economic development and ecological environment in Liaoning coastal areas
辽宁沿海经济带经济与环境协调发展的态势预测
[J].
Forecast and analysis of coordinated development between economic development and environment in Liaoning coastal economic belt
辽宁沿海经济带海洋资源环境经济系统承载力及协调发展研究
[J].
Development of Liaoning coastal economic zone marine resources and environment carrying capacity and economic coordination
辽宁沿海经济带经济与海洋环境协调发展研究
[J].辽宁省是东北唯一的沿海省份, 而海洋环境是经济增长的重要影响因素和承载, 因此研究辽宁沿海经济带经济与海洋环境协调发展是实现辽宁经济可持续发展的关键。本文在对辽宁沿海经济带经济和海洋环境现状分析的基础上, 从经济、海洋环境两个方面科学合理选取评价指标, 采用可变模糊识别模型研究经济带经济与海洋环境的协调性。结果表明:辽宁沿海经济带各地区的经济增长与海洋环境发展尚处于略好于动态平衡却远不足于明显协调阶段。从时间序列上分析, 辽宁沿海经济带战略并非对各区均有利且弊端明显, 以2008年较2005年为例, 虽然盘锦、丹东、葫芦岛和锦州地区协调度呈上升趋势, 而营口和大连地区协调度却呈下降的趋势。并且通过产业分解和GK.E模型深入剖析了辽宁沿海经济带的经济发展差距和海洋环境污染节距, 产业分解显示一产、二产和三产分别对经济差距起到了减缓、加剧和维系的作用;而GK.E模型分析, 在经济结构和集中效应影响下, 盘锦和丹东葫芦岛地区的海洋环境要明显好于大连、锦州和营口地区。
The coordinated development of economic and marine environment in Liaoning coastal economic belt
Liaoning Province is the only coastal north-east province of China, while the marine environment is an important influencing factor and bearing of economic growth, so the study of economic coordination with economic development and the marine environment is the key to achieve Liaoning sustainable economic development. In this paper, Liaoning coastal economic belt and the marine environment of economic analysis, based on economic, select both the marine environment evaluation, built in Liaoning coastal economic belt and the marine environment, sustainable development, economic evaluation index system, evaluation of class division, and using AHP method to determine the index weight, while the use of variable fuzzy recognition model analysis of Liaoning coastal economic belt and the marine environment of economic coordination degree.The results show that: the regions of Liaoning coastal economic belt’s economic growth and development and the marine environment are still in a condition that a little better than the dynamic equilibrium but far less than in the apparent coordination stage. From the time series analysis, Liaoning coastal economic zone strategy is not beneficial but drawbacks of various apparent to the regions. For example, to contrast 2008 and 2005, although the coordination degree of Panjin, Dandong, Jinzhou are rising, Huludao,Yingkou and Dalian are in a downward trend. And by industry decomposition and GK.E model analysis the gap of the regions of Liaoning coastal economic belt and the marine environment pollution disparity, industrial production shows that primary, secondary and tertiary industry were played on slow down economic disparities, increase and maintain the effect; and GK.E model analysis, under the effect of economic structure and concentration, the marine environment in Panjin, Dandong area was significantly better in Dalian and Yingkou.
辽宁沿海地区用水效率与经济的耦合协调发展评价
[J].
DOI:10.11849/zrzyxb.2013.12.006
[本文引用: 1]
论文构建辽宁沿海经济带用水效率与经济耦合协调发展评价指标体系,首先运用改进的突变模型对2001—2010 年辽宁沿海经济带用水效率和经济发展各子系统进行状态评估,其次运用耦合协调模型对辽宁沿海经济带各市用水效率与经济发展的耦合协调度进行评价。研究结果表明:①辽宁沿海经济带整体用水效率与经济发展耦合度水平从0.437 提高到0.498,呈缓慢提高状态,但一直处于拮抗阶段。用水效率水平与经济发展水平差距不断减小,耦合协调度从0.254 增大到0.408,呈增大趋势但仍处于中低度协调水平;②辽宁沿海经济带各市用水效率与经济发展都处于上升趋势,其中用水效率最好的为大连市,用水效率评估值已达到0.887,其次为锦州、营口和葫芦岛,丹东和盘锦市用水效率处于最低水平,分别为0.604和0.535。经济发展水平最高的为大连市,其次为营口和盘锦市,丹东、锦州和葫芦岛较差; ③各市耦合度均处于拮抗阶段,并且处于上升趋势。大连市和营口市耦合协调度2010年已分别达到0.457 和0.401,已从低度协调进入中度协调且呈不断上升趋势,丹东、锦州、盘锦和葫芦岛均处于低度协调阶段,呈波动式上升。各市的经济发展滞后于水资源利用效率的提高,导致耦合协调度一直处于中低度协调水平;④辽宁沿海经济带耦合度和协调度的区域差距在不断减小,经济带协同发展趋势越加明显。
Evaluation of the coupling coordination development between water use efficiency and economy in Liaoning coastal economic belt
DOI:10.11849/zrzyxb.2013.12.006
[本文引用: 1]
This paper builds the evaluation indicator system for water use efficiency and coordinated development of economy coupling in Liaoning coastal economic belt (LCEB). Firstly, using improved mutation model to evaluate status of LCEB water use efficiency and the economic development of each subsystem from 2001 to 2010. Secondly, using coupling coordination model to evaluate water use efficiency and the coupling coordination degree of economic development of every city of LCEB. The results show that the coupling degree of water use efficiency and the economic development of LCEB increased from 0.437 to 0.498, which is slowly improving, but it has been in the stage of resisting. The gap of water use efficiency and economic development level decreases continuously, and the coupling coordination degree increased from 0.254 to 0.408, which showed a trend of increase but still at the mid-low level of coordination. Water use efficiency and economic growth of every city of LCEB are in a rising trend, water use efficiency of Dalian is the best with an evaluation value reaching 0.887, Jinzhou, Yingkou and Huludao are in the second place, Dandong and Panjin at the worst level with evaluation values being 0.604 and 0.535. The economic development level of Dalian is the highest, Yingkou and Panjin are at intermediate level, Dandong, Jinzhou and Huludao are at the lowest level. The coupling degree of every city in the stage of resisting, and in a rising trend. The coupling coordination degree of Dalian and Yingkou have reached 0.457 and 0.401, and entered the stage of moderate coordination from low-grade coordination phase,and showed a rising trend. The coupling coordination degree of Dandong, Jinzhou, Panjin and Huludao still at the low level of coordination and showed a fluctuated increase.The economic development of every city falls behind the improvement of the efficiency in water usage, which causes the coupling coordination being in the mid-low grade period. The regional disparities among the coupling degree and coordination degree of LCEB are decreasing, and the coordinated development trend of economic belt becomes more and more apparent.
辽宁沿海经济带水资源—社会经济可持续发展研究
[J].水资源是社会经济发展的重要物质基础,辽宁沿海经济带水资源短缺已成为制约其社会经济可持续发展的重要因素。本文在分析辽宁沿海经济带水资源-社会经济发展现状的基础上,从水资源、社会、经济三方面综合分析选取24项评价指标,合理构建辽宁沿海经济带水资源-社会经济可持续发展评价指标体系,采用经济带内6个沿海地区近年的统计数据,运用可变模糊识别模型逐层评价辽宁沿海经济带水资源-社会经济可持续发展水平,结果表明:丹东、大连为中等偏高等水平;葫芦岛、营口和锦州为中等偏低等水平;盘锦为低等偏中等水平,经济带整体处于中等偏低等水平。最后,系统分析了经济带沿海各地区水资源系统、社会系统、经济系统、支撑力、压力、承载力、和谐性变化趋势,并分别指出各地区存在的主要问题。
A study on sustainable development of water resources and social economy in Liaoning coastal economic belt
Water resources are the key factor to the development of society, economic growth, the improvement of living standard of people, and the improvement of the environment. The shortage of water resources has become one of the important factors hampering the sustainable development of social economy in Liaoning coastal economic belt, which is one of areas falling severely short of water resources in the region. The contradictions between water supply and demand are becoming increasingly significant. In addition, the study would be beneficial in the formulation of strategy for the old industrial base in northeastern China. In this paper, the current situations of sustainable development of water resources and social economy in Liaoning coastal economic belt were analyzed. Based on special conditions of water resources and social and economy in Liaoning coastal economic belt, an assessment index system involving 24 indices for sustainable development of water resources and social economy was established. These indicators depict three major aspects including water resources, society, and economy. The assessment index grades were calculated. The Analytic Hierarchy Process (AHP) method was used to determine the weight of each assessment index. Data of cities in Liaoning coastal economic belt were used. As a result of the complexity and uncertainty of the water resources system, the variable fuzzy recognition model was chosen to evaluate the assessment index system quantitatively for each layer. The average value of the past four years was taken as the current situation of sustainable development of water resources and social economy in Liaoning coastal economic belt. Results show that the levels of the sustainable development of water resources, society, and economy for Dandong and Dalian were slightly higher than the moderate level. Those of Huludao, Yingkou, and Jinzhou were low to intermediate. Panjin lay in a low grade. The whole study area exhibited a low to an intermediate level. The evaluating results seem to be reasonable.
辽宁沿海经济带海陆经济效率与协调性研究: 基于DEA-Malmquist模型
[J].
Assessment of land-sea economic efficiency and coordination in Liaoning coastal economic belt: Based on DEA-Malmquist model
基于分工的辽宁沿海经济带城市间经济联系研究
[J].
Study on the economic connection between cities in Liao-ning coastal economic belt based on division of labor
辽宁沿海区域经济发展差异的时空演变特征分析
[J].
Space-time evolution characteristics of Liaoning coastal economic development differences
Spatial correlation network of pollution and carbon emission reductions coupled with high-quality economic development in three Chinese urban agglomerations
[J].
“双碳”目标下中国三大城市群减污降碳协同治理区域差异及关键路径识别
[J].
DOI:10.18402/resci.2022.06.05
[本文引用: 1]
城市群是中国区域经济与绿色发展的主要承载形式,其战略地位与日俱增,在实现碳中和、碳达峰目标下研究城市群减污降碳协同治理,是探索区域可持续发展的重要内容。基于减污降碳协同治理演化机理,借助2010—2019年三大城市群的面板数据,采用相关系数矩阵法、复合系统协同度模型测度城市群减污降碳协同治理协同度;结合基尼系数、变异系数、泰尔指数、引力模型等方法分析城市群减污降碳协同治理区域差异及空间联系强度;并对减污降碳协同治理关键路径进行识别。结果表明:①三大城市群减污降碳协同治理有序度呈显著增长趋势;而减污降碳协同治理协同度水平较低,系统处于不稳定、不协调的状态。②京津冀减污降碳协同治理度内部差异逐步减小,长三角内部差异基本保持稳定,珠三角内部差异波动较大。③京津冀和珠三角减污降碳协同治理协同度的网络密度和网络结构的复杂程度高于长三角,空间联系强度等级较高。为此,三大城市群减污降碳协同治理可以从政策、技术、能力建设等方面,通过做好顶层设计、转型升级、合作拓展等路径予以推进。
Regional differences and key pathway identification of the coordinated governance of pollution control and carbon emission reduction in the three major urban agglomerations of China under the "double-carbon" targets
DOI:10.18402/resci.2022.06.05
[本文引用: 1]
Urban agglomerations are the main carrier of regional economic and green development in China, and their strategic position is rapidly increasing. Under the targets of carbon neutralization and carbon peaking, research on coordinated governance of urban agglomeration pollution control and carbon emission reduction is an important content of exploring regional sustainable development. Based on the mechanism of change of coordinated governance of pollution control and carbon emission reduction, this study used the panel data of the three major urban agglomerations of China from 2010 to 2019 to measure the coordination degree of coordinated governance of pollution control and carbon emission reduction in these regions with correlation coefficient matrix method and composite system coordination degree model. Using Gini coefficient, coefficient of variation, Theil index and its decomposition method, and gravity model, this study analyzed the regional differences and spatial connection intensity of the coordinated governance of pollution control and carbon emission reduction and identified the critical pathways of pollution control and carbon emission reduction coordinated governance. The results show that: (1) The orderliness degree of coordinated governance in the three major urban agglomerations showed a significant growth trend; However, the coordination degree is low, and the system is in an unstable and uncoordinated state. (2) The differences in the coordination degree of coordinated governance of pollution control and carbon emission reduction in the Beijing-Tianjin-Hebei region gradually decreased, while the differences in the Yangtze River Delta remained stable, and the internal differences in the Pearl River Delta fluctuate greatly. (3) The network density and network structure complexity in the Beijing-Tianjin-Hebei region and the Pearl River Delta are higher than those in the Yangtze River Delta, and the spatial connection intensity is higher. The cities are interconnected and influenced by each other. The coordinated governance of pollution control and carbon emission reduction in the three major urban agglomerations can be promoted from the aspects of policy, technology, capacity building, top-level design, transformation and upgrading, and cooperation and expansion.
基于改进城市引力模型的武汉城市圈引力格局划分研究
[J].
DOI:10.11820/dlkxjz.2015.02.012
[本文引用: 2]
科学合理地划分城市经济联系是完善城市圈功能布局、实现经济一体化发展的基础。通过引入相对引力常量、改进城市引力模型,并以武汉城市圈为例,探讨城市经济联系空间结构及引力格局划分方法。结果如下:①改进的引力模型能客观反映城市间不相等的相对引力现状;②武汉城市圈呈现出经济辐射型、经济依赖型、经济复合型3类城市经济联系结构,武汉市是城市圈内唯一的强经济辐射型城市;③根据城市经济联系结构,将武汉城市圈引力格局划分为以孝感—武汉—咸宁为中心,黄石—鄂州—黄冈和仙桃—天门—潜江为两翼的城市组团。
Gravity zoning in Wuhan Metropolitan Area based on an improved urban gravity model
DOI:10.11820/dlkxjz.2015.02.012
[本文引用: 2]
Scientific zoning of urban economic linkage structure is essential for improving and optimizing the functional layout of metropolitan areas, as well as for guiding integrated economic development. Based on the relative gravity vector introduced in this article, the conventional gravity model had been improved and applied in the Wuhan Metropolitan Area for exploring the economic linkage structure and gravity zoning. The results show that: the improved gravity model can indicate the actual conditions of unsymmetrical relative gravity between two cities. It shows three types of economic linkage structure, including driving, dependent, and complex structures in the Wuhan Metropolitan Area, and Wuhan was the single city that showed strong driving economic power in relation to other cities in the area. According to the gravitational attraction that represents economic linkage structure, cities in the area were divided into three zones, namely the "Xiaogan-Wuhan-Xianning", "Huangshi-Ezhou-Huanggang", and "Xiantao-Tianmen-Qianjiang"urban cooperation groups, with the former as the "center" and two latter groups form the "wings".
京津冀城市群核心城市的空间联系及影响测度
[J].
Research on the spatial correlation of central cities in Beijing-Tianjin-Hebei urban agglomeration
广东省中心城市科研机构的创新辐射效应
[J].
Innovative radiation effects of scientific research institutions in central cities of Guangdong Province
环渤海地区中心城市金融竞争力评价及辐射研究
[J].以环渤海地区中心城市为研究区域,通过建立城市金融竞争力评价指标体系,运用突变级数法、主成分分析法、层次分析法对环渤海地区中心城市金融竞争力进行综合评价,并通过威尔逊模型揭示了中心城市的辐射范围。环渤海地区中心城市金融发展不平衡,北京的城市金融竞争力遥遥领先于其他城市;环渤海地区并未形成一个紧密联系的金融辐射网络,金融一体化还不成熟,仍有金融盲区的存在;各中心城市在发挥自身优势的同时应打破地区间行政壁垒,优势互补,协同发展,带动环渤海地区金融发展。
Financial competitiveness and radiation of central cities in Bohai rim region
By constructing indicator system for city financial competitiveness and using catastrophe theory,principal components analysis and analytic hierarchy process, this paper studied the city financial competitiveness of the central city in Bohai Rim Region, then the Wilson model was used to describe the central city financial radiation.The study shows that:The financial development level of central cities is unbalanced in Bohai Rim Region,Beijing is far ahead of other cities;The financial radiation network and integration are not formed,the blind area still exists;The central city should break administrative barriers and based on their own advantages to cooperate, then promote financial development in Bohai Rim Region.
中国沿海地区高质量发展的路径
[J].
DOI:10.11821/dlxb202102003
[本文引用: 1]
高质量发展是跨越中等收入陷阱、跻身发达经济体的关键举措。随着改革开放的深入,沿海地区正日益成为经济增长的压舱石、国家制造业中心、打造创新型国家的前沿地带、开放型经济建设的排头兵、绿色发展的示范窗口,具备高质量发展的典型特征,将有效带动内陆地区步入高质量发展的正轨,形成对整个国家高质量发展的有力支撑,塑造区域协调发展新格局。结合沿海地区高质量发展的现状与特征,本文从经济增长、产业实力、创新能力、对外开放、绿色发展五方面入手,重点探究沿海地区整体以及沿海北部、中部、南部地区在高质量发展进程中的突出问题,分析其背后的现实原因,为设计具有针对性的高质量发展路径提供价值参考。新时代背景下,沿海地区高质量发展需把握京津冀协同发展、长三角一体化、粤港澳大湾区建设的历史性机遇,产业升级战略、自主创新战略、对外开放战略、生态文明战略并济,遵循提升产业核心竞争力、激发创新活力、发展高水平开放型经济、深化生态文明建设等路径,协同推进沿海北部、中部、南部地区高质量发展,巩固沿海地区的引领地位。
Paths of high-quality development in China's coastal areas
DOI:10.11821/dlxb202102003
[本文引用: 1]
High-quality development is the key measure to overcome the middle-income trap and join the advanced economy. With the deepening of reform and opening up, coastal areas have increasingly become the ballast of the economic growth, the center of national manufacturing, the frontier zone for building an innovative country, the pacesetter for constructing an open economy, and the demonstration window for green development. With typical characteristics of high-quality development, coastal areas will effectively drive the hinterland areas to the right track of high-quality development in order to form a strong support for the country's high-quality development, shaping a new pattern of coordinated regional development. According to the status quo and characteristics of high-quality development in coastal areas, this paper focuses on exploring outstanding problems of coastal areas as a whole and the northern, central and southern coastal areas in the process of high-quality development from five aspects of economic growth, industrial strength, innovation ability, opening up and green development. By analyzing realistic reasons for these problems, valuable references for the design of targeted high-quality development paths are designed. In the new era, coastal areas should grasp the historical opportunity of Beijing-Tianjin-Hebei coordinated development, Yangtze river delta integration, Guangdong-Hong Kong-Macao Greater Bay Area construction, follow to improve industry core competitiveness, mobilize the vitality of innovation, build high-standard open economy, deepen ecological conservation by combining strategies of industrial upgrading, independent innovation, opening up and ecological civilization. By the method of working in concert to promote high-quality development in the northern, central and southern coastal areas, the leading role of coastal areas can be consolidated.
中国高质量发展的测度: 1978—2018
[J].
Measurement of China's high-quality development: 1978-2018
Spatial spillover and regional economic growth in China
[J].DOI:10.1016/j.chieco.2012.04.016 URL [本文引用: 1]
How does banking sector globalization affect economic growth?
[J].
Effect of equity in education on the quality of economic growth: Evidence from China
[J].
新时代中国经济高质量发展水平的测度研究
[J].
Study on the measurement of economic high-quality development level in China in the new era
中国经济增长质量的时序变化与地区差异分析
[J].
The fluctuation and regional difference of quality of economic growth in China
高质量发展的内涵研究
[J].
A framework of China's high-quality economic development
中国经济高质量发展的现实困境与基本路径: 文献综述
[J].
The connotation, predicament and basic path of China's economy of high-quality development: A literature review
中国区域经济高质量发展评价指标体系及测度研究
[J].
Study of evaluating high-quality economic development in Chinese regions
黄河流域高质量发展水平测度及其时空演变
[J].
DOI:10.18402/resci.2020.01.12
[本文引用: 1]
推动黄河流域高质量发展,有必要构建黄河流域高质量发展评价指标体系以对黄河流域高质量发展水平进行科学测度。本文从经济社会发展和生态安全两大方面,包含经济发展、创新驱动、民生改善、环境状况和生态状况5个维度,构建了黄河流域高质量发展评价指标体系,并基于黄河流域9省区2008—2017年的数据,运用熵权法进行了测度。结果表明:黄河流域高质量发展水平基本呈现“两边高、中间低”的空间分布,但差距逐年变小;各省区高质量发展水平在2008—2010年基本保持平稳,2011—2017年持续增长,且在2016年增速明显;黄河流域整体高质量发展水平呈现上升趋势,在2008—2010年小幅波动,2011年起上升明显;10年间5个维度均有不同程度的改善。据此,本文对提升黄河流域高质量发展水平给出了具体建议:①借助政策红利叠加效应,进一步加强区域联动,扩大黄河流域整体对外开放水平。②西部各省区在重点保护生态环境的基础上,结合要素禀赋,发展特色产业。③山东省和河南省在发展经济的同时,要加大对生态环境的保护力度;山西省和甘肃省民生改善工作亟待加强;青海省和内蒙古自治区要加大创新投入力度,提高创新能力。
High-quality development level and its spatiotemporal changes in the Yellow River Basin
DOI:10.18402/resci.2020.01.12
[本文引用: 1]
To promote the high-quality development of the Yellow River Basin, it is necessary to construct an evaluation index system for a scientific assessment of such development. Based on the two areas of economic and social development and ecological security, and considering five dimensions of economic development, innovation, improvement of people’s livelihood, environmental conditions, and ecological conditions, this study constructed a high-quality development evaluation index system for the Yellow River Basin. Using the data of nine provinces (autonomous regions) in the Yellow River Basin during 2008-2017, the entropy weight method was used in calculation. The results are as follows: The high-quality development level of the Yellow River Basin basically showed the spatial distribution of “high on both sides and low in the central area,” but the gap was decreasing year by year; The high-quality development level in each province (autonomous region) remained stable in 2008-2010, and continued to grow in 2011-2017, with a high growth rate in 2016; The overall high-quality development level of the basin showed an upward trend, with small fluctuations during 2008-2010 and a significantly increase from 2011. Over the last decade, all five dimensions improved. Accordingly, the study put forward specific suggestions and the directions for further research: (1) Strengthen regional linkages and expand the overall opening-up level of the Yellow River Basin. (2) On the basis of protecting the ecological environment, the provinces (autonomous regions) in western China should develop characteristic industries, combining with their factor endowments. (3) Shandong and Henan Provinces should strengthen the protection of the ecological environment while developing the economy. Shanxi and Gansu Provinces should improve people’s living standards urgently. Qinghai Province and Inner Mongolia Autonomous Region need to increase investments in innovation and improve innovation capacity. Finally,the study proposed the further research directions.
黄河流域城市群高质量发展评估与空间格局分异
[J].
High-quality development assessment and spatial heterogeneity of urban agglomeration in the Yellow River Basin
中国省际经济高质量发展的测度与分析
[J].
A measurement of China's provincial economic high quality development
全国地级以上城市经济高质量发展测度与分析
[J].
Measurement and analysis of high-quality economic development of China's cities at prefecture level and above
晋陕蒙地区市域新旧动能转换过程与分异机制
[J].
DOI:10.18306/dlkxjz.2023.02.007
[本文引用: 1]
科学认知晋陕蒙地区新旧动能转换格局、过程与机制,是缩小区域发展差距,实现晋陕蒙地区高质量发展的迫切需求。论文在构建区域新旧动能转换理论分析框架的基础上,以推进区域协调高质量发展为导向,从动力、制度、结构和方式4个维度,研究2005—2019年晋陕蒙地区市域新旧动能转换过程与时空分异机制。结果表明: ① 晋陕蒙地区新旧动能转换水平呈现先波动下降后快速上升的演化趋势,市域间新旧动能转换差距逐渐扩大;② 晋陕蒙地区新旧动能转换水平整体较低,在地理空间上呈现以省会城市为核心的“核心—外围”结构,新旧动能转换优势区和领先区以省会城市为核心呈“点状分布”,滞后区和中等区在非省会城市“广泛分布”;③ 晋陕蒙地区新旧动能转换的空间负相关性明显,表现出“冷点集聚、热点离散”的空间分异特征,市域间新旧动能转换的良性互动机制尚未形成;④ 晋陕蒙地区新旧动能转换地域分异是多重要素综合作用的结果,人力资本、城市规模和信息化水平是区域新旧动能转换的核心驱动因子。研究认为培育创新人才、增强创新资源集聚与转化能力和加强信息化建设是促进晋陕蒙地区新旧动能转换、推动区域协调高质量发展的关键路径。
Process and differentiation mechanism of old-new growth driver conversion in the Shanxi-Shaanxi-Inner Mongolia region at city scale
DOI:10.18306/dlkxjz.2023.02.007
[本文引用: 1]
Scientifically identifying the pattern, process, and mechanism of the old-new growth driver conversion in the Shanxi-Shaanxi-Inner Mongolia region is an urgent requirement for narrowing the regional development gap and achieving high-quality development in the region. On the basis of constructing a theoretical framework for regional old-new growth driver conversion and with the aim of promoting regional coordinated high-quality development, this study examined the process of old-new growth driver conversion and the spatiotemporal differentiation mechanism in the Shanxi-Shaanxi-Inner Mongolia region at the city scale in 2005-2019 from the four dimensions of driving force, institution, structure, and mode. The results show that: 1) The level of old-new growth driver conversion in the Shanxi-Shaanxi-Inner Mongolia region showed a trend of first fluctuating and decreasing and then rising rapidly, and the gap of old-new growth driver conversion between cities is gradually widening. 2) The overall level of old-new growth driver conversion in the region is low, showing a core-periphery structure spatially, with the provincial capital cities as the cores. The advantageous and leading areas showed a dotted distribution pattern with provincial capital cities as the cores, and the lagged and medium-level areas are widely distributed in non-provincial capital cities. 3) The negative spatial correlation of old-new growth driver conversion in the region is obvious, showing the spatial differentiation characteristics of cold spot agglomeration and hotspot dispersion, and a health interaction mechanism of old-new growth driver conversion between cities has not yet been formed. 4) The geographical differentiation of old-new growth driver conversion in the Shanxi-Shaanxi-Inner Mongolia region is the result of the comprehensive action of multiple elements, and human capital, urban scale, and the level of informatization are the core driving factors. This study indicates that cultivating innovation talents, enhancing the ability of agglomeration and transformation of innovation resources, and strengthening informatization development are the key paths to promoting the old-new growth driver conversion and coordinated and high-quality development in the region.
Do environmental target constraints of local government affect high-quality economic development? Evidence from China
[J].DOI:10.1007/s11356-023-26363-0 [本文引用: 1]
中国海洋经济高质量发展评价与影响因素研究
[J].
DOI:10.13249/j.cnki.sgs.2022.04.010
[本文引用: 1]
科学评价海洋经济高质量发展水平是准确把握新时代背景下海洋经济高质量发展的关键环节。基于面板、门槛、贝叶斯等多指标评价模型,考虑指标时效性研究与内在逻辑联系,以海洋经济高质量发展的前提-路径-目的为分析框架,评价2007—2017年中国沿海11省市海洋经济高质量发展水平和区域差异,分析其影响因素及优化路径选择等。结果表明:① 通过指数测算和综合分析,沿海11省市海洋经济高质量发展情况差异较大。从高质量发展前提来看,各省市发展稳定,基础水平呈明显的3个梯队;从高质量发展路径来看,各省市差异较大,上海优势明显,天津与广东有一定的优势,广西、海南需要注重实力与稳定性的共同提升,其他省市发展需要注重稳定性;从高质量发展目的来看,各省市发展较不稳定,实现结果差异小,没有明显的梯队形成,但广东省与浙江省有显著的提升趋势。② 海洋经济创新驱动对实现海洋经济高质量发展目的呈“V”字型影响,目前创新驱动对中国海洋经济高质量发展影响程度最大,潜力较大。③ 海洋经济发展结构优化对实现海洋经济高质量发展目的呈“U”字型影响,目前结构优势红利尚不明显,需推进结构优化向下一个门槛跨越。④ 海洋经济发展效率提升对实现海洋经济高质量发展目的具有正向的显著影响,其发展基础好,潜力最大。⑤ 海洋经济市场环境优化对实现海洋经济高质量发展目的呈现先增加后减少的正向影响趋势,目前红利不明显,需推进市场环境优化向第三门槛跨越。
Evaluation and influencing factors of high-quality development of marine economy in China
DOI:10.13249/j.cnki.sgs.2022.04.010
[本文引用: 1]
Scientific evaluation of the level of high-quality development of the marine economy is the key link to accurately grasping the high-quality development of the marine economy in the context of the New Era. Based on the multi-indicator evaluation models such as panel, threshold, and Bayesian, the article considers the study of the timeliness of indicators and the internal logical connection. It takes the premise-path-the purpose of high-quality development of the marine economy as the analytical framework to evaluate the level and regional differences of high-quality development of marine economy in 11 coastal provinces and cities in China from 2007 to 2017, to analyze its influencing factors and optimize the path selection, etc. The results show that: 1) Through index measurement and comprehensive analysis, the high-quality development of the marine economy in 11 coastal provinces, municipalities and autonomous varies greatly. From the premise of high-quality development, the provinces and cities are stable in development. The basic level is in three distinct echelons; from the path of high-quality development, there are great differences among provinces and cities, Shanghai having the strongest and most stable capacity, Tianjin and Guangdong having stronger and more stable capacity, Guangxi and Hainan having poor and less stable capacity, others having poor but relatively stable capable. From the perspective of high-quality development purposes, the development of provinces and cities is more unstable, achieving minor differences in results. There is no obvious echelon formation, but Guangdong and Zhejiang have a significant trend of improvement. 2) The innovation-driven marine economy has a ‘V’ shape impact on achieving high-quality development of the marine economy. At present, the innovation drive has the most significant impact on the high-quality development of China's marine economy and has greater potential. 3) The optimization of marine economic development structure has a ‘U’ shape impact on the realization of high-quality development of the marine economy. Currently, the structural advantage dividend is not yet obvious, and it is needed to promote structural optimization to cross the next threshold. 4) The improvement of marine economy development efficiency has a positive and significant impact on realizing the purpose of high-quality development of marine economy, and its development foundation is good and has the greatest potential. 5) The optimization of the marine economic market environment presents a positive influence trend of increasing first and then decreasing for the purpose of achieving high-quality development of the marine economy. The market environment dividend is not obvious at present, so it is necessary to push the optimization of market environment to the third threshold.
东北沿海经济带与东北亚区域发展研究
[J].
Research on northeast China coastal economic belt and northeast Asia regional development
