

交通网络承载着城市间大量的人口和物质要素流动,对引导和优化区域发展的空间秩序具有重要意义[1]。依托公路、铁路等路网系统进行空间运输的客流和货流,是交通流要素的具体表征,也是城市空间相互作用和社会经济联系强弱的直接体现[2]。相关研究表明,中国客货流集散主要经由公路网络[3],而相比普通公路,高速公路连续性更好、通行效率更高,在中国交通强国建设和基建提速背景下,高速公路逐渐承担着大量的交通运输需求,在旅游和通勤等日常人口流动、货物周转集散、资源跨区配置等领域发挥基础性作用[4-5]。探索高速公路交通流的时空格局,揭示高速公路客流和货流的驱动机理,对于认知区域经济社会结构的空间关联规律、丰富交通地理学空间运输理论等具有学术价值,对于交通运输业结构优化和高质量发展亦具有现实意义。
从数据上看,交通流研究数据日趋多元化,在航空流领域包括国际航空运输协会、飞常准、全球航空数据服务商OAG(official airline guide)等平台班次数据[8,15];铁路流领域以往多利用12306列车时刻表数据[16],为解决该数据与实际铁路客流量的信息偏差,有研究基于中国国家铁路集团有限公司的订票数据构建真实铁路流网络[17]。而由于数据可获取性较低,公路流研究稍滞后于航空流和铁路流。随着信息科技发展,大数据挖掘技术日新月异,为公路流研究带来新的机遇[18]。已有学者利用汽车服务网站运营数据、高德地图和百度地图数据等探索公路交通流时空变化规律[19⇓-21],但受数据平台限制,相关研究多存在车辆样本不够全面、客货车类型无法细分等问题。近年来,新型基础设施建设(以下简称“新基建”)逐渐成为推动中国新阶段经济社会高质量发展的重要领域[22]。新基建主要包括信息基础设施、融合基础设施、创新基础设施三方面,其中融合基础设施即利用5G网络、大数据技术等支撑传统基础设施完成转型升级。在交通领域的典型代表为高速公路电子不停车收费(ETC)门架建设和联网收费系统(online toll collection system)的应用[23]。该系统在提升高速公路收费结算效率的同时,依托强大的车流信息存储处理功能,为刻画高速公路客流与货流分布提供了新的数据源,也为交通空间联系规律认知提供了新的视角。目前已有研究基于高速公路联网收费大数据探索公路流的距离衰减规律[24]、城市网络空间结构和组织模式[5]等,从流数据挖掘和网络分析等方面为本文奠定了方法基础。
从交通流影响因素上看,目前已有学者关注到经济因素[25]、人口因素[12,14]、产业发展因素[23]和交通因素[27]等对客货流的影响。在经济领域,地区生产总值,尤其是第三产业产值,以及投资和消费规模等被认为是影响区际高速公路联系的重要因素[25];在人口维度,基于地理探测器、地理加权回归(geographical weighted regression,GWR)模型和普通线性回归方法的实证研究均表明,区域人口规模,尤其是常住人口规模显著影响高速公路交通流量[12,14,25];在交通方面,研究成果较为丰富,相关学者从汽车保有量、基础设施建设水平(公路里程和密度)等多角度探索了公路流影响机制[25,27]。上述成果为本文提供了指标选择参考,然而对于高速公路交通流形成机理问题,学界尚未有统一定论,尤其是客流与货流影响因子的差异性等仍待进一步探索。
综上,本文聚焦高速公路交通流的时空格局与形成机理问题,针对传统研究中空间分析精度较低、时间尺度研究缺乏、客货类型难以细分等不足,将基于广东省高速公路联网收费系统的多尺度O-D(origin-destination)交通流大数据,采用大数据挖掘、GIS空间分析等方法,在路段尺度(<10 km)上分类刻画高速公路客车流(小汽车、小巴、中巴和大巴)、货车流(轻型货车、中型货车和重型货车)的时空分布格局,并利用岭回归方法探索影响高速公路交通流的主要因素,识别客货流关键影响因子的差异性。以期拓展高速公路数字化新基建系统在地理学领域的应用,深化交通空间活动规律认知,丰富空间运输联系理论。
1 研究区域、数据与方法
1.1 研究区概况
研究区为广东省,地处中国南部沿海,由21个地级市组成,其中有9个地市为粤港澳大湾区的重要组成部分。广东省经济发达、人口稠密,是中国交通运输规模最大、基础设施路网最完善的省份之一。2022年,全省地区生产总值12.91万亿元,常住人口约1.3亿。从运输结构上看,广东省交通运输方式长期以公路为主导,截至2022年底,广东省公路货运量24.25亿t,占全省货运量的66.6%,占全国公路货运总量的6.5%;公路客运量2.37亿人次,占全省客运量的49.9%,占全国公路客运总量6.7%。广东省高速公路是省内综合交通运输体系的组成部分,也是中国华南地区重要的交通网络系统。2022年12月31日,广连高速花都至从化段、宁莞高速潮州东连接线等项目完工后,广东省高速公路通车总里程达1.1万km,连续9年位居全国第一,车道总里程超5.7万km。2022年广东省高速公路收费站出口车流总量超22亿辆次,亦居全国第一位。随着高速公路网络不断完善,内联外通、便捷高效的现代化交通运输体系已现雏形,推动广东交通强省建设走上快速路。
1.2 数据来源与预处理
本文的基础数据为广东省高速公路联网收费系统大数据。2020年1月起全国高速公路联网收费系统开始执行“分段计费模式”,即对高速公路进行分段,在每一个计费路段都设有收费门架(也称“龙门架”),收费门架会记录该路段的车辆信息(图1),汇总形成联网收费数据库。数据库中覆盖车辆类型、行驶路径、上下高速时间等辅助收费结算的海量信息,通过大数据分析技术可将该信息转化为多空间尺度O-D车流数据(路段尺度、地市尺度等)、多类型机动车轨迹数据(客车、货车)、多时间尺度车流变化数据(时刻至时段)等,实现交通车流数字化。根据研究需求,同时避开春节、清明节、劳动节和国庆节4个高速公路免费节假日,本文获取了2021年9月路段和地市两种空间尺度的O-D车流数据。前者包括高速公路门架记录的1247个计费路段中84万条车流数据信息,统计车流量约5591万辆;后者为广东省各地市的日均进出车流量。
图1
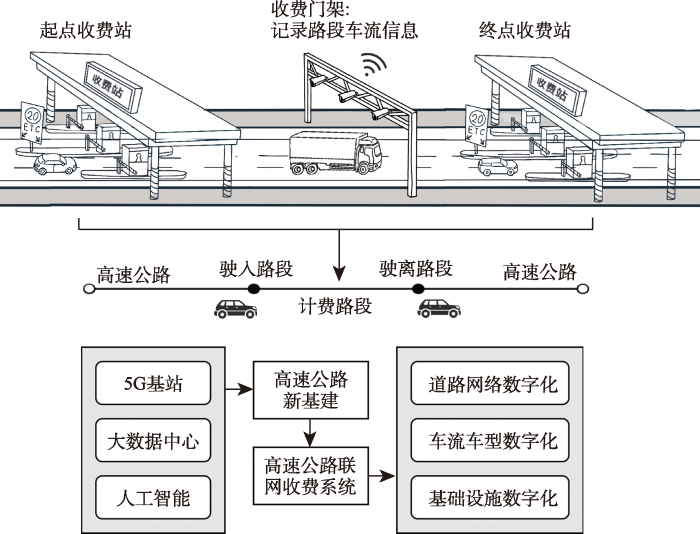
图1
高速公路新基建工程——联网收费系统原理示意图
Fig.1
Schematic diagram of expressway new infrastructure project: online toll collection system
此外,本文通过大数据分析方法与计算机技术对数据进行清洗、预处理。具体步骤包括:① 数据清洗。去除上下高速匝道数据等冗余项。② 数据归并分类。根据研究需要,对客车、货车等进行分类。③ 数据空间匹配。为便于路段O-D交通流与ArcGIS中高速公路矢量数据的空间匹配,首先需要建立序列规则,对路段O-D交通流数据重新排序;其后叠加高速公路网络矢量图、广东省行政区划矢量图和收费站点矢量图等对所有路段进行空间分割,最后链接起空间路段和车流信息。
1.3 研究方法
1.3.1 交通流计量模型
根据《收费公路车辆通行费车型分类》行业标准(JT/T489—2019),高速公路车辆类型可划分为10类,其中客车4类、货车6类(表1)。本文基础数据为高速公路联网收费数据,即遵循上述分类标准存储于联网收费系统的数据。顾及科学性和可释性,本文借鉴中国客车网(
表1 广东省高速公路机动车分类
Tab.1
| 客车 | 货车 | |||||
|---|---|---|---|---|---|---|
| 类别 | 收费分类 | 本文分类 | 类别 | 收费分类 | 本文分类 | |
| I类 | ≤9座 | 小汽车 | I类 | 2轴(车长<6 m,最大允许总质量<4500 kg) | 轻型 | |
| II类 | 10~19座 | 小巴 | II类 | 2轴(车长≥6 m,最大允许总质量≥4500 kg) | ||
| III类 | 20~39座 | 中巴 | III类 | 3轴 | 中型 | |
| IV类 | ≥40座 | 大巴 | IV类 | 4轴 | ||
| V类 | 5轴 | 重型 | ||||
| VI类 | 6轴 | |||||
由此建立交通流计量模型如下:
式中:Fr为路段r上的车流量,Fr(pas)为路段r的客车流,Fr(fer)为货车流;Pr1、Pr2、Pr3、Pr4分别为路段r上小汽车、小巴、中巴和大巴车流量;Fr1、Fr2、Fr3分别为路段r上轻型、中型和重型货车流量。此外,在广东省联网收费系统中,高速公路沿线的收费门架会对同一辆车,沿行驶方向进行连续多次记录,因此路段O-D车流仅代表特定时段内,驶入、驶离该路段区间的车流,无法进行求和以分析整体路网的车流特征。本文在统计所有路段车流量后,取其各项平均值,对广东省高速公路交通流进行时间尺度的横向对比。在此引入变量F指代特定时段内路网平均车流量,即高速公路所有路段车流量的平均值,公式如下:
式中:n为路段数量,在本文中取1247。
1.3.2 岭回归分析
式中:
式中:y为被解释变量,在本文中指高速公路交通流量;xi为自变量,即影响高速公路交通流的各项因素;ρi为自变量的参数;ρ0为截距;
2 广东省高速公路交通流时空分布格局
2.1 高速公路交通流空间分布格局
2.1.1 基于路段尺度的交通流空间分布格局
(1) 高速公路交通流整体空间分布特征
整体上看,广东省高速公路机动车小型化、轻量化特征显著。其中高速公路客运结构较为单一,旅客出行对小汽车的依赖性较强,巴士公共交通出行分担率不高,表现为小汽车路段平均车流量为3877辆,占据车流总量的69.5%和客车流量的97.8%,而小巴、中巴与大巴车的路段平均车流量共89辆,在客车中占比仅2.2%。高速公路货运结构中轻型货车占据主导,其路段平均车流量为958辆,占比货车流量的59.5%;其次为中型货车,路段平均车流量为500辆,占比货车流量的31.1%。广东省高速公路上的重型货车数量较少,路段平均车流量仅152辆。
依据自然断点法将全类型车流量数值分为5级,可视化结果如图2。广东省高速公路交通流空间分布特征如下:① 车流量较高的路段集中在珠三角城市群,以广州环城高速为中心,向外围尤其是珠三角城市群东线方向扩散。此外,车流量高值路段分布范围相对较小,集中在广州市、佛山市、东莞市和深圳市等,上述区域经济发达,人口集中,且路网密度较高。车流量低值路段广泛分布在粤北、粤东和粤西。② 车流量较高的路段多属于国家级高速公路,尤其是广州段和深圳段,如G0423乐广高速(广州段)、G0421许广高速(广州段)和G55二广高速(广州段);G15沈海高速(深圳段)和G4京港澳高速(广州至深圳段)等。车流量低值路段集中于区域北部和沿海的几条横向省级高速公路,如S14汕湛高速(肇庆至清远段)、S32西部沿海高速等;区域东、西部的几条纵向省级高速公路,如S6广龙高速(河源段)、S11大潮高速、S59怀阳高速等。
图2
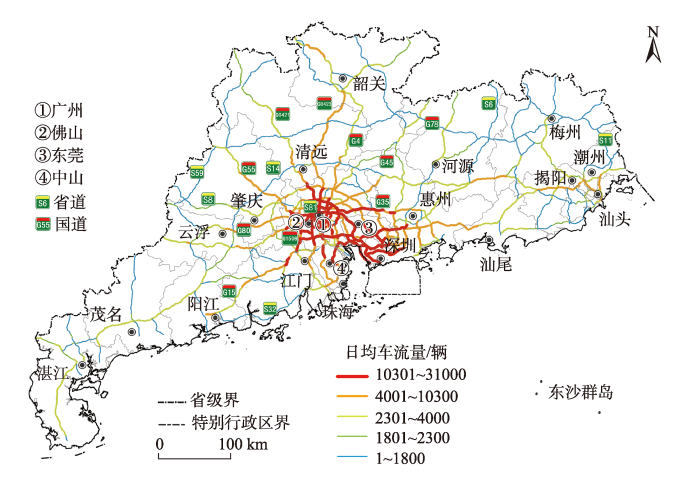
图2
广东省高速公路交通流的空间分布格局
注:本图基于自然资源部标准地图服务网站下载的审图号为GS(2019)3333号的标准地图制作,底图无修改。下同。
Fig.2
Spatial distribution pattern of expressway traffic flows in Guangdong Province
(2) 客车流与货车流的空间分布差异性
广东省高速公路客车流空间格局显示(图3),珠三角城市群成为省内主要的小型客车集聚区,中大型客车则以“高速公路内环”——S81广州环城高速为核心向外围扩散。具体而言,小汽车、小巴车流量高值路段存在明显的空间集聚特征,表现为珠三角城市群车流密集,外围粤东西北区域车流普遍较低。中巴和大巴的空间分布格局呈差异化特征,中巴车流量高值路段除珠三角外,沿G15沈海高速向西南沿海方向扩散,沿G35济广高速和G80广昆高速向东西两侧扩散;大巴车流量高值路段在此基础上跨越范围更广,且沿G0421许广高速向西北方向延伸,呈现以广州环城高速为核心,G15、G0421、G80和G35等国家级高速公路为轴线的放射状空间格局。
图3
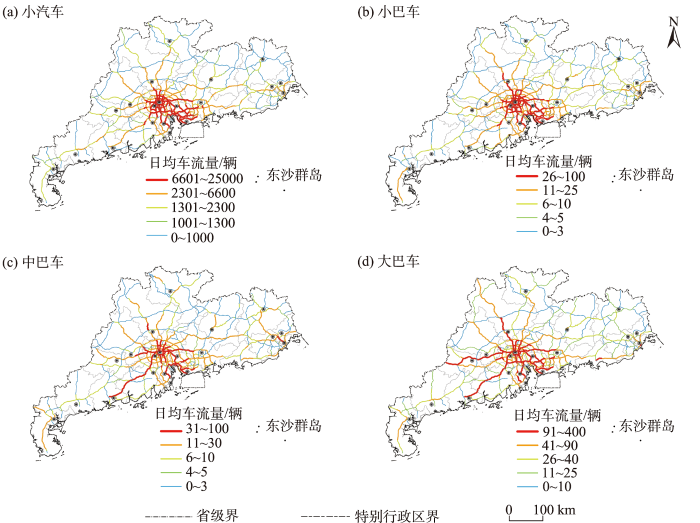
图3
广东省高速公路客车流的空间分布格局
Fig.3
Spatial distribution patterns of expressway passenger flows in Guangdong Province
广东省高速公路货车流空间格局显示(图4),车型规格(载货规模)越小,货车空间运输路径越集中;此外,“高速公路外环”——G1508广州绕城高速以内城区成为中重型货运“空心区”。具体而言,轻型货车空间分布格局和小汽车较为相似,车流量高值路段分布在以广州、深圳为核心的珠三角城市群,城市群外无明显高值集聚路段,表明广东省轻型货车多服务于珠三角城市群内短途货物运输。与之相比,中型货车呈现差异化的空间分布格局,在珠三角城市群之外出现了长距离、连续的车流量高值路段,如纵贯粤北的G0423乐广高速、与乐广高速并行的G4京港澳高速,全路段车流量普遍高于800辆,G78汕昆高速(粤东段,连接梅州与潮汕地区)车流量亦相对较高,该路段也是汕昆高速少有的车流密集路段。同时,广州绕城高速以内区域货车流开始减少。重型货车车流量高值路段在中型货车的基础上向湖南、广西方向扩散,形成以广州绕城高速为核心,以G0423乐广高速、S8广佛肇高速和G55二广高速等为轴线的重型货运通道,而广州绕城高速以内的广州市和佛山市城区范围内重型货车相对较少。
图4
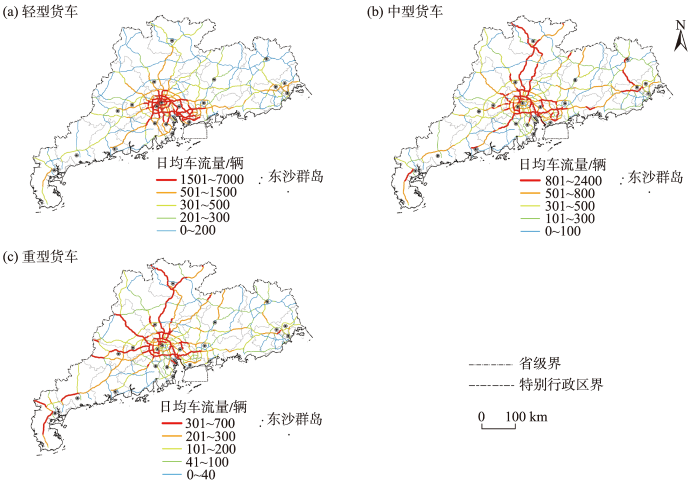
图4
广东省高速公路货车流的空间分布格局
Fig.4
Spatial distribution patterns of expressway freight flows in Guangdong Province
2.1.2 基于地市尺度的交通流空间分布格局
地市尺度上,广东省高速公路交通流呈现“广深双核—莞佛两翼”的空间分布格局(图5)。高速公路全类型车流、客车流的空间分布格局较为一致,车流密集区均分布在广州市、深圳市这两个重要的高速公路交通枢纽,形成双核心模式。车流次密集区为邻近广深的东莞市、佛山市,珠三角城市群以外地市车流量均相对较少,而汕头市则成为粤东西北少数车流量相对密集的地市之一。货车流也以广深两市为核心车流密集区,而车流次密集区则从“莞佛惠”延伸至清远市、江门市,尤其清远市,成为广东省与内陆省份之间的重要货运门户。货车流在粤东地区的“梅揭汕”形成了单独的车流密集区,梅州市作为“广东—福建—江西”三省交界处,成为粤东地区的货运枢纽。此外,地处珠三角城市群的珠海市,其各类车流量均相对较低。
图5

图5
地市尺度下广东省高速公路交通流的空间分布格局
Fig.5
Spatial distribution patterns of expressway traffic flows in Guangdong Province at the prefecture level
2.2 高速公路交通流时间变化趋势
广东省高速公路车流整体上随时间推移呈“驼峰曲线”态势(图6),其“双高峰”分布在上午9:00和下午17:00,且17:00为全天“最高峰”,路段平均车流量为2375辆;“次高峰”9:00的路段平均车流量为2180辆。“双高峰”之间的车流量“相对凹谷”为中午12:00。此外,广东省高速公路全天路段平均车流量“最低谷”出现在凌晨3:00,车流量仅327辆,其相邻时间段1:00~5:00,车流量均相对较少。
图6
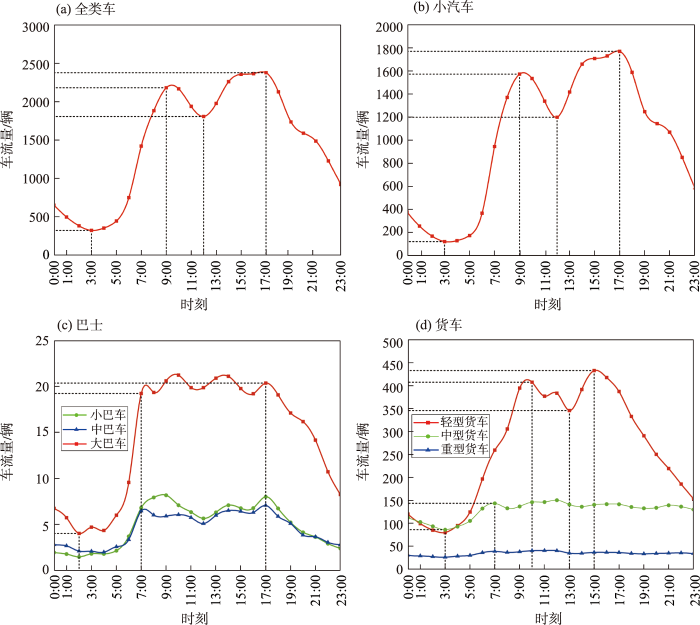
图6
广东省高速公路交通流的时间变化趋势
Fig.6
Temporal variations of expressway traffic flows in Guangdong Province
分类型看,在广东省高速公路客车流中,小汽车流对时间变化的敏感度最高,其日内车流变动趋势和上述全类车基本一致,均呈“驼峰曲线”。小巴和中巴车流量均相对较低,且车流量日内浮动较小,随时间变动趋势大体相同;大巴车流量在早上6:00~7:00时段内迅速增加1倍,且7:00~18:00(白天时段)路段平均车流量均相对较高,未出现明显的午间车流回落现象。在广东省高速公路货车中,载货规模越大,日内车流量越为平稳,对时间的敏感性及变化响应最弱。具体而言,高速公路货车流随时间变化的趋势可归纳总结为以下3种:① 驼峰曲线型。如轻型货车,其车流日变动趋势与全类车大致相同,但峰谷更为紧凑,全天“最高峰”提前至下午15:00,路段平均车流量超过400辆,“次高峰”延迟至上午10:00,“相对凹谷”延迟至下午13:00,而全天“最低谷”同样在凌晨3:00,路段平均车流量低于80辆。② 睡眠曲线型。该曲线的拐点分布与人类正常睡眠时间类似,中型货车属于该种类型。以早上7:00为界,7:00~23:00路段车流量普遍较高,无明显高值低谷;而23:00以后车流量开始减少,至凌晨3:00降至最低。③ 平稳均衡型。如重型货车,全天24 h车流量无明显变化,路段日均车流量稳定在25辆左右。
3 高速公路交通流影响因素分析
3.1 高速公路交通流影响因子的选择
本文从经济发展、人口规模、产业发展、消费水平、基础设施建设、交通发展6个维度选取相关变量,构建高速公路交通流影响因子体系(表2)。因变量即高速公路交通流量,即进出各地市的车流总量(包括客车、货车流量)。自变量体系中,地区生产总值是衡量城市经济规模的常用指标,经济发展会提高交通基础设施的供给能力[30],并刺激客货运输需求。相比常住人口指标,接待过夜旅游者人数能有效反映旅游客运需求。旅游人数越多,交通客运需求相应增加,城市交通客流愈加频繁[31]。工业总产值、旅游业及服务业收入水平是表征第二产业、第三产业发展的重要指标。有研究表明,产业集聚发展可促使区域构建密集而丰富的交通基础设施[32]。近年来消费逐渐成为刺激区域间交通流动的强大动力[33],因此,选取社会消费品零售总额用以评估城市消费水平。此外,本文基于相关理论成果[25],以高速公路路网密度指标衡量区域基础设施建设水平。在交通发展维度选择5项指标,其中客货车保有量和客货运量直接影响交通流量;城市交通运输业固定资产投资则影响路网建设与维护、交通配套设施建设等[34]。
表2 高速公路交通流影响指标体系
Tab.2
| 一级指标 | 变量表示 | 二级指标 | 一级指标 | 变量表示 | 二级指标 |
|---|---|---|---|---|---|
| 经济发展 | GDP | GDP(亿元) | 基础设施建设 | HD | 高速公路路网密度 |
| 人口规模 | Tri | 接待过夜旅游者人数(万人次) | 交通发展因素 | TFAI | 交通运输业固定资产投资额(亿元) |
| 产业发展 | Ind | 工业总产值(亿元) | PC | 载客汽车保有量(辆) | |
| Tou | 旅游业收入(亿元) | FC | 载货汽车保有量(辆) | ||
| Ser | 规模以上服务业营业收入(亿元) | PV | 客运量(万人次) | ||
| 消费水平 | RSCG | 社会消费品零售总额(亿元) | FV | 货运量(万t) |
3.2 高速公路交通流影响因子定量分析
图7

图7
高速公路交通流影响因素岭迹图
Fig.7
Impact factor ridge traces of expressway traffic flows
表3 岭回归效度检验
Tab.3
| 分类 | k | R2 | 调整R2 | F |
|---|---|---|---|---|
| 全类车 | 0.114 | 0.987 | 0.969 | 52.519 (P<0.001) |
| 客车 | 0.114 | 0.987 | 0.968 | 51.009 (P<0.001) |
| 货车 | 0.114 | 0.985 | 0.962 | 43.534 (P<0.001) |
基于全类型车流回归结果(表4),工业总产值、高速公路路网密度、客运量及货运量未能通过显著性检验,货车保有量通过10%的显著性水平检验,其余指标均通过1%的显著性水平检验,且均与高速公路交通流呈正相关。在客车流的回归结果中,工业总产值、高速公路路网密度、货车保有量、客运量及货运量未能通过显著性检验,交通运输业固定资产投资额通过5%的显著性水平检验,其余指标均通过1%的显著性水平检验,且均与高速公路客车流呈正相关。在货车流的回归结果中,工业总产值、高速公路路网密度、旅游业收入、规模以上服务业企业营业收入及客运量未能通过显著性检验,接待过夜旅游者人数通过10%的显著性水平检验,社会消费品零售总额、客车保有量、货车保有量通过5%的显著性水平检验,其余指标均通过1%的显著性水平检验,且均与高速公路货车流呈正相关。
表4 高速公路交通流影响因素岭回归结果
Tab.4
| 变量 | 全类车 | 客车 | 货车 | |||||
|---|---|---|---|---|---|---|---|---|
| 标准化系数β | P | 标准化系数β | P | 标准化系数β | P | |||
| GDP | 0.077 | 0.001*** | 0.080 | 0.001*** | 0.067 | 0.005*** | ||
| Tri | 0.112 | 0.002*** | 0.124 | 0.001*** | 0.054 | 0.091* | ||
| Ind | -0.001 | 0.972 | -0.018 | 0.676 | 0.057 | 0.231 | ||
| RSCG | 0.118 | 0.004*** | 0.126 | 0.003*** | 0.077 | 0.042** | ||
| Tou | 0.099 | 0.001*** | 0.112 | 0.001*** | 0.041 | 0.113 | ||
| Ser | 0.115 | 0.005*** | 0.134 | 0.002*** | 0.033 | 0.354 | ||
| HD | 0.079 | 0.159 | 0.075 | 0.183 | 0.103 | 0.101 | ||
| TFAI | 0.110 | 0.008*** | 0.099 | 0.015** | 0.155 | 0.002*** | ||
| PC | 0.188 | 0.004*** | 0.182 | 0.005*** | 0.105 | 0.044** | ||
| FC | 0.078 | 0.087* | 0.072 | 0.115 | 0.114 | 0.024** | ||
| PV | 0.018 | 0.711 | 0.018 | 0.713 | 0.029 | 0.586 | ||
| FV | 0.052 | 0.202 | 0.034 | 0.401 | 0.220 | 0.003*** | ||
注:***、**、*分别表示通过1%、5%、10%的显著性水平检验。
综合时空分析和岭回归结果,归纳广东省高速公路交通流形成机理。① 全类型车流、客车流的影响因素存在共性,均受服务业发展、城市消费水平和旅游规模等影响,表明现阶段第三产业发展是影响广东省高速公路运输规模的核心因素。广东省高速公路客运主要满足中短程旅游、城市群区域居民跨市通勤和商务出行等方面需求。随着乡村旅游和海岛旅游的兴起,广东省东西部沿海区域、粤北山区等成为珠三角的“后花园”,高速公路凭借效率高、耗时少的特点成为居民短线旅游的主要选择。如G15沈海高速(广州至江门段),在上下川岛屿旅游吸引下,成为广东省典型的连续型客流密集路段。同时,在珠三角一体化发展助推下,城市群内部各地市服务业(商业服务、金融贸易、快递物流等)往来愈加频繁,高速公路也成为城市之间经济社会联系的重要渠道。② 工业总产值在所有回归分析中均未通过显著性检验,表明工业发展水平与高速公路全类型车流、客流和货流的关联性均较小。在后工业化时期,工业集聚和生产规模化等需求不再成为广东省高速公路运输业发展的主导力量。伴随着工业化发展,生产效率逐渐提高,生产要素需求和产品销量增加,该阶段中公路交通的高速化建设主要服务于企业集聚发展、工业制品高效运输等需求。而在广东省,尤其车流最密集的珠三角城市群,现处于后工业化时期,产业结构逐渐向服务业转型,消费结构从工业制成品逐渐转向服务型商品。在此背景下,较之工业,服务业发展对高速公路交通流的刺激作用更强。这一点在以江苏省为案例区的研究中也得以验证[25],江苏省与广东省服务业规模相当、经济结构相似,量化分析结果亦表明,第三产业发展因素对高速公路交通流的解释力较强,是影响江苏省交通流地域分布差异性的重要因素。③ 在货车流回归结果中,交通运输业固定资产投资额标准化系数最高,为0.155,表明资本投入对广东省高速公路货运发展具有显著推动作用。交通固定资产投资是社会经济发展的先行资本,在“新基建”发展背景下,地区的投融资能力、投资规模被认为是智慧交通基础设施发展的正向主导因素。2022年广东省高速公路完成固定资产投资近1000亿元规模,除高速路网建设外,收费门架、服务区新能源充电站等配套设施不断完善,未来发挥交通固定资产投资的“乘数效应”,打造高效便捷的数字化货运通道,成为新时期广东省高速公路运输业高质量发展的重要途径。
4 结论与讨论
4.1 结论
(1) 广东省高速公路机动车小型化、轻量化特征显著。高速公路旅客出行对小汽车的依赖性较强,巴士公共交通出行分担率不高;货运结构以轻型货车占据主导。空间分布上看,广东省高速公路交通流呈空间非均衡分布特征,交通流密集路段集中在珠三角城市群,以广州环城高速、广州绕城高速为核心“双环”,沿G0423乐广高速、G4京港澳高速等国家级高速公路,向外围呈放射状扩散。其中,客车流围绕“内环”——广州环城高速为核心向外扩散;货车流则围绕“外环”——广州绕城高速为核心扩散。地市尺度上,高速公路交通流呈现“广深双核—莞佛两翼”的空间分布格局。
(2) 时间分布上看,广东省高速公路交通流随时间变化呈“驼峰曲线”态势,其“双高峰”分布在上午9:00和下午17:00,且17:00为全天车流“最高峰”,车流“最低谷”出现在凌晨3:00。所有车型中,小汽车对时间变化的敏感度最高;轻型至重型3类货车,载货规模越大,日内车流量越为平稳,对时间的敏感性及变化响应最弱。
(3) 岭回归结果显示,广东省高速公路交通流主要受机动车保有量、社会消费水平和服务业发展等因素影响。客车保有量、服务业发展等对客车流影响较深;货车流则主要受货运量和交通固定资产投资规模影响。此外,工业发展水平、路网密度等对高速公路客货流的影响相对较弱。
4.2 讨论
基于高分辨率车流轨迹数据探索交通流的时空分布规律是交通地理学研究的前沿。在“新基建”驱动下,交通运输业逐渐迈向车流数字化、路网数字化的智慧发展之路。城市轨道交通、大数据中心、电子客票信息系统等交通新型基础设施建设,在提升交通运输便捷性、时效性的同时,亦为地理学研究带来了多源数据,为交通流规律探索引入了创新视角。高速公路联网收费系统数据具有海量性、动态性与多维性特征,能采集到车辆在高速公路路段上不间断、实时、连续的时空信息[12-13]。在以往研究基础上,本文通过大数据挖掘方法,进一步将联网收费数据的空间精度拓展到路段尺度、时间粒度细分为小时级别、车辆类型延伸至全类客货,丰富了高速公路交通流研究方法体系。相比以往研究所采用的城市之间、收费站点之间的车流数据[33],路段尺度车流更贴合机动车行驶的真实空间轨迹;较之全类车流数据汇总分析,对客运与货运机动车进行分类更有利于深入探索交通运输业和其他产业之间的关联性,对于交通流时空演变规律、交通网络结构、交通经济和环境外部性研究均具有借鉴意义。
受限于数据量级等客观原因,本文仅聚焦高速公路车流量的日内变化规律,对于车流月间变化、季度变化和年际变化等尚待进一步探索。未来将不断提升大数据处理能力,以期在高速公路交通流时空演变规律与机理研究等领域取得突破。
参考文献
多元交通流视角下的空间级联系统比较与地理空间约束
[J].
DOI:10.11821/dlxb201912005
[本文引用: 1]

交通运输联系是区域空间级联系统与城市体系结构研究的重要视角之一,而不同交通运输方式表达的级联体系结构亦存在一定的差异。为综合研究交通运输体系刻画的空间级联系统及克服单一交通方式的局限性,基于长途汽车、高铁和航班时刻表数据,比较分析了多元交通网络的空间级联体系结构及其表达的城市网络组织体系,并进一步揭示了地理空间的约束作用。研究发现:① 每种交通运输方式适合在一定的空间尺度和行政范围内刻画和表达城市网络体系结构与城市联系,公路客运受省域行政范围约束,高铁联系具有廊道影响效应,航空运输体现全国和区域尺度较高层次的社会经济联系。② 从旅客直达视角分析,长途汽车与高铁的城际运输市场重叠最大,近年来长途汽车的运输市场受高铁影响明显。③ 地理空间是影响陆路交通运输和组织的重要约束因子,距离衰减效应明显;结合设施空间、行政空间和管理体制的作用,长途汽车和高铁运输在空间上形成分异的社区结构;航空运输由于具有超空间连接特性,既不遵循距离衰减规律,社区结构也并不明显。
Comparison of spatial structure and linkage systems and geographic constraints: A perspective of multiple traffic flows
DOI:10.11821/dlxb201912005
[本文引用: 1]
Transportation connection has always been one of the important perspectives of studying spatial cascading systems and urban systems. Based on the timetable data in 2018 of inter-city coach, high-speed train and aviation, this paper builds networks of the three modes of transportation in China. Through the methods of the city-pair connectivity and community detection, this paper compares the spatial structure and linkage systems of multi-traffic flow network and reveals the geospatial constraints. The research results show that: (1) Different modes of transportation are suitable for portraying urban systems on different spatial and administrative scales. Inter-city coaches are constrained by the provincial administrative boundaries. High-speed train network shows the effect of corridors especially along the main trunks. The aviation network reflects the spatial relationship at the national scale. (2) From the perspective of the direct accessibility, there is a large spatial overlap between inter-city coaches and high-speed trains, and the market of inter-city coaches is obviously squeezed in recent years. For air transport, its frequency advantage mainly concentrates on the city-pairs with a long distance. The competition and complementarity of the three modes of transportation have a great impact on the urban system and are useful for the understanding of the spatial cascading system. (3) Geographical space, infrastructure space and administrative space constraint and management system are important factors affecting the transportation networks. Inter-city coach network and high-speed train network are obviously affected by distance attenuation effects, and they present significant community structures in the two networks, but their communities have different spatial characteristics. However, air transport does not follow the constraint of distance attenuation, and there is not an obvious community structure in the network. Factors related to the passenger transport market, such as social and economic links and tourism resources, play the important roles in the aviation network structure.
新中国交通运输地理学的发展与贡献
[J].
Development and contribution of transportation geography since 1949
1978年改革开放以来中国交通地理格局演变与规律
[J].
DOI:10.11821/dlxb201910001
[本文引用: 1]
1978年改革开放以来,中国交通地理格局发生了历史性变化,理解其演变特征与规律对未来的交通建设与国土开发具有重要的启示意义。在系统梳理中国交通建设与发展历程的基础上,利用大数据和GIS等分析方法,探讨了国家交通地理格局的演变特征与空间效应,并从演进阶段、空间结构与秩序等视角系统归纳了中国交通地理格局演化的基本规律。研究发现,当前中国的交通建设已开始进入以质量提升为目标的新阶段,建设模式由早期资本驱动的“规模扩张型”过渡为创新驱动的“质量提升型”,发展方向从优先发展向综合协调发展转变;交通网络的快速建设和扩展改变了时间与空间的关系,其所营造的空间收敛与空间优势格局,与经济社会空间布局形成了耦合效应,持续推动经济社会空间结构演进,传统以发展轴线为中心的国土开发结构将逐渐转变为以大都市和城市群为中心的网络化国土开发结构;交通地理格局的演化具有显著的阶段性规律,中国当前处于系统结构完善阶段向级联秩序分异阶段过渡的时期,经济社会空间形态从轴线结构向轴—辐结构转变,初步形成了级序有致的网络体系;随着交通网络的不断成熟,宏观尺度上的各类功效空间结构与级联秩序将逐步趋向成熟与稳定,最终达到相对平衡的状态。
Evolution of transportation in China since reform and opening-up: Patterns and principles
DOI:10.11821/dlxb201910001
[本文引用: 1]
Since the reform and opening-up in 1978, historic changes have been seen in the transportation geography pattern of China. Understanding its evolutionary characteristics and regularity is significant and meaningful for future transportation construction and territory development. This paper reviewed the process of transportation construction in China and investigated the evolutionary characteristics and spatial effects of transportation geography pattern with the technologies in big data mining and GIS. In addition, the regular rules of transportation geography evolution from the aspects of stages, structures, and orders are systematically analyzed. The investigation showed that China's transportation construction has entered the stage of quality improvement. The construction mode has upgraded from scale-expanding driven by investment to quality-improving driven by innovation. The development direction has changed from "prior development" to "integrated coordinated development". The rapid growth and development of transportation networks have significantly influenced the relationship between time and space. The resulting spatial convergence and superiority pattern are coupled with economic-social distribution, which facilitates the development of the economic-social spatial structure. Consequently, territory development that is traditionally centralized by corridors has changed into the networked mode centered on metropolises and metropolitan areas. In brief, the transportation geography pattern is of evolutionary principles. China has been evolving from the stage of ordered structure to the stage of cascade-order structure. Simultaneously, the economic-social pattern has changed from the axis structure to the hub-and-spoke structure with a preliminary ordered network. As transportation networks grow and expand, China's functional spatial structure and ordered network will be gradually stabilized and balanced.
中国高速公路网的发展演化及区域效应研究
[J].
Regional impaction and evolution of express way networks in China
基于高速公路流的区域城市网络空间组织模式: 以江苏省为例
[J].
DOI:10.11821/dlyj201809014
[本文引用: 2]
在“流空间”理论的影响下,强调要素连接性和空间关联性的城市网络成为指示区域空间关系的核心视角,探讨城市网络空间结构将能为区域发展政策制定提供科学依据。以江苏省2014年日平均的高速公路流数据为依托,刻画城市网络的宏观格局与层级特征,利用社区发现算法对城市网络进行空间剖分并挖掘潜在的关联结构。研究发现:① 江苏城市网络宏观格局的空间构造呈现出类似围棋的“金角、银边、草肚皮”的分散性特征,可大致辨别内部发育出多个不同的子网络系统;② 城市节点和联系轴线具有明显的层级结构,城市等级的重要性与节点本身的社会经济属性、地理区位等具有一定的空间耦合性,轴线层级与地理距离具有明显的空间交互叠加作用;③ 社区发现算法对网络的空间剖分共识别出包括苏锡常社区、宁镇扬泰社区、通盐社区、连云港社区、宿淮社区和徐州社区等6个在空间上相连且边界清晰的“城市社区”,具有一体化效应、邻域效应、行政区效应、袭夺效应和置换效应等五个具有典型性的区域效应;④ 依据社区间的空间交互作用,可凝练出双核—多核交叉型、双核—单核交叉型、单核—多核交叉型、单核—单核集中型、双核—多点分岔型、单核—多点分散型和多核—多点分散型等7类空间关联结构。
Uncovering spatial organization patterns of regional city networks from expressway traffic flow data: A case study of Jiangsu Province, China
DOI:10.11821/dlyj201809014
[本文引用: 2]
Under the influence of the "space of flows" theory, city network with the emphasis on element connectivity and spatial relevancy has become the core perspective to indicate the regional spatial interaction. This means that researchers focus more on spatial structures of city networks, which can provide scientific basis for the policy making on regional development. Based on the average daily variation expressway traffic flow data in 2014, this article depicts the macro-patterns of city networks and its hierarchical structures, and then uses the community detection algorithm to segment the city networks and mining its potential spatial correlation structures. The results show that: (1) The characteristics of macro-patterns of city networks are dispersive, which are similar to the "gold corner, silver edge, grass belly" in Go Game, and this means that there are several sub-network systems developed in Jiangsu province. (2) The city nodes and linkage axes have presented the obvious hierarchical structures. On the one hand, the importance of the city ranks has a spatial coupling with their socioeconomic attributes and geographical locations to certain extent; On the other hand, the hierarchical characteristics of the linkage axes have obvious spatial interaction with the geographical distance. (3) Using the community detection algorithm to mining the city network in Jiangsu, six "city communities" with spatial connection and clear boundaries are identified. The communities include the Suzhou-Wuxi-Changzhou community, Nanjing-Zhenjiang-Yangzhou-Taizhou community, Nantong-Yancheng community, Lianyungang community, Suqian-Huai'an community and Xuzhou community. The spatial metaphors of the communities can be concluded in the five aspects. Firstly, trans-prefectural linkages can be formed through spatial integrated effects of metropolis regions. Secondly, cities are located in the marginal neighborhood areas in different communities and have a close connectivity, which enable themselves to be absorbed into the neighboring community due to the distance attenuation effect. Thirdly, some communities have the same boundaries with the prefecture level administrative units, which reveals that significant administrative region economy still exists in contemporary Jiangsu province. Fourthly, several cities located in the marginal areas of the prefectures and captured by the powerful center cities in the neighboring prefectures would lead themselves to be absorbed into the communities of the neighboring prefectures. Fifthly, the couple gateway cities serve as the linkages in different prefectures because of their strong strength with the surrounding areas, which would be exchanged by each other. According to the spatial interaction in paired communities, there are seven spatial interactive structures that can be divided, i.e., dual-nuclei structure inter-cross connection with polycentric structure, dual-nuclei structure inter-cross connection with monocentric structure, monocentric structure inter-cross connection with polycentric structure, monocentric structure inter-cross connection with monocentric structure, dual-nuclei structure inter-cross connection with low-level equilibration structure, monocentric structure inter-cross connection with low-level equilibration structure and polycentric structure inter-cross connection with low-level equilibration structure.
Hybridized encoding for evolutionary multi-objective optimization of air traffic network flow: A case study on China
[J].DOI:10.1016/j.tre.2018.04.011 URL [本文引用: 1]
The evolutionary mechanism of China's urban network from 1997 to 2015: An analysis of air passenger flows
[J].
基于航空和高铁流的中国城市网络格局及演化
[J].
DOI:10.13249/j.cnki.sgs.2022.03.008
[本文引用: 2]
基于2009、2014、2019年的航空、高铁时刻表数据构建出航空子网络、高铁子网络以及航空?高铁叠合网络,利用社会网络分析、主成分分析等方法得到交通综合指数,并用以对3个网络的动态演化特征进行分析。研究表明:① 航空流与高铁流视角下的城市网络形态存在显著的差异。航空运输为远距离、高等级核心城市之间的联系提供了快速通道,航空网络中构成菱形结构支点的核心城市处于动态变化的状态,随着中西部城市的崛起,网络均衡性逐步提升;高铁网络对东部和中部地区主要城市起到串联作用,网络的演化依托高铁干线的延伸,呈现由点状向廊道至带状发展的平面分布。② 网络对比分析发现高铁网络的拓展对航空网络产生挤压效应,逐渐成为1500 km范围内的主导性高速交通运输方式,促使航空运输的优势距离不断扩展;网络叠合分析发现高行政等级城市及经济发达城市占据主导位置,中西部城市崛起,东北城市衰落;整体网络呈现由点?线?面扩张发展的趋势,且胡焕庸线两侧的城市网络格局存在显著差异。叠合网络东部和中部城市联系从以航空为主导转为高铁主导,而西部城市仍以航空联系为主导。
Pattern characteristics and dynamic evolution of urban network development in China based on the comparison between high-speed rail and airline flows
DOI:10.13249/j.cnki.sgs.2022.03.008
[本文引用: 2]
This paper constructs the airline sub-network, the high-speed rail sub-network and the airline-high-speed rail composite network based on airline and high-speed rail timetable data in 2009, 2014 and 2019. Social network analysis and principal component analysis were used to obtain the comprehensive traffic index and compare the dynamic evolution characteristics of the three networks. The results show: 1) The urban network structures under the two sub-networks are different. Airline networks provide a fast connection to core cities for long-distance travel. The relevant urban network structure presents a diamond structure with four dynamic pivots. With the rise of the central and western cities, urban networks under airline networks tends to be balanced. At the same time, the high-speed rail network connects major cities in the central and eastern regions, along the development of trunk lines of high-speed rail, the urban network structure evolves from point to corridor and finally to belt distribution. 2) According to comparative analysis, it is found that the expansion of high-speed rail network has a squeezing effect on airline networks. High-speed rail has gradually become a dominant transportation mode within 1500 km. Meanwhile, the dominant travel distance of airlines has been expanded. According to the composite network analysis, high-level administrative cities and economically developed cities occupy the dominant position, the importance of cities in the central and western regions is rising, and that of cities in the northeast is declining. The urban network structure under the composite network shows a transition from point to line and finally to area development. The differences between the cities on both sides of the Hu Line as the boundary still exist. The eastern and central cities in the composite network have shifted from being dominated by airline to high-speed rail connections, while the western region is still dominated by airline connections.
Spatiotemporal impact of railway network in the Qinghai-Tibet Plateau on accessibility and economic linkages during 1984-2030
[J].
Spatial heterogeneity of ports in the global maritime network detected by weighted ego network analysis
[J].
“一带一路”背景下中欧港口航运网络的演化特征
[J].
DOI:10.18306/dlkxjz.2020.05.002
[本文引用: 1]
中国与欧洲位于欧亚大陆的东西两端,中欧的贸易畅通是“一带一路”发展的重要内容。当前,中欧经贸联系仍主要通过海运完成,中欧港口航运网络的连通是贸易畅通的保障,因此,研究中欧港口航运网络的发展演变对于认识和保障中欧贸易的畅通具有重要意义。依据近20 a的3个时间断面(1995、2005、2015年)航运数据,构建中国与欧洲各港口航线联系网络,并通过刻画港口航运网络的复杂性特征,揭示不同港口节点可达性变化的空间分异,进而从中转港体系、网络组织结构两方面探讨中欧航运网络的演化特征。研究表明:① 1995年以来,中欧航线联系的港口节点显著增加,网络覆盖范围明显扩大。2005年和2015年网络均表现出明显的小世界特征和无标度特性;不同港口航线联系的广度、深度和可达性变化差异明显,其中84%的港口可达性增强,地中海和阿拉伯海沿岸少数港口可达性减小。② 中欧航运网络的中转港体系由“V”型转变为“U”型,核心中转港出现分化、中转节点逐渐体系化,中转路径趋于多元化,网络稳定性增强。③ 中欧航运网络的轴—辐组织结构不断优化,网络运行效率明显提升,航线联系更加多元化、复杂化。中欧港口航运网络的轴—辐空间结构经历了“三角型”“均衡哑铃型”和“非均衡哑铃型”3个阶段,最终形成以上海港和鹿特丹港为主枢纽的多层次轴—辐空间组织结构。
Characteristics of change of the China-Europe port shipping network under the Belt and Road Initiative
DOI:10.18306/dlkxjz.2020.05.002
[本文引用: 1]
China and Europe are located at the east and west ends of Eurasia. The smooth flow of trade between China and Europe is an important part of the development of the Belt and Road region. At present, China-Europe economic and trade ties are still mainly maintained by sea. The connection between Chinese and European ports through shipping network is the guarantee of smooth trade. Therefore, studying the development and change of China-Europe port shipping network is of great significance for understanding and enhancing the supporting capacity of China-Europe trade links. Based on the shipping data of the past 20 years, the network of Chinese and European port routes is constructed. By portraying the complexity of the port shipping network, the spatial differentiation of the portability changes of different port nodes is revealed. Then we explored the characteristics of change of the China-Europe shipping network by the transit port system and the network organization structure. The result shows that: 1) Since 1995, the port nodes linked to the China-Europe routes have increased significantly, and the network coverage has expanded significantly. In 2005 and 2015, the network showed obvious small world and scale-free characteristics; the changes in the breadth and depth of connection and accessibility of the different ports were significantly different, with 84% of the ports being more accessible, and a few ports in the Mediterranean and the Arabian Sea showed reduced accessibility. 2) The transit port system of the China-Europe shipping network has changed from V-shaped to U-shaped. The core transit ports have become differentiated, the transit nodes have gradually become systematic, the transit paths have become more diversified, and the network stability has increased. 3) The hub and spoke structure of the China-Europe shipping network is continuously optimized, the network operation efficiency is significantly improved, and the route links are more diversified and complicated. The hub-spoke spatial model of the China-Europe port shipping network has experienced three stages of change from triangular to balanced dumbbell type and unbalanced dumbbell type, which finally formed the multi-level hub-spoke spatial organizational structure, with Shanghai and Rotterdam as the main hubs.
基于高速公路联网收费数据的江苏省交通流动特征与影响因素
[J].
DOI:10.11821/dlxb201802004
[本文引用: 4]
高速交通网络是一种十分重要的地区间联系形式,对区域空间结构的重构有着显著的推动作用。高速公路联网收费数据为从高速公路流量视角探讨区域交通流动提供了有效的数据支撑。以江苏省为案例区,以江苏省内高速公路网络2014年的收费站点间出发地—目的地(O-D)数据为支撑,探究区域交通流动特征,并运用地理加权回归(GWR)模型分析方法探讨流动的影响因素。结果表明:① 江苏省内部交通流动存在较大的不均衡性,核心节点(收费站、县域节点)主要位于江苏省南部,在空间上呈现出以核心节点为中心的放射性结构。② 流量总体上呈现距离衰减特征,空间间隔尺度越大,距离衰减规律特征越明显,且衰减规律符合幂律分布。③ 常住人口、经济发展、公路里程可有效解释县域流量分布,经济发展对各县域交通流量的影响在江苏北部地区表现的更为强烈,人口对江苏南部地区交通流量影响具有局部优势,公路里程对苏南地区存在较弱的负向影响。
Regional traffic flow and its influencing factors based on expressway network toll collection data: A case study in Jiangsu Province
DOI:10.11821/dlxb201802004
[本文引用: 4]
High-speed traffic networks, as one of the most important methods of regional linkage, play a critical role in promoting the construction of social and economic spatial structure. Expressway network toll collection provides effective data support for regional traffic flow research, from the perspective of expressway network. The paper, supported by O-D data from toll stations throughout the Jiangsu expressway network during 2014, takes Jiangsu province as an example to conduct research on the characteristics and influencing factors of regional traffic flow. The following results can be obtained: (1) The traffic flow in Jiangsu is quite unbalanced, and the core codes (toll stations and counties) are mainly located in southern Jiangsu, which show a radioactive structure with core codes as the center. (2) The characteristics of distance decay are generally shown in the vehicle flow. The longer the space distance is, the more obvious the decay regularity of distance becomes. The relationship between the vehicle flow and distance is in accord with power law distribution. (3) Permanent residents, economic distribution and expressway mileage can effectively explain regional traffic flow distribution. Specifically, economic development has the greatest influence on the traffic flow in northern Jiangsu; population has local advantages on traffic flow in southern Jiangsu; expressway mileage has a relatively weak negative influence on the traffic flow in southern Jiangsu.
江苏省高速公路的客流空间格局与网络组团结构: 基于联网收费大数据分析
[J].
DOI:10.13249/j.cnki.sgs.2021.06.009
[本文引用: 2]
依据江苏省2011年、2014年和2017年高速公路联网收费大数据,选择客车通行数据,通过构建O-D流网络和县域联系网络,揭示了客流空间格局和网络组团结构特征。研究发现,客流的空间分布呈现以市辖区收费站、省界收费站及跨江大桥收费站为高值区域的特征,整体上苏南和苏北差异显著;O-D流网络具有明显的无标度特征,组团结构表现为沿高速公路线路分布的特征;县域联系网络节点的位序-规模呈现首位分布态势,网络可以划分为8个组团,区域中心城市为核心的组团结构特征明显。基于联网收费大数据从流动性视角挖掘公路交通的客流特征与空间结构,可为动态化、精细化和定量化分析交通网络提供新的研究视角和方法工具,为有效揭示公路客流的时空规律、优化公路交通与相关设施空间布局提供科学依据。
Spatial distribution and network community structure of expressway car flow in Jiangsu Province based on big data analysis of toll collection
DOI:10.13249/j.cnki.sgs.2021.06.009
[本文引用: 2]
As an important part of modern transportation system, the huge traffic flow of expressway truly reflects the regional connection and has a profound impact on the social economy, people’s life and spatial structure. The massive expressway toll data collection is a significant support to analyse and reveal the traffic flow characteristics and the spatial structure evolution. According to the Jiangsu expressway toll collection data in 2011, 2014 and 2017, this paper selects car traffic to construct the O-D flow network and county connection network, so that the key toll stations and distribution characteristics of network degree are identified effectively, and the spatial pattern of car flow and the features of its network group structure are revealed. It is found that the spatial distribution of car flow shows a notable difference between the south and north of Jiangsu, with high-value points around the toll stations of central cities, provincial boundaries and cross-river bridges. The O-D flow network has an obvious scale-free feature, while the community structure is characterized by distribution along the expressway routes. The county connection network can be divided into 8 communities, with central cities as the cores.
区域高速公路交通流时空特征解析: 以江苏省为例
[J].
Exploring the spatial-temporal characteristic of traffic flow for Jiangsu Province expressway
DOI:10.2307/142022 URL [本文引用: 3]
中国客运航空网络节点结构及其外部性因素的空间异质性研究
[J].
DOI:10.3969/j.issn.1004-9479.2022.05.2020614
[本文引用: 1]
选择2018年中国民航旅客吞吐量排位前60的机场所在城市作为网络节点、节点间的航线联系作为边构建中国客运航空网络,追踪采集60个机场2018年11月12—18日一周内共计126 064条国内航班数据。运用复杂网络分析方法、多目标加权求和模型搭建了中国客运航空网络节点结构评估体系,运用探索性空间数据分析方法、地理加权回归模型对网络外部性因素的空间异质性进行测度。研究发现:中国客运航空网络小世界网络特征显著,节点度较高的城市在网络中重要程度突出。城市综合实力与客运航空网络节点等级具有呼应性,节点外部性因素指数分布呈现长尾状。经济总量、服务业、潜力系统3个外部性因素对航空运输系统的影响在不同城市空间上表现出集聚特征,主要在华北、华东地区热点集聚,在西部、东北地区冷点集聚。华北、华中等经济相对发达区域的外部性因素对航空运输系统的支持力度更为突出,而东北、中部、西南等地区则较为薄弱。研究将客运航空网络结构特征与支持和反映其结构的城市综合实力差异联系起来,研究网络外部性因素的航空网络连接机制,为网络的稳定和优化提出理论依据。
Study on node structure and spatial heterogeneity of external factors in China's passenger aviation network
DOI:10.3969/j.issn.1004-9479.2022.05.2020614
[本文引用: 1]
In this paper, the top 60 airports in China's civil aviation passenger throughput ranking in 2018 are selected as the network nodes, and the route connection between nodes is taken as the edge to construct China's passenger aviation network, which is tracking and collecting the data of 126 064 domestic flights in 60 airports in China from November 12 to 18, 2018. The complex network method and multi-objective weighted sum model are used to build the node grade evaluation system. The spatial heterogeneity of external factors of China's passenger aviation network is measured by using the exploratory analysis method and geographic weighted regression model. It is found that: the small world network characteristics of China's passenger aviation network are prominent, and the cities with high node degree play an important role in the network; urban nodes have a high degree of correspondence between the scale of the aviation network and the comprehensive development of cities; moreover, the comprehensive arrangement of external factors of passenger air network nodes presents a long tail shape. Economic aggregate, service industry and potential system have certain agglomeration characteristics on the development of air transport system in different urban spaces, which is mainly concentrated in hot spots in East China, and also in cold spots in West and Northeast China. The economic aggregate, service industry and development potential of North China and Central China are more prominent in supporting the air transport system, while the northeast, central and southwest regions are relatively weak. This paper studies the connection mechanism of aviation network external influencing factors, so as to put forward the theoretical basis for the stability and optimization of the network.
中国高铁网络演化引导的短时旅游空间扩展效应
[J].
Spatial expansion effect of short-term tourism based on the development of Chinese high-speed rail
Empirical analysis of scaled mixed itinerary-size weibit model for itinerary choice in a schedule-based railway network
[J].DOI:10.1080/23249935.2021.1912206 URL [本文引用: 1]
交通发展区位测度的理论与方法
[J].
DOI:10.11821/dlxb201804006
[本文引用: 1]
交通建设所引致的区位条件改善对促进各类生产要素集聚和地方经济发展,重塑区域空间结构具有重要作用,因此,交通区位的测度一直是地理学的核心议题之一。随着交通网络的不断发展与完善以及新技术、新模式、新因素和新业态的出现,地方传统区位条件被重构,个人出行理念和模式发生了一系列变化。① 交通区位的测度逐渐从依托空间位置和交通设施发展水平的传统地理区位扩展到依托网络连通性、可靠性与出行便捷性的“流空间”新区位;② 研究对象从关注不同地方的区位特征扩展到关注群体出行规律和个体行为差异的微观区位选择;③ 研究内容从交通设施网络的可达性扩展到基于“门到门”的全链条出行服务;④ 大数据挖掘技术和GIS-T技术的发展也使得交通区位的测度朝着更加精确化和精准化的方向迈进。
Theory and methodology of transportation development and location measures
DOI:10.11821/dlxb201804006
[本文引用: 1]
Variations of locational conditions caused by transport infrastructure construction largely promoted the agglomeration of production factors and the local economy and reshaped the regional structure. Hence, measuring transport location has become one of the fundamental topics in geography. Recently, along with transport development, as well as the emergence of new technology, new models, new factors and new industrial forms, the locational conditions have been reconstructed and individual travel concept and patterns changed. The existing research on measuring transport location considers not only the location in the geographic context in terms of the spatial location and transport infrastructure network but also the location in the flow of space concerning the network connectivity, reliability and travel convenience. The research objects changed from various locations to the micro-location regarding group travel characteristics and differences at the individual level. The research contents included door-to-door trips in the accessibility of transport networks. Meanwhile, techniques of big data and GIS-T methods make measuring transport location more accurate.
基于公路客流的中国城市网络结构与空间组织模式
[J].
DOI:10.11821/dlxb201702004
[本文引用: 1]
多视角和多尺度城市网络逐渐成为认识空间关系的主要途径。公路流数据具有显著的空间依赖性和距离衰减特性,对于刻画区域尺度空间关系具有重要意义。基于全国地级行政单元间的公路客运流,论文尝试刻画中国城市网络功能结构和区域效应,并对其空间组织模式进行特征提取和规律挖掘,以期能够为城市网络研究提供新的方法支撑和认知视角。研究结果表明:① 基于公路流的城市网络空间形态表现出强烈的空间依赖性和层级特征,与中国主要城市群分布存在较大程度的空间耦合,更多体现的是区域尺度的空间关系及核心—外围组合关系;② 通过社区发现算法识别出19个城市经济区,其空间内涵主要包括行政区经济、巨型区域溢出效应和核心—边缘结构等;③ 不同地域系统内城市网络自成体系,表现出显著的空间依赖性和多元的空间组织模式,多层次、流动性和网络化的地域系统格局凸显;④ 从空间形态上看,区域城市网络空间结构大致可划分为单中心结构、双核心结构、多中心结构和低水平均势结构等区域关联形态,并以单中心发育模式为主。
The spatial structures and organization patterns of China's city networks based on the highway passenger flows
DOI:10.11821/dlxb201702004
[本文引用: 1]
The multi-level perspective and multi-scalar city network have gradually become the critical pathways to understand spatial interactions and linkages. The road linkages represent distinguished characteristics of spatial dependence and distance decay, which is of great significance in depicting spatial relationships at regional scale. Based on the data of highway passenger flows between prefecture-level administrative units, this paper tries to identify the functional structures and regional impacts of China's city network, and further explores the spatial organization patterns of the existing functional regions, aiming to deepen the understanding of city network structure and provide new cognitive perspectives for the extant research. The empirical results are shown as follows: (1) It is immediately visible that the highway flows are extremely concentrated on the mega-regions of eastern coastal China and major economic zones in central and western China. And city networks based on highway flows demonstrate strong spatial dependence and hierarchical characteristics, which to a large extent has spatial coupling with the distributions of major mega-regions in China. It is a reflection of spatial relationships at regional scale and core-periphery structure. (2) A total of 19 communities that belong to important spatial configurations are identified through community detection algorithm, and we believe that they are urban economic regions within urban China. Their spatial metaphors can be concluded in three aspects. Firstly, many communities have the same boundaries with provincial level administrative units, which reveals that significant administrative region economy still exists in contemporary China. Secondly, trans-provincial linkages can be formed through spatial spillover effects of mega-regions within specific communities. Thirdly, cities located in the marginal areas of provinces and attracted by powerful center cities in neighboring provinces may become increasingly disconnected with their own provinces and be enrolled into communities of neighboring provinces, which make contribution to the formation of the trans-provincial core-periphery structures. (3) Each community, with its distinguished city network system, demonstrates strong spatial dependence and various spatial organization patterns. Regional patterns have emerged with the features of a multi-level, dynamic and networked system. (4) From the morphology perspective, the spatial pattern of regional city networks can be basically divided into monocentric structure, dual-nuclei structure, polycentric structure and low-level equilibration structure, with the monocentric structure as the major type.
交通流空间视角下粤港澳大湾区网络结构多维测度
[J].
DOI:10.11821/dlyj020220535
[本文引用: 1]
交通流是表征区域联系的核心要素,也是区域空间结构新的测度手段。本文基于流空间理论与社会网络理论,使用高德导航数据,对粤港澳大湾区交通联系网络的空间组织结构、节点特征、联系机理进行识别与分析,以期对湾区未来发展规划提供决策支持。结果显示:① 整合尺度后的大湾区呈现“四组团三圈层”的空间组织形态;② 多中心化发展态势明显,依托广深莞核心交通资源出现高强集聚;③ 网络整体骨架尚未建立。本研究揭示区域城市间交互关系与结构特征,对推动大湾区构建多极化、组团化、协同化的发展格局具有重要意义。
Multi-dimensional measurement of network structure of Guangdong-Hong Kong-Macao Greater Bay Area from the perspective of traffic flows space
DOI:10.11821/dlyj020220535
[本文引用: 1]
Traffic flows is the core factor reflecting the interaction in urban agglomerations and a new measure model of spatial structure. The advanced stage of urban agglomeration is spatial development model of network. The study of spatial signs and interaction mechanism in urban agglomeration from the perspective of network has a reference significance for regional planning and development. In this context, the theory of flow space, social network and pan-maps are applied. Based on Autonavi navigation OD data in the Guangdong-Hong Kong-Macao Greater Bay Area collected in 2019 and 2020, this study constructs a transportation network model and uses a social network analysis approach to analyze its characteristics of spatial construction, node and edge. The conclusions are drawn as follows: After unifying the spatial scale, the Greater Bay Area presents the spatial organization form of “four groups and three circles”; A multi-center networked spatial structure in the Greater Bay Area has been formed relying on core nodes of Dongguan, Shenzhen and Guangzhou; Close local connection and loose overall connection is main characteristics of the network in the Greater Bay Area; There are two strong connection subnetworks in the network: Shenzhen-Dongguan and Guangzhou-Foshan; A continuous thread of connection has not yet formed within the Greater Bay Area. This study reveals the interaction relationship and structural characteristics among regional cities, which is of great significance for promoting the Greater Bay Area to build a multi-polar, group-based and collaborative development pattern. The Greater Bay Area should promote regional cooperation relying on the spatial organization structure and form three major development subgroups: Guangzhou-Foshan-Zhaoqing, Zhuhai-Zhongshan-Jiangmen-Macao and Shenzhen-Dongguan-Huizhou-Hong Kong. Meanwhile, it is necessary for the Greater Bay Area to give play to the advantages of central nodes, deepen the contact of Guangdong-Hong Kong-Macao and enhance international influence relying on transportation strategy and construction of free trade zones.
基于交通流的关中城市群城际交互对城市空间增长的影响
[J].
Impact of intercity interaction on urban space growth in the Guanzhong Plain urban agglomeration based on traffic flows
以“新基建”为牵引促进东北地区融合创新发展
[J].
Promoting the integration, innovation and development of Northeast China with the traction of "new infrastructure"
交通运输部关于推动交通运输领域新型基础设施建设的指导意见
[EB/OL].
Guiding Opinions of the Ministry of Transport on Promoting the Construction of New Infrastructure in the Field of Transportation
高速公路流的距离衰减模式与空间分异特征: 基于福建省高速公路收费站数据的实证研究
[J].
DOI:10.18306/dlkxjz.2018.08.008
[本文引用: 1]
交通流是社会经济空间联系的直观反映,其距离衰减规律对空间秩序的形成与演化意义重大。利用2016年10月份的福建省高速公路收费站数据,以县区为基本单位,识别高速公路流O-D矩阵;在此基础上,利用空模型法模拟省和县区2个尺度上高速公路流的距离衰减规律,并结合空间分析和相关分析法,探讨高速公路流距离衰减规律的空间分异特征与规律。结果显示,①高速公路流主要集中在0~200 km与0~200 min区段,较好地契合了公路运输的经济半径与交通流的时空断裂特征;②省域层面上,高速公路流随距离的增加有显著的衰减趋势,当采用路网距离、幂律型衰减函数时,距离衰减系数为2.674,显著高于常规所选数值2;③不同县区高速公路流的距离衰减速度在空间上呈显著的圈层模式,与高速公路流的空间分布形成较好的耦合关系;④距离衰减规律内生于社会经济空间联系格局,不仅影响空间秩序的形成与演化,也会受空间秩序演化的影响,一定条件下,节点的对外社会经济空间联系强度会随节点规模、人口与经济密度的提高以及区位条件的优化形成自我加速的反馈过程,形成循环累积效应。
Distance-decay pattern and spatial differentiation of expressway flow: An empirical study using data of expressway toll station in Fujian Province
DOI:10.18306/dlkxjz.2018.08.008
[本文引用: 1]
As the basic law of geography, the law of distance-decay is of great significance to the formation and evolution of spatial order. Using the data of Fujian expressway toll stations in October 2016, an expressway flow origin-destination matrix was identified with county areas as the basic unit. Cumulative proportion curve, spectrum analysis, and null model were used to simulate the distance-decay effect of expressway flow on the provincial and county scales. Then, combining spatial analysis and correlation analysis, the spatial differentiation characteristics and the distance-decay effect of expressway flow were discussed. The results show that: (1) The expressway flow is mainly concentrated in the 0~200 km and 0~200 min sections, which is in line with the economic radius of road transportation and the temporal and spatial fracture characteristics of traffic flow. (2) The expressway flow has a significant decreasing tendency on the provincial scale with the increase of distance. When using the road distance and power-law decay function, the distance decay coefficient is 2.674, which is significantly higher than the conventional value of 2. (3) The distance-decay rates of the expressway flow in different counties show a clear zonal pattern, corresponding well with the spatial distribution of expressway flow. (4) The law of distance-decay not only influences the evolution of spatial order, but also is influenced by the evolution of spatial order, and it is endogenous to the spatial patterns of socioeconomic activities. Under certain conditions, the strength of socioeconomic spatial connections will form a self accelerating feedback process with the increase of node size, population, and economic density, and the optimization of location conditions.
基于高速公路流的江苏省交通网络地域分异及影响因素
[J].
DOI:10.7523/j.ucas.2020.0029
[本文引用: 6]
基于江苏省高速公路交通流量数据,构建高速公路全年流量模型,利用社会网络分析方法探究各县域的中心性与凝聚子群,结合地理探测器方法从江苏省整体以及苏南、苏中、苏北不同地域范围进行影响因素分析。结果表明:1)从总体上看,全年总流出量和流入量空间分布呈现由苏南向苏北递减的趋势;外出率较高地区分布于苏南—苏中—苏北地区的交界处、全省的边界地区以及苏南地区镇江市和常州市的交界地区;2)以苏州、南京、无锡为核心的苏南地区对全省有较强的交通集聚辐射效应,凝聚子群显示江苏省高速公路网络整体上呈现出“4组团、8片区”的特征;3)探测因子结果显示在省域范围内经济水平、产业结构、汽车保有量、人口规模、基础设施、居民购买力对高速公路流量的影响都较为显著,基于不同区域范围的因子决定力存在差异。
Regional differentiation and its influencing factors of traffic network in Jiangsu Province based on the expressway flow
DOI:10.7523/j.ucas.2020.0029
[本文引用: 6]
Based on the data of expressway traffic flow of Jiangsu Province, this paper builds the annual expressway traffic flow model, uses the method of social network analysis to explore the centrality and the agglomeration sub group of each county, and combines with the method of geographical detector to analyze the influencing factors from the perspective of the whole of Jiangsu Province, as well as the southern, central, and northern regions of Jiangsu. The results show that:1) On the whole, the spatial distribution of annual total outflow and inflow shows a decreasing trend from the south to the north; the areas with higher outflow rate are located at the junction of southern, central, and northern Jiangsu, the border areas of the whole province and the junction of Zhenjiang City and Changzhou City in southern Jiangsu. 2) The southern Jiangsu, with Suzhou, Nanjing, and Wuxi area as the core, has a strong traffic concentration and radiation effect on the whole province, and the cohesive subgroups show the characteristics of "four groups and eight zones" of the expressway network in Jiangsu Province in general.3) The results of detection factors show that economic level, industrial structure, car ownership, population scale, infrastructure, and purchasing power of residents all have a significant influence on the expressway flow in the province, and the explanatory power of factors are different in various regions.
A multi-level spatial-temporal model for freight movement: The case of manufactured goods flows on the U.S. highway networks
[J].
基于交通信息流的长江经济带城市中心性及其影响因素
[J].
Urban centrality and its influencing factors in the Yangtze River economic belt based on traffic and information flow
西部内陆省区区域经济差异影响因素: 以重庆为例
[J].
DOI:10.11821/dlyj201705010
[本文引用: 1]
选取内陆开放的典型区域重庆市作为案例,综合运用基尼系数、泰尔指数和变异系数等方法,对重庆市1994-2014年间区域经济差异的演变进行测度和分析,并以区县经济差异(基尼系数)为因变量,选取西部省区中较具普适性的、囊括社会行政、经济、地理区位和政策四个方面的15个影响因素为自变量,运用岭回归和地理加权回归模型分别从“全局”和“局部”视角探讨其作用效果。研究表明:① 研究时段内重庆市区域经济差异持续波动,基尼系数大体处于0.3~0.4之间,并表现出以重庆直辖、加速新型工业化战略及金融危机为三个节点的四阶段演变特征;② 岭回归结果显示,城镇化、劳动力资源、非市场化、工业化、地形条件和政策倾斜是最为显著的六个影响因素;③ 地理加权回归结果表明,城镇化、劳动力资源、非市场化、工业化和政策倾斜对重庆市区域经济差异的影响表现出明显的空间差异特征,但地形因素的影响并不显著。研究对西部内陆地区的可持续发展具有一定科学指导意义。
Influencing factors of regional economic inequality in inland provinces of Western China: A case study of Chongqing
DOI:10.11821/dlyj201705010
[本文引用: 1]
Regional economic inequality is an inevitable phenomenon in economic development, as well as a common concern all over the world. The importance of regional economic inequality issue in the inland provinces of western China has been growing especially under the background that China is accelerating its inland opening/development and Western Development Program in recent years. This study, taking Chongqing as a typical inland region in western China, employs Gini, Theil index and coefficient variance to evaluate the regional economic inequality in Chongqing and its variation from 1994 to 2014. We then decompose Gini index in Chongqing into county (or district) level. Using county level regional economic inequality as dependent variable and choosing 15 independent variables in 4 categories (social factor, economic development, geographic location and transport, and policies), we apply ridge regression and geographical weighted regression models to examine the influence of these factors on regional economic inequality in Chongqing from the "global" and "local" perspectives respectively. The findings are as follows: (1) the dynamics of regional economic inequality in Chongqing can be divided into four phases with the event of setting up as direct-controlled municipality, the launch of new-type industrialization scheme and the Financial Crisis as critical time points. Such inequality over the past decades has always fluctuated between 0.3 and 0.4, which is quite close to the warning line (Gini =0.4) especially after the Financial Crisis; (2) the result of ridge regression shows that, among 15 factors, urbanization, industrialization, the endowment of labor resources, non-marketization, topography and preferential policies are the most significant factors which enlarge regional economic inequality; (3) the result of geographical weighted regression shows that, urbanization, non-marketization, industrialization, the endowment of labor resources and preferential policies contribute to regional economic inequality in Chongqing and the impact shows spatial heterogeneity. By contrast, the influence of topography is insignificant. The study analyzes the possible reasons and put forward some policy solutions. We hope that the research can contribute to the literature on the regional inequality issues in the study region and that the suggestions have some practical value for the rational and sustainable development in China's inland region.
中国新基建发展的时空演变及驱动因素
[J].
DOI:10.18306/dlkxjz.2023.02.001
[本文引用: 1]
新基建已成为中国现阶段经济转型与高质量发展的重要支撑。为考察中国新基建发展时空演变及其驱动因素,论文基于2013—2020年的省级面板数据,构建新基建发展水平的综合评价指标,进而运用TOPSIS-熵值法和空间计量模型对其进行测度及影响因素分析。结果发现:① 中国新基建发展水平逐年提高,各省域之间的差距呈现出不断缩小的趋势;② 中国新基建发展水平存在着较大的空间异质性,东部地区远高于中部、西部和东北地区,整体时空演化格局呈现出东西扩张态势,重心不断向西南方向移动;③ 新基建发展水平受到多种因素的影响,其中,经济发展水平、金融发展水平、创新基础、城市化进程和人口规模等是关键性驱动因素。论文通过考察中国新基建在时空上的格局演化及其影响因素,希冀为其优化布局与发展提供决策参考。
Spatial evolution and determinants of new infrastructure development in China
DOI:10.18306/dlkxjz.2023.02.001
[本文引用: 1]
New infrastructure has become an important support for China's economic transformation and high-quality development in the new era. In order to investigate the temporal and spatial evolution of China's new infrastructure development and its driving factors, this study first constructed a comprehensive evaluation index of the development level of new infrastructure based on the provincial panel data from 2013 to 2020. Then, it used the technique for order of preference by similarity to ideal solution (TOPSIS) entropy method and spatial econometric model to measure the development level of new infrastructure and analyze its driving factors. The results show that: 1) The development level of China's new infrastructure has increased year by year, and there is a trend of balanced development among provinces. 2) There is great spatial heterogeneity in the development level of China's new infrastructure. The new infrastructure development level is much higher in the eastern region than the central, western, and northeastern regions. The overall temporal and spatial evolution pattern showed an east-west expansion trend, and the center of gravity continued to move to the southwest. 3) The development level of new infrastructure is affected by many factors, among which the economic development level, financial development level, innovation foundation, urbanization process, and population size are the key driving factors. By examining the evolution of the spatial pattern of China's new infrastructure development level and its influencing factors, this article may provide a decision-making reference for its optimal layout and development.
基于交通改善的湘西旅游城镇化响应时空分异与机制研究
[J].
Spati-temporal difference and mechanism of tourism urbanization in Xiangxi based on transport's improvement
DOI:10.2307/142450 URL [本文引用: 1]
中国产业地理集聚与区域出口经济复杂度
[J].
DOI:10.11821/dlyj020200779
[本文引用: 1]
中国正处于产业结构升级转型的节点上,探究中国出口经济复杂度的影响因素对制定下一阶段的产业政策有深刻影响。利用中国海关数据库,在三种主流复杂度指标计算基础上,深入分析中国城市产业地理集聚与出口经济复杂度发展演化,并运用计量模型对两者之间的关系进行实证检验。研究得到以下主要结论:① 全国城市产业地理集聚程度基本呈现东部高、中西部点状起伏的空间格局,且城市间产业集聚水平差异逐渐缩小。② 城市出口经济复杂度空间分布格局与产业地理集聚分布具有一致性,高复杂度地区主要为环渤海、长三角、珠三角地区以及中西部中心城市,城市间发展差距随时间缩小。③ 主流经济复杂度测算方法中的经济复杂度指数并不适用于中国城市尺度,而适应性复杂度和新经济复杂度的测算效果更好。④ 模型研究结果显示,产业地理集聚通过知识溢出和生产要素共享产生的积极影响超过了竞争拥挤带来的负面影响,促进了出口经济复杂度提升;且通过促进高复杂度产业进入与低复杂度产业退出有效推动了城市产业升级。
Industrial agglomeration and economic complexity of regional exports in China
DOI:10.11821/dlyj020200779
[本文引用: 1]
China is in the process of upgrading its industrial structure and exploring the factors that influence China's economic complexity helps in formulating industrial policies of the next period. This study employs China Customs database to analyze the evolution of industrial agglomeration of Chinese cities' export economic complexity with the help of three mainstream complexity indicators, and the relationship between industrial agglomeration and economic complexity is tested empirically with econometric model. The results show that industrial geographic agglomeration in China generally presents a spatial pattern of being high in eastern region and scattering in central and western regions, and the regions with high industrial geographic agglomeration are the Bohai Rim, the Yangtze River Delta, the Pearl River Delta, the West Coast of the Taiwan Straits, and the Sichuan-Chongqing Region. Along the passage of time, the geographic agglomeration index of most cities has risen, and the difference between cities has gradually decreased. The spatial distribution pattern of economic complexity of regional exports is consistent with the industrial geographic agglomeration. The eastern region has the highest average economic complexity while the western region has the lowest. High-complexity regions mainly consist of the Bohai Rim, the Yangtze River Delta, the Pearl River Delta and developed cities in the central and western regions, and the gap between cities has narrowed over time. Comparing the three economic complexity measurement methods, the study finds that the ECI indicator is not applicable to China while the Fitness and ECI+ indicators perform better. The econometric model shows that industrial geographic agglomeration can bring positive effects through knowledge spillovers and sharing of production factors, as well as negative effects through competition crowding. In general, the positive effects of agglomeration are greater than the negative and agglomeration has promoted the economic complexity of China's regional exports. This study further examines the mechanism of increasing economic complexity through industrial agglomeration, and finds that agglomeration can accelerate urban industrial upgrading and increase economic complexity by promoting the entry of high-complexity industries and the exit of low-complexity industries.
“流空间”视角下高速公路交通流网络结构特征及其形成机制: 以广东省为例
[J].
DOI:10.11821/dlyj020210050
[本文引用: 2]
交通流是城市经济联系最显性的表现,为更清晰地识别城市网络结构提供了新视角。本研究采用高速公路联网收费数据作为交通流“关系数据”,综合图论、社会网络分析法(SNA)和GIS空间分析,以广东省为研究区域探索高速公路交通流网络空间结构特征,并利用QAP回归法探究影响网络形成的因素。结果表明:① 广东省高速公路已形成典型的网络式空间结构,具有“小世界”网络效应。其节点度值服从幂律无标度分布,交通出入量基本平衡,节点重要性自区域中心向外围递减;网络有向边权值等级差异显著,优势交通流具有“向心指向”特征和距离依赖性。② GDP、常住人口、社会消费品零售总额、县区间行驶距离等已成为影响广东省高速公路交通流网络形成的重要因素。其中人口因素是影响城市间交通流动的主要因素,网络形成受制于距离因素,消费因素逐渐成为刺激城市间交通流动的强大动力。③ 广东省高速公路交通流动模式分为邻近指向型、中心指向型和等级指向型三种,以邻近指向型为典型模式。研究结果对于揭示交通流动规律,丰富城市网络理论,推动道路合理规划和区域协调发展具有重要理论和实践意义。
Spatial structure and formation mechanism of expressway traffic flow network based on space of flows: A case study of Guangdong Province
DOI:10.11821/dlyj020210050
[本文引用: 2]
Traffic flow is the most powerful indicator to map urban economic connections, which provides a new perspective to identify urban network spatial structure clearly. This study uses Guangdong's data to explore the spatial structure of expressway network based on theory of synthesized graph, social network analysis (SNA) and GIS spatial analysis. QAP regression method is used to explore the factors which influence the network characteristics. The results show that: (1) The Guangdong's expressway forms a typical network spatial structure with “small world” network effect. The out-degree and in-degree values of network nodes follow the power law scale-free distribution, traffic volume is basically balanced, and the importance of nodes decreases from regional center to periphery. There are significant differences in the weights of directed edges, and the dominant traffic flows have the characteristics of “centripetal direction” and “distance dependence”. (2) The results of QAP regression show that the character of Guangdong's expressway traffic flow network is significantly affected by GDP, resident population, total retail sales of consumer goods, and the distance. Population is the most powerful factor which affects inter-city traffic flows, the formation of network is restricted by distance, and the consumption factor is gradually becoming a powerful driving force to stimulate the inter-city traffic flows. (3) The traffic flow patterns of expressway in Guangdong are divided into three types, namely, proximity-oriented, central-oriented and hierarchical-oriented. The proximity-oriented traffic flow is typical, which is widely distributed in the province; the central-oriented traffic flow is concentrated in the Pearl River Delta urban agglomeration; and the hierarchical-oriented traffic flow is mainly distributed between Guangzhou and Qingyuan, and between Shenzhen and Shantou. The research results have important theoretical and practical significance for revealing the laws of traffic flow, and enriching urban network theory. Furthermore, it provides theoretical support for scientific road planning and coordinated regional development.
“新基建”赋能中国经济高质量发展的路径研究
[J].
Studies on how new infrastructure empowers high-quality development of China's economy
