

粮食储备是国家重要的战略资源,是国家维系粮食安全的重要基础和制定粮食安全政策的关键内容。由于粮食生产和消费在时间、空间上的不对称性,加之自然灾害、突发公共事件对粮食生产和流通的影响和制约,粮食储备作为连接生产与消费的“蓄水池”,在平抑市场价格波动、确保人民群众的粮食消费方面发挥着至关重要的作用[1]。“国无九年之蓄,曰不足;无六年之蓄,曰急;无三年之蓄,曰国非其国也”,中国早在春秋战国时期就建立了粮仓储备制度,以“备岁不足”、“均贵贱”[2-3]。现代粮食储备的概念最早于1958年由联合国粮农组织提出,将其定义为政府掌握的应对粮食短缺的合理储备。1970年代全球第一次粮食危机以后,联合国建立了国际紧急粮食储备(International Emergency Food Reserve,IEFR),美国、法国、澳大利亚形成了以社会/企业或农户为主的储备结构,德国粮食储备由国家储备、国际储备和家庭储备构成国家粮食储备体系,日本形成了以政府储备为主、民间储备为辅的储备结构[4]。2008年世界粮食危机以后,粮食储备作为粮食安全的政策工具进一步强化,各国将粮食视为和石油同等重要的战略资源,并把粮食储备作为提高本国粮食系统弹性的一项重要战略[5]。为保障国家粮食安全,中国也逐步建立了以中央政府和地方政府为主体的粮食储备体系,中央粮食储备是保障国家粮食安全的压舱石,地方粮食储备是中国区域性粮食安全保障的重要支撑[6]。2014年以来中国不断完善中央和地方两级粮食储备体系建设,确保粮食储备在应对危机时真正发挥压舱石、稳定器的作用。目前中国地方粮食储备按“销区6个月、产区3个月、平衡区4.5个月的口粮消费量”核定[7],虽然考虑了各个省份粮食生产与消费的总体特征,但忽略了各省内部粮食供需平衡的空间差异,因此,迫切需要因地制宜地进一步制定更加精细化的分区域粮食储备规模政策[8-9]。
粮食储备能否在危机中发挥压舱石的作用关键在于粮食储备规模的确定和空间位置布局,科学确定地方粮食储备规模和空间布局是粮食发挥“蓄水池”和“稳压器”作用的重要前提。联合国粮农组织(FAO)根据1971—1977年世界粮食储备率与价格变动情况,在一定的假设条件下,采用生产波动法模拟全球发生一次严重歉收时保障粮食安全的库存消费比为17%~18%,其中后备储备占5%~6%,周转储备占12%~13%,但其假设条件与中国实际相差较远,按此标准计算的粮食储备规模无法保障中国粮食安全[10];Bigman等[11]以粮食价格变量作为粮食储备调控目标并将仓库建设以及仓储、货运等成本考虑在内建立了比格曼模型,该模型的优点是考虑了粮食储备中成本与效率的关系,不足是过于强调粮食储备的经济效益。国内学者马九杰等[12]、娄源功[13]、吕新业等[14]、朱晶等[15]、范建刚[16]等将粮食产量或价格波动作为粮食储备规模计算的主要依据,运用剩余法、成本效益法、两目标或多目标规划法测算了中国粮食储备总规模,但由于采用的方法与参数不同,不同学者的研究结果差异显著,且上述研究均未涉及国家内部不同区域的地方粮食储备规模。冀浏果等[1]创造性地提出了以余粮量为基础的地区粮食储备规模测算方法,克服了储备规模与产量脱节的缺点,但其仅适用于粮食主产区或余粮区,不适用于粮食主销区和产销平衡区。韩建军等[8]从地理学的视角将空间效应纳入区域粮食储备研究,利用空间探索性分析法和空间计量方法分析了中国省域粮食储备地区差异及原因,初步探索了粮食生产能力、人口密度、社会影响、经济发展、灾害、交通通达能力对地区粮食储备规模的影响,但其未考虑储粮的自然条件,尤其是对特定自然地理单元(青藏高原)的粮食储备自然条件和社会经济条件的特殊性未作具体分析。此外,还有部分学者从微观视角方面探讨了农户粮食储备行为[17-18]或从工程技术层面探讨了粮食储备库建设标准和储粮技术改进措施[19⇓-21]。总体上,已有关于粮食储备规模和储粮技术的研究较多,而关于粮食仓储设施的空间布局的研究较缺乏。事实上,粮食仓储设施是粮食储备的载体和保障粮食储备顺利运转的重要支撑,科学合理的粮食仓储基础设施空间布局是确保能够及时调运的前提条件之一。目前中国粮食仓储设施结构性缺口仍然存在,部分地区区域性布局不平衡不充分,粮食仓储设施的合理规模测算和优化布局,对于各地避免重复建设、降低储备运营成本、充分发挥仓储设施功能具有重要的指导作用[1]。
青藏高原位于西南边陲,与印度、尼泊尔、不丹、缅甸及克什米尔地区接壤,边境线长约4000 km,占中国陆地边境线总长的1/6[22],是中国国防安全的战略前线,加强青藏高原粮食储备,对巩固国防和国家安全战略部署具有重要意义。青藏高原传统粮食消费以青稞等粗粮为主,随着与内地交流增多,食物消费结构呈现多元化发展,对大米、面粉的需求上升,粮食供需结构性矛盾也越来越突出,目前青藏高原除青稞基本自给外,100%的大米和50%的小麦依靠内地调入[23-24],粮食平均运距超过3000 km,最高达5133 km[25]。长距离粮食运输不仅给该地脆弱的交通基础设施造成巨大负担,更重要的是,如遇交通中断、道路受阻的情况,很难保证域外粮食的及时调入,而强大和高效的粮食储备体系是保障青藏高原粮食安全和社会稳定的重要支撑,长期以来,西藏和青海的粮食储备偏低,一旦地区突发自然灾害或公共危机,地区粮食储备不能满足调用需求,严重时将造成巨大损失[8]。
基于以上问题及事实,本文尝试提出基于需求法的粮食储备规模测算方法,并结合青藏高原储粮自然条件、人口规模、粮食生产、粮食消费、社会经济发展等因素,测算青藏高原地方粮食储备规模;在此基础上,结合青藏高原交通道路条件和交通通达度、行政区划,进一步对区域粮食储备库节点空间选址进行探讨,以期为西藏和青海粮食储备体制机制改革提供政策参考。
1 研究区域、数据与方法
1.1 研究区概况与数据来源
青藏高原位于26°00′~39°47′N、73°19′~104°47′E之间,涉及行政辖区包括西藏和青海的全部以及新疆、四川、甘肃、云南等部分区域,总面积约256万km2,占中国陆地总面积的26.8%[26]。其中,青海省和西藏自治区是青藏高原的主体,面积约占青藏高原面积的73.74%,考虑到研究的代表性及数据的可获取性,本文所提及的青藏高原,特指青海省和西藏自治区所辖区域。海拔高、气温低,热量不足,加之境内群山巍峨,河流、湖泊广布,种植业发展空间狭小,人均耕地面积和人均粮食产量低于全国平均值,2020年青藏高原人均耕地面积0.11 hm2,低于全国平均水平,人均粮食产量219.83 kg,相当于全国平均水平的46.36%。粮食作物以青稞、小麦、玉米、杂粮为主,青稞所占的比重较高,其中西藏青稞播种面积、产量占粮食播种面积与产量的比重分别高达51.17%和77.18%。区域经济发展较落后,农牧业在国民经济比重较高,2020年GDP为4908.66亿元,其中农牧业产值484.95亿元,占GDP的9.88%。少数民族众多,是中华民族特色文化保护地,2020年区域常住人口957.21万人,其中少数民族人口613.51万人,占总人口的64.09%。青藏高原高寒干燥的自然环境不利于种植业发展,长期以来粮食供需平衡处于一种紧平衡状态,属于中国粮食产销平衡区[27-28]。近年来随着人口增长和食物消费结构转型,青藏高原粮食供需平衡形势更加严峻,2020年青藏高原粮食产量238.87万t,粮食消费量339.09万t,粮食自给率仅70.44%。
本文涉及的数据主要包括青藏高原人口数据、粮食生产数据、交通道路数据矢量数据,以及县级和乡镇行政区划图等。其中,2020年青藏高原各县粮食产量数据主要来源于《中国县域统计年鉴》《青海统计年鉴》《西藏统计年鉴》《西藏年鉴》《青海年鉴》,为消除气候等偶然因素对粮食产量的影响,采用2019—2021年3年平均值替代2020年数据;县级单元人口数据为第七次人口普查数据,来源于《中国人口普查分县资料2020》;青藏高原各级交通线路数据来源于中国科学院资源环境科学数据中心(
1.2 研究方法与关键参数
1.2.1 粮食储备规模测算方法及参数
粮食储备的作用是为保证人的粮食消费需要,稳定粮食市场价格、应对重大自然灾害或其他突发事件的粮食需求,灾害和意外发生地点和时间是随机的、具有不确定性与不可预知性,严格来说,粮食储备物资需求无法精确预测。但粮食储备保障的对象是人,人口规模和位置基本可以确定;粮食储备保障的是特殊情况下居民最基本的生存消费需求,其首要解决的是应急状态下人的口粮安全,不包括饲料粮、工业粮等其他用粮。因此,基于需求法的粮食储备规模测算方法的计算公式为:
式中:Si表示i县的地方粮食储备规模(kg);
人均口粮消费标准参数e:根据联合国粮农组织(FAO)和世界卫生组织(WHO)的标准,维持居民正常生活和健康需要的每日最低热量2100 kcal/(人·d),相当于502 g粮食提供的热量[30]。俄罗斯饥荒、中国汶川地震和日本海啸等灾害事件中,各国均按500 g/(人·d)的标准发放粮食[31],中国成品粮应急粮食储备规模按人均170 kg/a测算,相当于每人日均消费500 g/(人·d)成品粮[32]。受膳食结构影响,青藏高原农区和牧区口粮消费差异较大,农区粮食消费结构与内地差异不断缩小,日均口粮消费按500 g/(人·d)成品粮计算;根据笔者2018年和2021年对那曲和阿里地区粮食局的访谈调研,牧区和半农半牧区居民日均口粮消费约为农区的一半,按250 g/(人·d)计算。
消费供应时间参数t:联合国粮农组织(FAO)规定最低粮食储备相当于3~4个月的口粮,德国和日本粮食储备相当于3个月的消费量,法国粮食储备供应保障时间长达12个月。2001年《国务院关于进一步深化粮食流通体制改革的意见》规定了中国“产区3个月,销区6个月”的地方粮食储备要求,也有学者提出“南方4个月、北方10个月”的地方粮食储备规模才能满足基本口粮需求[33]。青藏高原海拔高、热量低,粮食作物生长从播种到成熟的生产期为130 d以上[34-35],加之交通不便,粮食调运通道少、距离远、线路长,调粮周期长,为保障突发情况下居民粮食消费不断档,粮食储备的消费供应时间应适当延长。事实上,青藏高原高寒干燥的自然环境为粮食储存提供了天然优势。由于海拔高,空气稀薄,含氧量低,粮食不易腐烂,每立方米空气约含150~170 g氧气,相当于平原地区的62%~65.4%,加之日照时间长,太阳辐射强,气候寒冷干燥,空气中的水汽、尘埃含量少等条件,可以实现粮食自然通风、晾晒和低温储备,储粮害虫少,在无任何科技设施条件下粮食储备时间可达3~5年[34,36],是中国储粮最佳适应区和“绿色储粮”仓储基地[37]。因此,本文结合区域自然条件和社会经济特点,按照“农区6个月、半农半牧区9个月、牧区12个月”的消费供应时间测算青藏高原粮食储备规模(图1)。
图1
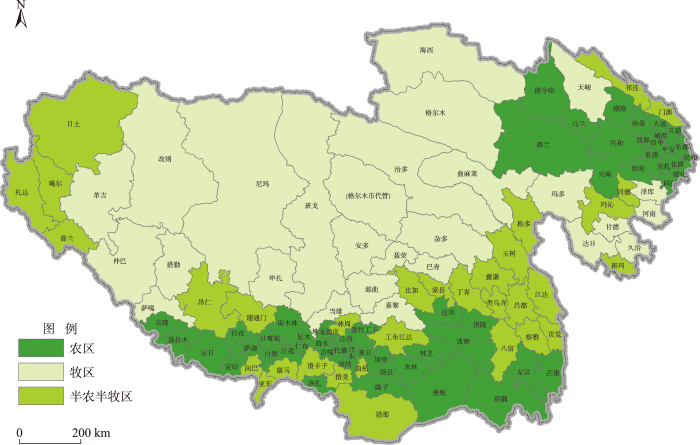
图1
青藏高原农区、牧区和半农半牧区分布
注:本图基于自然资源部标准地图服务网站下载的审图号为GS(2022)4318号的标准地图制作,底图无修改,下同。
Fig.1
Distribution of agricultural, pastoral, and agricultural-pastoral areas on the Qinghai-Tibet Plateau
1.2.2 道路网络分析法
常用的设施用地选址法有重心法、层次分析法、网络分析法等多种方法[38⇓⇓-41]。本文主要采用网络分析法。网络分析法是运用图论方法研究各类网络的结构及其优化问题,将粮库的选址问题抽象为以距离和成本为阻抗的最短路径问题。具体利用ArcGIS网络分析工具,以青藏高原铁路、高速公路、国道、省道、县道、乡道数据为道路网络数据集,制作青藏高原114个县级行政单元几何中心的点状矢量数据,以县级单元粮食储备需求量为节点权重赋值,以交通道路的平均行驶速度为线要素权重赋值,以运输时间为最大阻抗,建立节点两两之间的最短路径时间成本OD矩阵,选取最低时间成本下的粮食道路运输最优路径。设G=(V, A)是一个简单连通赋权有向图,连接两个顶点的边的权值为他们之间的距离,对于每个顶点Vi(i=1, 2, …, n)有一个正向的负荷a(Vi),且它与各顶点之间的最短路径长度为di1, di2, …, din,粮库最佳选址位置为所在点到其他各点的最短时间的总和或者以各顶点的载荷加权求和为最小,其数学表达式为:
表1 交通道路通行速度赋值
Tab.1
| 道路类型 | 铁路 | 高速公路 | 国道 | 省道 | 县道 | 乡道 | 其他 |
|---|---|---|---|---|---|---|---|
| 速度/(km/h) | 120 | 100 | 80 | 60 | 30 | 15 | 5 |
| 单位公里时间成本/min | 0.5 | 0.6 | 0.75 | 1 | 2 | 4 | 12 |
1.2.3 粮食储备库规模类型划分
表2 粮食储备库规模类型划分标准
Tab.2
| 粮库分类 | 特类 | 一类 | 二类 | 三类 | 四类 |
|---|---|---|---|---|---|
| 仓容量Q /万t | 45≤Q<100 | 15≤Q<45 | 5≤Q<15 | 2.5≤Q<5 | 1≤Q<2.5 |
2 结果分析
2.1 青藏高原地方粮食储备总规模
青藏高原地方粮食储备总规模约为81.51万t,相当于区域全年粮食消费的24.04%,高于联合国粮农组织规定的粮食储备安全水平。其中,农业区人口众多且分布密集,粮食储备数量较大,约为59.36万t,相当于区域储备总量的72.82%;牧业区人口稀疏,粮食储备数量较小,约为10.44万t,占区域储备总量的12.80%;半农半牧区粮食储备规模为11.71万t,占区域粮食储备总量的14.37%。根据联合国粮农组织粮食储备标准,最低粮食储消比不低于17%~18%才能保障国家粮食安全,青藏高原粮食储消比较该标准稍高,全区平均储消比为24.04%,农业区和半牧业区粮食储消比分别为22.50%和22.49%,牧业区粮食储消比最高,达45.00%(表3)。
表3 青藏高原不同区域粮食储备规模
Tab.3
| 地区 | 粮食产量/万t | 粮食消费量/万t | 储备规模/万t | 粮食缺口/万t | 储消比/% |
|---|---|---|---|---|---|
| 全区 | 238.87 | 339.09 | 81.51 | 181.73 | 24.04 |
| 农区 | 198.75 | 263.82 | 59.36 | 124.43 | 22.50 |
| 牧区 | 0.48 | 23.20 | 10.44 | 33.16 | 45.00 |
| 半农半牧区 | 39.64 | 52.07 | 11.71 | 24.14 | 22.49 |
受自然条件限制,区域粮食生产无法同时满足区域粮食消费和储备需求,粮食生产、消费和储备不平衡,粮食缺口较大,且区域内部粮食产消储平衡差异较大。2020年青藏高原粮食产量238.87万t,粮食消费需求和粮食储备需求分别为339.09万t和81.51万t,全区粮食缺口约181.73万t。分区域看,农区和牧区的粮食缺口分别达124.43万t和33.16万t,半农半牧区粮食缺口为24.14万t。从各县市粮食产消储情况看,区域31个县(包括22个农业县和9个半农半牧业县)粮食产量除可以满足本地居民口粮、饲料粮、加工粮等所有粮食消费需求和粮食储备需求外,尚有结余,仅占全区县市数量(114个)的27.19%。以上县市多数粮食结余量低于0.88 万t,结余的粮食可以进入商业流通领域转变为商业储备,但白朗、林周、湟中、都兰、贵南、门源、江孜7个县的粮食结余量在1.79万t 以上,可能出现季节性粮食供给过剩。
2.2 青藏高原地方粮食储备库节点空间布局
地方储备粮通常实行省、市、县(区)分级储备和分级管理,省、市、县(区)三级粮食储备分别负责各级行政区内粮食供求平衡、稳定粮食市场以及应对重大自然灾害或者其他突发事件等[45],三者具有明显的层级性和空间嵌套关系。本文构建的三级粮食储备节点分别对应省、市、县(区)三级储备。适宜的地形坡度、稳定可靠的粮源、便利的交通运输条件是影响粮库布局的重要影响因素,综合考虑地形、人口、交通运输条件以及行政区划,青藏高原后备粮食储备库空间布局体系由2个一级节点、15个二级节点和114个三级节点构成,覆盖全部县级单元。
2.2.1 一级节点储备规模与空间布局
一级节点是区域性粮食储备中心,负责省级粮食储备调运,服务半径较大,一般应布局在粮食储备需求或吞吐量大、交通便捷度高,同时又具有较好的经济基础和社会协作条件的地点。采用情景分析法,分别测算区域建立1~3个一级储备库的粮食储备规模和最短时间距离成本。根据测算结果,区域建立1个一级节点,单个库容需求规模达81.51万t,到达服务腹地的最短时间成本为181.00 h,相当于一周时间;区域建立2个一级节点,单个节点的最大库容规模为51.56万t,到达服务腹地的最短时间成本缩短为3 d;区域建立3个一级节点,到达服务腹地的最短时间成本约为1.5 d,但单个节点较低库容规模仅10.38万t,且其中一个节点服务区跨越两个省区。综合考虑储备规模效益、时间距离成本、经济基础和社会协作以及行政区划等因素,青藏高原宜建立2个粮食储备一级节点,分别布局在西宁和拉萨2个城市周边(图2、表4)。
图2
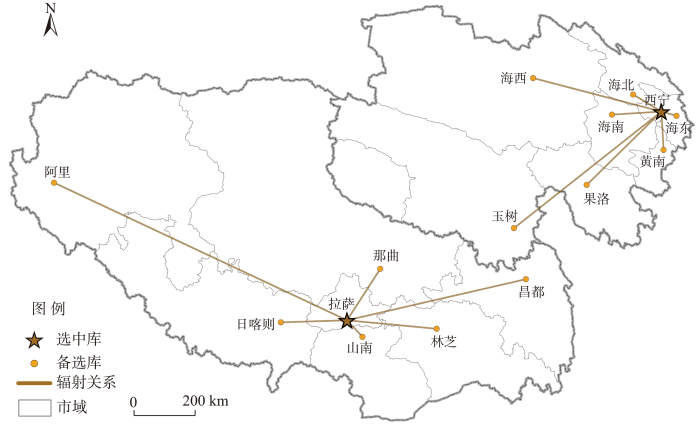
图2
一级节点选址及空间分布
Fig.2
Location and spatial distribution pattern of first-level nodes
表4 青藏高原粮食储备库一级节点的粮食储备规模与时间距离成本
Tab.4
| 一级节点名称 | 储备规模/万t | 国家仓容标准 | 最短时间距离成本/h |
|---|---|---|---|
| 西宁 | 51.56 | 特类 | 25.77 |
| 拉萨 | 29.95 | 一类 | 47.33 |
一级节点均位于省会城市附近,信息条件通达,经济基础和社会协作基础好。其中,西宁一级节点位于青海省会西宁周边,服务区覆盖青海省8个地级市,粮食储备规模达51.56万t,达国家特类粮食储备库标准,拥有青藏铁路、兰青铁路、京藏高速、109国道、214国道等多种交通干线,线路密度大,交通便捷,到达服务腹地的最短时间成本约为25.77 h;拉萨一级节点位于青藏高原南部的“西藏粮仓”附近,有稳定的粮源,粮食储备约29.95万t,达国家一类储备库标准,覆盖西藏7个地级市,腹地广阔,通过青藏铁路、兰青铁路、京藏高速、109国道、219国道、318国道等交通干线与其腹地连接,最短时间成本约47.33 h,不超过3 d。
2.2.2 二级节点储备规模与空间布局
图3
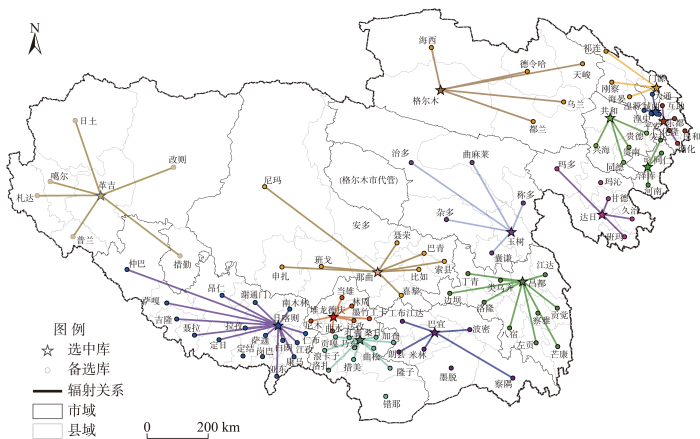
图3
二级节点选址及空间布局
注:不同颜色表示不同二级节点的辐射半径。
Fig.3
Location and spatial distribution pattern of the secondary-level nodes
表5 青藏高原粮食储备库二级节点的粮食储备规模与时间距离成本
Tab.5
| 二级级节点名称 | 所属地级市 | 储备规模/万t | 国家仓容标准 | 最短时间距离成本/h | |
|---|---|---|---|---|---|
| 革吉 | 阿里 | 0.97 | 四类 | 30.83 | |
| 达日 | 果洛 | 1.74 | 四类 | 8.85 | |
| 乐都 | 海东 | 12.23 | 二类 | 6.20 | |
| 共和 | 海南 | 3.89 | 三类 | 11.86 | |
| 格尔木 | 海西 | 4.04 | 三类 | 28.67 | |
| 泽库 | 黄南 | 2.49 | 四类 | 4.24 | |
| 堆龙德庆 | 拉萨 | 7.24 | 二类 | 8.83 | |
| 门源 | 海北 | 1.80 | 四类 | 9.03 | |
| 巴宜 | 林芝 | 2.08 | 四类 | 14.46 | |
| 那曲 | 那曲 | 4.16 | 三类 | 49.01 | |
| 日喀则 | 日喀则 | 6.85 | 二类 | 49.73 | |
| 乃东 | 山南 | 3.02 | 三类 | 23.52 | |
| 城西 | 西宁 | 22.21 | 一类 | 2.08 | |
| 玉树 | 玉树 | 3.18 | 三类 | 22.72 | |
| 昌都 | 昌都 | 5.63 | 二类 | 35.93 | |
注:根据《粮食仓库建设标准(建标172—2016)》[
由于青藏高原人口密度区域差异显著,二级节点粮食储备规模差异较大。其中,城西粮食储备规模量达15万t以上,属于国家粮食储备库标准的一类储备库;乐都、堆龙德庆、昌都和日喀则粮食储备规模5万~15万t,为国家二类粮食储备库标准;玉树、格尔木、共和、那曲、乃东粮食储备规模为2.5万~5万t,为国家三类粮食储备标准;革吉、达日、门源、泽库、巴宜粮食储备规模约为1万~2.5万t,属于国家四类粮食储备库标准。
15个二级粮库储备点服务区域为各自对应的市域范围,由于交通道路等基础设施布局及人口和聚落密度差异,最短时间成本差异显著。大部分二级库最短时间距离成本不超过24 h,其中城西和乐都二级库,位于湟水谷地,人口和聚落分布较密集,交通发达,最短时间距离成本最少,仅需2~6.2 h。少数偏远地区的二级库最短时间成本在24 h以上,包括革吉、格尔木、那曲、日喀则和昌都5个二级库。其中,阿里和那曲位于高原腹地,地域广阔,人口居住分散,导致革吉和那曲两个二级库的最短时间距离成本达30 h以上;日喀则呈东西狭长延伸,县级单元数量较多,南部几个偏远县交通落后,影响了粮食物流效率,最短时间距离成本高达49.73 h;昌都二级库位于青藏高原与横断山区交界处,腹地交通线路较少且等级低,通行能力较差,最短时间成本也长达35.93 h。
2.2.3 三级节点储备规模与空间布局
三级节点是县级粮食储备中心,主要保障县域范围内的粮食储备调运。县城是县域经济、政治、文化中心,交通相对便利、信息通达,以114个县级行政单元中心为三级粮食储备节点的备选点,估算各节点储备规模及其最短时间成本。
由图4可知,青藏高原人口分布不均,三级节点粮食储备规模空间分布不均衡,县级行政单元之间差异显著。20.18%的县市粮食储备规模低于0.2万t,广泛分布在阿里、日喀则、那曲、山南、果洛、海西等人口稀疏的牧业地区;37.72%的县市粮食储备规模介于0.21万~0.40万t,包括那曲、玉树、海北等地区;11.40%的县市粮食储备规模介于0.41万~0.60万t,分散分布在西宁、格尔木城市群周边和鲁藏布江沿岸地区;12.28%的县市储备规模介于0.61万~0.80万t之间,主要分布于海西、海南、玉树、昌都等地区。另外18.42%的县市粮食储备规模超过0.80万t,粮食储备规模较高,集中分布在拉萨市和西宁市及周边、格尔木市、日喀则、海西、昌都等地区。
图4

图4
青藏高原三级节点粮食储备规模空间差异
Fig.4
Spatial difference of grain reserve scales of the third-level nodes on the Qinghai-Tibet Plateau
因交通基础设施空间分布不均,三级节点到其辖区的最短时间成本空间差异显著(图5、图6)。83.93%的区域距离邻近三级节点的最短时间成本不超过24 h,64.10%的区域距离邻近三级节点的时间成本不超过12 h,37.38%的区域距离邻近三级节点的成本不超过6 h,8.70%的区域距离邻近三级节点最短时间成本不超过2 h。此外,还有7.33%的区域距离邻近三级节点的时间成本超过48 h,主要分布在青藏高原腹地深处和边境地区的偏远乡镇,包括察布乡、先遣乡、荣玛乡、措折强玛乡、嘎措乡、雅曲乡、岗尼乡、索加乡等,在这些偏远乡镇需要单独增设乡镇或村级粮食储备节点,以保证在自然灾害或突发事件下能够快速反应,保障居民粮食消费,确保不发生粮食供应脱销断档。
图5
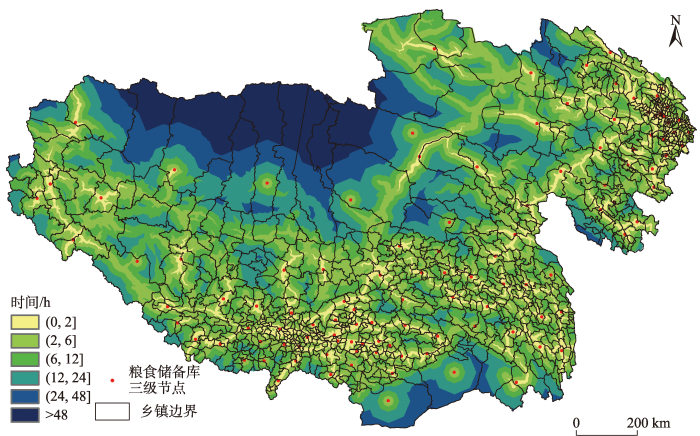
图5
三级节点最短时间成本空间分布差异
Fig.5
Spatial distribution difference of the minimum time costs of the third-level nodes
图6
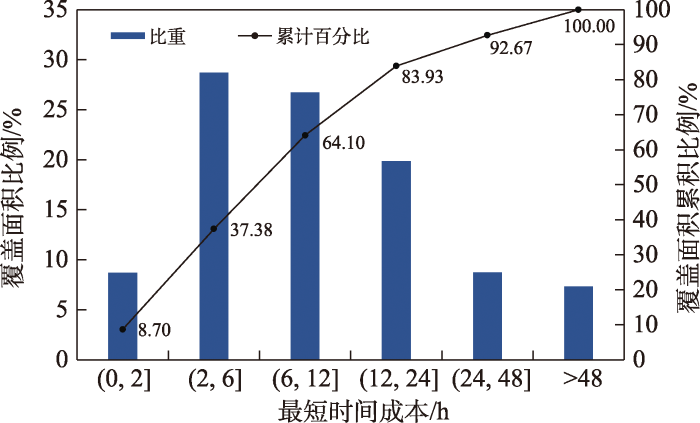
图6
区域距离邻近三级节点的最短时间成本分布
Fig.6
Distribution of minimum time-distance costs to the third-level nodes
3 结论与讨论
3.1 主要结论
本文提出基于需求法的粮食储备规模测算方法,并结合青藏高原储粮自然条件和社会经济条件,测算青藏高原地方粮食储备规模;在此基础上,采用道路网络分析法探讨青藏高原粮食储备库设施节点空间选址。主要结论如下:
(1) 青藏高原地方粮食储备达到消费量的24.04%才能保障区域粮食安全,粮食储消比高于联合国粮农组织最低粮食储备水平。青藏高原地方粮食储备总规模约为81.51万t,粮食储消比为24.04%,高于联合国粮农组织17%~18%的最低粮食储备水平;其中农业区和半牧业区粮食储消比分别为22.50%和22.49%,牧业区粮食储消比较其他区域高,达45.00%。
(2) 青藏高原本地粮食生产无法同时满足区域粮食消费和储备需求,2020年全区粮食缺口约181.73万t,农区、牧区及半农半牧区粮食缺口分别为124.43万t、33.16万t和24.14万t。县级行政单元粮食产消储平衡差异显著,大部分县市粮食产量不能满足粮食消费和储备需求,需从外地调入粮食补库,31个县市可以实现产储消平衡,仅占全区县市数量的27.19%,其中白朗、林周、湟中、都兰、贵南、门源、江孜的粮食结余量在1.79万 t以上,可能出现季节性供给过剩。
(3) 综合考虑地形坡度、交通运输调节、经济发展水平、社会协作调剂以及行政区划,初步建立了青藏高原三级粮食后备储备库空间布局体系,由2个一级节点、15个二级节点和114个三级节点构成。一级节点是区域性粮食储备中心,覆盖面积广,服务半径大,粮食调配响应时间不超过48 h;二级节点是次级区域性粮食储备中心,主要负责市域范围内的粮食储备调运,大部分响应时间不超过24 h;三级节点是县级粮食储备中心,一半以上的区域响应时间不超过12 h。
3.2 讨论
(1) 本文研究结果与相关研究结果[8]可以相互验证,具有政策参考意义。本文基于2020年青藏高原县级单元常住人口和人均口粮消费需求测算了青藏高原地方粮食储备总规模,约为81.51万t,其中青海和西藏分别约为51.56万t和29.95万t,如果考虑旅游人口,青藏高原粮食储备规模将增至87.52万t。2020年青海和西藏旅游人口分别达2483.85万人次和2628.76万人次,按照供应旅游人口15 d的口粮消费保障核算,两省粮食储备需求规模将分别增加2.92万t和3.09万t,即青海和西藏的粮食储备需求规模将分别增至54.48万t、33.04万t。韩建军等[8]利用空间计量模型预测研究了2020年全国的地方粮食储备规模,其中青海和西藏地方粮食储备规模需求分别为71.76万~74.95万t和41.79万~49.64万t,两者合计113万~114万t,与本文的研究结果近似。按照现有国家政策性储粮规定核算[7-8],2020年青海和西藏粮食储备规模分别为47.04万t和28.97万t,合计76.01万t,与本文研究结果仅相差5.5万t,如果考虑旅游人口储粮需求,二者差距为11.51万t。综上,本文研究结果比韩建军等[8]的研究结果稍低,而比现有国家政策实施方案稍高,粮食储备规模介于二者之间,总体上相差均不大,但本文充分考虑了青藏高原内部不同地域粮食生产与消费特征的空间差异,更符合现实情况,对进一步优化青藏高原粮食储备制度具有一定的政策启示作用。
(2) 青藏高原现实粮食储备比理论值偏低,扩容补库任务艰巨。2017年青海和西藏实际地方粮食储备规模分别仅50万t和10万t,两省地方粮食储备规模比理论值低26.39%,尤其西藏粮食储备规模与理论安全值相差较大,2020年2月为应对疫情期间粮食市场异常情况,西藏临时新增地方储备青稞1万t,但与理论值仍有较大缺口。“手中有粮,心中不慌”,2022年以来全球出现新一轮粮食价格上涨,联合国食品、谷物价格指数均创1990年以来新高,随着俄乌冲突、异常气候、粮食贸易保护主义等因素的负面影响将进一步发酵,全球粮食安全形势将更加严峻,建议进一步夯实青藏高原地方粮食储备规模。宁可备而不用,不可用而无备,完善与区域粮食生产和消费习惯相适应的地方储备粮数量、品种结构和库点布局,同时改善粮食仓储设施、提升粮食仓储技术,确保关键时候能有效发挥地方粮食储备“蓄水池”和“稳定器”的作用,保障青藏高原粮食安全和经济社会长治久安。
(3) 本文未考虑粮食储备品种结构、储存成本和调运费用等因素,未来拟结合运费、仓储建设成本、粮食轮换成本以及粮库管理成本等,进一步细化青藏高原粮食储备研究。
参考文献
新时期我国粮食仓储设施合理规模和布局规划研究
[J].
Research on the reasonable scale and layout planning of China's grain storage facilities in the new era
浅谈中国古代粮食仓储管理制度
[J].
On the ancient Chinese grain storage management system
中国粮食储备的运行效力: 基于国别比较的分析
[J].
Operational effectiveness of China's grain reserves: An analysis based on country comparisons
Food stocks and grain reserves: Evaluating whether storing food creates resilient food systems
[J].DOI:10.1007/s13412-015-0276-2 URL [本文引用: 1]
增强应对突发事件冲击的粮食安全保障能力
[J].
Enhancing food security capabilities in response to emergencies
《关于完善粮食流通体制改革政策措施的意见》(国发〔2006〕16号)
[EB/OL]. 2008-03-28 [2023-02-20]. http://www.gov.cn/zhengce/content/2008-03/28/content_3590.htm.
'Opinions on improving the policy measures of grain circulation system reform' (Guo Fa No. 16)
2008-03-28 [2023-02-20]. http://www.gov.cn/zhengce/content/2008-03/28/content_3590.htm.]
区域粮食储备的地区差异与规模确定分析
[J].
DOI:10.31497/zrzyxb.20190302
[本文引用: 7]

粮食储备对维护粮食安全和保障社会安定具有重大意义。在我国粮食产供需的时空差异持续加剧背景下,以省域为单元,利用空间探索性分析法研究我国近年来区域粮食储备的时空演变和地区差异,并利用空间计量模型对区域粮食储备规模的影响因素进行分析,给出分区域的粮食储备规模确定方式。结果发现:我国粮食储备具有显著空间正相关性,高储备区向东北地区扩展,低储备区进一步向西部地区转移,两者的显著集聚范围逐渐扩大,致使地区差异逐渐增大;区域粮食储备规模与粮食生产能力、人口规模、经济发展、灾害影响、交通条件和社会影响力紧密相关;综合考虑空间效应和相关因素确定区域粮食储备规模,为我国分区域粮食储备研究提供新思路。
Spatial differences and scale determination of regional grain reserves
DOI:10.31497/zrzyxb.20190302
[本文引用: 7]
Grain reserves are of great significance to the maintenance of food security and social stability. Recently, the gap between the time and space in production, supply, and demand of grain in China has been continuously increasing, which leads to the unreasonable regional grain reserves scale problems of China. Taking province as research unit, this paper analyzed the temporal evolution and regional differences of regional grain reserves by utilizing spatial exploratory analysis and dissected influencing factors of regional grain reserves scale through spatial econometric model. It provided a definite method of regional grain reserves scale for different sub-regions. The results showed that: China's grain reserves spatial correlation index is bigger than zero and increased year by year, indicating that different regional reserves scales have significant positive spatial correlation. The overall distribution of China's grain reserves shows a polarization from east to west and has undergone a significant spatial-temporal evolution with high reserves area expanding to the northeast and low reserves area transferring to the west, which caused the increasing regional differences. Regression analysis shows that the scale of regional grain reserves is closely related to grain production capacity, population size, economic development, disaster influence, transportation conditions and social influence. The regression coefficient of the spatial lag term was 0.2451, manifesting that the geographical positive spatial correlation of regional reserves scales transmits through adjacent areas. Based on this, this paper put forward the prediction range of regional grain reserves scale in 2020 by considering the spatial effect and correlative factors, which provides a new perspective for researches on regional grain reserves in China.
中国粮食储备体系的演进逻辑、现实矛盾与优化路径
[J].
The evolutionary logic, practical contradictions and optimization path of China's food reserve system
农户粮食储备规模及行为影响因素分析: 基于四省不同粮食品种的调查
[J].
Analysis of the influencing factors of farmers' grain reserve scale and behavior-based on the survey of different grain varieties in four provinces
Food price and supply stabilization: National buffer stocks and trade policies
[J].DOI:10.2307/1239913 URL [本文引用: 1]
中国粮食储备规模模拟优化与政策分析
[J].
Simulation optimization and policy analysis of grain reserve scale in China
基于国家粮食安全的专项储备粮规模研究
[J].
Research on the scale of special grain reserves based on national food security
我国粮食安全预警机制研究
[J].
China's food security early warning mechanism research
市场整合、储备规模与粮食安全
[J].
Market integration, grain reserve capacity and food security
对消费量测算前提下的粮食储备规模分析
[J].
An analysis of grain reserve scale under the precondition of calculating the consumption
储粮损失与农户储粮决策: 基于23省1199户玉米种植户的实证分析
[J].
Storage losses and households' storage decision in China: Based on the survey data of 1199 corn growers from 23 provinces
重大公共安全事件对农户粮食储备行为影响研究: 以新冠肺炎疫情为例
[J].
Impact of major public safety events on farmers' food storage behavior: An example of the COVID-19 pandemic
粮食筒仓储粮和卸粮状态下的仓壁侧压力试验研究
[J].
Experimental study on side pressure of grain silo under storage and discharging state
新时期粮食高效收储与管理模式研究
[J].
Research on efficient grain purchasing, storage and management mode in the new era
粮仓哲学: 对储粮科技走向智慧化的哲学思考
[J].
Granary philosophy: Philosophical thinking on the intelligence of grain storage science and technology
青藏高原交通运输发展的环境背景条件分析
[J].
Analysis of the environmental background conditions for the development of transportation in the Qinghai-Tibet Plateau
西藏粮食安全状况及主要粮食供需关系研究
[J].
DOI:10.11849/zrzyxb.20160133
[本文引用: 1]
西藏粮食安全事关当地的长治久安以及社会经济的可持续发展。论文基于2010年农户层面的食物消费调研数据,并且结合粮食市场调研、粮食加工企业调研以及政府部门调研数据等,在研究西藏粮食生产和消费基础之上,重点分析了西藏主要粮食(青稞、小麦和水稻)供应和需求之间的关系。结果显示,全区粮食供应数量较高,特别是外地调入粮食供给能力不断增强,提高了西藏粮食安全保障程度。2010年全区主要粮食生产为85.09万t,而家庭层面主要粮食消费为88.81万t,粮食生产和消费基本持平;但是考虑到本地粮食消费比重为60.8%,2010年本地粮食消费只有54.0万t。从整个西藏地区来看,虽然西藏地区粮食供应已经大于其需求(西藏地区三大粮食作物总供应146.3万t,而总需求超过95.9万t,供应为需求的1.5倍),但是从不同地区来看,区域之间的粮食供需差别非常大,尤其是藏北牧区(主要是那曲地区),粮食缺口比较大,未来需要加强藏北地区粮食的供给力度,提升其粮食安全的保障能力。随着内地粮食进藏数量和种类不断增加,未来需要进一步转变粮食购销体制系统,把粮食生产者(即农民)考虑在粮食流通市场之内,进一步加强和重视西藏粮食生产者在粮食流通中所发挥的作用,从而增加西藏农村地区家庭中余粮流通,增加青稞特色产业发展,提高农民收入。
Food security situation and major grain supply and demand in Tibetan region
DOI:10.11849/zrzyxb.20160133
[本文引用: 1]
<p>Food security is related to the lasting stability and the sustainable development of social economy in Tibet. Based on data from household food survey and data from food market, food processing enterprises and government departments, we investigated grain production and consumption (highland barley, wheat and paddy) in Tibet. An analysis of grain supply and demand in the year of 2010 was carried out. The result showed that there was a high grain supply in 2010, which indicated that there was a high grain security in Tibet. The total grain production in 2010 was 85.09 thousand tons, and the total amount of grain consumed by local population was 88.81 thousand tons, so there was roughly a balance between grain production and consumption. But when considering that 60.8% of the grain consumed was from local production, the actual of local grain consumption was 54.0 thousand tons, which indicated that the amount of local grain production was higher than local grain consumption. Although the grain supply has been greater than the demand in Tibet (the total grain supply from major grain crop was 146.3 thousand tons, and the total grain demand was 95.9 thousand tons, and the supply was 1.5 times of demand), there was large regional disparities, especially in north Tibet (for example Nagqu prefecture) where there was an large grain supply gap in Nagqu. It is needed to strengthen the food supply in that region and improve the food security. With the increasing number and variety of foods from other provinces, the Tibetan government should transform the food marketing system of Tibet to take food producers (farmers) into the grain circulation market, and further strengthen and emphasize the role they played in food market, and focus on highland barley industry to raise local farmers’ income.</p>
青藏高原粮食生产、消费及安全风险格局变化
[J].
DOI:10.31497/zrzyxb.20190401
[本文引用: 1]
青藏高原是中国粮食短缺地区之一,提高其粮食自给能力和确保粮食安全一直受到中央和地方政府的高度重视。在修订牧业区和半农半牧地区人均粮食消费需求量标准的基础上,利用1985-2015年青藏高原县级行政单元粮食产量和消费数据,采用波动系数法、分级法、重心模型以及粮食短缺指数模型,分析青藏高原粮食生产和消费的时空变化特征,并评估114个县市的粮食安全风险状况。结果表明:青藏高原粮食生产与消费空间分布不均衡,粮食生产呈环形分布在青藏高原东部湟黄谷地、藏东和藏南沿江河谷地带,中部和西部粮食产量较低,粮食消费呈东高西低格局;本地粮食生产不能满足居民消费需求,区域粮食缺口量达21.04万~121.69万t,相当于粮食消费需求的8.22%~40.11%,考虑旅游人口的影响,2015年区域粮食缺口达132.92万t;青藏高原粮食安全风险较高的地区广泛分布在藏北高原、青南高原、祁连山地以及城市化水平较高的拉萨市辖区和西宁市辖区,旅游业发展对林芝市的粮食安全风险影响显著;单纯依靠粮食增产不能解决区域粮食问题,建立完善的粮食储备和交通物流体系、加强与内地及周边国家的粮食贸易合作,是保障青藏高原粮食安全的关键。
Spatial patterns and their changes of grain production, grain consumption and grain security in the Tibetan Plateau
DOI:10.31497/zrzyxb.20190401
[本文引用: 1]
The problem of grain shortages has long plagued the Tibetan Plateau, therefore both the state and the local government are scaling up efforts to achieve grain self-sufficiency and grain security in this region. Meanwhile, many researchers devoted themselves to study the grain security issues to provide rational advices. Here in this paper, we intended to analyze the temporal and spatial characteristics of grain production and consumption in the Tibetan Plateau and then evaluate the risk status of grain security in 114 counties. First, we revised the standards of per capita grain consumption demand in pasturing area and farming-pastoral region. Then, on this basis, we analyzed the corresponding data of the 114 counties during 1985-2015 by applying the fluctuation coefficient method, classification method, barycenter model and the index model of grain shortages. Analytical results showed that there was a non-uniform geographical distribution of grain production and consumption, moreover, the holistic status of grain security in the Tibetan Plateau was not optimistic. (1) The production of grain increased in fluctuation and the consumption of grain grew steadily, the local grain production could not meet the consumption demand, and the deficit amounts were between 0.21 and 1.22 million tons annually, which accounted for between 8.22% and 40.11% of the grain consumption. The gap between grain production and consumption including tourists increased to 1.33 million tons in 2015. (2) The spatial distributions of grain production and grain consumption in the Tibetan Plateau were imbalanced, the grain yields in Huang-Huang valley and the valley along the?Yarlung?Zangbo?River were higher, while the yields distributed in the central and western parts of the plateau were lower. Affected by population, city, and traffic distribution, the grain consumption was high in the eastern part and low in the western. (3) The spatial patterns of grain security in the Tibetan Plateau in 2015 showed that the higher-risk types involved 42 counties with a population of 2.92 million, and they were widely distributed in western Tibet, northern Tibet, southern Qinghai, Qilian Mountains, as well as in municipal districts of cities of Lhasa and Xining; compared to 1985, the risks of grain security on the midstream and downstream of Yarlung Zangbo River and southeastern Qinghai province were mitigated, while those in western Ngari and northeastern Qinghai were intensified. (4) The tourists increased the risks of grain security in Lhasa, Nyingchi, Shannan, Shigatse, Haidong and Hainan cities, and the negative influence of tourist on Linzhi city was most significant. (5) Production increase alone cannot solve the problem of grain shortage, so it is urgent for the Tibetan Plateau to improve the grain reserves, transportation facilities and expand the grain trade with other regions to achieve regional grain security.
基于道路网络分析的省际粮食运输成本研究
[J].
Research of inter-provincial grain transport costs based on GIS network analyst
论青藏高原范围与面积
[J].
A discussion on the boundary and area of the Tibetan Plateau in China
DOI:10.11821/yj2002010001
[本文引用: 1]
<p>The Tibetan Plateau is a unique geomorphic unit composed of some basic geomorphic types, such as extreme high mountains,high mountains, hills, plains, and tablelands of high altitude or sub-high altitude. Different opinions for the exact scope of Tibetan Plateau exist. According to latest research achievement and the long time fieldwork, questions related to the area and boundary of the Plateau have been discussed in view of geography, and the principles taking geomorphic characters as the main rule and considering the integrity have been made to define the boundary. The 1∶1 000 000 geomorphological map was compiled based on 1∶100 000 aerial photographic map,1∶500 000 topographic map and interpretation of satellite images. By refering to the 1∶3 000 000 relief map, the boundary of the Plateau was delineated.The position of the boundary was quantitatively determined with GIS and GPS.The map of electronic version of the Tibetan Plateau was compiled. The main conclusion is that Tibetan Plateau starts from the southern edge of the Himalayan Range, abuts on India,Nepal and Bhutan,connects the northern edge of Kunlun, Altun and Qilian Mts., and joins Tarim Basin and Hexi Corridor in Central Asia.The west of it is the Pamirs and Karakorum Mts., bordering on Kirghizistan, Tajikistan, Afghanistan, Pakistan and Kashmir. The east of it is Yulongxueshan, Daxueshan, Jiajinshan and Qionglaishan Mts.as well as south or east piedmont of Minshan Mts. Tibetan Plateau joins the Qinling Mts.and Loess Plateau with its eastern and northeastern part. Tibetan Plateau in China's territory starts from the Pamirs in the west and reaches to Hengduanshan in the east. It bestrides a longitude of 31 degrees with a length of 2 945 km from east to west,and bestrides a latitude of 13 degrees with a length of 1 532 km from south to north. It ranges from 26°00′12" N to 39°46′50" N and from 73°18′52"E to 104°46′59"E, covering an area of 2 572.4×10 3 km 2. Administratively, it embraces 201 counties (cities) in 6 provinces, namely, the Tibet Autonomous Region (73 counties/cities,1 176.0×10 3 km 2, part of Cona, Mêdog and Zayü), the Qinghai Province(40 counties/cities,721.0×10 3 km 2, some counties only partially), Dêqen Tibetan Autonomous Prefecture in Northwest Yunnan Province(9 counties/cities,33.5×10 3 km 2), West Sichuan Province (46 counties/cities about 254.0×10 3 km 2,such as Garze Autonomous Prefecture, Aba Tibetan and Qiangzu Autonomous Prefecture,and Muli Autonomous County, etc.),Gansu Province(21 counties/cities, 74.9×10 3 km 2), and Southern Xinjiang Uygur Autonomous Region (about 12 counties/cities, 313.0×10 3 km 2).</p>
我国粮食区域供需平衡以及引发的政策启示
[J].
Regional balance of grain supply and demand in China and the policy implications
产销平衡区粮食安全水平及空间差异
[J].
Food security level and apatial sifference in balanced production and marketing areas
中国未来人口发展的粮食安全与耕地保障
[J].中国人口发展的粮食安全与耕地保证程度研究表明,随着人口增长和消费扩张,中国未来的耕地规模和人均耕地面积会进一步下降,人均粮食消费水平和粮食需求总量将进一步提高;2020年在人均粮食420~435kg的消费水平上,基于18亿亩耕地保证的粮食生产能力可以基本满足14.36亿人口的粮食需求;在人均450kg的消费水平上,中国未来耕地的粮食生产能力足以支持人口高锋时间的14.73亿人,但受耕地资源有限约束,人均粮食占有水平很难有进一步提高。从耕地、粮食与人口关系看,中国未来人口的粮食安全必须向食物安全转变,从耕地资源约束的粮食生产与人口增长驱动的食物消费两端着眼:一方面要重视耕地与粮食安全——藏粮于土,全面提高土地资源综合生产能力;一方面要关注食物与消费安全——倡导适度消费,建立动植物并重型食物结构;从生产与消费两方面来认识和解决中国中长期人口发展的食物安全与耕地保障问题。
Future food security and arable land guarantee for population development in China
The study aims to explore food security and arable land guarantee for population development in China. The results indicate that the increase of future population and food consumption will be definitely coupled with a decrease in total arable land and per capita arable land area, as well as an increase in per capita food consumption and total food demand. The findings highlight that a total of 120 million ha of arable land will have to be reserved for ensuring grain demand of about 1.44 billion people at a per capita consumption level of 420-435 kg grain. And at a per capita consumption level of 450 kg grain, the grain production capacity of arable land could meet grain demand of about 1.47 billion people-estimated peak of the Chinese population. However, further increase in per capita grain occupancy is not optimistic, thanks to the restriction of limited arable land resources. The relationship between arable land area, food production and population suggests that emphasis on future food security be transferred into grain security, and the focus be placed on food production restricted by arable land and on the increasing grain consumption driven by population growth. Thus, special attention should be paid, on the one hand, to the arable land area and food production, i.e., improvement in land productivity, and on the other hand, to the security of food production and consumption through formation of moderate consumption ideology and establishment of reasonable food structure for proper intake of animal and plant nutrition. The study concludes that both production and consumption factors should be taken into consideration for ensuring the Chinese food security and arable land for population development in the middle and long run.
成品粮应急储备库建设设计要点(国粮办展〔2012〕37号)
[EB/OL]. 2020-11-12 [2023-02-20]. http://www.lswz.gov.cn/html/zfxxgk/2020-11/12/content_262051.shtml.
Grain emergency reserve construction design points (National Food and Strategic Reserves Administration Office Enforcement No.37)
2020-11-12 [2023-02-20]. http://www.lswz.gov.cn/html/zfxxgk/2020-11/12/content_262051.shtml.]
我国粮食库存规模研究(1980—2003)
[J].
Study on the scale of China's grain inventory (1980-2003)
气候变化对青海省青稞物候期的影响
[J].
Impact of climate changes on the phenology of hulless barley in Qinghai Province
小麦在拉萨生态条件下一些生育特点的分析
[J].
Analyses to some characters of growth and development for wheats under ecological conditions in Lasa
Ecological experiments of wheats was arranged in Lasa during 1982—1985. Liaochun 6 is a typical spring wheat, on the other hand, Taishan 4 is a winter variety. Heading and maturation were postponed, so were the growth periods and periods from sowing to maturation for wheats in Lasa. The low temperature was an important influential factor. Plant height of wheats was higher in Lasa, because growth periods was longer. The difference of temperature between day and night was bigger, the night temperature was lower, and the radiation of sun was stronger than most places in China, this contributes to the bigger weight of the seed.
拟建西藏国家储备粮基地的几点思考
[J].
Some thoughts on the construction of Tibet national grain reserve base
我国粮食综合运输费用与最优物流路径研究
[J].
Study on China's grain comprehensive transportation cost and optimal logistics path
基于P-center问题的国家级应急物资储备设施选址优化布局研究
[J].
The research of location problem of national emergency reserve facilities for emergency relief based on P-center problem
基于选址理论的小城镇应急物资储备库优化配置: 以北京房山区为例
[J].
Allocation of small-town emergency material depository based on location theory: A case study of Fangshan District in Beijing
DOI:10.11821/yj2011060004
[本文引用: 1]
Urbanization has entered a key stage in China. Since the implementation of the policy of "small town, grand strategy", small towns have played a critical role in China's urbanization. However, China is one of the countries that have suffered various natural disasters, and is fighting against technological accidents as well as more terrorist attacks and criminal activities. China is confronted with a great challenge to strengthen the emergency management for small towns, so it seeks for a resource allocation system with flexibility, fluency, punctuality, rationality and effectiveness. The Chinese Government is therefore striving to intensify the emergency management system. For instance, according to the plan of Beijing government, every big community or neighborhood in Beijing will establish one to two emergency material depositories in the coming 3 to 5 years. So far there have been relatively few documents on the allocation of small-town emergency material depository with quantitative methods. Besides, the location of traditional facilities seldom focused on the satisfaction difference of demand points within the covering radius of facilities. In the light of this situation, we present a maximal covering location and build a maximal covering model as an integrated programming under the goal of maximizing the total satisfaction of demand points. After investigating the model, we introduced an ant colony optimization (ACO) algorithm to solve the considered problems. Then, we obtained the allocation result of emergency material depository of Fangshan District in Beijing. The computed results have shown that the model we proposed is a solution to facility location in a more effective manner. Finally, we give suggestions to future research.
公共设施区位理论视角下的避震空间体系规划: 以常熟市为例
[J].
Disaster prevention space system with public facility location theory: Changshu case
1976—2016年青藏高原地区通达性空间格局演变
[J].
DOI:10.11821/dlxb201906009
[本文引用: 1]
青藏高原地区是地球上最独特的地理—生态—人口—交通单元,区域内交通网络的发展特征及规律是人地关系协同发展的一个重要切入点,对青藏高原地区交通网络开展研究具有重要意义。据此,分析1976-2016年青藏高原地区交通网络演化特征,并以省会、地级市、县级市和县城为节点,采用网络分析的时间距离计算模型探讨其通达性演变过程。研究表明:① 青藏高原地区交通网络复杂性、区域连通性增强,初步形成格状交通网络;② 青藏高原地区中心城市、县城之间的平均最短通达时间已极大缩短至11.89 h、18.84 h,呈自东向西逐渐增大的空间格局,时空收敛效应显著,通达性变化程度与其初始值有关;③ 中心城市为该地区的发展极,其与周围城市通达状况有极大提高,可达时间平均值下降到16.49 h;④ 中心城市和县城交通圈演变过程一致,青藏高原地区各地到最近城市、县城的通达时间不断缩小,沿重要交通干线已形成中心城市4 h、县城2 h短时交通圈连片分布格局,湟水河谷地、一江两河地区逐渐形成交通廊道,乡镇对外交通联系得到改善。
Evolution of accessibility spatial pattern of the Qinghai-Tibet Plateau in 1976-2016
DOI:10.11821/dlxb201906009
[本文引用: 1]
The Qinghai-Tibet Plateau is a unique geography-ecology-population-traffic region on the earth. The characteristics and regularities of the transport network development are an important breakthrough for the coordinated development of man-land relationship, which is of great significance to the research in the Qinghai-Tibet Plateau. Accordingly, this paper analyzes the evolution of transport network in this region between 1976 and 2016, and explores its accessibility using a temporal distance calculation model based on network analysis by taking provincial capitals, prefecture-level cities and counties as transport nodes. Results suggest that, first, transport network is more complex and the regional connectivity is gradually enhanced in the plateau, preliminarily forming a grid-like transport network; second, the average minimum accessibility time between anchor cities and between counties has been vastly reduced to 11.89 hours and 18.84 hours, manifesting a gradually growing spatial pattern from east to west and remarkable effects of time-space convergence; third, anchor cities are the poles of regional development, with average accessibility time to around cities reduced to 16.49 hours, indicating that anchor cities tied with others have been improved; fourth, the traffic circles of anchor cities and counties are evolving consistently, accessibility time from various places in the study area to their nearest cities or counties are decreasing, presenting a contiguous pattern of short-time traffic circle with 4-hour access to central cities and 2-hour access to counties along important arterial roads, thus improving external transport connection of towns. And traffic corridors are gradually formed in the Huangshui River Valley, and the Middle Region of "One River and Two Streams" in Tibet.
青藏高原市域综合交通优势度评价及空间特征: 以林芝市为例
[J].
DOI:10.18306/dlkxjz.2021.08.007
[本文引用: 1]
青藏高原的特殊性长期约束着交通设施的建设与功能,科学评价其交通状况具有重要意义。论文以林芝市为例,考虑自然特征、多种交通方式及交通稳定性,构建综合交通优势度评价体系进行实证探讨。研究发现:① 综合交通优势度以巴宜区、米林县、工布江达县得分较高,其中中心乡镇尤其明显,分别在内部交通功能、对外交通功能、区位优势度方面具有优势,察隅县、墨脱县综合交通优势度及各分项得分均较低,G318、林拉公路、米林机场等重点交通设施影响突出;② 林芝市综合交通优势度的县域差距及空间极化效应趋于增强,但中心—外围结构的空间完整性被地形等因素隔离破坏,边境地区成为林芝市综合交通优势度最为薄弱的环节;③ 综合交通优势度与人口分布具有一定匹配性,多数乡镇二者之间呈协调水平,但以初、中级协调为主,边境和自然条件约束明显的地区尚需考虑优化。根据林芝市特点,改进后的综合交通优势度评价更好地揭示了区域交通薄弱地区,对青藏高原或其他类似特殊地域单元的交通设施评价具有参考意义。
Comprehensive traffic advantage degree and its spatial characteristics at the prefecture level on the Qinghai-Tibet Plateau: A case study of Linzhi City
DOI:10.18306/dlkxjz.2021.08.007
[本文引用: 1]
The unique natural environment of the Qinghai-Tibet Plateau has restricted the construction and function of its transportation infrastructure. In order to evaluate the traffic facilities on the Qinghai-Tibet Plateau, taking Linzhi City, a typical area of southeastern Tibet with high altitude and uneven terrain, as an example and considering the natural characteristics, various transport modes, transport stability, and location advantage, this study established an evaluation system of comprehensive traffic advantage degree to empirically examine the situation in 2015 and 2020. The results show that: 1) Bayi District, Milin County, and Gongbujiangda County, especially their central towns, have much higher scores in internal traffic function, external traffic function, and location advantage degree, while the values of traffic advantage and many of its indicators in Chayu County and Motuo County are low, and the impact of some key transportation infrastructures such as the G318 Highway (national highway), Linzhi-Lhasa Highway, and Milin Airport is prominent. 2) The results of spatial difference analysis show that the comprehensive traffic advantage degree of Linzhi City is unbalanced, and the county-level gap and spatial polarization effect tend to increase. However, the core-periphery spatial structure is fragmented and interrupted by terrain factors of extreme difference in altitude, and the border area of Linzhi City becomes the weakest part with regard to the comprehensive traffic advantage degree. 3) There is a certain degree of matching between the comprehensive traffic advantage degree and the population distribution as shown by the linear trend line and coupling coordination relationship. Bayi District, Milin Town, and Gongbujiangda Town have reached the high-quality coordination level. However, most of the towns are at the preliminary or intermediate coordination level, while in the border area and areas with severe natural constraints, the coordination degree urgently needs to be optimized. Methodologically, by superimposing regional natural attributes, expanding the evaluation dimension of traffic advantage degree, and integrating various modes of transportation, the comprehensive traffic advantage evaluation conforms to the actual situation of the study area. Regional transport evaluation that incorporates the consideration of natural environment characteristics has practical significance for supporting territorial planning and transportation infrastructure evaluation and management, especially for regions such as the Qinghai-Tibet Plateau.
2018年青海省粮食流通工作会议在西宁召开
[EB/OL]. 2018-03-16 [2023-02-20]. http://www.lswz.gov.cn/html/zt/lsltgzhy2018/2018-06/14/content_237259.shtml.
The 2018 Qinghai Provincial Grain Circulation Work Conference was held in Xining
2018-03-16 [2023-02-20]. http://www.lswz.gov.cn/html/zt/lsltgzhy2018/2018-06/14/content_237259.shtml.]
