

城市的生长发育受内外因素作用。非洲国家近代城市化受殖民主义外来影响深刻,殖民者为满足其经济掠夺和政治统治的需要,促使早期非洲城市依托沿海港口、交通枢纽和矿产资源产地分布,并发展形成了当前主要大城市[1-2]。随着殖民势力的消退、人口流动政策的放开以及人口数量的增长,非洲国家的小城镇发展迅速,2010年50万人口以下的城市人口增长仅次于最大城市,预计至2030年城市增长的2/3将发生在人口少于50万的城市[3]。面广量大的中小城市连接广大农村和主要大城市,充当农村腹地与主要城市之间商品和服务流通节点,发挥调节区域粮食经济、提供制造业及服务业的功能,对促进区域经济结构转型起到重要作用。同时,中小城市存在资源和能力不足、难以应对快速城镇化的问题:缺乏工作和公共产品使得“贫民窟城镇化”在小城镇更为普遍[4];城市贫困化,导致城镇建设呈现低质量、低密度蔓延特征[5];而且城市规划效率低下,大多数城市规划都未与重大基础设施挂钩[6],这些都阻碍城市可持续发展目标实现。与大城市相比,这些小城镇发展模式代表了区域城镇化主体。非洲发展银行、世界经合组织及联合国发展署联合发布的《非洲经济展望2016:可持续城市和结构转型》总结了城镇化的5类国家:多元化、前城市化、后城市化、农业型和资源型,并认为对所有5类国家而言,中小城市是政府促进经济结构转型的关键[3]。已有研究基于案例分析,指出加强制造业基地建设、提升服务业水平、增强与区域和全球经济联系、建设城市网络,将有助于促进不同类型国家中小城市发展和区域经济结构转型[7⇓⇓-10]。然而,非洲城镇化研究长期以来受数据稀缺限制,难以获得城市人口及城市地域范围的最新和准确数据,已有研究关注肯尼亚、坦桑尼亚等个别国家[11-12],需要更多系统性分析来深化理解中小城市时空演化规律,指导中小城市网络化发展。
国内城市形成发展的相关研究侧重于利用历史数据对不同尺度区域内城市的空间演化规律进行分析,从地形、气候、河流、森林、矿产资源等自然环境因素,以及交通、基础设施、城市所处的经济发展阶段与工业化进程等社会经济因素入手,探究影响城市空间分布的因素[13⇓⇓-16]。相较于对国内城镇研究,对非洲人口及城市空间分布的分析除考虑自然条件外,已有研究更着重于其殖民主义基础,强调沿海港口、交通枢纽等的作用[17⇓-19]。受数据资料获取的限制,对非洲城市空间分布影响因素,尤其是社会经济因素的量化分析不足。最大熵(maximum entropy)原理起源于信息论与统计力学,是利用有限信息无偏推断未知分布的一种方法,普遍适用于预测物种空间分布[20-21]、物种间相互作用[22]、食物网的度分布[23]等生态学应用。在预测物种空间分布方面,以最大熵原理为基础的生态位模型应用最为广泛。近年来,地理学研究中开始引入最大熵模型,主要应用仍是通过自然环境变量进行预测,包括遗址预测[24]、人类活动适宜区预测[25-26]、人类活动演变规律探索[27]等。最大熵模型也常与其他传统地理学方法相结合,例如与元胞自动机结合[28]、与AHP结合[29],以提高结果精确度。此外,将社会经济变量融入传统的最大熵模型,已成为一种研究趋势。Bajat等[30]利用最大熵模型在空间上追踪塞尔维亚南部人口变化情况,认为除考虑居住环境的偏好外,也应考虑政治与社会经济问题;Cardona- Almeida等[31]选定电力消耗、水需求、高等教育率3个社会经济变量,建立了哥伦比亚人口分布最大熵模型。尽管最大熵原理在地理学的应用范围正逐步拓展,但目前应用于城市研究的最大熵模型仅仅是其衍生的熵权法、TOPSIS熵权法、最大熵出行分配等方面,在城市的不确定性问题上仍缺乏充分的探索[32]。
东非各国在整个非洲地区的城市化基础最为薄弱,1970年城市化水平约为10%[33],至2018年达到28%,仅增长了不到20个百分点,远低于同年非洲整体水平(43%)[34]。此外,2016年东非居住在小于50万居民的定居点的人口比例高达91%,而这一比例在非洲其他地区均未超过80%(西非80%、北非77%、中非74%、南非65%)[4]。2015年3月,国家发展改革委、外交部、商务部联合发布了《推动共建丝绸之路经济带和21世纪海上丝绸之路的愿景与行动》,提出“一带一路”建设将致力于亚欧非大陆的互联互通[35]。东非作为非洲大陆的重要门户,既是海上丝绸之路的自然延伸,也是向非洲内陆辐射的重要节点,在“一带一路”建设中发挥着重要的作用[36]。中国与东非国家的合作面临着5大挑战:政治转型的影响、营商环境有待改善、制约发展的瓶颈突出、安全风险总体较高、外部经济环境冲击[37]。因此,摸清现阶段东非发展状况,有助于降低合作风险,开展针对性援助与帮扶。基于以上背景,本文对坦桑尼亚、乌干达2个东非典型国家的城市进行了等级划分与数量统计,以10万人口以下的小城市及城镇为研究对象,选取自然环境与社会经济变量,构建与运行最大熵模型,模拟评估城市形成发展潜力区。研究结果将填补资料稀缺的东非地区小城镇研究不足,丰富小城镇发展理论,可为东非各国未来的基础设施建设、城市规划提供依据,为中方在东非的援助与投资提供参考。
1 研究区概况
东部非洲主要包括埃塞俄比亚、肯尼亚、乌干达、卢旺达、布隆迪、坦桑尼亚等在内的10个国家,北起厄立特里亚,南迄鲁伍马河,东临印度洋,西至坦噶尼喀湖。在东非各国家中,坦桑尼亚与乌干达城市化水平接近东非整体城市化水平平均线,2015—2020年城市化水平年增长率均超过5%,是近年来东部非洲城市发展较快的国家,因此选取坦桑尼亚、乌干达两国作为典型开展研究。
坦桑尼亚北与肯尼亚和乌干达交界,南与赞比亚、马拉维、莫桑比克接壤,西与卢旺达、布隆迪和刚果(金)为邻,东濒印度洋(图1),国土面积约为94.87万km2,其中大陆总面积约为94.63万km2。坦桑尼亚降水充沛,大部分地区平均气温为21~25 ℃,桑给巴尔的20多个岛屿终年湿热,年平均气温为26 ℃。在行政区划上,坦桑尼亚被划分为30个省(region)、169个地区(district)、3644个片区(ward)。其中,东部的达累斯萨拉姆(Dar es Salaam)是坦桑尼亚原首都,全国的政治、经济、文化、交通中心,东非重要港口。横贯坦桑尼亚的中央铁路、坦赞铁路均以达累斯萨拉姆为起点。1973年后,坦桑尼亚逐步迁都至多多马(Dodoma),后者的市政建设、基础设施等均在完善之中。21世纪以来,坦桑尼亚的城市化水平不断提高,2020年城市化水平整体达35%,但在国际上仍处于低水平。
图1
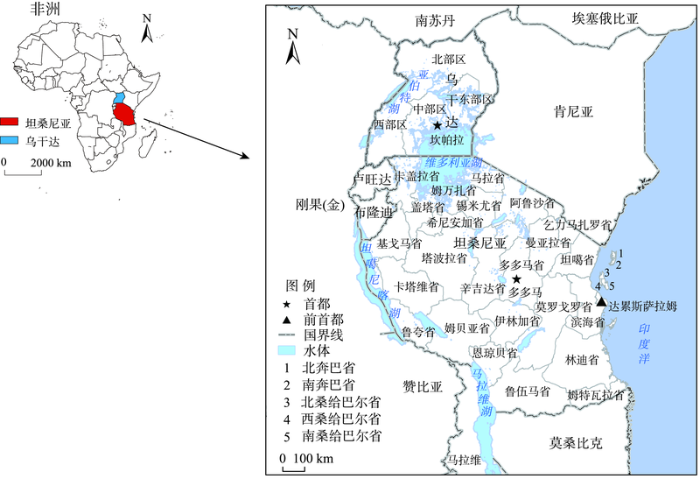
图1
坦桑尼亚与乌干达地理位置及行政区划图
注:本图中非洲地图(左上)基于自然资源部标准地图服务网站下载的审图号为GS(2020)4391号标准地图制作,底图边界无修改。坦桑尼亚行政区划边界底图来自坦桑尼亚国家统计局(
Fig.1
Administrative map of Tanzania and Uganda
乌干达为内陆国家,位于东非中心地带、横越赤道。北与南苏丹接壤,西与刚果(金)毗连,南界坦桑尼亚和卢旺达,东临肯尼亚,国土面积约为24.16万km2。气候温和,平均气温约在15.6~26.7 ℃之间;雨量丰富,国内平均年降雨量在1000 mm以上。乌干达全国划分为中部、东部、北部、西部4个大区,并在此基础上细划了135个地区(district)、309个县(county)、1544个乡镇(sub county/town council)。首都坎帕拉(Kampala)是全国最大城市,也是全国政治、经济、文化中心,历史悠久,也是非洲著名旅游城市之一。乌干达2020年的城市化水平低于坦桑尼亚,仅为25%,甚至未达到联合国分类中最不发达国家的城市化水平标准。
2 数据来源与研究方法
2.1 数据来源及预处理
2.1.1 城市数据
表1 城市等级划分及2019年坦桑尼亚、乌干达各等级城市数量
Tab.1
| 城市等级 | 划分标准 | 乌干达城市数量/个 | 坦桑尼亚城市数量/个 |
|---|---|---|---|
| 城镇 | 城市人口在1万~3万之间 | 99 | 186 |
| 小城市 | 城市人口在3万~10万之间 | 25 | 48 |
| 中等城市 | 城市人口在10万~100万之间 | 8 | 23 |
| 大城市 | 城市人口在100万以上 | 1 | 1 |
利用ArcGIS 10.2软件,将各等级城市中心面转换为各等级城市中心点,使点数据位于原面数据的几何中心,并纠正转换后落入湖泊河流中或超出国境线的城市中心点。为便于后续模型的运行,将调整后数据转换为CSV格式。
2.1.2 自然环境变量与社会经济变量数据
考虑对城市形成发展具有长期影响的区域性条件,基于已有研究[11-12],并考虑数据的可获得性与可量化性,选取自然环境与社会经济变量。为避免空间共线性的影响,预先对变量进行Pearson相关性分析,剔除了相关性较大的变量。本文最终选取了7个自然环境变量,包括降水、DEM、坡度、距水体距离、距森林距离、NDVI与土壤湿度(表2)。其中,降水数据从WorldClim网站(
表2 自然环境与社会经济变量及数据来源
Tab.2
| 变量 | 描述 | 单位 | 来源 |
|---|---|---|---|
| 自然环境变量 | |||
| prec | 降水 | mm | |
| dem | 高程 | m | |
| slope | 坡度 | (°) | |
| water | 距水体距离 | km | |
| forest | 距森林距离 | km | |
| ndvi | 归一化植被指数 | — | |
| soil | 土壤湿度(地下10 cm) | — | |
| 社会经济变量 | |||
| primary | 距全国性主要交通干线距离 | km | |
| secondary | 距区域性主要交通干线距离 | km | |
| railway | 距主要铁路距离 | km | |
| farmland | 距耕地距离 | km | |
| medium | 距中等城市距离 | km | |
| large | 距大城市距离 | km | |
为便于后续操作,将所有变量的投影坐标系统一为WGS 1984 UTM Zone 36S,空间分辨率统一为1 km×1 km,并转为ASCII格式。
2.2 研究方法:最大熵模型
基于Shannon的信息熵概念,最大熵原理最早由Jaynes[38]提出。信息熵是对信息的度量,信息增加将导致熵减少。因此使熵达到最大的概率是信息最少的分布,即无偏分布。
对于有限集
对于本文来说,
基于最大熵原理与机器学习算法,Phillips等[39]构建了物种空间分布的生态位模型,并编写了MaxEnt软件。本文使用了MaxEnt软件3.4.1版本,输入变量分别为CSV格式的城市中心数据,以及ASCII格式的自然环境变量、社会经济变量数据。以城市数据的75%作为训练数据集,25%作为测试数据集,重复10次取平均,并采用交叉验证(crossvalidate)方式验证。以受试者工作特征(receiver operating characteristic,ROC)曲线下面积(area under curve,AUC)对模型结果进行评价。AUC衡量了最大熵模型的预测效果,一般来说,AUC在0.5~0.6为失败,0.6~0.7为较差,0.7~0.8为一般,0.8~0.9为好,0.9~1.0为非常好[40]。模型最终将输出对整个研究区域的平均生境适宜度指数(habitat suitability index,HSI)用于预测。HSI越大,表明该地区越适宜物种生存。
3 结果与分析
3.1 小城镇形成影响因素及贡献
3.1.1 各变量描述性统计
表3 坦桑尼亚变量描述性统计
Tab.3
| 变量 | 城镇 | 小城市 | |||||||
|---|---|---|---|---|---|---|---|---|---|
| 最小值 | 最大值 | 平均值 | 标准差 | 最小值 | 最大值 | 平均值 | 标准差 | ||
| dem/m | 14.00 | 1825.00 | 1003.36 | 448.85 | 21.00 | 1947.00 | 942.85 | 541.46 | |
| farmland/km | 0 | 119.54 | 33.38 | 28.97 | 0 | 137.59 | 28.88 | 30.36 | |
| forest/km | 2.00 | 219.27 | 31.40 | 35.63 | 1.00 | 255.33 | 31.94 | 46.89 | |
| large/km | 23.09 | 1096.18 | 618.92 | 303.98 | 32.57 | 1017.79 | 547.16 | 265.68 | |
| medium/km | 4.12 | 454.25 | 93.43 | 82.88 | 22.09 | 471.30 | 99.45 | 90.94 | |
| ndvi | 0.21 | 0.69 | 0.42 | 0.10 | 0.25 | 0.64 | 0.41 | 0.09 | |
| prec/mm | 42.75 | 197.25 | 83.25 | 22.00 | 52.00 | 206.42 | 89.49 | 29.45 | |
| primary/km | 0 | 211.09 | 52.16 | 48.25 | 0 | 234.00 | 58.77 | 53.51 | |
| railway/km | 0 | 410.10 | 92.54 | 94.43 | 0 | 389.65 | 81.93 | 98.91 | |
| secondary/km | 0 | 77.41 | 9.79 | 14.53 | 0 | 53.25 | 8.31 | 13.22 | |
| slope/(°) | 0 | 20.08 | 2.15 | 2.33 | 0 | 17.13 | 2.09 | 2.73 | |
| soil | 0 | 0.36 | 0.26 | 0.07 | 0 | 0.34 | 0.25 | 0.07 | |
| water/km | 0 | 47.85 | 5.00 | 6.68 | 0 | 33.24 | 3.11 | 5.82 | |
表4 乌干达变量描述性统计
Tab.4
| 变量 | 城镇 | 小城市 | |||||||
|---|---|---|---|---|---|---|---|---|---|
| 最小值 | 最大值 | 平均值 | 标准差 | 最小值 | 最大值 | 平均值 | 标准差 | ||
| dem/m | 621.00 | 1944.00 | 1167.25 | 192.93 | 814.00 | 1831.00 | 1174.68 | 186.92 | |
| farmland/km | 1.00 | 95.08 | 23.14 | 20.51 | 1.00 | 34.18 | 10.14 | 8.85 | |
| forest/km | 1.00 | 49.65 | 12.20 | 10.17 | 1.41 | 26.68 | 8.74 | 6.15 | |
| large/km | 26.17 | 379.10 | 174.62 | 101.28 | 15.65 | 385.59 | 177.28 | 119.24 | |
| medium/km | 10.00 | 175.14 | 73.56 | 46.07 | 16.00 | 182.28 | 69.06 | 36.99 | |
| ndvi | 0.32 | 0.75 | 0.56 | 0.08 | 0.37 | 0.62 | 0.51 | 0.05 | |
| prec/mm | 58.75 | 125.00 | 99.88 | 14.71 | 66.17 | 125.33 | 105.00 | 13.87 | |
| primary/km | 0 | 20.62 | 4.48 | 6.03 | 0 | 15.23 | 2.29 | 3.78 | |
| railway/km | 0 | 354.20 | 78.54 | 78.94 | 0 | 323.15 | 66.75 | 80.42 | |
| secondary/km | 0 | 71.85 | 15.34 | 18.10 | 0 | 33.73 | 7.64 | 10.90 | |
| slope/(°) | 0.07 | 7.79 | 1.11 | 1.17 | 0.06 | 3.85 | 1.14 | 0.85 | |
| soil | 0 | 0.38 | 0.30 | 0.07 | 0.26 | 0.37 | 0.32 | 0.03 | |
| water/km | 0 | 15.23 | 2.90 | 3.60 | 0 | 10.05 | 2.75 | 2.93 | |
从整体上看,对坦桑尼亚、乌干达而言,同一国家城镇与小城市各变量的平均值与标准差的差别并不大,多位于海拔1000 m左右,地势较低,自然环境状况处于中上水平,临近交通干线与大中城市的地区。由于坦桑尼亚的国家范围比乌干达大得多,因此坦桑尼亚各距离变量的平均值与标准差普遍大于乌干达。在各距离变量中,距水体距离的平均值与标准差最小,一方面表明两国河湖密集,另一方面表明等级规模较低的城市多位于河湖沿岸。此外,两国小城市的降水变量平均值均大于城镇;距耕地距离、距铁路距离、距区域性主要交通干线距离、距水体距离4个变量平均值均小于城镇,表明相比于城镇,两国的小城市更倾向于分布在降水充沛,且靠近耕地、铁路、区域性主要交通干线以及水体的地区。
3.1.2 影响因素贡献率
表5 坦桑尼亚城镇、小城市形成发展影响因素贡献率排名
Tab.5
| 贡献率排名 | 城镇 | 小城市 | |||||
|---|---|---|---|---|---|---|---|
| 变量 | 贡献率 | 累积贡献率 | 变量 | 贡献率 | 累积贡献率 | ||
| 1 | secondary | 45.4 | 45.4 | secondary | 41.6 | 41.6 | |
| 2 | primary | 15.1 | 60.5 | ndvi | 15.5 | 57.1 | |
| 3 | ndvi | 11.4 | 71.9 | water | 12.1 | 69.2 | |
| 4 | railway | 7.7 | 79.6 | prec | 7.0 | 76.2 | |
| 5 | large | 6.4 | 86.0 | railway | 5.7 | 81.9 | |
| 6 | farmland | 3.6 | 89.6 | primary | 4.2 | 86.1 | |
| 7 | prec | 3.3 | 92.9 | large | 4.0 | 90.1 | |
| 8 | medium | 1.5 | medium | 3.5 | |||
| 9 | water | 1.4 | farmland | 3.4 | |||
| 10 | slope | 1.3 | dem | 1.6 | |||
| 11 | soil | 1.2 | forest | 1.3 | |||
| 12 | dem | 1.1 | slope | 0.3 | |||
| 13 | forest | 0.9 | soil | 0.1 | |||
表6 影响乌干达城镇、小城市形成发展影响因素贡献率排名
Tab.6
| 贡献率排名 | 城镇 | 小城市 | |||||
|---|---|---|---|---|---|---|---|
| 变量 | 贡献率 | 累积贡献率 | 变量 | 贡献率 | 累积贡献率 | ||
| 1 | secondary | 32.7 | 32.7 | ndvi | 33.7 | 33.7 | |
| 2 | primary | 23.1 | 55.8 | secondary | 24.9 | 58.6 | |
| 3 | ndvi | 22.6 | 78.4 | farmland | 14.7 | 73.3 | |
| 4 | large | 8.9 | 87.3 | primary | 12.6 | 85.9 | |
| 5 | medium | 2.8 | 90.1 | large | 6.3 | 92.2 | |
| 6 | railway | 2.3 | medium | 2.8 | |||
| 7 | prec | 2.1 | prec | 1.5 | |||
| 8 | farmland | 1.3 | railway | 1.3 | |||
| 9 | forest | 1.3 | slope | 1.2 | |||
| 10 | slope | 1.3 | soil | 0.9 | |||
| 11 | water | 0.9 | water | 0.1 | |||
| 12 | soil | 0.5 | forest | 0.1 | |||
| 13 | dem | 0.2 | dem | 0 | |||
由于部分变量贡献率较小,对城镇、小城市的形成发展无明显意义,因此,本文将累积贡献率达90%以上的变量作为主要影响因素。由此得到7个影响坦桑尼亚城镇、小城市形成发展的主要变量,5个影响乌干达城镇、小城市形成发展的主要变量,其中有4个变量为共性因素,其余为特征因素。共性因素与特征因素对城市形成发展的影响分析如下:
(1) 共性因素对城市形成发展的影响
在坦桑尼亚区域性与全国性主要交通干线共同组成的交通干线10 km缓冲区内,包含了坦桑尼亚约75.81%的城镇及81.25%的小城市;30 km缓冲区内包含了坦桑尼亚96.20%的城镇、91.67%的小城市。乌干达的10 km缓冲区内则约有91.92%的城镇与100%的小城市位于其间。就坦桑尼亚而言,公路作为众多低等级城市推进城市化与工业化的支撑,是其布局的重要因素。与坦桑尼亚不同,乌干达的交通运输较不发达。根据乌干达2020年统计摘要,乌干达国家交通网总长21010 km,其中5398 km铺设完成,仅占总长的25.69%。因此,交通干线对乌干达的作用略低于坦桑尼亚,但仍对乌干达城镇、小城市的布局起着较大的作用。
NDVI对低等级城市的分布同样具有较高的影响。农业、林业、渔业对坦桑尼亚、乌干达GDP的贡献在2020年分别达到29%、23%,两国的低等级城市主要分别分布在NDVI值为0.2~0.6、0.3~0.8的地区。
大城市对城镇也起到了重要的作用。坦桑尼亚的达累斯萨拉姆、姆万扎与乌干达的坎帕拉附近都吸引了较多数量城镇与小城市的聚集。显然,大城市的扩散效应为规模等级较低的城市提供了发展所必须的各类要素。
(2) 特征因素对城市形成发展的影响
就坦桑尼亚而言,公路是其主要交通运输方式[41],铁路、水运、空运等交通运输方式均处在持续发展之中。因此,尽管铁路对坦桑尼亚城市形成发展的贡献率不及全国性与区域性公路交通干线,但坦桑尼亚的中央铁路与坦赞铁路承担着重要的交通运输职能,因此其附近也有较多中等规模城市和部分低等级规模城市集聚。其次,降水对城镇、小城市形成发展也存在一定的影响,这体现在降水充沛、临近维多利亚湖的地区分布有较多的低等级规模城市。除此之外,由于农业为坦桑尼亚的支柱产业,耕地密度较大的北部地区涵盖了较多城镇,表明耕地对城镇的形成发展有一定的贡献。河流对小城市影响仅次于NDVI,距河流10 km范围内涵盖了93.75%的小城市。这是由于河流既具有农田灌溉、渔业捕捞的作用,也承担了水路运输的功能。
对于乌干达,中等城市的吸引力也是其城镇布局的影响因素。但由于中等城市同样受大城市布局影响而围绕其形成,因此中等城市对城镇布局的贡献程度并不高。同样由于农业的影响,耕地对小城市的贡献率较大。
3.2 小城镇形成适宜度指数(HSI)
3.2.1 MaxEnt模型校验
在MaxEnt模型输出的重复运行的平均测试AUC中,坦桑尼亚城镇与小城市得分分别为0.911与0.936;乌干达城镇与小城市得分分别为0.960与0.981,预测效果非常好(图2)。
图2
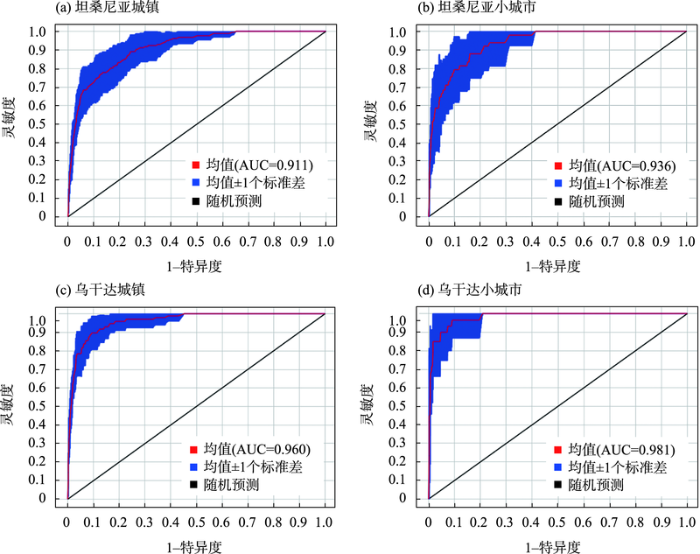
图2
MaxEnt模型结果ROC曲线图
注:灵敏度=1-遗漏率;特异度为真负类率,即正确预测负类的概率(灵敏度为真正类率)。在本文中,正实例、负实例分别代表单元有无城镇/小城市分布。
Fig.2
MaxEnt model results ROC curve graphs
3.2.2 HSI分布
图3
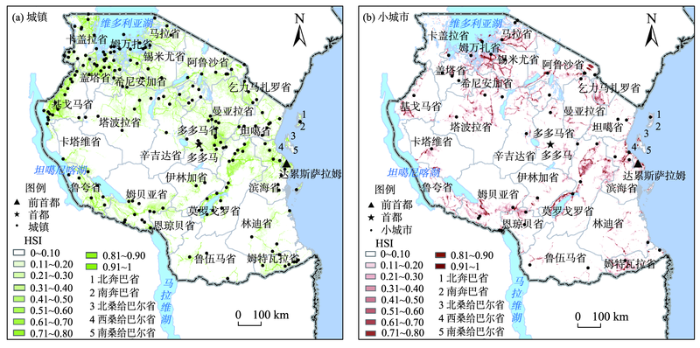
图3
坦桑尼亚城镇、小城市HSI等级分布
Fig.3
Distribution of HSI classes in towns and small cities in Tanzania
图4
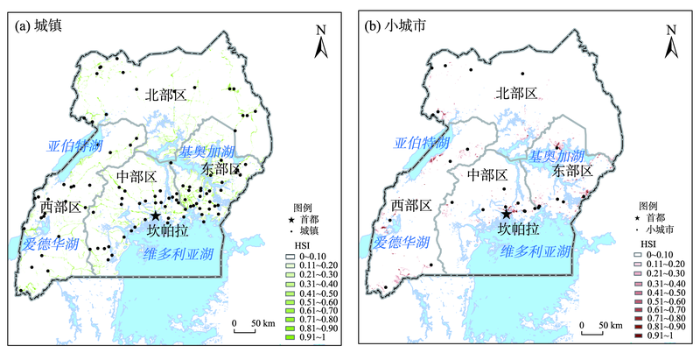
图4
乌干达城镇、小城市HSI等级分布
Fig.4
Distribution of HSI classes in towns and small cities in Uganda
对于坦桑尼亚,从整体上看,北部HSI值整体高于南部,更适宜于城镇与小城市的发展;城镇的HSI高值区呈团块状,小城市则呈条带状分布。北部维多利亚湖周边的大片区域、基戈马西部、多多马东部是最有潜力发展成为城镇的地区,其余如西部鲁夸、达累斯萨拉姆附近等大片区域成为城镇的潜力较高。北部的姆万扎、锡米尤、马拉三省交通干线、河流湖泊附近,中南部的莫罗戈罗湖泊、恩琼贝北部与姆贝亚南部铁路附近,南部的姆特瓦拉交通干线附近,则是最有潜力发展小城市的地区。
相比之下,乌干达全境大部分地区的HSI较低,难以发展成为小规模城市。最有潜力发展成为城镇的地区主要是以坎帕拉为起点的放射状路网附近,以及东部区靠近河流湖泊地区;最有潜力发展成为小城市的地区则主要位于大型河流湖泊沿岸,维多利亚湖北部、爱德华湖北部、亚伯特湖西部、基奥加湖北部与西部碎片状地区均为小城市的HSI高值区。
4 讨论
4.1 城镇与小城市形成影响因素比较
(1) 交通干线对规模等级较低的城市贡献率均较高。但随着城市规模的增大,交通干线贡献率降低。坦桑尼亚全国性主要交通干线、区域性主要交通干线及铁路3种交通干线对城镇的总贡献率为68.2%,小城市则为51.5%;乌干达铁路的贡献率较低,城镇与小城市全国性主要交通干线、区域性主要交通干线的总贡献率分别为55.8%与37.5%。
(2) 随着城市规模的增大,自然环境贡献增加。坦桑尼亚累积贡献率达90%的各变量中,城镇自然环境变量的总贡献率为14.7%,小城市为34.6%。乌干达累积贡献率达90%的各变量中,城镇、小城市的环境变量均只有NDVI一个,贡献率分别为22.6%、33.7%。
坦桑尼亚与乌干达是2个以农业为主的发展中国家,因此,自然环境基础好的地区能率先发展,人口逐渐增多,形成小城市。在此基础上,交通干线可能有意识地向该地区修建,小城市也可能由此进行产业转型。因此,相较于小城市,城镇的形成与发展对交通干线这一类变量的依赖更强。而城镇往往是新兴发展起来的,其腹地农业经济可能并未达到支撑小城市的水平,但依托交通干线、更高等级城市的辐射等机遇,能够较为迅速地发展起来。
此外,本文存在不足:在变量选择时主要考虑区域宏观发展条件,忽略城镇自身因素,不在此讨论城镇经济发展水平、公共基础设施建设等可能对城镇发展所起的作用。
4.2 小城镇发展潜力区与人口密度的关系
城市规划的主体往往以行政区划为单位,因此以两国现行最小行政单元为对象,分别计算单元内城镇、小城市的HSI均值与2020年人口密度均值。其中,坦桑尼亚的最小行政单元为ward,数据来源于坦桑尼亚国家统计局;乌干达的最小行政单元为sub county,数据来源于由美国国际开发署资助的信息技术外展服务(information technology outsourcing service,ITOS)提供的审查和现场服务数据。分别提取城镇与小城市HSI均值大于0.2的区域作为潜力区,并将人口密度均值划分为10个等级,对二者进行比较(图5)。
图5
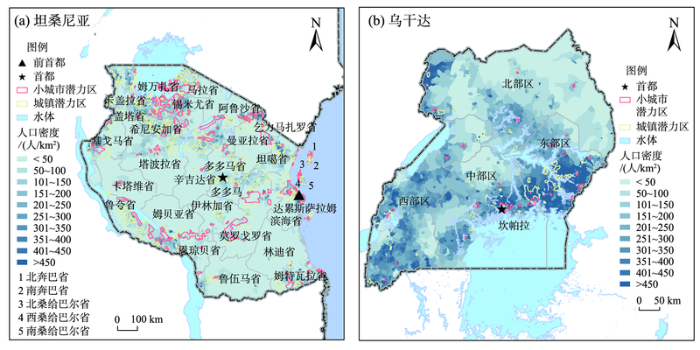
图5
坦桑尼亚、乌干达城镇、小城市潜力区与人口密度对比
Fig.5
Comparison of town and small city potential development areas and population density in Tanzania and Uganda
从整体上看,城镇与小城市潜力区大部分为人口密度较高地区,进一步验证了模型结果的准确性。坦桑尼亚最小行政单元的平均人口密度普遍小于乌干达,但城镇、小城市潜力区范围则显著大于乌干达。前者的潜力区总面积与国土面积的比值达16%,后者则不到1%。坦桑尼亚的潜力区呈大范围的团块状或条带状,地区之间彼此相连;乌干达则呈小范围的点状零散分布。此外,多以城镇潜力区包围小城市潜力区为主,仅坦桑尼亚的姆万扎,乌干达坎帕拉附近等少数地区的城镇产生于小城市内部。
潜力区与周边地区人口密度的关系分为3种:① 与周围地区的人口密度相差较大,即已出现了人口的集聚,主要分布在坦桑尼亚的姆万扎、卡盖拉北部、基戈马西部、辛吉达北部、姆贝亚南部、达累斯萨拉姆,乌干达的坎帕拉附近等地,这些地区多为有较长的发展历史,经济水平比较发达,靠近大中城市的地区;② 与周边地区人口密度相差不大,即尚未出现明显的人口集聚,主要分布在坦桑尼亚多多马中部、姆特瓦拉省,乌干达东部区等地,这些地区多为快速发展中的地区,极化作用处于起步阶段;③ 人口密度比周边地区略小,即未出现人口集聚,但得益于优越的区位条件,未来有很大可能产生人口的集聚,主要分布在铁路与区域性交通干线汇合处的坦桑尼亚莫罗戈罗地区。其中,第一种关系在两国中分布最为广泛,第三种分布最少。
针对坦桑尼亚与乌干达小城镇潜力区的划分结果与前文的分析,未来东非的城市规划可以从3个方面考虑:一是重点关注已出现人口集聚的地区,在控制自身城市扩张的同时应带动周边地区发展;二是对于快速发展中的区域应提供政策等条件上的支持,引导区域要素流动,积极培育地区中心;三是发掘国家中具有优越区位条件的区域,尤其注意位于交通枢纽及其附近或水热等自然条件良好的宜农地区,积极引导各地区产业转型,因地制宜地发展特色产业。
4.3 模型合理性分析
(1) 图像分辨率较低导致变量在区域间的差异难以区分。例如,相较于其他变量,土壤湿度的分辨率(1°×1°)较粗,导致实际土壤湿度并不相同的大片区域具有相同的土壤湿度,这可能是导致土壤湿度在变量贡献率中较小的原因。
(2) 模型运行的结果主要由贡献率大的变量决定,因此对于某些由贡献率较小的变量导致的特殊情况难以识别。例如,坦桑尼亚乞力马扎罗省北部是乞力马扎罗山,山上人烟稀少,人口多集聚在山下。但由于高程的贡献率较低,导致山体部分的HSI也很高。
因此,在运用最大熵模型研究此类问题时,应考虑研究尺度与分辨率是否匹配,并对结果进行甄别,尤其应注意低贡献率变量异常值的地区。
5 结论
东非国家小城镇的空间分布概率较大程度上受地形和水热环境条件、交通区位条件等影响,本文采用最大熵模型在空间上评估了坦桑尼亚、乌干达两国小城镇的形成适宜度(HSI),判别城镇与小城市潜力区,并区分不同影响因素的作用。主要结论如下:
(1) 在两国城镇与小城市形成发展累积贡献率达90%以上的变量中,坦桑尼亚的变量数多于乌干达,前者的城镇、小城市是更多因素复合的结果。区域性主要交通干线、全国性主要交通干线、NDVI与距大城市距离对两国城镇、小城市都有着较高的贡献率;不同国家城镇、小城市有其特有的高贡献率变量。
(2) 与其他学者对于东非部分国家城市分布规律的研究结果类似[20]:随城市规模的增大,自然环境变量的贡献率上升;随城市规模的增大,交通干线的贡献率下降。
(3) 坦桑尼亚北部HSI值普遍高于南部,城镇的HSI高值区呈团块状,小城市呈条带状。乌干达全境HSI较低,城镇HSI高值区以坎帕拉为起点呈放射网状,小城市则呈碎片状。两国HSI高值区基本位于路网、河流湖泊附近。
(4) 坦桑尼亚人口密度普遍小于乌干达,潜力区总面积则大于乌干达。与人口密度关系主要分为3种:比周边人口密度大,多为有较长的发展历史,经济水平比较发达,靠近大中城市的地区;与周边人口密度相近,多为快速发展中的地区;比周边人口密度小,为区位条件良好,未来有很大可能产生人口集聚的地区。其中,第一种分布最为广泛;第三种分布最少,仅存在于坦桑尼亚莫罗戈罗地区。
为应对东非国家快速城市化进程中出现的城市低质量蔓延等问题,在“一带一路”建设背景下,未来中国应尤为注重在交通基础设施建设与布局方面的援助,促进交通枢纽城镇发挥物流节点的优势;加强对第二产业与第三产业的投资,利用地方特色助力农业支撑型城镇的产业结构转型和多元化发展。同时,小城镇发展潜力区的划分也为未来的投资格局提供了依据,指出了未来的重点发展地区,有利于空间布局的优化与合理的城市政策制定。但本文仅以部分自然环境与社会经济变量作为代表对东非两国进行了国家尺度上的分析,未来在变量的细化、研究尺度的拓展等方面有待进行更深入的分析与讨论。
参考文献
非洲城市化探析
[J].
Research on the status of urbanization in Africa
中小城市是非洲可持续发展成败的关键
[J].
Small and intermediary cities will make or break the sustainable development goals in Africa
A planet of cities:Urban land cover estimates and projections for all countries, 2000-2050
[R].
Urban planning historical review of master plans and the way towards a sustainable city: Dar es Salaam, Tanzania
[J].
DOI:10.1016/j.foar.2019.01.008
[本文引用: 1]

Urban planning in Tanzania has focused mainly on economic development. The Tanzanian government prioritizes large-scale modern projects to increase national income and propel world-class urban settlements. Dar es Salaam, Tanzania's largest city and main commercial center has experienced remarkable urban development. Unfortunately, its growth has not been consistent with the master plans, which also overlook sustainable urban development aspects. The high urbanization rate has exacerbated the degradation of the city's environment, including roadside air quality, solid waste, and water quality. The city's ongoing environmental dilapidation has led to a call for a sustainable urbanization to curb past urbanization problems and implement a sustainable future.This work reviews Dar es Salaam's available planning documents and examines how master plans can stimulate sustainable urban development. Findings suggest that master plans should not be used as a mere urban growth control tool. Master plans that are designed and conceptualized as a comprehensive strategy and integrated with different aspects of urban development can play a key role in enforcing sustainable urban development for the city.
Extended urbanization in small and medium-sized cities: The case of Cirebon, Indonesia
[J].
The spatial pattern of urbanization and small cities development in central Java: A case study of Semarang-Yogyakarta-Surakarta region
[J].
均衡城镇化: 大都市与中小城市协调共进
[J].城镇化是扩大内需实现中国经济可持续发展的大战略。文章分析了当前中国城镇化发展的战略背景,研究了城镇化发展面临的战略机遇和存在的失衡状况,提出稳步推进城镇化的关键是实施均衡城镇化战略,走大都市与中小城市协调发展的道路。未来不仅要发挥大都市圈的集聚效应和规模效应,也要重视在都市圈以外地区发展中小城市和县城,积极推进农村城镇化。同时要引导劳动力和产业向中西部的回归与转移,促进区域协调发展。
Balancing urbanization by coordinated development between megacities and medium and small cities
Urbanization plays an important role in expanding domestic demand and promoting economic growth. This paper examines characteristics and challenges in China’s urbanization, focusing on the unbalanced development of urbanization at the present stage. Policy strategies are discussed to promote steady development of urbanization. It is argued that balanced urbanization is the key and should be given top priority. Thus medium and small cities and megacities should be in coordinated development, and transferring of industries and labor forces should be guided to promote balanced development among regions.
试论我国大城市与中小城市发展走势
[J].
On the trend of the development of great and small cities of China
基于人口规模的肯尼亚城市体系演变及空间联系
[J].
Evolution characteristics of urban system and spatial connections of cities in Kenya based on population scale
坦桑尼亚人口分布空间格局及演变特征
[J].
DOI:10.18306/dlkxjz.2017.05.008
[本文引用: 2]
坦桑尼亚是中国“一带一路”战略的重要辐射点,中国已成为坦桑尼亚第一大贸易伙伴。本文基于坦桑尼亚全国人口普查资料及分地区统计数据,运用人口密度分析法、人口分布集中指数、人口重心模型和人口偏移增长模型,分析了坦桑尼亚自20世纪80年代末经济变革以来人口分布的空间格局及演变特征。研究结果表明:①坦桑尼亚人口分布以中央铁路线为界,呈现“南疏北密”特征;②1988-2002-2012年间,人口分布不均衡发展的态势不断增强,人口分布重心始终处于中部偏北地区,且有继续北移的趋势;③人口向城市地区集聚是人口再分布的主要过程,中心城市的人口集聚能力不断增强,达累斯萨拉姆省始终处于正向增长的绝对优势地位,以致周边地区出现明显的人口偏移负增长;④铁路和港口等基础设施对人口集聚的作用明显。上述结论对中坦在基础设施建设、住房建设及公共服务方面的合作具有重要意义。
Spatial pattern and its evolution of population in Tanzania
DOI:10.18306/dlkxjz.2017.05.008
[本文引用: 2]
Tanzania is an important part of China's 'the Belt and Road' strategy, and China has become the largest trade partner of Tanzania. For the extensive cooperation in infrastructure, housing and public services, spatial pattern of population in Tanzania aroused broad attention. Based on the national census and regional statistics data of Tanzania, population density analysis, distribution concentration index, gravity center model, and population growth shift model were used to analyze Tanzania's population spatial distribution pattern and evolution since its economic reform in the late 1980s. The results shows that: (1) Divided by the central railway line, the population of Tanzania showed a characteristic of sparse distribution in the south and dense distribution in the north; (2) There was a growing trend of uneven population distribution during the period of 1988-2012. The population gravity center was always in the central-north region and had a tendency to continue to move northward; (3) Population movement to urban areas was the major process of population redistribution. The capacity of core cities in attracting migrants was growing. The Dar Es Salaam region experienced most rapid population growth that led to significant negative population growth shift in its surrounding areas; (4) Infrastructure such as railways and ports had evident effect on population agglomeration.
中国城市分布特征及其影响因素
[J].
DOI:10.11821/dlyj201507014
[本文引用: 1]
通过对221 BC-1911 AD年间中国城市分布特征及其影响因素的研究,发现:① 在整个研究阶段,中国城市分布的重心位于中东部地区,秦—唐时期重心向西南地区大幅移动,唐—元时期重心先东北方向移动后转向西南方向,元—清时期重心主要向北移动。以腾冲—瑷珲一线为界线分区研究发现,在整个研究阶段西部重心在南北及东西方向呈现出较大的波动趋势,东部重心呈现出与全国类似的运动轨迹。② 标准差椭圆分析表明全国及东西部地区城市分布经历了明显的分散—集聚—分散的变化趋势,其中西部地区最为明显。从城市分布的平均方向看,全国及东部地区具有一定的相似性,均以东北—西南为主要分布特征,西部地区是以西北—东南为主要分布特征。③ 从城市密度分布特征看,其空间连续性和自组织性不断加强且由空间相关性引起的结构性变异处于显著状态。从方向上来看,全方向上的均质化程度呈下降趋势,西北—东南方向各时期城市密度均质化程度相对较好,空间差异相对较小,而东—西方向差异最为明显。④ 分析不同时期城市设置的相关因素发现,221 BC-1911 AD年间,中国城市设置相对集中在地形平坦、气候适中且靠近河流及中心城市的地区。
The distribution of cities in China and its influencing factors
DOI:10.11821/dlyj201507014
[本文引用: 1]
This paper aims to examine the distribution of cities in China during 221 BC-1911 AD and its influencing factors. Some conclusions can be drawn as follows: (1) the urban distribution gravity center of China during the entire study stage was located in the central and eastern regions and firstly, moved sharply southwestward from the Qin dynasty to the Tang dynasty. Secondly, the gravity center moved toward the northeast from the Tang dynasty to the Yuan dynasty, and then toward the southwest direction. Finally, the gravity center during the Yuan-Qing dynasty moved mainly towards the north direction. In this paper, we divided China into east and west parts by the population line of Tengchong-Aihui and found that during the study period, the gravity center path in the western region presented a large fluctuation trend in both the south-north and the east-west directions. However, the moving trajectory of the gravity center in the eastern region was similar to that of the whole country. (2) The analyses of the standard deviational ellipses showed that the urban distribution in the whole country, the eastern region, and the western region exhibited a distribution pattern of "decentralization, centralization and decentralization", and this trend in the western region was most obvious. From the perspective of the average direction, the urban distribution in the whole country and the eastern region were similar to a certain degree, with the northeast-southwest as the main characteristics. However, the urban distribution in the western region took the northwest-southeast as the main features. (3) Based on the urban density distribution and spatial correlation, we found that its spatial continuity and self-organization were continuously strengthened, and the structural variation was in a significant state. Viewing from the direction, we concluded that the degree of homogenization on the Omni-direction tended to decline. The urban density homogenization degree of each dynasty in the northwest and southeast directions was relatively good and the spatial differences were minimal, but the spatial differences in the east and west directions were most obvious. (4) The analysis of the related factors of the urban setting up in different periods revealed that the setting up of the cities of China during 221 BC-1911 AD mainly focused on the flat terrain near the river and the central city with moderate climate.
走向大中小城市协调发展的中国新型城镇化格局: 1952年以来中国城市规模分布演化与影响因素
[J].
DOI:10.11821/dlyj020180443
[本文引用: 1]
为了落实国家新型城镇化规划提出的大中小城市协调发展战略,对1952-2014年中国城市规模分布指数进行演化分析,并在时间序列分析基础上探索了影响因素。结果表明,2000年以来,中国城市规模分布一改长期的分散化趋势,正走向集中化;人口规模增长、政策干预以及城市之间信息和交通成本的节约,都促使城市规模分布分散化;人均GDP长期以来促进了城市规模分布的集中,但近年来开始促进分散化;对外开放水平则主要促进分布的集中。未来应以全国适度均衡发展作为指导方针;远期以市场一体化,近期以共赢互利机制建设为抓手,促进城市群内大中小城市协调分工,优势互补;注意政策的稳定性和长期性,减少城市化格局的人为波动。
China's new pattern of urbanization toward coordinated development of large, medium and small cities: Evolution and determinants of city size distribution since 1952
DOI:10.11821/dlyj020180443
[本文引用: 1]
After reviewing the literature on city size distribution as well as on its determinants, this paper measures China's city size distribution from 1952 to 2014 based on the rank-size method and explores its evolution trend. Then, we empirically examine which factors and how they determine China's city size distribution to test different hypotheses in previous literature and give a comprehensive explanation of the mechanism of China's city size distribution using the time series analysis. We conclude with policy implications for improving China's city size distribution. The results show that: (1) The city size distribution of Chinese cities follows a power-law, and its evolution shows a decentralized or flattering trend from the 1950s to 2000 and turns to centralization after that; (2) The increase of population size, policy intervention and the reduction of information and transportation costs among cities result in the decentralization of city size distribution; (3) Per capita GDP has a significant U-shaped relationship with city size distribution, that is, the increasing economic development level had led to the centralization of city size distribution at first, but began to bring the decentralization as a result in recent years; (4) The economic openness to the world has promoted the polarization of city size distribution, likely through benefiting large cities more. The urbanization strategies of China in future should 1) aim at keeping an reasonably balanced city size distribution to address the overdevelopment of large cities and the underdevelopment of medium- and small-sized cities; 2) promote coordinated and complementary development of large-, medium- and small-sized cities by developing market integration mechanism in a long period and a mutual benefit strategy in the transition period, based on large urban clusters and city regions centered on large cities; 3) make suggestions to the governments at all levels in regulating the national city size distribution, while paying attention to the stability of policy to reduce the frequent and artificial fluctuations of the urbanization process.
我国城市规模分布Pareto指数测算及影响因素分析
[J].
The estimates and the influential factors of the pareto exponent of city size distributions in China
1996—2011年南非人口空间分布格局与演变特征
[J].
DOI:10.11820/dlkxjz.2013.07.019
[本文引用: 1]
南非是中国在非洲的最大投资目的地与经贸合作伙伴, 特别在基础设施建设方面发展迅速。南非人口空间分布研究对开展中南合作具有重要意义。本文通过收集整理南非历年来的全国人口普查资料统计数据, 运用空间自相关模型、不均衡指数、人口重心模型和偏移—分享模型, 分析了南非人口的空间分布格局和演变特征。研究结果表明, 南非人口分布具有显著的“东高西低”的空间格局, 呈现出以工业化程度较高的大都市区和港口城市为中心的“多核心”集聚的分布特征;空间自相关分析得出人口高集聚区主要分布在大都市区和沿海港口城市, 低密度集聚区主要集中分布在中西部地区;从变化趋势上来看, 1996-2011 年间人口分布不平衡趋势不断加强, 人口重心向西北方向移动;偏移—分享分析表明, 南非人口增长速度先后经历了从1996-2001 年快速增长到2001-2007 年缓慢增长, 再到2007-2011 年高速增长的“高—低—高”增长阶段;省域层面上看, 豪登省和西开普省一直是南非人口集聚较强地区。
Spatial pattern of population and its evolution in South Africa during 1996-2011
DOI:10.11820/dlkxjz.2013.07.019
[本文引用: 1]
South Africa is China's largest trading partner and investment destination in Africa, especially in infrastructure construction. Study of the spatial distribution of South Africa's population is of great significance to the cooperation of the two countries. Based on the census data from 1996 to 2011, this paper describes the spatial pattern and evolving trend of the diverse population of South Africa with time series and cross section data between 1996 and 2011 at county level, based on population density analysis, spatial autocorrelation analysis, population gravity center model, shift-share analysis, and unbalanced index. Using the software platform of ArcGIS and OpenGeoDa, conclusions are made as follows. (1) Population density of South Africa has "high on east and low on west" features, and also has multicore clustering characteristics in metropolitan areas and port cities. (2) Population density varies significantly in different regions. Metropolitan areas and coastal port cities have high population densities, while central and western regions have low population densities. (3) In terms of trend in population change, population distribution in South Africa became more and more imbalanced from 1996 to 2011. The gravity center of population moves to the northwest of South Africa since 1996. (4) Shift-share analysis shows population growth rate have undergone "high-low-high" stages for the last 15 years. At provincial level, Gauteng andWestern Cape have been always the places with dense populations.
Understanding the urban spatial structure of Sub-Saharan African cities using the case of urban development patterns of a Ghanaian city-region
[J].
DOI:10.1016/j.habitatint.2019.02.001
[本文引用: 1]
Cities in Sub-Saharan Africa are undergoing massive spatial transformation owing to rapid urbanization. For many cities in the Global North, Latin America and Asia, spatial transformation has been traditionally characterised by a shift from monocentric to polycentric urban patterns. In the case of Sub-Saharan Africa, however, it is unclear whether the evolving spatial structure of cities conform to or are explained by existing urban geography models. This paper pursues twofold objectives: one, examines the evolution of the spatial structure of a Sub-Saharan African city-region and its relationship with mainstream urban geography models; and, two, explores the urban planning and policy implications of the spatial transformation. The study draws on spatially explicit data from Kumasi City-Region in Ghana, which is analysed with a set of spatial metrics and an urban growth model. The results indicate that, while the city-region's urban spatial structure before the turn of the Twenty-first century largely conforms to the traditional monocentric model, it is increasingly becoming deconcentrated and dispersive, which suggests a likely pending phase of coalescence in a stochastic fractal urban growth process. Contrary to what is observed in other parts of the world, the declining monocentricity has not transformed into a polycentric urban structure, rather, urban growth is becoming amorphous. There is high level of development spontaneity that cast an image of a city-region that is charting inefficient and unsustainable spatial development path. Urban scholars would have to transcend the frontiers of existing urban structure models to better depict the spatial evolution of sub-Saharan African cities like Kumasi City-Region, while Policy makers need to re-position the Ghanaian planning system to be more influential in delivering sustainable development patterns.
坦桑尼亚城市体系演变与空间分布特征
[J].
Evolution and spatial distribution of the urban system in Tanzania
基于MAXENT模型的贺兰山岩羊生境适宜性评价
[J].
Habitat suitability assessment of blue sheep in Helan Mountain based on MAXENT modeling
DOI:10.5846/stxb201207221041 URL [本文引用: 2]
基于MaxEnt和ArcGIS对太白米的潜在分布预测及适宜性评价
[J].
Predictive distribution and habitat suitability assessment of Notholirion bulbuliferum based on MaxEnt and ArcGlS
Applications of the principle of maximum entropy: From physics to ecology
[J].
Food-web structure and network theory: The role of connectance and size
[J].
DOI:10.1073/pnas.192407699
PMID:12235364
[本文引用: 1]
Networks from a wide range of physical, biological, and social systems have been recently described as "small-world" and "scale-free." However, studies disagree whether ecological networks called food webs possess the characteristic path lengths, clustering coefficients, and degree distributions required for membership in these classes of networks. Our analysis suggests that the disagreements are based on selective use of relatively few food webs, as well as analytical decisions that obscure important variability in the data. We analyze a broad range of 16 high-quality food webs, with 25-172 nodes, from a variety of aquatic and terrestrial ecosystems. Food webs generally have much higher complexity, measured as connectance (the fraction of all possible links that are realized in a network), and much smaller size than other networks studied, which have important implications for network topology. Our results resolve prior conflicts by demonstrating that although some food webs have small-world and scale-free structure, most do not if they exceed a relatively low level of connectance. Although food-web degree distributions do not display a universal functional form, observed distributions are systematically related to network connectance and size. Also, although food webs often lack small-world structure because of low clustering, we identify a continuum of real-world networks including food webs whose ratios of observed to random clustering coefficients increase as a power-law function of network size over 7 orders of magnitude. Although food webs are generally not small-world, scale-free networks, food-web topology is consistent with patterns found within those classes of networks.
最大熵模型的巴基斯坦遗址预测分布研究
[J].
The study of predictive distribution of Pakistani sites based on Maxent model
Predict the suitable places to run in the urban area of Beijing by using the maximum entropy model
[J].
Coupling maximum entropy modeling with geotagged social media data to determine the geographic distribution of tourists
[J].DOI:10.1080/13658816.2018.1458989 URL [本文引用: 1]
Using the maximal entropy modeling approach to analyze the evolution of sedentary agricultural societies in Northeast China
[J].
Using a maximum entropy model to optimize the stochastic component of urban cellular automata models
[J].DOI:10.1080/13658816.2019.1687898 URL [本文引用: 1]
Flood risk assessment for Davao Oriental in the Philippines using geographic information system-based multi-criteria analysis and the maximum entropy model
[J].
Mapping population change index in Southern Serbia (1961-2027) as a function of environmental factors
[J].DOI:10.1016/j.compenvurbsys.2010.09.005 URL [本文引用: 1]
An integrative dynamic model of Colombian population distribution, based on the maximum entropy principle and matter, energy, and information flow
[J].
熵模型及其在城市研究中的应用
[J].
Entropy models and their application in urban studies
非洲城市化特征与驱动力因素浅析
[J].
The features of urbanization in Africa and its dynamic elements
“一带一路”: 中国与东非国家合作的挑战与路径
[J].
The Belt and Road Initiative: Challenges and cooperation between China and East African countries
非洲是建设“一带一路”的重要方向和落脚点
[N].
Africa is an important direction and landing point for the construction of the Belt and Road Initiative
Information theory and statistical mechanics
[J].DOI:10.1103/PhysRev.106.620 URL [本文引用: 1]
Maximum entropy modeling of species geographic distributions
[J].DOI:10.1016/j.ecolmodel.2005.03.026 URL [本文引用: 1]
Measuring the accuracy of diagnostic systems
[J].
DOI:10.1126/science.3287615
PMID:3287615
[本文引用: 1]
Diagnostic systems of several kinds are used to distinguish between two classes of events, essentially "signals" and "noise". For them, analysis in terms of the "relative operating characteristic" of signal detection theory provides a precise and valid measure of diagnostic accuracy. It is the only measure available that is uninfluenced by decision biases and prior probabilities, and it places the performances of diverse systems on a common, easily interpreted scale. Representative values of this measure are reported here for systems in medical imaging, materials testing, weather forecasting, information retrieval, polygraph lie detection, and aptitude testing. Though the measure itself is sound, the values obtained from tests of diagnostic systems often require qualification because the test data on which they are based are of unsure quality. A common set of problems in testing is faced in all fields. How well these problems are handled, or can be handled in a given field, determines the degree of confidence that can be placed in a measured value of accuracy. Some fields fare much better than others.
