

围绕城市用地结构变化及其驱动机制,学界从不同角度开展了深入的研究,发现不同城市用地结构存在差异,综合性城市信息熵大于专业化城市信息熵[6]、沿海城市信息熵大于内陆地区[7]、城市化过程中郊区信息熵上升[8]等城市用地结构的熵值演化规律。诸多学者还引入均衡度模型[9]、偏移—份额模型[10]、基尼系数[11]、城市生态算法[12]等模型方法探讨分析了县域[13]、市域[14-15]、省域[16]、城市群[17]等不同空间尺度城市建设用地结构的空间配置格局、时空演化特征以及优化调整方向。作为一个耦合资源、环境、人文、经济等诸多要素的复杂巨系统[18],城市土地利用系统演化受内部推力和外部拉力的复合影响[19]。在定性剖析之外,主成分分析法[20]、灰色关联模型[21]、计量回归模型[22]等定量分析方法被广泛应用于揭示自然地理、产业结构、政策法规等因素对城市用地空间布局变化的驱动机理研究,并逐步成为主要的研究方法。
作为人类活动高度集聚的地理空间,城市是区域发展的战略支点[23]。科学探讨城市土地利用变化对于系统解决区域社会经济发展过程中遇到的问题和难题,实现区域高质量发展具有重要意义。2019年,黄河流域生态保护和高质量发展成为国家战略,要求不断优化流域“三生”空间,实现人—地—业耦合协调。然而,在长期发展过程中,黄河流域城市普遍存在“摊大饼”式无序扩张蔓延、建设用地结构失衡、产业集聚区用地结构不合理等问题。土地利用作为人类活动的一面镜子,通过调控土地利用方式及其结构可以改变特定区域内人地交互作用和要素配置[24-25]。因此,系统分析黄河流域城市建设用地变化及其结构的演进特征,剖析其背后的形成机制,有助于制定针对性的政策和措施以调整和优化黄河流域城市空间格局,夯实区域高质量发展的支撑。利用2007—2019年黄河流域城市建设用地数据,本文探讨黄河流域城市建设用地规模的演化特征,利用信息熵模型剖析黄河流域城市用地结构的动态变化,并使用随机森林模型分析驱动因子的作用强度及其区域差异,以期为黄河流域生态保护和高质量发展决策提供参考和借鉴。
1 研究区域、方法与数据
1.1 研究区概况
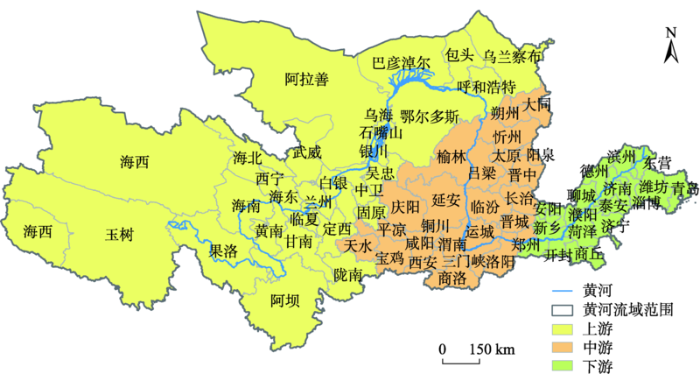
黄河流经青海、四川、甘肃、宁夏、内蒙古、陕西、山西、河南、山东9个省(区),涉及71个地级市(州、盟)和1个县级市(济源市)。以内蒙古自治区托克托县河口镇和河南省荥阳市桃花峪为界,黄河流域划分为上游、中游和下游(图1)。根据全国主体功能区规划,黄河流域内分布有3个区域级城市群和4个地区性城市群[26-27],是黄河流域高质量发展的增长极点和核心连接点。受限于不同地区自然资源禀赋和社会经济发展的空间异质性,黄河流域高强度国土开发、低效土地利用、不合理用地布局等问题普遍存在,严重制约区域生态保护和高质量发展[28]。基于数据的可获取性,剔除未设置市辖区的阿坝州、临夏州、甘南州、海北州、黄南州、海南州、果洛州、玉树州、海西州、阿拉善盟和济源市,同时数据缺失严重的海东市亦不纳入分析,由此共获得60个地级市作为研究对象。2020年,流域内这60个地级市的年末常住人口约为2.38亿人,其中城市市辖区的常住人口总规模为1.05亿人,城市建设用地面积为8591.74 km2。
图1
1.2 研究方法
1.2.1 信息熵模型
信息熵模型被广泛用于城市土地利用结构的研究中,用于揭示土地利用系统的有序性和多样性[29]。本文中城市建设用地结构的信息熵具体计算公式如下:
式中:A为某城市建设用地总面积;Ai为某城市i地类的面积;N为建设用地种类数;Pi为某城市地类i的面积与建设用地总面积的比值;H为某城市的建设用地结构信息熵。当P1=P2=P3=...=PN时,城市建设用地结构的信息熵达到最大值,为ln N。由于本文将各城市的建设用地类型划分为7类(具体见 1.4节),即各城市的土地职能数相等,因此可直接使用信息熵来比较城市之间用地结构的均衡性,信息熵值越大表明各类建设用地规模相当,该城市的用地结构越均衡。同时,信息熵也表征城市用地系统的无序化程度,熵值越高表示城市用地系统的有序性越低,反之则越高[30]。
1.2.2 随机森林模型
随机森林(Random Forest)是Breiman[31]于2001年提出的一种包含多个决策树分类器的机器学习算法。一般使用bootstrap重抽样方法从原始样本中抽取多个样本,并对每个bootstrap样本进行决策树建模,然后将这些决策树的预测组合通过投票得出最终预测结果[31-32]。随机森林模型由于其独特的算法优势,使得其在处理多重共线性变量或非平衡数据时也能够得到精度较高的预测结果,不仅可以用来做聚类和判别分析,还可以用来进行回归分析以探究影响因子的重要性[33]。本文采用R语言进行随机森林模型运算,构建各驱动因子与建设用地结构信息熵的回归分析模型,进而基于均方误差增加量(IncMSE)、节点纯度增加量(IncNodePurity)分析影响因子驱动力大小。IncMSE指将变量随机取值后进行随机森林模型估算误差相对于原来误差的升高幅度,值越大表明变量越重要;IncNodePurity反映变量对各个决策树节点的影响程度,值越大表明变量越重要。在保证计算效率的前提下[34],经过多次调试,本文参数最终设置如下:ntree=500,mtry=3,其他均为默认值。
1.3 影响因素预选取
依据推拉理论,在城市地域系统内部要素结构变迁的“推力”和系统外部宏观经济社会变化的“拉力”的综合作用下,城市建设用地不断实现空间调整和功能重组[19]。已有研究表明,在城市规模不断扩张过程中,新增建设用地的地类配置会对整个城市建设用地结构信息熵产生影响[35]。为衡量城市用地规模与用地结构信息熵的内在关联,选取城市建设用地面积作为城市用地规模的代理指标。人口规模是影响城市用地结构演化的直接因素[19,36],选取城市年末人口数量分析黄河流域城市人口规模对用地结构的影响。经济发展水平变化间接作用于城市用地规模和结构[18],城市居民人均收入反映居民在消费、投资、储蓄等方面的支付能力,是经济增长红利惠及城市居民的重要表征,能够反映经济实效发展水平,但由于市辖区内城市居民人均可支配收入数据缺失,而工资性收入占可支配收入的份额较大,因此,本文选择职工年平均工资作为经济发展水平的代理指标来分析其对用地结构的作用强度。产业结构升级将促使劳动力、资本和土地在不同产业间流动[37],影响不同产业在用地竞争中的优劣势,是城市用地结构演变的内部驱动力[19],本文选取三产产值与二产产值的比值作为产业结构升级的代理指标,并测度其对用地结构的影响。政府通过财政资金投入进行城市基础设施建设和改善公共服务供给会改变地类组合,是城市用地结构变化的外在驱动力[11,18],本文选取一般公共预算支出衡量财政支出规模对用地结构的影响。地方政府对房地产开发建设的支持力度会影响用地结构演化的速率[38-39],本文选取房地产开发投资额占城市GDP的比重来表征城市政策支持力度。在已有研究的基础上,本文从城市用地规模、人口规模、经济发展水平、产业结构、财政支出规模、政策支持力度等角度预选取黄河流域城市建设用地结构信息熵变化的驱动因素(表1)。
表1 黄河流域城市建设用地结构演变的驱动因素预选取
Tab.1
| 变量 | 变量名称 | 变量符号 | 含义 | 单位 |
|---|---|---|---|---|
| 被解释变量 | 城市建设用地结构 | Y | 建设用地结构信息熵 | Nat |
| 解释变量 | 城市用地规模 | X1 | 城市建设用地面积 | km2 |
| 城市人口规模 | X2 | 城市年末人口 | 万人 | |
| 经济发展水平 | X3 | 职工年平均工资 | 元 | |
| 产业结构升级 | X4 | 三产产值/二产产值 | — | |
| 财政支出规模 | X5 | 一般公共预算支出 | 亿元 | |
| 政策支持力度 | X6 | 房地产开发投资/GDP | — |
1.4 数据来源与处理
本文使用的城市建设用地数据来源于《中国城市建设统计年鉴(2007—2019年)》;各城市年末人口、二三产业产值、地方财政一般公共预算支出、房地产开发投资额、地区生产总值等社会经济数据来源于《中国城市统计年鉴(2008—2020年)》、各地市统计年鉴以及国民经济和社会发展统计公报,统计范围均为市辖区。城市建设用地结构数据分类涉及《城市用地分类与规划建设用地标准(GBJ137—90)》和《城市用地分类与规划建设用地标准(GB50137—2011)》新旧2套标准。参考许芸鹭等[17]的成果,本文将城市建设用地类型划分为居住用地、公共设施用地、工业用地、仓储用地、道路交通用地、市政公用设施用地和绿地与广场用地7大类。
2 结果分析
2.1 黄河流域城市建设用地的总体演变特征
2007—2019年,黄河流域城市建设用地规模快速增长,由4502.93 km2增长至8408.21 km2,年均增速达到5.34%(图2),其中上游、中游和下游的年均增速分别达到3.91%、5.06%和6.22%。相应地,上中下游城市建设用地规模在黄河流域中的占比从2007年的23%∶34%∶43%演化为2019年的19%∶33%∶48%。从类型来看,绿地与广场用地面积增长最快,由448.61 km2剧增至1104.37 km2,年均增速为7.80%;公共设施用地、道路交通用地和居住用地面积的年均增速超过研究区平均水平,分别达到7.18%、5.87%和5.68%;仓储用地、工业用地和市政公用设施用地面积的年均增速均小于研究区平均水平。
图2
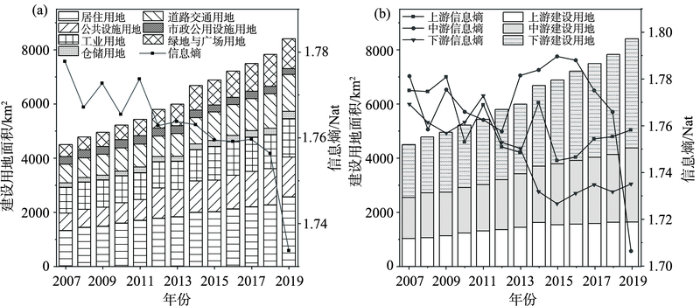
图2
2007—2019年黄河流域城市建设用地变化及其信息熵
Fig.2
Changes and information entropy of urban construction land in the Yellow River Basin during 2007-2019
从建设用地结构的时序变化来看,2007—2019年,各地类中居住用地面积占比一直最高,约为30%,并且呈现波动上升趋势(表2)。究其原因,主要是在黄河流域快速的工业化和城镇化进程中,农业人口大量向城市转移,对城市居住用地的需求激增。加之地方政府“土地财政”的发展模式,城市居住用地规模高位运行。工业用地面积占比为20%左右,是占比第二的用地类型,其份额在研究期内逐步降低。这主要是因为国家在这一时期加大了对工业用地利用效率和转型升级的调控力度,如2011年国务院印发的《工业转型升级规划(2011—2015年)》,抑制了工业用地的增长,使得工业用地增速低于研究区平均水平,其在土地利用结构中的占比亦不断降低。公共设施用地、道路交通用地、绿地与广场用地的面积占比保持在10%~20%之间,市政公用设施用地和仓储用地面积占比在10%以下。
表2 2007—2019年黄河流域城市建设用地结构及信息熵
Tab.2
| 年份 | 城市建设用地结构/% | 信息熵/ Nat | ||||||
|---|---|---|---|---|---|---|---|---|
| 居住用地 | 公共设施用地 | 工业用地 | 仓储用地 | 道路交 通用地 | 市政公用 设施用地 | 绿地与广场用地 | ||
| 2007 | 29.45 | 14.18 | 21.23 | 3.73 | 15.23 | 6.22 | 9.96 | 1.7778 |
| 2008 | 30.16 | 13.92 | 21.12 | 3.38 | 15.32 | 6.10 | 10.01 | 1.7672 |
| 2009 | 29.96 | 14.23 | 20.28 | 3.48 | 15.66 | 5.89 | 10.50 | 1.7727 |
| 2010 | 30.62 | 14.35 | 19.19 | 3.22 | 16.45 | 5.81 | 10.38 | 1.7655 |
| 2011 | 31.29 | 14.21 | 18.28 | 3.81 | 15.59 | 5.77 | 11.05 | 1.7737 |
| 2012 | 30.72 | 19.36 | 16.63 | 3.34 | 12.97 | 5.19 | 11.78 | 1.7629 |
| 2013 | 30.57 | 16.88 | 17.29 | 3.04 | 14.06 | 4.90 | 13.26 | 1.7638 |
| 2014 | 29.97 | 17.32 | 17.27 | 3.20 | 14.46 | 4.28 | 13.50 | 1.7631 |
| 2015 | 29.34 | 17.02 | 17.97 | 3.21 | 15.28 | 3.72 | 13.46 | 1.7595 |
| 2016 | 29.47 | 17.18 | 17.24 | 3.21 | 15.74 | 3.70 | 13.46 | 1.7591 |
| 2017 | 29.38 | 17.44 | 16.83 | 3.26 | 15.73 | 3.61 | 13.74 | 1.7596 |
| 2018 | 29.08 | 17.05 | 16.05 | 3.00 | 16.29 | 3.43 | 15.11 | 1.7563 |
| 2019 | 30.61 | 17.46 | 16.80 | 3.24 | 16.17 | 2.59 | 13.13 | 1.7337 |
从黄河流域城市建设用地结构信息熵来看,城市建设用地信息熵值在2007—2019年逐步减小,从1.7778 Nat降至1.7337 Nat(表2)。根据图2a中信息熵时序变化曲线,可将信息熵演化过程划分为“高位无序(2007—2011年)”“相对稳定(2012—2017年)”“低位有序(2018—2019年)”3个阶段。具体来看,2007—2011年,7大类建设用地规模均稳步增长,流域城市用地结构较为均衡,信息熵在1.77 Nat左右徘徊。2012—2017年,城市用地结构的有序度变动较小,信息熵在1.76 Nat左右保持相对稳定。具体来看,黄河流域城市公共设施用地和市政公用设施用地面积占比分别从19.36%和5.19%降至17.44%和3.61%,道路交通用地和绿地与广场用地面积占比分别从12.97%和11.78%增至15.73%和13.74%,其他用地类型规模占比基本稳定。2018—2019年,规模最大的居住用地占比进一步提高,而规模最小的市政公用设施用地占比进一步降低,促使城市用地系统的有序度提高,信息熵迅速降低。
从流域层面来看,2007年各流域城市建设用地信息熵差异较小,并且上游、中游和下游地区信息熵均随着时间推移波动下降,降幅分别达到0.0227、0.0680和0.0248 Nat(图2b)。其中,中游信息熵下降最多,上游和下游降幅相近,其背后的主要原因是黄河上中下游城市各类建设用地规模的异速增长及其对各自流域内城市用地系统有序度的差异性影响。对上游和下游来说,市政公用设施用地面积占比下降是城市用地结构信息熵降低的主要原因,占比分别从2007年的6.14%和5.88%下降至2019年的3.21%和2.54%,助推城市用地系统的有序度提升,并导致信息熵降低。对中游来说,规模最大的居住用地占比由2007年的28.94%升至2019年的33.49%;市政公用设施用地面积占比从6.73%降至2.29%,并替代仓储用地成为规模最小的用地类型。城市用地系统的演化导致各类型用地规模占比的极差增大和用地结构的非均衡度上升,城市用地系统有序度明显提升,信息熵下降较多。
2.2 黄河流域建设用地结构的时空格局
从黄河流域城市各类建设用地时空格局来看(图3),2007年黄河流域60个地级市城市居住用地面积均值为22.10 km2,高值城市集中在下游,其中济南市面积最大,达到79.31 km2。到2019年,随着城市规模的快速扩张和市区常住人口规模的提高,政府投入大量资源进行房地产开发建设,促使黄河流域城市居住用地面积均值上升至42.90 km2,并有75%的城市居住用地规模超过15 km2,其中西安市的居住用地面积最大,达到246.08 km2。就公共设施用地而言,黄河流域各城市公共设施用地面积在2007年普遍低于20 km2。但是,到2019年,有36.67%的城市公共设施用地面积超过20 km2,其中济南市的面积最大,达到152.63 km2,表明地方政府在经济快速发展过程中不断推进公共设施建设以满足居民生产生活的需要。2007—2019年,黄河流域路网密度进一步提升,交通网络体系日渐完善,基本建成了郑州、西安、青岛等一批综合交通枢纽城市,助推城市道路交通用地面积均值从11.43 km2提高为22.66 km2,并有40%的城市道路交通用地面积增幅超过100%。2007年和2019年,黄河流域城市工业用地面积均值分别为15.93 km2和23.55 km2,其中黄河下游地市和上中游省会城市工业用地规模较大,但工业用地效率较低和不合理布局问题仍然存在。市政公用设施用地和仓储用地面积的高值区在研究期内主要为省会及区域中心城市。2007年,黄河流域81.67%的地市绿地与广场用地面积低于10 km2。随着以人为本的新型城镇化深入推进,各地普遍重视城市绿色空间和公共空间建设。到2019年,仅有33.33%的地市绿地与广场用地面积低于10 km2。整体而言,在经济社会快速发展的过程中,黄河流域省会及经济发达城市是各类建设用地配置的主要区域。
图3
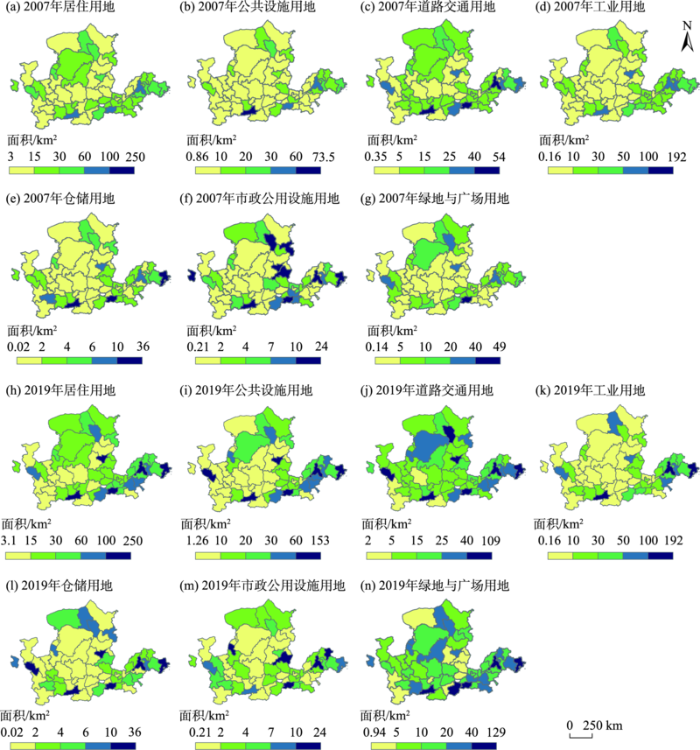
图3
2007—2019年黄河流域城市各类建设用地面积的时空变化
Fig.3
Spatial and temporal changes of urban construction land area in the Yellow River Basin during 2007-2019
对黄河流域各城市建设用地结构信息熵的分析显示,2007年信息熵处于高值区的地市数量较多,主要为西安、郑州、济南与呼和浩特等省会城市及周边城市,而低值区主要是庆阳、延安、陇南等经济发展水平较差的黄土高原地区地市(图4)。各城市信息熵变异系数结果显示,城市间信息熵差异较大。伴随着经济社会的快速发展和城市建设的加快,城市用地结构呈现出不同的演化特征。2011年,黄河流域城市建设用地结构信息熵变异系数增至0.0846,城市间用地结构的差异逐步加大。具体来看,西安等大城市居住用地和工业用地面积急剧增长,各类建设用地的规模差异拉大,导致均衡度有所下降,信息熵不断减小;而兰州、巴彦淖尔等城市各类建设用地规模差异缩小,用地结构均衡度有所上升,信息熵不断增大。到2015年,大部分地市公共设施用地和道路交通用地面积稳步增长,使得城市建设用地结构趋于均衡,信息熵不断增大。其中,定西市、石嘴山市、宝鸡市等地市建设用地结构信息熵增幅较大,普遍超过0.10 Nat,而晋城市、聊城市、新乡市等地市信息熵降幅超过0.15 Nat。到2019年,乌兰察布等城市建设用地结构成熟度不断提高,信息熵持续增大,为熵值高值地市;陇南市、武威市、西宁市等地市建设用地结构信息熵增幅超过0.20 Nat;三门峡市、太原市、咸阳市等地市建设用地信息熵降幅超过0.1 Nat,表明各地市城市建设用地演化空间分异明显,但城市间用地差异降低,变异系数从2015年的0.0817降至2019年的0.0591。整体而言,2007—2019年,黄河流域城市建设用地结构信息熵差异在波动中减小,省会城市及经济发达地市建设用地结构信息熵呈现出下降趋势,而欠发达地市在近15 a的快速扩张中信息熵逐步增大,表明城市建设用地配置日趋均衡。
图4
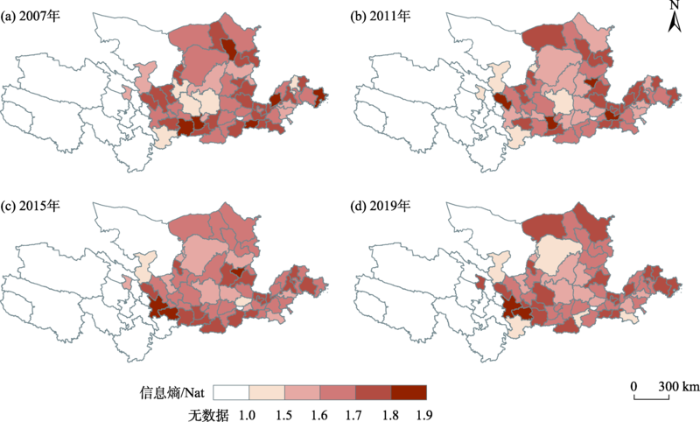
图4
2007—2019年黄河流域各城市信息熵时空格局
Fig.4
Spatial and temporal pattern of urban information entropy in the Yellow River Basin during 2007-2019
2.3 黄河流域建设用地结构变化的驱动机制分析
2.3.1 影响因素重要性分析
为验证随机森林模型的可靠性,分别构建多元回归模型和随机森林回归模型来分析城市用地结构信息熵与各影响因子之间的关系,并验证其回归精度(图5)。结果表明,多元回归模型得出的估算值与真实值差距较大,回归方程的调整R2仅为0.2197,平均绝对值误差(mean absolute error,MAE)为0.0821;随机森林模型估计结果的调整R2为0.9557,MAE仅为0.0228。这表明随机森林模型具有更好的拟合优度和更小的拟合误差,适合进行影响因素重要性分析。
图5
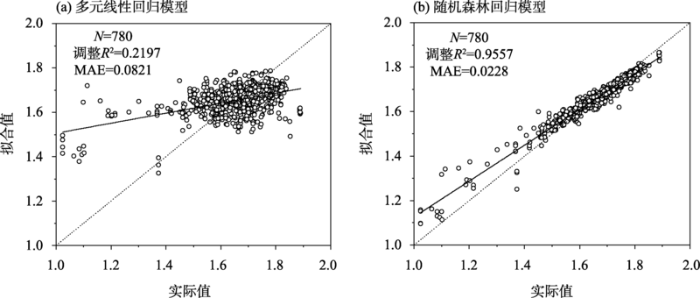
图5
多元线性回归模型与随机森林回归模型的拟合结果比较
Fig.5
Comparison of fitting results of multiple linear regression model and random forest regression model
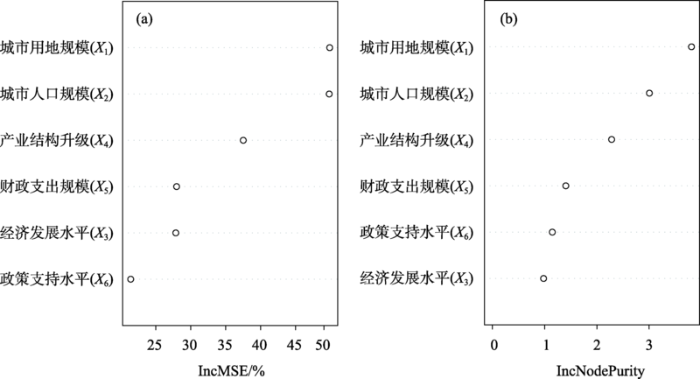
随机森林模型结果显示,IncMSE和IncNodePurity两种指标计算得到的影响因子重要性排序相差不大(图6)。城市用地规模、城市人口规模、产业结构升级、财政支出规模在2种测度方法中均排序前4且重要性依次递减,经济发展水平和政策支持力度对用地结构变化的影响较小。城市用地规模和城市人口规模是黄河流域城市建设用地结构演变最重要的驱动力,而经济发展水平和政策支持的影响有限。在快速工业化和城镇化过程中,大量乡村人口迁往城市,城市人口规模不断增大,对住宅、公共基础设施、道路交通改善等引致性需求急剧上升。在这种背景下,地方政府会加快城市内部建设和对外扩张步伐,驱动城市各类建设用地面积变化和城市用地结构的变迁。虽然产业结构升级是促进城市建设用地结构变化的内部驱动力,但由于只能间接反映产业用地的变化情况,与其他地类变动的关系较小,导致其重要性相对较低。财政支出规模的变化影响城市公共设施和道路交通的建设力度,进而作用于公共服务类用地规模和整个城市建设用地结构信息熵。职工年平均工资可在一定程度上反映城市居民的收入水平和生活水平,经济发展水平较高的地区其城市居民的消费能力也较强,居民对改善居住条件、出行条件,以及增加娱乐活动的需求增加,催生交通、娱乐设施等建设用地配套,间接影响城市内部生产、生活等地类的规模。然而,由于传导链条较长且非直接影响,其重要性相对较低。政策支持力度反映了房地产投资与城市GDP的相对变动关系,支持力度越大表明房地产投资依存度越高,使得城市发展难以彻底摆脱传统的“土地财政”发展模式,面临着经济发展动力不足和活力较差、用地结构转换速率较低等挑战。
图6
从各影响因子与城市用地结构信息熵的偏依赖图可以得出(图7),城市用地规模、城市人口规模、财政支出规模与城市用地结构信息熵呈正向变动关系,经济发展水平和产业结构升级与城市建设用地结构信息熵呈负向变动关系,政策支持力度则与城市建设用地结构信息熵呈现出“倒U”型变动关系。具体来看,随着城市用地规模的增加,城市用地结构信息熵不断增大,城市内部各地类规模趋于均衡。当城市建设用地面积超过100 km2后,用地规模对用地结构的作用达到最大并维持稳定。城市人口规模对用地结构的作用在城市人口为145万人时达到最大,之后迅速下降,在人口数为200万人时迅速加大并在之后保持稳定。随着经济发展水平的提高,城市用地结构信息熵不断降低,当职工年平均工资超过4万元时用地结构信息熵在低位保持相对稳定。产业结构升级与用地结构信息熵呈负向变化关系,在三产产值与二产产值的比值小于4时,用地结构信息熵在高位保持波动下降,但随着比值的增大,信息熵下降并在低位保持相对稳定。当一般公共预算支出大于100亿元时,财政支出规模的对用地结构的作用快速增大,但在高于300亿元时保持相对稳定。当房地产开发投资额占城市GDP比重为38%时,政策支持力度对用地结构的作用达到最大;当低于38%时,政策支持力度与用地结构信息熵变动呈正相关关系;而当高于38%时,两者呈负相关关系,即城市用地信息熵会随着财政支持力度的增大而减小,加大城市用地的不均衡程度。
图7
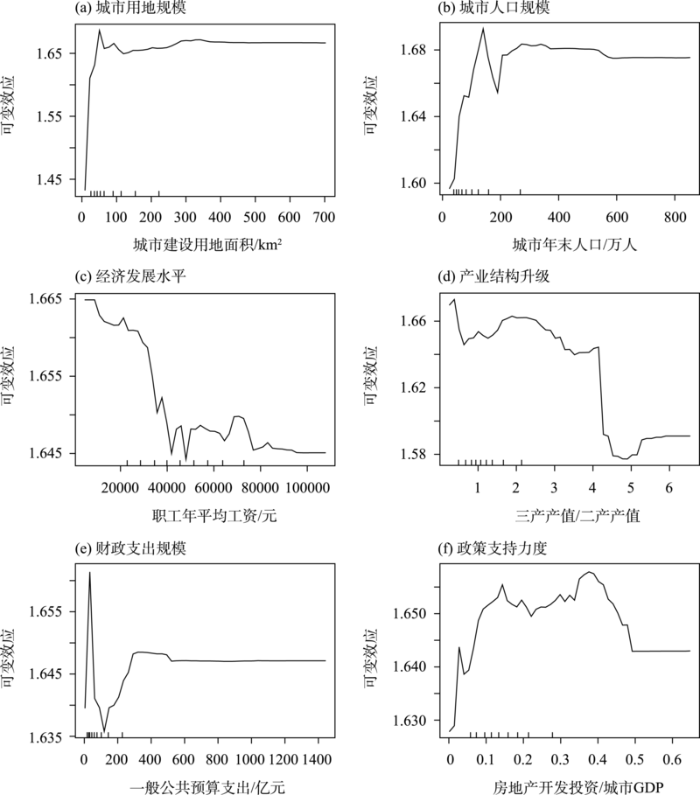
图7
影响因子对建设用地结构信息熵的偏依赖
Fig.7
Partial dependency for influencing factors on the entropy of construction land use structure information
2.3.2 影响因素重要性的上中下游差异
以随机森林模型计算得到的IncMSE为指标分析各驱动因子对黄河流域及上中下游城市建设用地结构演变的重要性差异(表3)。上游和中游各驱动因子重要性与整个流域的差异不大,城市用地规模和城市人口规模的重要性高于产业结构升级和财政支出规模,经济发展水平和政策支持力度的重要性最低。城市用地规模扩张直接影响各类城市建设用地配置,进而作用于城市用地结构信息熵。2007—2019年,黄河上游和中游城市建设用地规模共增长1826.77 km2,但居住、公共设施和道路交通用地的配置份额高达76.76%,是其余4类用地配置份额的3.3倍,这种差异化配置直接影响用地结构信息熵。随着城镇化进程不断推进,城市人口规模的增加促使地方政府扩大土地征收和土地出让规模,促进城市建设用地规模的扩张,进而影响城市建设用地结构信息熵。产业结构升级和财政支出规模分别通过影响产业类用地和公共基础设施类用地的变化作用于用地结构。2007—2019年,黄河上游和中游经济社会快速发展,社会消费品零售额和房地产开发投资年均增速保持在10%以上,助推了城市用地规模的快速扩张和用地结构的重组。下游驱动因子的重要性排序与上游和中游相差较大,城市人口规模和城市用地规模的重要性仍居于前2位,但后4位的排序变为经济发展水平>财政支出规模>政策支持力度>产业结构升级。相比于上游和中游,产业结构演替变为下游作用最小的因子,主要是由于下游城市发展水平普遍较高,二三产业产值的增加主要靠提升单位土地产出水平来实现。因此,相较于上游和中游地市,下游城市产业结构演变与隐含的产业用地变化之间的关系较弱,降低了产业结构升级对用地结构演化的解释力。
表3 黄河各流域中影响因子的重要性排序
Tab.3
| 区域 | 调整R2 | MAE | 排序1 | 排序2 | 排序3 | 排序4 | 排序5 | 排序6 |
|---|---|---|---|---|---|---|---|---|
| 总体 | 0.9557 | 0.0228 | X1 | X2 | X4 | X5 | X3 | X6 |
| 上游 | 0.9606 | 0.0267 | X1 | X2 | X4 | X5 | X3 | X6 |
| 中游 | 0.9471 | 0.0193 | X2 | X1 | X5 | X4 | X3 | X6 |
| 下游 | 0.9443 | 0.0163 | X2 | X1 | X3 | X5 | X6 | X4 |
整体来看,不同流域城市用地结构演变的驱动因子中,城市用地规模和城市人口规模仍是重要性排序前2位的因子,充分表明建设用地面积和人口数量的变化会极大地影响城市的用地结构,其他指标的重要性排序在不同流域呈现出明显的差异性。
2.3.3 城市建设用地结构演化的驱动机制解析
城市建设用地系统是一个与外界进行广泛物质循环、能量传递和信息交流的耗散系统,其结构演化的实质就是城市用地系统内部运行所产生的“正熵”和系统外部引入的“负熵”动态博弈的结果[8]。在快速城镇化过程中,大量乡村人口转移到城镇地区,为城市扩张蔓延提供源源不断的动力。2007—2019年,研究区城市市辖区的年末人口增加了约2000万人,庞大的迁入人口推高了对各类建设用地的需求,但居住、基础设施、道路交通等用地需求优先级较高,影响各地类规模的相对变化及用地结构的调整。在城市扩张的过程中,新增建设用地上的地类配置会影响整个城市建设用地结构的演变方向。数据分析结果表明,居住、公共设施、道路交通等用地在新增建设用地中占比较大,这种差异化配置在整体上的效果是降低了城市建设用地系统的有序度,推高城市建设用地结构信息熵。城市用地是城市产业发展的载体,产业转型升级会影响不同产业在土地竞争中优劣势的变化,侧面反映出产业用地的相对变动。随着工矿企业的外迁和商业服务业的稳步发展,城市内部结构完善和等级提升均有利于提高城市建设用地系统的有序度[40],从而降低城市建设用地结构信息熵。这与匡兵等[19]学者的结果相一致。在财政支出规模高速扩张的大背景下,城市内部道路交通基础设施不断完善、医院学校等公共设施配套也日渐完善,助力城市公共服务水平提高,成为城市建设用地结构信息熵上升的外部拉力[18]。随着经济发展水平的提升,城市居民对美好生活的向往更加强烈,对改善居住和出行条件、优化绿色公共空间、增加娱乐活动等需求增加,从而刺激城市居住、交通以及娱乐设施等建设用地配置,影响城市生产生活类用地规模和建设用地结构信息熵。政策支持力度反映了房地产投资与城市GDP的相对变动关系。在一定范围内,随着政策支持力度的增大,居住用地和商服用地规模不断扩张,产生与城市用地规模扩张相似的效应;当超过一定阈值时,城市商品房住宅类用地配置的倾向性明显,用地结构转换速率较低,增加城市用地结构的不均衡程度和提高用地系统的有序度,降低城市用地结构信息熵(图8)。
图8
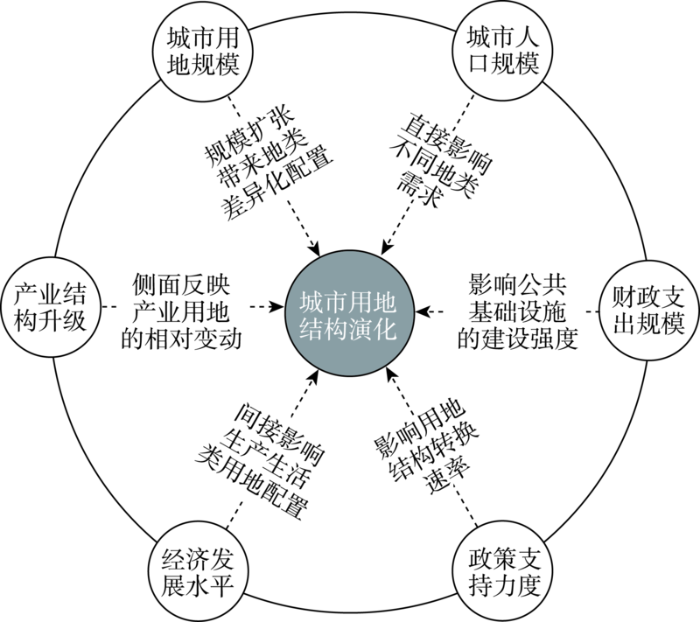
图8
城市建设用地结构演化的驱动机制
Fig.8
Driving mechanism of the change of urban construction land use structure
3 结论与讨论
3.1 结论
(1) 2007—2019年,黄河流域城市建设用地规模持续增长,年均增速达到5.34%;绿地与广场用地、公共设施用地、道路交通用地、居住用地面积年均增速超过研究区平均水平,而仓储用地、工业用地、市政公用设施用地面积的年均增速小于研究区平均水平。同期,黄河流域城市建设用地结构信息熵不断降低,从1.7778 Nat降至1.7337 Nat,经历了从“高位无序”到“低位有序”的变化过程。
(2) 2007—2019年,黄河上中下游城市建设用地规模增速依次加大,年均增速分别达到3.91%、5.06%和6.22%,城市建设用地结构从23%∶34%∶43%演变为19%∶33%∶48%。相应地,信息熵在波动中不断下降,其中中游城市用地结构信息熵下降最多,上游和下游城市的降幅相近。
(3) 在研究期内,黄河流域城市建设用地结构信息熵的变异系数从0.0773降为0.0591,表明城市间用地结构信息熵的差异波动减少。其中,省会城市及经济发达城市建设用地结构的信息熵存在降低趋势,用地均衡度有所降低,而欠发达城市的信息熵逐步增大,用地配置日趋均衡。
(4) 对整个黄河流域来说,城市建设用地规模和城市人口规模对城市用地结构演化的作用最强,而经济发展水平和政策支持力度的作用较小。分流域结果表明,驱动因子对用地结构演变的作用存在异质性,中上游地区的分析结果与总体接近,而下游相差较大。
(5) 不同驱动因素对城市建设用地结构演化的作用方向存在差异。其中,城市用地规模、城市人口规模、财政支出规模与城市建设用地结构信息熵呈正向变动关系,经济发展水平、产业结构升级与城市建设用地结构信息熵呈反向变动关系,政策支持力度则呈现出“倒U”型的变动关系。
3.2 讨论
适度的城市建设用地规模和合理的城市用地结构是打造城市秀美生态空间、高效生产空间和宜居生活空间的重要基础,也是实现城市高质量发展的必由之路[41-42]。结合黄河上中下游城市用地现状及国家宏观战略规划指引,充分发挥各驱动要素在城市建设用地结构演化中的“推”“拉”作用,可以助力城市用地精明增长和结构优化,服务城市高质量发展。城市用地规模和城市人口规模是影响最显著的2个因素,因此对整个黄河流域城市发展来说,要严格限制盲目扩张类开发建设,聚焦城市建成区内各地类重组和用地效率提升;同时,积极推进以人为本的新型城镇化,促进人口的集聚,优化城市发展格局,提升城镇化发展质量。除此以外,产业结构升级、财政支出规模、经济发展水平分别是上中下游地区最重要的驱动要素。因此,对上游来说,还需充分发挥生态和环境优势,优化配置各类产业用地,推进生态产业化和产业生态化,助力区域产业结构转型升级,实现生态保护与经济发展的互促共进。对中游来说,政府投资在城市建设用地结构演化中的作用依旧突出,在这一背景下,需要弱化政府对经济活动的干预,充分发挥其裁判员和服务员角色,同时积极健全市场机制以充分发挥市场在资源配置中的决定性作用,盘活各类用地需求和提高城市用地转换速率,提升城市发展的活力和竞争力。对下游来说,还需适应经济发展的新常态,依托良好的发展基础,积极推动经济增长方式转变,实现经济发展数量和质量的同步提升,进而辐射带动流域整体社会经济发展,成为黄河流域生态保护和高质量发展的引擎。
在黄河流域生态保护和高质量发展成为国家战略的大背景下,本文选择黄河流域开展城市建设用地结构的研究有助于支撑黄河战略的实施;另一方面,随着人工智能和机器学习的不断发展,本文尝试将回归精度更高的随机森林模型应用于城市用地结构演化机理的研究,进而解析经济、社会、产业、政策等多维要素对城市建设用地结构演化的驱动机制,并分析了黄河上中下游驱动因素作用强度的异质性及传导路径,对于优化调控城市建设用地结构和促进城市高质量发展具有一定的现实价值。然而,由于本文主要使用的是城市用地的统计数据,无法精确定位各地类在城市内部的空间位置,未来需要进一步结合遥感等时序数据开展栅格尺度的城市用地情景模拟研究,形成精细的城市建设用地空间布局优化方案,进而高效配置城市建设用地,服务黄河流域生态保护和高质量发展战略的落实。
参考文献
中国城市化水平的综合测度及其动力因子分析
[J].
Comprehensive evaluation and the driving factors of China's urbanization
DOI:10.11821/xb200904001
[本文引用: 1]

From the essential meaning of urbanization, this paper establishes a comprehensive evaluation index system, including four aspects changing: population, economy, society and land. Based on the method of entropy, the measure and evolution of China's urbanization are analyzed since 1981. The results show that China's comprehensive urbanization level continues improving. Economic growth and geographical landscape are the main features of rapid evolution of urbanization, followed by the population urbanization, and the medical care level of social urbanization is the least advanced. The evolution of all the four subsystems has unique characteristics. The analysis of multiple regression model shows that the driving factors have been diversified. The market force is the most powerful driving force of China's urbanization, followed by intrinsic force, administration force, exterior force. From different stages of urbanization, the effects of market force, exterior force and the administration force on urbanization are increasing, while intrinsic force is decreasing. China's urbanization is the main endogenous process, hence more policies should be formulated to strengthen the market economy reform and coordinate urban and rural development.
中国县域土地城镇化的区域差异及其影响因素
[J].
DOI:10.11821/dlxb201812005
[本文引用: 1]
中国经历了史无前例的快速城镇化进程,与之相伴随的是更加迅猛的土地城镇化过程。基于2000年和2015年中国土地利用现状遥感监测数据,综合运用空间分析、多元回归和地理加权回归的方法,深入分析了中国县域土地城镇化的区域特征及其影响因素。结果表明:① 中国县域土地城镇化率年均增长2.77%,其中近40%的区县城镇化率年均增长大于3%;在空间上呈现出不同于人口城镇化的扩散趋势。② 中国县域土地城镇化的南北分异规律较东西分异更为明显。土地城镇化的高值区域始终集中在胡焕庸线的东南半壁,而围绕主要的城市群地区则形成“组团式”增长的热点区,地区间差异趋于收敛。③ 人口集聚、经济发展、产业结构、城市特性与地理区位等要素对县域土地城镇化空间分异格局的影响较为显著、稳定,各要素对土地城镇化的影响均具有明显的时空依赖特征。分析揭示县域土地城镇化的时空特征及其动力机制,对于科学认识新型城镇化和实施城乡融合、乡村振兴战略,具有重要的理论价值与现实意义。
我国城市化进程中的城市空间演化研究
[J].
On the urban spatial evolution in the process of urbanization in China
Land market, land development and urban spatial structure in Beijing
[J].DOI:10.1016/j.landusepol.2013.10.019 URL [本文引用: 1]
城市土地利用结构的熵值定律
[J].
The basic laws of the Shannon entropy values of urban land-use composition
区域土地利用结构的信息熵分异规律研究
[J].
The laws of the information entropy values of land use composition
城市化时期郊区土地利用结构信息熵上升的原因
[J].
DOI:10.11821/dlxb201809003
[本文引用: 2]
本文认为,此前一直被当作城市化地区的土地利用结构信息熵快速上升,应是指城市化地区郊区的土地利用结构信息熵上升。城市化时期郊区土地利用结构向均衡化方向的明显变动,引起了郊区土地利用结构信息熵的上升;城市建成区的土地利用结构信息熵却未有上升,其各种土地利用类型的面积占比在城市化时期基本稳定,或向居民点及工矿用地、交通用地类型有所集中,导致其土地利用结构信息熵基本不变或有所下降。郊区的局部城市化区域对郊区土地利用结构信息熵的上升有着主要贡献。数据分析显示,城市化时期郊区的农用地较多较快地转化成了城市建设用地,且后者的面积占比与土地利用结构信息熵之间具有高度正相关关系,说明城市建设用地的快速增加是引起郊区土地利用结构信息熵上升的主要原因。熵变化分析表明,城市化时期郊区系统的熵变化与郊区土地利用结构信息熵的变动方向一致,均大于零,表征了郊区的自然地理环境演化在此期间是向着有序性降低的方向发展的。
Reasons for the increasing information entropy of suburban land use structure during the period of urbanization
DOI:10.11821/dlxb201809003
[本文引用: 2]
This paper pointed out that the alleged rapid increase of the information entropy of the land use structure in the urbanized areas should refer to the increase of the information entropy of the suburban land use structure in the urbanized areas. The obvious shift of the suburban land use structure towards the equilibrium direction during the period of urbanization leads to the increase of the information entropy of the suburban land use structure. Meanwhile the information entropy of the land use structure in urban built-up area has not increased. The proportion of various land use types in the urban built-up area during the period of urbanization is basically stable or enlarged on the residential areas, industrial and mining areas as well as the transportation land to some extent. This makes the information entropy of the land use structure in the urban built-up area basically remain unchanged or decrease somewhat. The local urbanized areas in the suburbs have made major contributions to the increase of the information entropy of the suburban land use structure. Data analysis shows that a great amount of suburban farmland is quickly transformed into urban construction land during the period of urbanization and the proportion of the urban construction land is highly and positively correlated with the information entropy of the suburban land use structure. It can be seen that the rapid increase of the urban construction land is the main reason for the increasing information entropy of the suburban land use structure. The analysis of entropy change indicates that the entropy of suburban system during the period of urbanization displays the same changing trend with the information entropy of the suburban land use structure, and both of them are greater than zero, which suggests that the suburban natural environments during the period of urbanization develop in a decline.
城市土地利用结构和形态的定量描述: 从信息熵到分数维
[J].
An index of equilibrium of urban land-use structure and information dimension of urban form
DOI:10.11821/yj2001020003
[本文引用: 1]
<p>To characterize the equilibrium extent of structure of urban land use, an index formula based on information entropy is advanced as follows: J=-∑NiP i log P i/ log N In the formula,P i=A i/A=A i/∑NiA i,where A is the area of urbanized area of a city, A i is the land area of a certain function type,and N is the number of land function types Correspondingly, the difference of an index is defined as I=1-J,which can be used to reflect the inequality of urban land use When information entropy is generalized to describe the spatial morphology of urban land use by means of making ‘nets’ on maps,information dimension as one of the fractal dimensions can be computed to qualify the spatial patterns of urban land use.</p>
基于偏移—份额法的区域建设用地结构变化和空间分布研究
[J].
Research on regional structural changes and spatial distribution of construction land based on shift-share analysis
中国城市建设用地结构时空演变特征及机理研究
[J].
Research on space-time evolution features and mechanism of China's urban construction land structure
基于生态算法的城市建设用地结构优化
[J].
Structure optimization of urban development land based on ecological algorithm
嘉鱼县土地利用结构与效益变化的耦合效应分析
[J].土地利用结构优化配置是实现土地利用效益增长的核心内容之一,研究两者之间的时空变化关系对于解决我国城市化快速发展中面临的一系列问题具有重要的现实意义。本文借助信息论原理,分析1997年~2007年湖北省嘉鱼县土地利用结构信息熵与均衡度动态演变特征;运用层次分析法原理构建简明化的指标体系,探讨其研究期间土地利用效益的变化特点;同时利用灰色关联分析法比较研究土地利用结构与效益变化的定量关系。研究表明:①1997年~2007年嘉鱼县土地利用结构信息熵与均衡度呈上升趋势,土地利用综合效益在此基础上出现较快增长,土地利用结构信息熵与土地利用综合效益变化之间呈现出较明显的相关性,关联度为0.7679;②不同土地类型的结构变化与土地利用综合效益变化之间分为强、较强、中等3种关联性,强关联的是居民点及工矿用地、园地,关联度均在0.8以上,较强关联的是林地、未利用地与耕地,关联度都高于0.7,中等关联的是交通用地与水域,关联度分别为0.6714与0.6672;③合理的土地利用结构是土地利用效益有效发挥的前提,土地利用效益变化是土地利用结构时空变化的即时效应与累积效应的共同结果。
Correlation analysis of the changes of land use structure and land use efficiency: A case study of Jiayu County in Hubei Province
Land use efficiency is one of the primary fields in land use study as it is an essential indicator for land use assessment. Land use efficiency refers to the direct outputs or effects brought by the land use process. Land use efficiency is an integrated concept comprising three sub-systems, which are economy, society and ecology. One important component of improving land use efficiency is the optimization of land use. Spatial-temporal analyses of land use structure and land use efficiency are useful for addressing the problems related to the rapid urbanization in China. Based on information theory, the changes in information entropies of land use structure in Jiayu from 1997 to 2007 are generated by using the land use data. The indicator system for evaluating land use efficiency is set up by means of AHP, in which 3 indicators representing economy, society and ecology are included. Finally, with the method of grey correlation analysis, the correlations between land use structure and land use efficiency are studied. The results show that the information entropies and equilibrium degrees of land use structure have increased gradually in Jiayu from 1997 to 2007, and the corresponding index values of land use efficiency have manifested a rapid increase from 0.0428 to 0.7608 in the study area. There are certain logical relations between land use structure and land use efficiency, and the correlation degree is 0.7679. The land use potential of Jiayu County is comparatively large and there is still space for further optimization of its land use structure. According to the actual situation of study area, the standards of correlation degree of land use types are classified into three levels: high (>0.8); secondary (>0.7) and medium (>0.6). The descending order of correlation degree for each land use type is: residential and unattached industrial land (0.8104), garden (0.8087), forestland (0.7405), unused land (0.7264), cultivated land (0.7011), traffic land (0.6714) and water area (0.6672). Land use structure plays an important role in improving land use efficiency with instant and accumulative effects. The information entropy of land use structure maintains a rising-adjusting-rising trend, and the land use efficiency maintains a growing trend according to the changes. In further study, more attention should be paid to the functions of the different spatial combination and land use types distribution in order to improve land use efficiency.
1910—2010年沈阳城市土地利用空间结构演变特征
[J].
Spatial structure evolution of urban land use in Shenyang during 1910-2010
DOI:10.11820/dlkxjz.2012.09.012
[本文引用: 1]
In research of spatial structure evolution of land use of Shenyang in recent century, this paper used the multi-temporal and multi-source historical data, with the special historical period divided into 5 stages of research from 1910 to 2010. With the support of the single land use type dynamic degree, land use type transfer matrix and the method of spatial, we analyzed various city land use type, structure, mutual transfer and distribution characteristics of Shenyang in the past century. The results showed that: living land increased by 118.81 km<sup>2</sup>, industrial and commercial land increased by 148.21 km<sup>2</sup>, transportation land increased by 130.97 km<sup>2</sup>, presenting an increasing trend, while utilities land, green spaces and other land use generally went up slowly. In different periods land use structure was obviously different, and residential land had been dominant, accounting for an average of 32.36%, which declined in proportion after the founding of New China, but the industrial and commercial land use increased by 25.17% on average. In addition, conversion of each land use type was divided into three parts: transfer, transferred and constant, among which, non-construction land shifted to various land types accounted for the largest proportion, and constant part of the same land use has the greatest proportion, while the quantity transferred to the residential land and transportation land was the greatest. With the time went, the ratio of residential land was gradually reduced in the central area of the city, and in the sub-center the ratio increased first and then decreased. The proportion of industrial and commercial land increased gradually from central to marginal area, and the proportion was the highest in the marginal area. Public utilities land was outwardly gradually decayed, and in the center of the city public utilities accounted for a larger proportion. It is concluded that land use spatial structure in Shenyang presented a circular pattern from the inside to the outside.
Spatiotemporal evolution of urban form and land-use structure in Hangzhou, China: Evidence from fractals
[J].DOI:10.1068/b35078 URL [本文引用: 1]
基于信息熵的建设用地演化和人文驱动分析: 以黑龙江省为例
[J].
The evolution of construction land and analysis of human driving force based on information entropy: A case study of Heilongjiang Province
辽中南城市群城市用地结构的时空演变分析
[J].
Study on evolution of urban land structure in Liaozhongnan city groups
收缩情境下城市用地结构时空格局演变及动力机制: 以中国东北地区为例
[J].
DOI:10.11821/dlyj020200410
[本文引用: 4]
构建城市用地结构时空格局演变分析框架,引入信息熵和偏移份额模型定量剖析2000—2017年中国东北地区城市用地结构时空格局演变特征,通过计量经济模型分阶段对比分析收缩情境下东北地区城市用地结构演变的动力机制。结果表明:东北地区城市用地总面积持续增长,用地结构信息熵整体呈现先上升、后下降的趋势。2011年以后,城市用地结构有序性、多样性不断提升,单一优势地类主导作用显著下降。公共设施用地、道路交通用地及绿地与广场用地为增长型地类,是东北地区城市用地规模扩张和结构演变的主要动因。用地结构竞争性偏移量具有显著的空间非均衡性,总体与辽中南和哈长两大城市群空间格局基本吻合,新增城市用地的集聚效应不断凸显。城市人口规模变迁、城市经济发展水平提升、产业结构升级与城市居住条件改善对城市用地结构演变具有显著的正向驱动作用。收缩情境下,各因素的拉动作用逐渐减弱,国家宏观政策的约束力不断增强,城市公共服务水平改善的强需求成为驱动用地结构演变的外在动力。
Spatio-temporal evolution and driving mechanism of urban land use structure with the context of urban shrinkage: Evidence from Northeast China
DOI:10.11821/dlyj020200410
[本文引用: 4]
Based on the analysis framework of spatio-temporal evolution of urban land use structure with the context of shrinkage, this study introduced the Information Entropy Model and the Shift-Share Model to examine the spatio-temporal evolution characteristics of urban land use structure in Northeast China, using panel data from 2000 to 2017. The dynamic mechanism of structural evolution of urban land use in Northeast China was analyzed by econometric model. The results demonstrated that: (1) the total area of urban land in Northeast China increased continuously since 2000, while the information entropy of urban land use structure increased firstly and then decreased. After 2011, with the improvement of diversity and equilibrium degree of urban land use structure, the order of urban land use structure has been enhanced and the leading role of single dominant land type has been significantly reduced. (2) The three types of urban land, i.e., land for public facilities, land for road, street and transportation and land for green space and square were growing, which is the main reason for the rapid increase of the total urban land area in the study region. (3) There exists significant spatial imbalance of competitiveness of different urban land types, which evolve constantly in different regions, and the overall spatial pattern is basically consistent with the distribution pattern of the two major urban agglomerations of central and southern Liaoning city groups and Harbin-Changchun megalopolis. Meanwhile the agglomeration effect of new-added urban land area is increasingly prominent. (4) The dynamic change of urban population, urban economic development, the upgrading and adjustment of industrial structure, and the improvement of urban living conditions all have significant positive impact on the dynamic evolution of urban land use structure in Northeast China. In the context of urban shrinkage, the effect of various factors is gradually weakened, and the binding force of national macro policies is increasing. Meanwhile, the demand for the improvement of urban public services has become the external driving force for the evolution of urban land use structure. To realize the overall revitalization of Northeast China, differentiated measures should be taken to reverse the trend of population loss, and boost the vitality of regional economic development.
武汉城市群城市用地结构时空演变特征及其机理
[J].
Spatio-temporal features of urban land structure change in Wuhan City group and underlying causes
Urban land use change and its socio-economic driving forces in China: A case study in Beijing, Tianjin and Hebei region
[J].DOI:10.1007/s10668-017-9928-6 URL [本文引用: 1]
基于信息熵和灰色关联的成都市建设用地结构时空变化及驱动力分析
[J].
Temporal-spatial changes and driving forces of built-up land structure in Chengdu City based on information entropy and gray correlative degree analyses
南京市2000—2014年城市建设用地变化及驱动因子研究
[J].
The analysis on urban construction land change and driving forces in Nanjing from 2000 to 2014
百年未有之大变局下中国区域发展格局演变
[J].
Spatial evolution process of China's regional development pattern in big changes unseen in a century
Geography, phenomenology, and the study of human nature
[J].DOI:10.1111/j.1541-0064.1971.tb00156.x URL [本文引用: 1]
土地利用转型与乡村振兴
[J].
Land use transition and rural vitalization
黄河流域城市群与产业转型发展
[J].
Urban agglomeration and industrial transformation and development in the Yellow River Basin
DOI:10.31497/zrzyxb.20210201 URL [本文引用: 1]
黄河流域城市群形成发育的空间组织格局与高质量发展
[J].
Spatial organization pattern and high-quality development of urban agglomeration in the Yellow River Basin
DOI:10.2307/142170 URL [本文引用: 1]
黄河流域地级城市土地集约利用效率与生态福利绩效的耦合性分析
[J].
Coupling analysis of land intensive use efficiency and ecological well-being performance of cities in the Yellow River Basin
DOI:10.31497/zrzyxb.20210108 URL [本文引用: 1]
云南省楚雄市与双柏县土地利用变化对比研究
[J].
The comparative analysis of land use change between Chuxiong and Shuangbai in Yunnan Province
DOI:10.11821/yj2006030004
[本文引用: 1]
In this paper,we analyzed the land use change in Chuxiong city,a plateau area and Shuangbai county,a mountainous area in Yunnan Province,based on their TM images in 1980 and 2000.Four kinds of indexes for land use/land cover,two kinds of indexes for the spatial patterns of regional landscape,the land use type transition matrix and information entropy of land use structure were calculated to examine spatial patterns and dynamics of land use change in Chuxiong and Shuangbai.The results show that,due to human activity,the land use change in Chuxiong was greater than that in Shuangbai during the past 20 years.The built-up area and timberland have increased,but cropland,grassland and water area have decreased in both Chuxiong and Shuangbai.The change of water area and grassland in Shuangbai was faster than that in Chuxiong,the change of built-up area and cropland in Chuxiong was faster than that in Shuangbai.Index for landscape diversity in Shuangbai was lower than in Chuxiong,showing a decreasing tendency in Chuxiong,but an increasing tendency in Shuangbai.Landscape fragmentation indexes were high,the landscape fragmentation indexes in Chuxiong were greater than in Shuangbai,both showing a decreasing tendency.The land use system tended to be unstable in Chuxiong,but oppositely in Shuangbai.The main driving forces of regional land use change in Chuxiong and Shuangbai were natural conditions,economic development,structure of production,level of urbanization and governmental decision makings.Effect of population increase on land use in Shuangbai was notable,but it was not marked in Chuxiong.
中国城市发展的自组织特征与判据: 为什么说所有城市都是自组织的?
[J].
Self-organized characteristics and criteria of the development of Chinese cities
Random forests
[J].DOI:10.1023/A:1010933404324 URL [本文引用: 2]
基于随机森林的元胞自动机城市扩展模拟: 以佛山市为例
[J].
DOI:10.18306/dlkxjz.2015.08.001
[本文引用: 1]
本文提出一种基于随机森林的元胞自动机城市扩展(RF-CA)模型。通过在多个决策树的生成过程中分别对训练样本集和分裂节点的候选空间变量引入随机因素,提取城市扩展元胞自动机的转换规则。该模型便于并行构建,能在运算量没有显著增加的前提下提高预测的精度,对城市扩展中存在的随机因素有较强的容忍度。RF-CA模型可进行袋外误差估计,以快速获取模型参数;也可度量空间变量重要性,解释各空间变量在城市扩展中的作用。将该模型应用于佛山市1988-2012年的城市扩展模拟中,结果表明,与常用的逻辑回归模型相比,RF-CA模型进行模拟和预测分别能够提高1.7%和2.6%的精度,非常适用于复杂非线性特征的城市系统演变模型与扩展研究;通过对影响佛山市城市扩展的空间变量进行重要性度量,发现对佛山城市扩张模拟研究而言,距国道的距离与距城市中心的距离具有最重要的作用。
Urban expansion simulation by random-forest-based cellular automata: A case study of Foshan City
DOI:10.18306/dlkxjz.2015.08.001
[本文引用: 1]
Cellular automata (CA) has been frequently used to investigate the logical nature of self-reproducible systems and simulate the evolution of complex geographical phenomena such as urban expansion. The core of cellular automata is to define transition rules. Traditionally, approaches for defining the transition rules of cellular automata had difficulty to balance the interpretability, accuracy, and convenience. This article presents a new cellular automata model for simulating urban expansion based on random forest algorithm. The proposed model extracts CA transition rules of urban expansion by introducing random factors in training samples and candidate spatial variables that split nodes during the multiple decision trees building process. One significant advantage of our approach is that it can be easily adopted for parallel implementation and has high prediction accuracy and tolerance to random factors in urban expansion. Another strength of the proposed approach is that it can estimate out-of-bag errors to obtain model parameters quickly and measure the importance of spatial variables and explain the contribution of each variable in urban expansion. The model was applied to simulate urban expansion in Foshan City, Guangdong Province. We used the urban land change of 1988 and 2000 as the dependent variable and the spatial variables as the independent variables to construct the CA model based on random forests, then simulate and predict urban expansion of 2000 and 2012. The results show that random forest model can improve the simulation and prediction accuracies by 1.7% and 2.6%, respectively, when compared to the logistic regression model commonly used in CA simulation. This suggests that random forest model is superior for modeling complex nonlinear urban evolution. Urban expansion of Foshan City in 2024 was also predicted according to its urban development trend. Through measuring the importance of some spatial variables that affect urban expansion, we found that distance to national roads and to the city center are the two most important spatial variables for urban expansion simulation in Foshan City.
中国城市空气质量的区域差异及归因分析
[J].
DOI:10.11821/dlxb202111015
[本文引用: 1]
开展城市空气质量时空格局演变特征及其影响因素的研究,对于深入认识城市环境与社会经济系统的互馈机理、制定高效的环境治理措施、提升城市发展质量具有重要的理论与实践意义。本文以中国全面实施《大气污染防治行动计划》的2014年为起点,刻画了2014—2019年286个地级以上城市6种空气污染物浓度(CO、NO<sub>2</sub>、O<sub>3</sub>、PM<sub>10</sub>、PM<sub>2.5</sub>、SO<sub>2</sub>)的时空演变特征,并基于面板回归模型分析各污染物浓度之间的相互作用关系;进而利用随机森林模型对城市6种空气污染物浓度与13个自然和社会经济影响因子的关联强度进行探究,从中梳理出关键影响因子。结果显示:① 研究期内,O<sub>3</sub>污染加剧,其余污染物年均浓度逐年下降,其中SO<sub>2</sub>浓度降幅最大。虽然典型的重污染区范围有所减小,但京津冀、山东半岛、山西、河南等地区的城市空气污染物浓度仍相对较高。② 城市6种空气污染物浓度之间存在显著的相互影响关系,城市空气复合污染特征明显。③ 自然因素和社会经济因素对不同种类空气污染物浓度的影响差异较大,且与污染物浓度之间呈非线性响应关系。自然因素中,城市年均气温与空气污染物浓度的关联强度最大,其次是植被指数。社会经济影响因素中,土地城市化水平和二产比重是主导影响因子,其次是电力消耗总量和交通因子。偏依赖分析进一步刻画了不同污染物浓度对主导影响因子的响应突变阈值。鉴于人类对于自然环境和气象条件的控制能力有限,建议继续通过优化城市密度、控制人为排放源及严格的空气污染防控措施以进一步有效提高城市空气质量。
Regional variation of urban air quality in China and its dominant factors
DOI:10.11821/dlxb202111015
[本文引用: 1]
:Research on the spatiotemporal evolution of urban air pollution and its driving forces has great theoretical and practical significance because it helps to deeply understand the mutual feedback mechanism between urban environment and socio-economic system and improve the efficiency of environmental governance. This paper illustrated the regional evolution characteristics of six urban ambient air pollutants, namely, CO, NO2, O3_8h, PM10, PM2.5, and SO2, in 286 sample cities at the prefecture level in China from 2014 to 2019, starting from the year when the "Air Pollution Prevention and Control Action Plan" was fully implemented in China. The interactions between the concentrations of each pollutant were then analyzed on the basis of panel regression models. Furthermore, random forest model was employed to explore the correlations between concentrations of these six pollutants and thirteen natural and socio-economic impact factors so as to sort out crucial ones. The results are shown in three aspects. First, the average annual concentration of O3_8h increased while that of the other urban ambient air pollutants decreased year by year, among which SO2 concentration decreased the most. Although the typical heavy pollution areas had shrunk, cities in the Beijing-Tianjin-Hebei region, Shandong Peninsula region, Shanxi Province, and Henan Province still have witnessed relatively high concentrations of air pollutants. Second, there was a significant interaction between concentrations of these six pollutants, indicating that comprehensive measures for urban air pollution prevention are necessary. Third, the impact of natural factors and socio-economic factors on urban air quality varied greatly towards different air pollutants, together with a nonlinear response relationship with the pollutant concentrations. Within the selected five natural factors of temperature, precipitation, wind speed, humidity and NDVI, the urban annual average temperature had the strongest correlation with air pollutant concentrations, followed by NDVI. Among the eight selected socio-economic factors, the level of land urbanization and the proportion of secondary production were the two leading drivers of the urban air pollution, followed by the total power consumption and traffic factors. Besides, partial dependence model was used to further analyze the response threshold of different pollutant concentrations to the dominant influencing factors. In consideration of the limited ability of human to control the physical environment and meteorological conditions, it is recommended that urban air quality should be further effectively improved by means of the optimization of urban density, the control of man-made emission sources, and the implementation of strict air pollution prevention and control measures.
基于时序遥感的庐山自然保护区植被分类及其变化分析
[J].
DOI:10.18306/dlkxjz.2021.04.014
[本文引用: 1]
自然保护区是生物多样性最丰富的区域,针对近年来庐山自然保护区森林生物多样性进行调查,了解保护区内植被的分布及其变化,对于保护庐山境内的林业资源具有重要的意义。论文利用2015—2018年Proba-V卫星100 m分辨率5 d植被指数产品,使用最大值合成法、Hants时间序列谐波分析方法对数据进行平滑降噪处理,并采用随机森林算法进行分类,同时对庐山林地变化进行分析。结果表明:① 2015—2018年庐山林地随机森林分类的总体精度分别为85.00%、84.25%、84.75%、85.25%,Kappa系数分别为0.80、0.79、0.81、0.80。分类结果与LC-CCI、Globcover、Globeland30、MODIS等植被覆盖分类产品的对比分析表明,基于时序NDVI产品的随机森林分类器在空间分辨率和制图精度上都取得了较好的分类效果和较高的分类精度。② 庐山自然保护区内针叶林、阔叶林分布较为集中,混交林与竹林零散分布,其中,针叶林的分布面积最大,占比39.36%;竹林的分布面积最小,占比为14.63%。③ 2015—2018年间,庐山林地类型分布变化不大,阔叶林、针叶林、混交林变化率均低于10%,阔叶林变化最小,竹林由于受到人类活动影响,4 a间变化幅度波动较大。
Forest vegetation classification and its variation in Lushan Nature Reserve using Proba-V vegetation products
DOI:10.18306/dlkxjz.2021.04.014
[本文引用: 1]
Nature reserves are the areas with the most abundant biodiversity. Conducting a survey of current forest biodiversity in Lushan Nature Reserve and understanding the distribution and changes of vegetation in the protected area is of great significance for the protection of forest resources in Lushan. In this study, we used the Proba-V satellite 100-meter resolution 5-day vegetation index product from 2015 to 2018 using the maximum synthesis and Hants time series harmonic analysis methods to smooth the data and reduce noise, and used a random forest algorithm to classify the forest vegetation. The changes of Lushan vegetation communities were also analyzed. The research results show that: 1) The overall accuracies of the random forest classification of Lushan forestland from 2015 to 2018 were 85%, 84.25%, 84.75%, and 85.25% while Kappa coefficients were 0.80, 0.79, 0.81, and 0.80, respectively. Compared with the Cover-CCI-2010, Globcover-2009, Globeland30, and MODIS-2010 land cover products, the classification results by random forest classifier based on time series NDVI products have achieved good classification effect and high classification accuracy in spatial resolution and mapping accuracy. 2) In Lushan Nature Reserve, coniferous forest and broad-leaved forest are concentrated while mixed forest and bamboo forest are scattered among them. Coniferous forest has the largest distribution area, accounting for 39.36% of the total forest area, and the bamboo forest has the smallest distribution area, accounting for 14.63%. 3) From 2015 to 2018, the spatial distribution of forest vegetation communities in Lushan did not change much. The change rates of broad-leaved forest, coniferous forest, and mixed forest were all less than 10%. Bamboo forest fluctuated during 2015-2018 because of the interference of human activities while the change of broad-leaved forest was the smallest.
省际交界地区城市用地结构时空演变及影响因素: 基于信息熵视角的分析
[J].
Research on spatio-temporal evolution of urban land use structure in interprovincial border areas and the influencing factors: Based on information entropy theory
1979—2014年长沙市城市功能用地扩展与驱动力研究
[J].
DOI:10.11821/dlyj020171193
[本文引用: 1]
基于长沙市中心城区1979年、1989年、2003年、2011年、2014年5个年份的土地利用现状图,借助ArcGIS、SPSS分析工具,提取居住、工业、服务三大功能用地,从方向、圈层、强度、用地间转变及轴带趋向对长沙城市功能用地扩展的时空特征及驱动力进行研究。结果表明:① 用地扩展模式以“圈层式、轴带式”为主,并逐渐向“多组团式”过渡,由单一的向外扩展向内部功能间演替和外部扩展相结合转变。整体扩展方向经历了由“东、南、东南-西北、东、东南、北”的变化,但各类用地的扩展方向有所差异;② 从扩展强度看,居住用地远远高于城市总体扩展强度,造成了城市功能空间失衡的现象,服务配套明显滞后,部分分区在扩展过程中,出现了与规划定位严重不符的矛盾;③ 功能用地间的转变主要集中在城市核心区,表现出以核心-外围明显分异的差距。外围片区的功能较为单一,融合度不够,未来应增强配套服务功能。④ 从经济驱动力、政策调控力、生态制约力与吸引力、社会助推力四个方面分析了功能用地扩展时空差异的驱动因素。⑤ 从“问题导向-现象归纳-本质剖析-策略应对”提出了城市功能用地扩展研究的基本研究框架。
The expansion and driving forces of the functional space land: A case study of Changsha from 1979 to 2014
DOI:10.11821/dlyj020171193
[本文引用: 1]
The expansion of urban functional space has always been a core issue in the study of urban geography and urban planning. In this paper, we mainly focus on the following three types of urban functional spaces: residential space, industrial spaces and service space, and we take the central city of Changsha as our study area. Based on the land use map covering the years of 1979, 1989, 2003, 2011 and 2014 as well as corresponding statistical yearbooks, in combination of taking GIS and SPSS statistical tools, this article analyzed the dynamic features and driving forces of the functional space evolution of Changsha by citing a variety of models such as sector fractal, “center-periphery” spheres density, expansion intensity, coupling degree and axial sprawl index. The results were obtained as follows: (1) The urban functional space of Changsha's central city expanded rapidly between 1979 and 2014. And the pattern of extension was still displaying the “circle mode” and “axis belt mode”, but gradually transited to “polycentric structure”. In the process of quick external expansion, the urban land also filled internally in the study period. The direction of functional transformation presented a phase difference clearly, which had experienced the process of “east, south and southeast” from 1979 to 1989 to the “northwest, east, southeast and north” during 2011 to 2014. Meanwhile, it showed some differentiation of different types of functional land. (2) Residential space showed excessive expansion and guided other spaces extension, which was incompatible with other functional urban spaces, causing an imbalance in urban functional space. Some zones even showed serious contradiction with city planning during the process of expansion. (3) Functional spaces coupling showed significant “core-peripheral” geographic differentiation, and mainly focused on the core area. Functional space types in peripheral area were relatively single, which means that the level of alignment was insufficient. To strengthen urban comprehensive competitiveness, local government should improve service function and promote functional integration. (4) This study also probes the dynamic driving forces of the evolution of the functional space in Changsha City, mainly including economic, administrative, ecological and social factors. And the administrative factor played a significant role in the evolution. (5) We propose the basic research framework for the study of urban functional land expansion from "problem orientation -phenomenon induction - essential analysis - strategy response", which can provide theoretical guidance for optimizing the internal space structure and improve the functional efficiency of the central city.
土地经营对中国城市空间扩张的驱动机制: 基于273个地级市的实证分析
[J].
DOI:10.18402/resci.2021.04.11
[本文引用: 1]
分税制改革后,地方政府采取“以地生财、以财养地”的城市土地经营模式,凭借土地出让获取土地收益,并用于城市基础设施等城市建设投资,以推动城市经济发展,但土地经营对城市规模的空间扩张机制仍有待理清。基于地方政府土地收益和城市建设投资两个维度,本文构建了中国地方政府土地经营驱动的城市空间扩张理论逻辑,选择2003—2017年中国273个地级及以上城市面板数据,利用固定效应模型进行实证分析。研究结果表明:①2003—2017年中国城市空间规模、地方政府土地收益和城市建设投资均处于快速扩张阶段,然而以地谋发展的城市土地经营模式逐渐呈现出不可持续的端倪;②从全国尺度来看,土地经营模式下地方政府土地收益和城市建设投资均显著推动城市空间规模扩张。城市非农人口、城市人均GDP、城市三产产值占比以及城市人均道路面积对城市空间扩张均存在显著的促进作用;③从区域尺度来看,在东部、中部和西部地区,地方政府土地收益均显著推动城市空间扩张,但地方政府城市建设投资影响存在空间异质性,仅对西部地区城市空间扩张存在显著推动作用。此外,产业结构升级仅对东部地区存在显著的正向作用。新型城镇化背景下,地方政府应基于城乡互动关系,积极推进城市发展格局优化下的城市空间均衡扩张。
Driving mechanism of land conduct on urban spatial expansion in China: Empirical analysis based on 273 prefecture-level cities
DOI:10.18402/resci.2021.04.11
[本文引用: 1]
After the tax-sharing reform in China, local governments adopted the urban land conduct model of “making money from land and developing land with the money”, and relied on land transfer to obtain fund for urban infrastructure investment and to promote urban economic development. However, the mechanism of influence of land conduct on urban spatial expansion remains to be clarified. Based on the two dimensions of land revenue and urban construction investment of local governments, this study explored the mechanism of urban spatial expansion driven by local government land conduct. The panel data of 273 prefecture-level and above cities in China from 2003 to 2017 and the fixed effects models were used for an empirical analysis. The results show that: (1) China’s urban spatial scale, local government land revenue, and urban construction investment were all in a stage of rapid expansion from 2003 to 2017, but the urban land conduct model, based on the pursuit of land development, is gradually showing unsustainable signs. (2) From the national perspective, local government land revenue and urban construction investment have significantly promoted urban spatial expansion in China under the land conduct model. Urban spatial expansion was also remarkably stimulated by urban per capita GDP, urban non-agricultural population, the proportion of tertiary output value, and urban per capita road area. (3) From the regional perspective, local government land revenue has significantly promoted the urban spatial expansion in the eastern, central, and western regions. However, there is a spatial heterogeneity in local government urban construction investment, which only plays a tremendous role in promoting urban spatial expansion in the western region. In addition, compared with the whole country, the proportion of the tertiary output value has a notable positive effect only in the eastern region. Under the background of new urbanization, local governments should push forward more vigorously the balanced expansion of urban space under the partial equilibrium of urban development based on the interaction between urban and rural areas.
山东半岛城市群建设用地结构的时空特征及变化机理研究
[J].
Spatio-temporal characteristics and changing mechanism of construction land structure in Shandong Peninsula Urban Agglomerations
转型期中国城市用地结构动态演变及其机理: 基于长三角51个样本城市的实证研究
[J].
Dynamic evolution and its driving mechanism of urban land use restructuring within the transition context: Case study of 51 sample cities in the Yangtze River Delta
地理环境演化趋势的熵变化分析
[J].
The analysis of entropy changes on the evolutional tendency of geographical environment
DOI:10.11821/xb201111007
[本文引用: 1]
The evolution of geographical environmental system obeys the second law of thermodynamics: the order degree changes of the system are anti-related to its total entropy changes. The order degree increases when the total entropy changes are negative, and it is useful for human beings' survival and development, and vice versa. The analysis shows that the spontaneous evolution of natural geographical environment is developing towards ordering. The impacts of large-scale human activities on city system and human geographical environment are totally positive, and push its ordering development; their impacts on natural geographical development are both positive and negative. The positive impact is mainly the incremental production of low-entropy material and energy, which has been reflected in the increase of agricultural products and the application of new energy technology, such as solar energy, and ecological environment construction. The negative impacts are consumption of low-entropy material and energy, discharge of "three wastes" and elimination heat to the environment during the process of consumption and industrial production. These impacts lead to decrease of stock of low-entropy material and expansion of entropy increase during the geographical development, and have already caused common anxiety. Ordering of background evolution of natural geographical environment and technological possibility indicate that the evolution of geographical environment can continue ordering by introducing more low-entropy material and energy and decreasing the discharge of entropy.
中国城市建设用地的动态变化态势与调控
[J].
The variation characteristics and control measures of the urban construction land in China
城市增长边界研究进展: 理论模型、划定方法与实效评价
[J].
DOI:10.18306/dlkxjz.2020.02.013
[本文引用: 1]
新型城镇化背景下,传统粗放的城镇土地利用模式难以为继,控制城市规模、优化空间格局已成为当前国土资源管理的重点工作之一。城市增长边界(UGB)作为一种西方国家控制城市蔓延的技术手段和政策工具已逐渐被引入国内。采用文献资料法和归纳演绎法,梳理并分析了国内外城市增长边界的理论模型、划定方法与实效评价,挖掘未来城市增长驱动力和增长边界制定方法可能的研究方向,为后续研究和未来其在中国的实践提供参考。结果表明:① 城市增长边界实证研究的理论基础主要源于古典单中心城市模型,由于国情不同,国内主要关注经济水平、产业结构和可达性对城市增长的影响,而国外在此基础上还关注公共政策和服务、外部性以及主体间的博弈对城市蔓延的促进或抑制作用;② 城市增长刚性边界划定主要以土地适宜性和承载力评价为基础,弹性边界可采用元胞自动机进行空间辅助模拟;③ 国外城市增长边界的实施效果具有地区差异性,国内目前还缺乏城市增长边界实施效果评价相关方面的研究。因此,城市增长驱动力后续研究应吸纳多源理论,识别不同尺度下其机理特征,探索宏观环境的情景变量对微观环境下“驱动力—城市增长”这一关系的影响。城市增长弹性边界制定需要考虑城乡土地利用转换背后不同情景下主体间的复杂博弈对用地转换在空间上分布的决定作用。为了保证政策的持续性和统筹区域发展,未来需要明确城市增长边界的管理机构,制定对应的法律条款和管理体系。
A literature review of urban growth boundary: Theory, modeling, and effectiveness evaluation
DOI:10.18306/dlkxjz.2020.02.013
[本文引用: 1]
The traditional extensive urban land use will not meet the requirements of new urbanization. As a result, controlling urban sprawl and land use optimization have become one of the key tasks of land resources management. The purpose of this study is to provide new perspectives and identify research areas for urban growth boundary study through the review and analysis of existing theoretical models, methods, and effectiveness evaluation cases. The research methods we employed are literature review and induction and deduction. The results indicate that the theoretical basis of urban growth analysis came from monocentric city model. Most studies in China mainly focused on the impact of economic factors, industrial structure, and accessibility on urban growth while public policies and services, externality, and stakeholder power struggles are also thought to have effects on urban growth. Urban growth rigid boundary design is mainly based on suitability and carrying capacity assessments, and elastic boundary is usually modeled by using cellular automata. The effectiveness of urban growth boundary on controlling urban sprawl is different in different cities in developed countries. There are few case studies to evaluate the effectiveness of urban growth boundary in China. We should adopt diversified theories to study the mechanism of urban growth. The effects of multilevel drivers on urban growth should be considered in future research. Most importantly, stakeholder power struggles should be taken into consideration in future elastic boundary modeling. In order to make urban growth boundary policies sustainable and balance regional development, legal and management systems of urban growth boundary should be designed in the future.
