

区域合作是区位邻近的地区或城市通过建立沟通协调机制,制定统一的区域政策、规划布局及对接措施以实现要素优化配置的过程[5]。通过要素流动消解地理邻接作用的流空间重塑了区域空间结构,流空间理论也为区域空间结构演化提供了新的量化方法[6]。流空间是由信息流、物质流等要素组成的复合空间[7],在信息社会背景下,信息流对物质流的导引作用具有多维度、多层次的特征[8-9]。此外,信息流在实现不同局部地理空间的社会经济信息瞬时传递的同时,并没有降低地理空间生产的集聚性,因此在流空间的基础研究中适用性更广[10]。流空间测度区域空间结构的方法主要包括位序—规模法[11]与社会网络分析法[12],测度指标多涉及网络密度[13]与网络中心性[14]。流空间视角下城市网络空间与地理实体空间之间的耦合作用解析研究多集中于交通运输[15]、资本交易[16]及公共服务[17]等功能领域。在区域空间结构联系测算的基础上,常采用耦合协调度[18]、灰色关联度[19]等模型描述局部空间信息化建设水平差异,从而为区域城市间合作利益分配机制的调控提供依据。
产业一体化是区域各产业主体在区位选择的基础上运用资源整合、经济合作等手段,重塑产业空间布局并实现生产要素在区域内无障碍流动的过程[20-21]。产业一体化的动因在于通过各地资源的整合促进生态要素流动加快,从而形成与产业结构相匹配的发展格局[22]。一体化的发展目标可通过统筹区域发展提高资源利用效率,从制度层面消除行政壁垒,加快形成共同市场与要素自由流动[23-24]。已有研究主要基于区域产业同构化[25]、产业集聚协同[26]对产业一体化进行测度,产业一体化水平空间分异的影响因素主要包括区域市场化程度、外部投资等经济因素[27]、环境规制等社会制度因素[28],区域产业一体化进程的加快有利于促进区域市场整合及用地集约化发展,增强生产技术创新能力[29]。事实上,相对于传统产业环境下城市主体的独立性,产业一体化发展趋势使得主体间的合作进程易受邻域单元的影响[30]。此外,产业一体化是区域合作达到一定阶段的产物,它通过捕获集聚与互补效应成为实现区域经济效益的重要途径[31]。综上,已有文献多围绕区域合作经济网络空间演化特征及驱动机制、产业合作一体化等主题展开研究。区域合作网络分布特征多侧重于社会经济系统,缺少对政策制度性网络的量化分析。此外,产业一体化效应评价的数据源形式较为单一,采用多源数据对产业发展效应进行评价较为少见。
以优良港湾为依托形成的湾区成为当今世界经济版图中最突出的空间单元[32]。粤港澳大湾区(简称“大湾区”)是具有世界湾区规模实力以上的第四大群体,其“一国两制”背景下的区域合作与一体化进程有别于其他湾区[33]。早在20世纪90年代,大湾区已从多领域展开区域合作,为生产要素跨界流动、产业转移提供了便利[34]。如深圳前海蛇口、广州南沙、珠海横琴3个自由贸易实验区平台与港澳市场实现对接;珠三角9市的创新合作平台围绕科技资源要素开展规则衔接的压力测试[35],推动大湾区形成梯度发展、分工合理、优势互补的产业一体化体系。大湾区产业一体化在一定程度上打破了行政分割,构建起“前店后厂”的产业地域分工模式,但也表现出产业工序、地方产业组织模式碎片化等特征,不同城市产业发展模式及水平差异较为显著,对于实现区域产业协同发展及空间绩效最大化存在阻碍。为进一步探讨区域合作实践对推动区域产业一体化的作用程度,促进区域合作空间溢出效应,本文通过流空间网络、耦合协调度、探索性空间分析等方法量化大湾区区域合作与产业一体化的演化特征及耦合关系,并采用空间计量分析方法探讨制度性网络及产业一体化间的协调关系演进对区域经济空间分异格局形成的影响,以期为大湾区制定一体化的区域发展政策,以及探究制度性区域网络空间与产业功能性地理空间的相互作用关系提供借鉴。
1 研究区概况及研究方法
1.1 研究区概况
大湾区是由香港特别行政区、澳门特别行政区和珠三角9市(广州市、深圳市、珠海市、佛山市、惠州市、东莞市、中山市、江门市、肇庆市)组成的世界级城市群,地处21°25′~24°30′N,111°12′~115°35′E之间。大湾区陆域面积约5.6万km2,大陆和岛屿海岸线总长近3201 km。2019年,中共中央及国务院印发《粤港澳大湾区发展规划纲要》,标志着大湾区建设将作为中国高质量发展的典范,香港、澳门、广州、深圳4大中心城市将成为区域发展的核心引擎。截至2020年底,大湾区人口数量超过8600万,经济总量达11.5万亿元,作为中国工业化、城镇化最为发达的区域之一,各类生产要素在此高度集聚[36]。大湾区无论是在内部城市间的合作能力,还是在联动内陆腹地、对接世界网络的综合效能上,都位居中国城市群的前列,是具有网络关联和一体化发展特征的典型区域。
1.2 数据来源
政府官方网站会及时向社会公众播报政府间的合作成果,通过该途径爬取的城市间合作新闻具有可靠性、适时性与权威性。由于区域合作面板数据难以获取,以城市间合作新闻量化区域合作具有一定的合理性与创新性。相较于要素流、统计年鉴等其他类型大数据,新闻类数据虽存在样本代表性缺陷,但其特有的地理标签可以针对合作类型开展相关研究。具体数据名称、类型及来源如表1所示,时间序列均为2010—2019年。其中,城市间合作新闻数据主要来源于新闻媒体,共收集有效词条13593条;产业一体化采用多源数据进行量化,数据形式为时序或栅格数据,分别以城市为单位进行采集或均值提取。
表1 数据来源
Tab.1
| 名称 | 类型 | 来源 |
|---|---|---|
| 合作新闻数据 | 矢量 | ① 城市政府官方网站爬取合作新闻;② 南方新闻网( |
| 经济统计数据 | 时序 | 中国统计年鉴、广东统计年鉴、香港统计年刊、澳门统计年鉴 |
| 行政边界数据 | 矢量 | 自然资源部地图技术审查中心标准地图服务( |
| 土地利用数据 | 栅格 | 1990—2019年中国30 m年土地覆盖及其动态数据集 |
| 夜间灯光数据 | 栅格 | DMSP_OLS V4(1992—2013年)与VIIRS_VNL V2(2012—2020年)数据集 |
| PM2.5数据 | 栅格 | 圣路易斯华盛顿大学( |
1.3 研究方法
1.3.1 流空间网络分析方法
表2 流空间网络分析评价指标
Tab.2
| 指标及权重 | 获取方式 | 内涵及衡量标准 |
|---|---|---|
| 要素流强度 0.30 | Fm=I1+I2+…+In | 测算单一城市要素的规模实力,式中,Fm为城市m的要素总强度;I为城市间要素的关联量;In表示所有与城市m有关的要素流强度 |
| 点度中心度 0.23 | Ucinet软件Centrality选项 Multiple Measures工具 | 测算单一城市与其他节点的交往能力,反映空间网络各节点的联系中心性水平,其值越大说明该城市的要素活跃度就越高,联动网络的能力就越强 |
| 特征向量中心度 0.15 | Ucinet软件Centrality选项 Multiple Measures工具 | 测算O-D网络中心度的标准化程度,若某城市位于高分节点,其特征向量的中心度就越高 |
| 核心度 0.32 | Ucinet软件Core/Periphery选项Categorical/Continuous工具 | O-D网络中各节点相互联系形成一种中心紧密连接、外围逐渐稀疏的特质空间结构,核心度可测算单一城市要素的集聚水平 |
1.3.2 产业一体化发展评价方法
产业一体化包括产业布局一体化、产业要素一体化和产业发展效应一体化3个方面。因香港、澳门与珠三角9市统计口径差异,考虑到数据的可获取性,依托指标频度统计法、专家咨询法等指标选取方法构建大湾区产业一体化发展评价指标体系(表3)。其中:① 产业布局一体化是因区域产业发展目标一致而促使产业数量扩张及产业集聚所形成的空间规模变化、区域合作所形成的产业分工变化及产业功能重组所形成的结构变化[21],具体表现在产业扩展、集聚、分工、升级等方面,产业集聚度可用以表征产业扩展及集聚水平;产业分工可通过产业结构相似度进行刻画;产业升级可通过产业高级化及发展能耗进行评价。② 产业要素一体化是对区域内部生产要素流动条件的集成评价,城市间要素流动区位不平衡是导致区域产业发展模式与形态差异的主要原因,常见对人口、物品运输、资金、信息及技术等区位要素流动性的评价。市场化水平、产业结构等因素对产业一体化的影响测度向来颇受关注,但缺乏从不同城市节点的维度距离对该类问题进行描述,因此可借鉴相关研究[16]采用客货运总量、移动电话通信量等数据替代相关要素的流量数据。③ 产业发展效应一体化是区域产业发展所带来的各种溢出效应,可借助城镇化、工业化水平及生态治理等方面进行测度。对各指标进行极差标准化后采用熵权法进行加权合成,各指标权重见表3。
表3 大湾区产业一体化发展评价指标
Tab.3
| 要素层 | 指标层 | 计算方式及说明 | 单位 | 权重 |
|---|---|---|---|---|
| 布局 一体化 0.35 | 产业集聚度 | — | 0.22 | |
| 产业结构相似度 | — | 0.38 | ||
| 产业高级化 | 第三产业产值/第二产业产值 | — | 0.29 | |
| 产业能耗 | 工业总产值/工业用电量 | 万元/万kWh | 0.11 | |
| 要素 一体化 0.34 | 人口流动 | 客运总量/常住人口 | % | 0.32 |
| 物品流通 | 进出口贸易总额占GDP比重 | % | 0.30 | |
| 资金流动 | 一般公共预算支出占GDP比重 | % | 0.20 | |
| 信息流动 | 移动电话用户数/常住人口 | % | 0.18 | |
| 发展 一体化 0.31 | 经济发展效应 | 人均GDP | 元 | 0.25 |
| 城镇扩展效应 | 平均夜间灯光强度 | — | 0.23 | |
| 土地利用效率 | 建设用地地均二三产业产值 | 万元/km2 | 0.34 | |
| 工业污染效应 | 细颗粒物浓度 | μg/m3 | 0.18 |
注:除产业能耗及工业污染效应为负向指标外,其余评价指标方向均为正向。
1.3.3 耦合效应分析方法
(1) 耦合协调度模型
耦合协调水平越高,就越利于发挥系统整体功效和协同效应。基于此,在分析区域网络联系和产业一体化发展水平的基础上,构建系统耦合协调模型,具体计算方式如下:
式中:C为耦合度;Ei、Ui分别为城市i的网络联系指数和产业一体化发展指数。再引入耦合协调指数构建两系统耦合协调模型,具体计算方式如下:
式中:D为两系统的耦合协调度;T为两系统的综合协调度;α、β分别为网络联系指数和产业一体化发展指数的待定系数,为推动二者协调发展,令α=0.5、β=0.5。
(2) 空间相关性模型
全局空间自相关可衡量某种属性在一定区域内的空间总体分布情况或平均关联程度。全局莫兰指数(Moran's I)需提前假设某功能属性在研究区域内不存在地域差异,当I >0时表示该属性值的空间分布呈正相关关系,即变量在空间形态上趋于集聚;当I<0时表示该属性值的空间分布呈负相关关系,即变量在空间形态上趋于离散;当I=0时说明该属性值无空间相关性,具体计算方式如下:
式中:xi、xj分别是空间单元i、j的属性值;n为区域单元总数;ωij是一阶Rook邻接权重;
(3) 空间半变异函数
空间半变异函数又称空间变差函数,可用以测算变量空间相关与空间变异特征[39]。假设存在地理变量Y(x),令Y(xi)、Y(xi+k)分别为点xi、xi+k处的观测值,具体计算方式如下:
式中:λ(k)是地理变量Y(x)的半变异函数;N(k)是分割距离k的样本量。变程、块金系数、分维数是空间半变异函数的表征参数,可反映地理变量的空间相关性、各异向性、尺度性及周期性等特征。
(4) LISA时间路径模型
依据Rey[40]提出的时空跃迁原理,将不同时期莫兰散点图中的LISA坐标进行时空动态化处理,以反映耦合协调度在局部范围内协调演化的时空动态性特征,具体计算方式如下:
式中:Ni表示LISA时间路径长度;δi表示LISA时间路径弯曲度;θi为LISA时间路径移动方向;S为区域空间基本单元数量;T为研究时段长度;d(Li,t,Li,t+1)为城市i在时段t到t+1的移动距离;d(Li,1,Li,T)为城市i在研究时段T内的总移动距离。Ni与δi分别反映了城市i耦合协调度的局部结构动态变化显著性及空间依赖效应。θi值可量化表征城市i的耦合协调度局部空间结构的整合性,且当θi∈(0°, 90°]时城市i与其相邻城市存在正向协同增长效应,θi∈(180°, 270°]时说明城市i与其相邻城市存在负向协同增长效应;θi∈(90°, 180°]及θi∈(270°, 360°]分别表示城市i与其邻近城市存在正反向增长现象。
2 大湾区区域合作与产业一体化发展的演化特征
2.1 区域合作演化特征
2.1.1 大湾区区域合作突破地理邻近性,网络化趋势明显加强
以2010、2013、2016及2019年为观测点分析大湾区城市间合作数量及要素流强度的变化特征(图1)。整体来看,大湾区城市间合作数及要素流强度呈上升趋势。具体来看,2010年,香港、深圳的城市合作数排名较前,两地与其他城市的合作领域多聚焦于经济发展。香港积极寻求与珠三角各市的合作机会以实现产业改造升级,珠三角各市抓住与香港合作机遇以承接产业梯度转移。深圳谋划起“飞地”经济发展模式,主动向外寻求合作,强化了与周边城市的合作联系。要素流强度前两位的结对城市为深圳—香港及珠海—江门,表现出显著的地理邻近特征。城市合作数与要素流强度空间分布呈南高北低的不均衡性,此时的大湾区规划尚处于雏形阶段。2013年,港深的城市合作数稳步提升并保持核心地位,两地的要素流强度同步增强。珠海—香港、东莞—香港的要素流强度开始上升,北部城市间合作趋势明显加强,南高北低的不均衡性得以缓解,“湾区”经济的发展理念屡被提及。2016年,中国提出建设大湾区世界级城市群的发展规划,广州确立了大湾区核心门户城市的地位,城市合作数一跃占据领先位置,不仅加强了与周边城市的合作联系,并突破行政边界限制提升了与香港的联系强度;广佛开展深度合作,使得穗港、广佛的要素流强度仅次于深港。区域合作网络开始呈多核心分布,但大湾区东西两翼的惠州与肇庆联系强度却处于较低水平,城市合作数与要素流强度空间分布呈现出“中心—边缘”的分布态势。2019年,大湾区明确发展战略地位,内地与港澳建设深度合作示范区,并发布发展规划纲要。深港、莞港、广深之间的互动愈发频繁,区域合作的南北不均衡演化为中心与边缘地带的不均衡。此外,大湾区各城市的中心度与核心度演化阶段性特征明显。在中心度演化上,广州、惠州、东莞及港澳中心度处于上升趋势,体现了较好的联动性;核心度演化上,香港核心度下降明显,深圳有所下调,其余城市基本持平或略有上升,体现了多核心的发展趋向。可见,大湾区内部联动区域合作的城市不断增加,区域合作由单个城市集聚开始向多核心发展。
图1
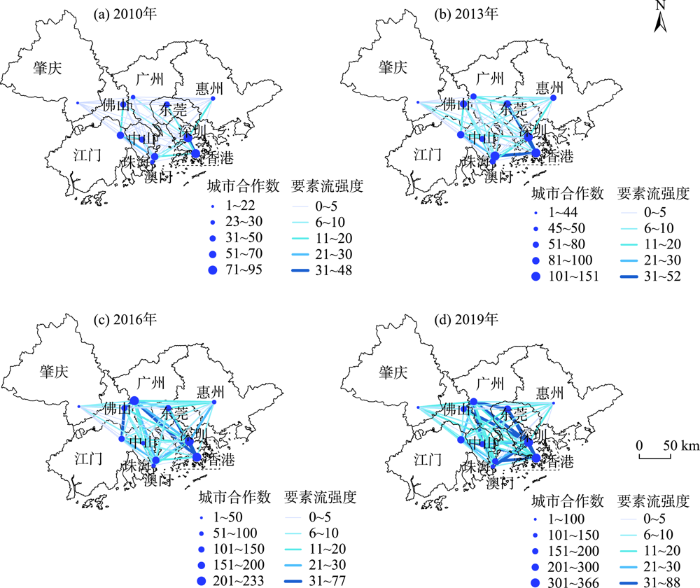
图1
大湾区城市间合作数量及要素流强度演化
注:本图基于自然资源部标准地图服务网站下载的审图号为GS(2019)4342号的标准地图绘制,底图无修改。下同。
Fig.1
Evolution of the quantity of city cooperation and factor flow intensity in the Greater Bay Area
2.1.2 大湾区城市网络联系指数整体上升,深港长期处于领先位置
从大湾区网络联系指数演化情况来看(图2),各城市网络联系指数均处于上升态势,说明区域合作意愿整体上涨,但上升幅度有所不同。具体来看,2010年,深圳、香港网络联系指数最为活跃,两地具备较强的科研创新能力,在大湾区构建雏形期就展现出较强的合作意愿;澳门因多元文化共存的背景及推崇休闲旅游发展的特殊性,与其他城市合作联系相对较少,网络联系指数偏低。随着区域合作水平提升,大湾区社会网络结构趋于复杂,值得关注的是广州网络联系指数于2016年实现突破,最终排名仅次于深圳与香港两地,这与广州加速区域建设,在社会、经济方面探索泛珠三角区域合作密不可分。2019年,深圳、香港、广州三地确立了网络联系指数的领先位置,这与三地作为大湾区核心城市的地位是相符的;澳门、惠州、肇庆的网络联系指数整体偏低,澳门区域合作频次有所增加,但其中心度及核心度表现一般,因此可加强澳门与其他城市的区域合作,充分发挥澳门的人才、资金及产业优势。惠州、肇庆两地由于处于边缘地区,网络联系指数整体偏低,作为连接大湾区与西南、东部沿海地区的门户城市,惠州、肇庆应基于其枢纽区位优势寻求区域合作新途径。综上,在区域合作上,深港、珠澳、广佛展现出较强的联动性,与大湾区规划纲要对城市合作的要求相一致。但港澳与珠三角9市应在深圳前海、广州南沙与珠海横琴3个合作示范区的基础上展开多领域各层次的合作,以推动大湾区形成合理分工、功能互补的发展格局。
图2
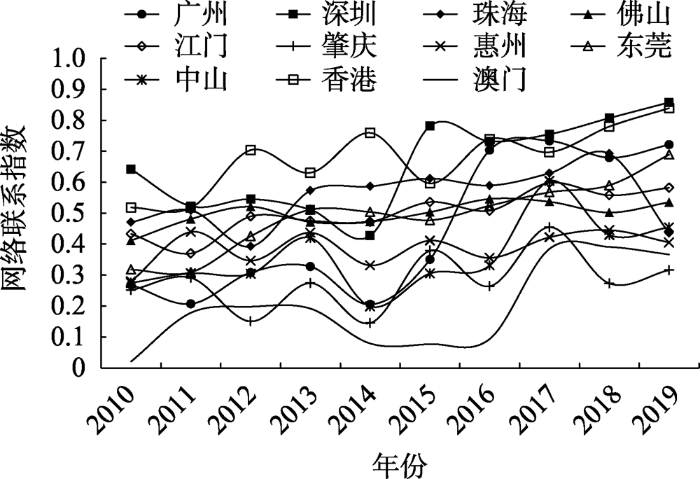
图2
2010—2019年大湾区城市网络联系指数演化
Fig.2
Evolution of city network connectivity index in the study area during 2010-2019
2.2 产业一体化发展演化特征
2.2.1 大湾区城市产业布局、要素一体化极化效应显著
根据表4可知,广州、深圳及港澳形成明显的产业集聚中心,这与四地产业极化发展的核心地位是一致的,具体来看,广州作为大湾区核心门户,具有先进装备制造、生物医药发展优势;深圳作为区域创新龙头,正转型成为科研转化基地与制造中心。此外,广深的产业布局一体化呈显著的上升趋势,两地的产业布局一体化指数最终保持在0.6左右。近年来,广东省连出多条产业发展优惠及人才吸引政策,广深借助劳动力、交通、产能的比较优势,促进产业结构升级改造。反观港澳地区,其产业布局亟需升级改造,这促使香港发挥其低税、科研及商务优势,与内地自贸区形成差异化竞争。澳门通过横琴岛强化与内陆的联系,并拓展中葡商贸合作。港澳产业布局趋向契合珠三角9市承接港澳产业梯度转移的发展意向,其他城市产业布局一体化虽整体上升,但具有一定的波动性。大湾区产业布局呈现珠江两岸“东强西弱”不均衡、西岸制造业同质化的特征。区别发展产业布局,实现产业错位发展与转型升级成为提升大湾区产业高质量发展的关键。
表4 大湾区城市产业一体化发展评价结果
Tab.4
| 城市 | 2010年 | 2013年 | 2016年 | 2019年 | |||||||||||
|---|---|---|---|---|---|---|---|---|---|---|---|---|---|---|---|
| 布局 | 要素 | 效应 | 布局 | 要素 | 效应 | 布局 | 要素 | 效应 | 布局 | 要素 | 效应 | ||||
| 广州 | 0.5076 | 0.2913 | 0.0872 | 0.5522 | 0.3535 | 0.1392 | 0.6210 | 0.2948 | 0.1980 | 0.6437 | 0.3555 | 0.2256 | |||
| 深圳 | 0.4427 | 0.2422 | 0.1648 | 0.5080 | 0.1833 | 0.2565 | 0.5837 | 0.2564 | 0.3286 | 0.5902 | 0.2167 | 0.3602 | |||
| 珠海 | 0.1640 | 0.3863 | 0.0615 | 0.2059 | 0.3500 | 0.1312 | 0.2351 | 0.3013 | 0.2147 | 0.2200 | 0.2796 | 0.2276 | |||
| 佛山 | 0.2722 | 0.1352 | 0.0700 | 0.2672 | 0.1735 | 0.0959 | 0.2781 | 0.1272 | 0.1839 | 0.2682 | 0.1137 | 0.1801 | |||
| 江门 | 0.0892 | 0.0714 | 0.0273 | 0.0985 | 0.1098 | 0.0617 | 0.1082 | 0.1523 | 0.1295 | 0.1066 | 0.1564 | 0.1287 | |||
| 肇庆 | 0.0936 | 0.0886 | 0.0519 | 0.0783 | 0.1049 | 0.0516 | 0.0715 | 0.0993 | 0.1235 | 0.0733 | 0.1419 | 0.1268 | |||
| 惠州 | 0.0925 | 0.0928 | 0.0822 | 0.1062 | 0.1370 | 0.1400 | 0.1225 | 0.2085 | 0.1823 | 0.1330 | 0.1977 | 0.2050 | |||
| 东莞 | 0.2896 | 0.1393 | 0.0946 | 0.2912 | 0.1631 | 0.1484 | 0.3085 | 0.1053 | 0.2098 | 0.3158 | 0.1216 | 0.2304 | |||
| 中山 | 0.1807 | 0.2465 | 0.0660 | 0.1892 | 0.2451 | 0.1218 | 0.1965 | 0.2573 | 0.1896 | 0.1881 | 0.2620 | 0.1970 | |||
| 香港 | 0.6176 | 0.7552 | 0.3161 | 0.5661 | 0.8083 | 0.4236 | 0.5220 | 0.7544 | 0.5105 | 0.5176 | 0.7792 | 0.5552 | |||
| 澳门 | 0.3493 | 0.2393 | 0.4258 | 0.4305 | 0.2182 | 0.7941 | 0.2263 | 0.3474 | 0.8132 | 0.3307 | 0.3604 | 0.9073 | |||
要素一体化的极化效应在香港十分突出,各阶段的要素一体化指数均超过0.75,这与香港作为全球第三大金融中心、国际化大都市的身份相契合。其他城市要素一体化发展较为完善的诸如广州、深圳、珠海、中山及澳门,借助人口、交通、资金、信息及技术流动的区位优势,为加快生产要素流动提供便利,从而促进区域经济增长及生产效率提升。而其他城市要素流动性的比较优势不突出。从产业布局、要素一体化的整体分布来看,若珠江东岸的生产要素资源能与西岸的装备制造业、海洋产业、生物医药等产业相结合,将提升大湾区整体产业发展优势。综上,大湾区业已具备完善的产业体系、较强的经济互补性及集群优势,因此需强化区域合作,不断调整产业结构,以构建具有国际竞争力的现代产业体系。
2.2.2 大湾区产业发展内部差异悬殊
产业发展效应一体化是经济、产业集聚推动工业化、城镇化发展的主要结果。整体来看,港澳的产业发展效应达到较高水平,特别是现代服务业占据龙头地位的澳门产业发展效应指数最终超过0.9;珠三角各市产业发展效应指数持续增长,深圳、东莞、广州表现较为突出,而江门、肇庆的城镇化水平相对滞后。从产业发展一体化指数来看,各地产业发展一体化水平均处于上升态势,其中,港澳处于第一梯队,广深紧随其后,而其他城市产业一体化发展水平整体偏低(图3)。此外,夜间灯光指数可反映区域城镇化发展(图4a~4c),各市建设用地扩展且呈外延扩张与集群发展态势,广佛中心城区已实现连片发展,深圳、东莞及港澳地区城镇化呈极化效应,但珠三角其他城市产业发展要素条件相对不足,缺乏必要的产业承接条件。从PM2.5指数空间分布可以看出(图4d~4f),分布在珠江西岸的传统制造产业使得PM2.5高值在此集聚,PM2.5值虽整体处于下降态势,但珠江东、西两岸空气质量差异仍较为突出。大湾区各市有较强的产业改造、提升、转型动力,因而具备上升空间。
图3
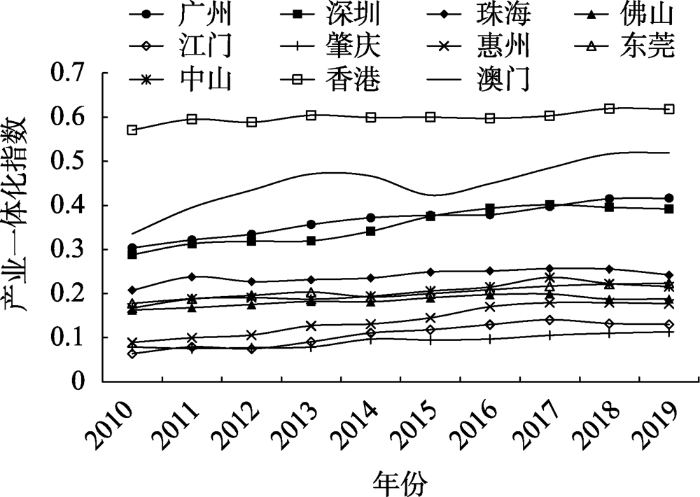
图3
2010—2019年大湾区产业一体化发展指数演化
Fig.3
Evolution of industrial integrated development in the study area during 2010-2019
图4
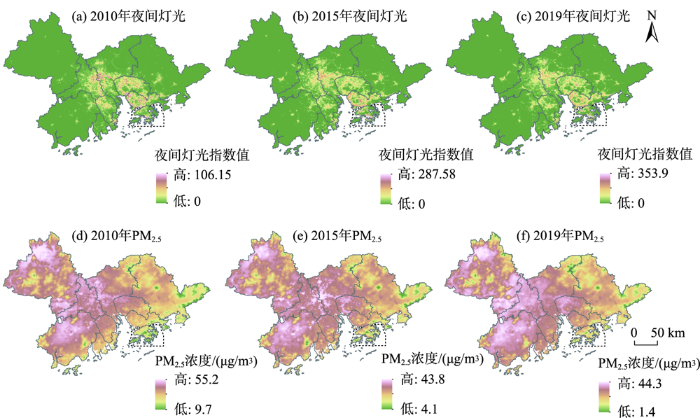
图4
大湾区夜间灯光及PM2.5指数分布演化
Fig.4
Evolution of nightlight and PM2.5 index in the Greater Bay Area
3 大湾区区域合作与产业一体化发展的耦合关系
3.1 耦合协调关系演进的时空特征
根据式(1)、(2)计算得到区域合作与产业一体化的耦合协调度,将耦合协调度分为失调[0, 0.2)、低度协调[0.2, 0.4)、一般协调[0.4, 0.6)、中度协调[0.6, 0.8)及高度协调[0.8, 1]5个类型,结果如图5所示。整体来看,耦合协调度未出现失调现象,其高值主要集中在深圳、香港两地。2010年,大湾区区域尺度的耦合协调度为0.49,处于一般协调,深圳、香港为中度协调,广州、东莞等地为一般协调,肇庆及惠州为低度协调。2013年,区域尺度的耦合协调度上升至0.56,珠海与惠州两市协调度类型发生变化,只有肇庆处于一般协调阶段。2016年,区域尺度的耦合协调度达到0.58,香港、广州及肇庆实现突破。2019年,区域尺度的耦合协调度为0.62,东莞、澳门迈入中度协调阶段,而大湾区西部城市及东部的惠州市低于区域均值。耦合协调度同样表现为珠江两岸“东强西弱”的空间分布特征。
图5
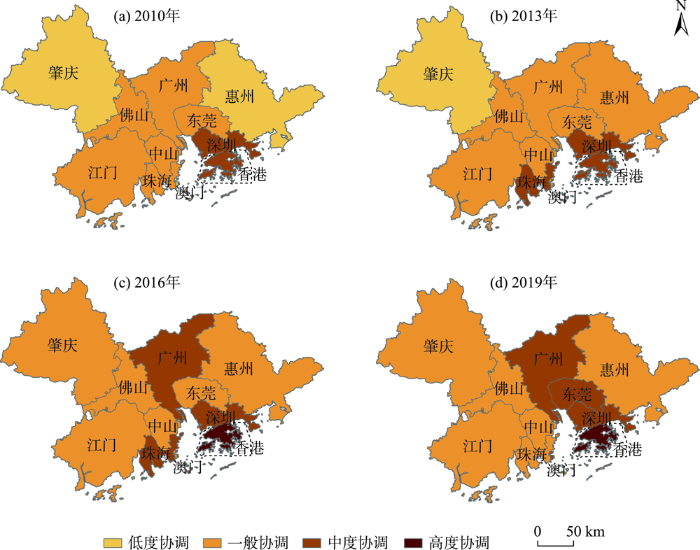
图5
大湾区区域合作与产业一体化耦合协调演化
Fig.5
Evolution of coupling coordination index of regional cooperation and industrial integrated development in the Greater Bay Area
3.2 耦合协调关系演进的时空格局
3.2.1 耦合协调度大体呈空间集聚特征
根据式(3),大湾区网络联系指数与产业一体化耦合协调度的全局Moran's I指数结果显示(表5),除2010年为负值外,其余年份均为正值。从2011年的0.091波动上升至2019年的0.280,表明耦合协调度空间演化特征大体呈集聚演化趋向。采用Z值检验法进行检验,结果可拒绝研究对象在空间上随机分布的原假设。
表5 大湾区网络联系指数与产业一体化耦合协调度的全局Moran's I指数
Tab.5
| 指标 | 2010年 | 2011年 | 2012年 | 2013年 | 2014年 | 2015年 | 2016年 | 2017年 | 2018年 | 2019年 |
|---|---|---|---|---|---|---|---|---|---|---|
| Moran's I | -0.601 | 0.091 | 0.202 | 0.18 | 0.19 | 0.083 | 0.19 | 0.127 | 0.205 | 0.28 |
| Z值 | -2.097 | 0.8 | 1.259 | 1.17 | 1.211 | 0.765 | 1.211 | 0.95 | 1.276 | 1.589 |
| P值 | 0.018 | 0.212 | 0.104 | 0.121 | 0.113 | 0.222 | 0.113 | 0.171 | 0.101 | 0.056 |
3.2.2 耦合协调度空间分布的异质性
根据式(4),以各城市的耦合协调度作为Z变量,经、纬度分别为X、Y变量,进行耦合协调度变差函数分析。从耦合协调度空间变差函数拟合参数可知(表6),不同时期活动滞后距离及其间隔固定的情况下变程值不发生改变,耦合协调度结构化空间分异所引起城市间的空间关联作用强度也维持在一定水平以下。块金系数变化水平呈现周期性波动上升的变化趋向,可知大湾区耦合协调度的空间相关性变化处于增强状态。变差函数的最佳拟合模型均为高斯模型,不同时期耦合协调度空间分布结构特征相似,且空间分布具有一定的连续性。
表6 大湾区网络联系指数与产业一体化空间变差函数拟合参数统计
Tab.6
| 年份 | 变程/km | 块金方差 | 基台方差 | 块金系数 | 最佳拟合模型 | 决定系数 |
|---|---|---|---|---|---|---|
| 2010 | 6.944 | 0.011 | 0.099 | 0.888 | Gaussian | 0.735 |
| 2013 | 6.944 | 0.001 | 0.185 | 0.995 | Gaussian | 0.869 |
| 2016 | 6.944 | 0.007 | 0.178 | 0.960 | Gaussian | 0.859 |
| 2019 | 6.944 | 0.005 | 0.190 | 0.973 | Gaussian | 0.937 |
从耦合协调度空间变差分维数可知(表7),全方位上的分维度变化呈周期性波动态势。2010—2013年出现较大幅度下降,年均降幅达到5.74%;2013—2016年及2016—2019年变化趋向分别转变为增长、降低态势,年均增降幅依次为3.56%、1.97%。2010—2019年间整体波动变化态势趋缓,但数值普遍偏高,说明大湾区耦合协调度在全方向上的空间均质性较高。各方向上的空间差异变化态势与全方位对比存在较显著的局部差异,其中东北—西南向的变化较为明显,2010—2019年间分维度数值持续增大,说明耦合协调度在东北—西南向空间差异不断减少。从各相邻年份分维度数值变化程度上看,东南—西北向的耦合协调度空间分异格局变化最为缓慢,年均变化幅度为2.54%,其次为东—西和南—北向,空间格局变化程度最大的为东北—西南方向,年均变化程度达到6.38%。从同向分维度对比上看,东—西方向的耦合协调度空间格局均质性分布程度最高,年均分维度为1.757,其次为南—北与东北—西南向,空间均质分布度最低的为东南—西北向,年均分维度为1.273。
表7 大湾区网络联系指数与产业一体化耦合协调度空间变差分维度统计
Tab.7
| 年份 | 全方位 | 东—西 | 东北—西南 | 南—北 | 东南—西北 | |||||||||
|---|---|---|---|---|---|---|---|---|---|---|---|---|---|---|
| 分维度 | 决定系数 | 分维度 | 决定系数 | 分维度 | 决定系数 | 分维度 | 决定系数 | 分维度 | 决定系数 | |||||
| 2010 | 1.778 | 0.698 | 1.765 | 0.307 | 1.032 | 0.601 | 1.874 | 0.007 | 1.380 | 0.848 | ||||
| 2013 | 1.470 | 0.880 | 1.607 | 0.931 | 1.566 | 0.663 | 1.654 | 0.288 | 1.341 | 0.585 | ||||
| 2016 | 1.627 | 0.806 | 1.947 | 0.450 | 1.632 | 0.372 | 1.752 | 0.433 | 1.291 | 0.746 | ||||
| 2019 | 1.531 | 0.937 | 1.707 | 0.984 | 1.656 | 0.725 | 1.424 | 0.267 | 1.080 | 0.920 | ||||
结合空间变差拟合结果进行克里金空间插值,从3D拟合结果可知(图6),大湾区耦合协调度的空间布局结构具有明显局部稳定性特点,整体分布格局近似呈现“东南独高、中北趋凸、周边低凹”的特征,分布于东南的香港及深圳构成耦合协调度高值核心区,并对周边城市产生辐射影响力,带动东南—中北沿线城市耦合水平的显著提升。2016—2019年间在中北部发展形成以广州为中心的次高值核心区,大致以连接上述2个高值核心区的中心城市香港、广州形成的轴线为界,在其两侧分化为2个相对独立的低值区域,并在江门、佛山、肇庆及惠州等地形成耦合协调度低值区。2019年大湾区耦合协调度空间格局发展差异化显著,高低值之差也由2010年的0.45扩大至2019年的0.64。随着耦合协调度发展空间不平衡性进一步凸显,在空间上突出体现在香港—广州及其邻近局部地区等高值地带的耦合协调度增幅明显快于东北、西南局部边缘城市,两者局部增幅之差最大处可达4.82%,具有空间差异化的竞争关系在一定程度上印证了粤港澳大湾区一体化规划范围的科学性。综上,构建极点带动、轴带支撑、辐射周边的发展格局,重点是要发挥香港、深圳、广州等极点的引领带动作用,从而构建区域经济发展轴带,借助区域合作与产业一体化的空间耦合关系辐射大湾区,形成结构科学、集约高效的发展格局。
图6
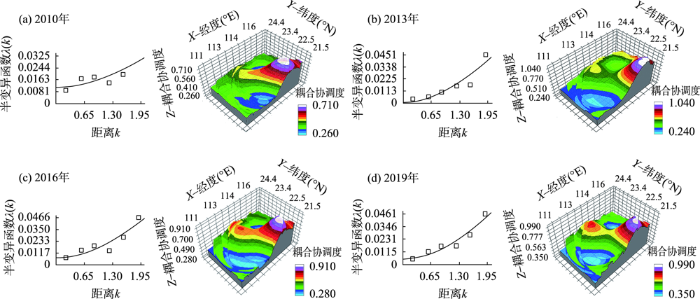
图6
大湾区网络联系指数与产业一体化耦合协调度Kriging插值3D拟合图
Fig.6
3D fitting for Kriging interpolation of the coupling coordination index of network connectivity and industrial integrated development in the Greater Bay Area
3.2.3 LISA时间路径几何属性特征
根据式(5),运用自然断裂法将耦合协调度LISA时间路径相对长度和弯曲度进行分级,并根据四象限法对移动方向类型进行分。根据LISA时间路径的几何特征可知(图7),相对长度较长的城市集中分布于大湾区西部边缘,具有西南及西北方向移动相对距离较长的分布特点,且LISA时间路径长度均大于0.8,这说明澳门、珠海等西南沿海高度耦合协调城市及肇庆等西北部低耦合协调城市具有较显著的空间结构演化动态性及产业要素发展可塑性;东南方向LISA时间路径移动长度较短,大多城市的相对长度小于0.5,其中深圳0.113、香港0.119、东莞0.182,移动距离偏低,说明产业要素结构调整潜力空间趋于饱和状态。弯曲度相对较大的城市集中分布于中西部,而弯曲度最大的3个城市依次为广州5.982、澳门5.838及江门4.532,说明城市单元耦合协调度增长波动性与耦合协调度存量水平呈正相关性。耦合协调度LISA时间路径的迁移方向类型为协同增长的城市共有7个,多数集中于大湾区西部,其中6个城市与相邻城市的跃迁方式以负向协同增长为主,说明大湾区西部及东南沿海城市的耦合协调度空间增长过程具有较显著的负向整合性。
图7
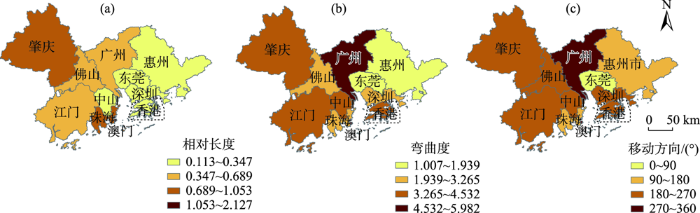
图7
大湾区网络联系指数与产业一体化耦合协调度LISA时间路径几何特征
Fig.7
LISA path geometry of the coupling coordination index of network connectivity and industrial integrated development in the Greater Bay Area
3.2.4 LISA时空跃迁特征
采用Markov转移概率矩阵与时空跃迁模型量化描述耦合协调度局部Moran's I指数散点图的空间动态演化过程(表8)。从耦合协调度局部Moran's I转移概率矩阵来看,耦合协调度局部结构变化整体较为稳定,相邻城市协同关系的跨类别间转移较少。除自身与邻域城市单元均未发生跃迁 (H-Ht→H-Ht+1、L-Lt→L-Lt+1、H-Lt→H-Lt+1、L-Ht→L-Ht+1)及跃迁方向相反的类型(L-Ht→H-Lt+1、H-Lt→L-Ht+1)外,转移概率最大及最小的类型分别为自身不变、邻域发生跃迁(L-Lt→L-Ht+1)的类型(0.19)与自身发生跃迁(L-Ht→H-Ht+1)的类型(0.043)。从各城市LISA路径移动方向来看(图8),超过半数城市发生了不同象限间的跃迁,说明区域耦合协调度空间演化转移路径存在一定的变换性。在耦合协调度局部空间增长方向协同分布特征上,广州、澳门、珠海及惠州与相邻城市间呈现为非协同增长,其他城市与相邻城市间的相关关系以协同增长为主,说明大湾区耦合协调度空间演化具有空间依赖性。
表8 大湾区网络联系指数与产业一体化耦合协调度局部Moran's I转移概率矩阵
Tab.8
| 类型 | H-Ht+1 | H-Lt+1 | L-Lt+1 | L-Ht+1 |
|---|---|---|---|---|
| H-Ht | 0.905 | 0.095 | 0 | 0 |
| H-Lt | 0.118 | 0.647 | 0.176 | 0.059 |
| L-Lt | 0 | 0.238 | 0.571 | 0.19 |
| L-Ht | 0.043 | 0.174 | 0.174 | 0.609 |
注:H-H、L-L、H-L、L-H分别为高—高、低—低、高—低、低—高关联集聚区;t为初始年份,即2010年;t+1为终止年份,即2019年。
图8
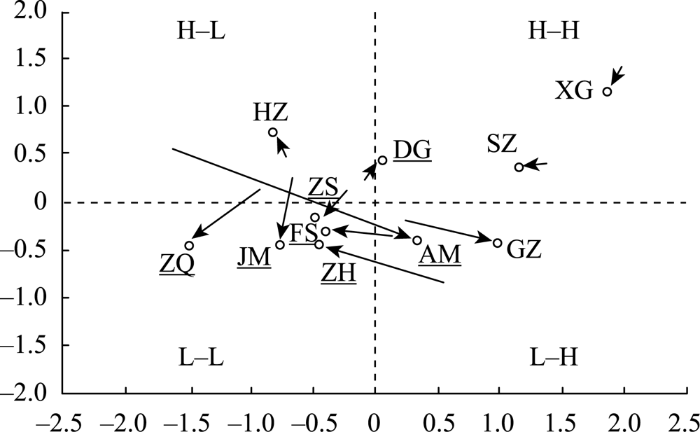
图8
大湾区网络联系指数与产业一体化耦合协调度LISA时间路径移动象限
注:DG代表东莞,SZ代表深圳,XG代表香港,HZ代表惠州,ZS代表中山,FS代表佛山,ZH代表珠海,JM代表江门,ZQ代表肇庆,AM代表澳门,GZ代表广州;带下划线城市表示发生时空跃迁。
Fig.8
LISA path quadrant of the coupling coordination index of network connectivity and industrial integrated development in the Greater Bay Area
4 结论与讨论
本文借助流空间网络、耦合分析、探索性空间分析等方法量化2010—2019年大湾区区域合作与产业一体化的演化情况及耦合关系,主要结论有:① 大湾区区域合作突破地理邻近性,网络化趋势明显加强,城市合作数与要素流强度的“中心—边缘”分布趋势进一步加强,区域合作的南北不均衡演化为边缘地带不均衡。城市网络联系指数整体上升,深港两地长期处于领先位置。② 大湾区城市产业布局、要素一体化极化效应显著,广州、深圳及港澳形成明显的产业集聚中心,且广深的产业布局一体化呈显著的上升趋势。③ 大湾区区域合作与产业一体化的耦合协调度整体上升,其空间演化呈集聚趋向,其空间布局结构具有局部稳定性的特点,整体分布格局呈“东南独高、中北趋凸、周边低凹”的特征,香港—广州及其邻近局部地区等高值地带的耦合协调度增幅明显快于东北、西南局部边缘城市。④ 大湾区西部及东南沿海城市的耦合协调度空间增长过程具有较显著的负向整合性;在耦合协调度局部空间增长方向协同分布特征上,广州、澳门、珠海及惠州与相邻城市间呈现为非协同增长,其他城市与相邻城市以协同增长为主。上述结论印证了大湾区构建集约高效发展格局的科学性。
本文基于耦合理论模式,对区域合作网络与产业一体化2个子系统的耦合关系进行量化,发现不同子系统内部的涌现性及其自组织特征带动两者耦合度逐渐增强,同时进一步阐释了系统耦合对区域产业一体化及空间绩效水平提升的促进作用。为提升大湾区未来整体区域竞争力与产业格局的进一步优化,本文得出几点政策启示。① 大湾区需要继续加强多元化的区域合作,发挥好广州—佛山、深圳—香港、澳门—珠海区域合作的领头作用。强化惠州、肇庆与其他城市的合作意向,促进珠江东西两岸协同发展,完善极点带动、轴带支撑的网络结构。此外,大湾区需打造高质量的区域合作平台,建设科技创新合作区,如佛山南海推动高端服务业合作、莞港合作建设东莞滨海湾新区等。② 与科技、资源、教育等领域相比,大湾区生态环境领域合作相对滞后,有必要加强山地、海洋及珠江流域的跨界生态合作,加强大湾区生态文明建设,提升人居环境宜居性。③ 促进香港、澳门、广州、东莞、深圳等地产业一体化发展的溢出效应,着力提高江门、肇庆两地的产业发展水平,而工业化、城镇化水平相对较低的地市需完善产业承接条件,加快融入大湾区一体化发展。④ 关注大湾区“边缘”地市区域合作与产业一体化的融合发展,如肇庆、江门、惠州三地利用自身区位优势(如肇庆、惠州的生态环境优势、联结大湾区东西两翼的交通优势等;江门的海岛、海洋开发优势)对接大湾区整体合作网络与产业一体化发展;珠三角9市产业发展应积极寻求转型升级,拓宽与港澳的交流、合作类型,促进港澳服务业进入内地,带动内地服务业发展。⑤ 加快区域基础设施互联互通,加强信息基础建设,构建现代化的综合交通运输体系,如港珠澳大桥的贯通将助力区域综合竞争力的提升。整体而言,在大湾区区域合作与产业一体化的耦合协调度格局由局部不平衡向均衡发展的转型过渡期间,在充分利用政策扶持、要素集聚、区域分工与市场竞争等区域优势资源条件的同时,建议在现有的沿海中心—内陆腹地型空间结构的基础上,利用特色产业要素辐射影响力带动核心区周邻地市的产业合作,从而提升区域合作与产业一体化的耦合协调水平[41-42]。
参考文献
集聚效应是否推动了区域高质量发展: 以长三角城市群为例
[J].
Does the agglomeration effect promote regional high-quality development? A case study of the Yangtze River delta urban agglomeration
城市群协调发展: 内涵、概念模型与实现路径
[J].
Coordinated development of urban agglomerations: Connotation, conceptual model and realization paths
中国都市区和大城市群的界定: 兼论大城市群在区域经济发展中的作用
[J].
Definition of Chinese metropolitan areas and large urban agglomerations: Role of large urban agglomerations in regional development
DOI:10.13249/j.cnki.sgs.2011.03.257
[本文引用: 1]

The large urban agglomerations are the main form of spatial organization of urbanization, and they have become the powerful engine of national economic development. Since reform and opening-up, China has re-integrated into the world economic system, and both industrialization and urbanization have accelerated the enlargement of scale of large urban agglomerations and upgraded their function level. This paper firstly defines the concept of Chinese metropolitan areas based on the data attained from the fifth national census, and distinguishes the three types of Chinese metropolitan areas. In 2000, China had a total of 117 metropolitan areas, of which twenty-six areas had a population of 2 million or more. Then, the paper defines the concept of large urban agglomerations in China, and summarizes the basic features of 13 large urban agglomerations. This paper uses the metropolitan area as the basic unit to define the concept of large urban agglomerations in China, then analyzes their spatial distribution and roles in regional development. And the author thinks that Chinese large urban agglomerations play important roles as the centre of gravity of the national economy and the growth engines in regional development.
中国城市群空间规划的历史演化与空间逻辑: 基于新国家空间视角
[J].
Historical evolution and spatial logic of spatial planning of urban agglomerations in China: From the perspectives of new state space
基于大数据的流空间研究进展
[J].
DOI:10.18306/dlkxjz.2020.08.013
[本文引用: 1]
流空间是认识城市网络结构和演化的重要手段。近年来大数据的快速发展为流空间研究提供了新的机遇和挑战。论文系统综述了基于大数据的流空间研究进展。首先,论文梳理了基于大数据流空间研究的背景和历史,然后总结了基于大数据的流空间研究的主题、数据类型、方法和主要发现,最后展望了未来的研究挑战。2011年以后,基于大数据的流空间研究呈指数增长趋势,中英文论文年均发表量从2010年的11篇增长到2018年的106篇。大数据主要从提供新的数据源、激发新的分析方法和提供新的研究视角三方面推进了流空间研究。常用于流空间研究的大数据主要包括手机信令数据、社交媒体签到数据、公共交通刷卡数据和出租车轨迹数据,它们比传统统计数据更能直接提供人流、物流和信息流的时空动态信息。研究方法也从传统的基于距离的重力模型发展为网络分析方法。未来在交叉学科研究、大数据和传统数据的耦合、大数据与深度学习和云计算等新方法的结合方面仍需进一步探索,从理论、数据和方法上全面深化流空间研究。
Research progress on the space of flow using big data
DOI:10.18306/dlkxjz.2020.08.013
[本文引用: 1]
The studies on the space of flow play an important role in understanding the structure and change of urban networks. The rapid development of big data provides new opportunities and challenges for the studies on the space of flow in recent years. This article systematically reviewed the research progress on the space of flow based on big data. First, we retrospect the background and history of the studies on the space of flow, then summarized the themes, the types of big data, the methods used for the studies and the major findings, as well as discussed the research challenges. We found an exponential growth of studies on the space of flow using big data after 2011. The annual number of published papers increased from 11 to 106 during 2011-2018. Big data deepen the research on the space of flow by providing new data sources, inspiring new analytical methods, and new research perspectives. Four types of big data—mobile phone, social media, smart card, and taxi trajectory data are commonly used in the studies on the space of flow, which can provide information on spatiotemporal flows (such as population flow, material flow, and information flow) directly. Research methods have also evolved from distance-based gravity models to network analysis. In the future, the research on the space of flow using big data can be further improved by validating the effectiveness and representativeness of the big data, the integration of big data and traditional data, and the information mining from big data using new methods such as deep learning and cloud computing.
信息时代区域空间结构构成要素分析
[J].
New component factors of regional spatial structure in information era
基于信息流的武汉城市圈城乡文化空间结构研究
[J].
Study on spatial structure of urban-rural cultures in Wuhan City circle based on the flow of information
流空间基本性质的地理学透视
[J].
A geographical perspective to the elementary nature of space of flows
高速铁路对城市网络结构的影响研究: 基于铁路客运班列分析
[J].
DOI:10.11821/dlxb201602007
[本文引用: 1]
城市网络是近年来城市与区域研究的一个新方向.基于2003-2013年间8个横截面的中国铁路客运班列数据,采用加权度中心性和社区结构模型,探讨高速铁路建设对城市等级和集聚性空间格局及演化的影响.研究表明:① 基于铁路客运组织的城市等级结构呈现出位序--规模分布的特征和集聚性,且三大地带和各社区内城市也呈现出明显的位序--规模分布,随着高速铁路网络的扩展,加权度中心性的集聚性更明显,并逐步呈现出较为明显的层级结构和社区结构.② 城市等级结构呈现出明显的东中西地带性,廊道效应和经济,人口的耦合性,即基于铁路客运班列的城市等级结构与基于属性数据(人口/GDP)的结果表现出较大的相似性,但也存在一定的差异.城市社区结构与中国高速铁路网络,城市群的空间分布格局基本一致.随着高速铁路的建设,东中西三大地带间城市等级的差异呈扩大态势,但各社区间城市等级的差异呈缩小态势,部分社区核心城市已形成.
Impact of high-speed rail on inter-city network based on the passenger train network in China, 2003-2013
DOI:10.11821/dlxb201602007
[本文引用: 1]
The evolution of inter-city network influenced by globalization and information technology has become a hot topic in city and urban research. This study tries to explore the evolution of nodal hierarchy and communities in inter-city network based on passenger train network during the rapid development period of High-speed Railway (HSR) in China since 2003. Results indicate that: (1) the evolved HSR network in China enlarged the disparities of weighted degree centrality between regions, but decreased the disparities of that between communities, and led to an increasing concentrated city hierarchy with fewer cities having high centrality value, and a growing similarity between the city hierarchies measured by the passenger train network and by city attributes (such as population and GDP); (2) the city hierarchy measured by passenger train network followed a rank-size distribution in the national and regional levels, as well as in some communities. (3) Spatially, cities with higher hierarchy in passenger train network and larger improvement in weighted centrality indicator were mostly located in the eastern region or the areas with the distance to the nearest HSR stations below 50 km, developed economy and high population density; the cities in 2013 could be divided into 14 communities, including the communities with cities mainly located along Beijing-Shanghai, Beijing-Wuhan and Wuhan-Chengdu, Wuhan-Guangzhou, Beijing-Jiujiang, Hangzhou-Xiamen, Lanzhou-Urumqi trunk rail lines, and located in Northeast China, Shanxi Province, Inner Mongolia. (4) The evolution of communities was mostly influenced by the natural environment and administrative areas, especially by the development of HSR network.
粤港澳大湾区及周边城市经济空间联系与空间结构: 基于改进引力模型与社会网络分析的实证
[J].
Economic spatial connection and spatial structure of Guangdong-Hong Kong-Macao Greater Bay and the surrounding area cities: An empirical analysis based on improved gravity model and social network analysis
基于腾讯迁徙大数据的中国城市网络研究
[J].
DOI:10.11821/dlxb202104006
[本文引用: 1]
随着经济全球化和区域一体化的快速发展,城市间的交流日益密切,要素的流动性和互赖性促进了城市网络的形成,并成为一种新的区域组织模式和空间结构。本文基于2018年腾讯人口迁徙数据,构建了372×372关系数据矩阵,并从不同交通方式出发,系统刻画了中国城市网络格局。研究表明:① 网络关联度高的城市主要集中在胡焕庸线以东区域,尤其是长三角、珠三角、京津冀、成渝等城市群地区的聚集程度最高,成为中国城市网络格局的主控力量;而西北半壁的城市处于被支配地位。② 依据迁徙量,将中国城市网络划分为国家级、大区级、区域级、地方级和基座级网络。城市网络结构随交通方式而变化,当网络等级下移时,节点城市趋于增多,网络密度加大,但网络范围趋于缩小,网络等级与迁徙路径存在着密切的关联性,国家级网络与空运相关,区域级网络与铁路运输相呼应,地方级网络与汽车运输相关。③ 不同运输方式的经济时空距离决定了网络结构,是引致网络随路径不同而产生分异的基本因素。
China's city network based on Tencent's migration big data
DOI:10.11821/dlxb202104006
[本文引用: 1]
With the rapid development of economic globalization and regional integration, the connection between cities is increasingly close. The mobility and interdependence of elements have promoted the formation of city network and become a new regional organization model and spatial structure. Based on Tencent's migration data, this paper constructs a 372×372 relational data matrix, and systematically depicts the city network pattern in China from different modes of transportation. The results show that cities with high network correlation degree are mainly concentrated in the area east of the Hu Huanyong Line, especially in the Yangtze River Delta, Pearl River Delta, Beijing-Tianjin-Hebei region, Chengdu-Chongqing region and other urban agglomeration areas, which have the highest concentration and become the main control power of China's city network pattern; and the cities in the northwest half are at a disadvantage status. According to the amount of migration, the Chinese city network is divided into national, large regional, regional, local and pedestal networks. The city network structure changes with the mode of transportation. When the network level moves down, the number of node cities tends to increase and the network density increases, but the network range tends to shrink. There is a close correlation between the network level and the migration path. National-level network related to air transportation, regional network related to railway transportation, and local network are relevant to automobile transportation. The economic space-time distance of different transportation modes determines the network structure, which is the basic factor that causes the network to differentiate with different paths.
“互联网+”背景下浙江省城际货运时空网络演化及驱动机制
[J].
Spatio-temporal evolution and formation mechanisms of intercity freight network in Zhejiang Province under the background of "internet plus"
“城市区域”主义下的中国区域治理模式重构: 珠三角城际铁路的实证
[J].
DOI:10.11821/dlyj020190207
[本文引用: 1]
中国的区域治理模式长期以来呈现出阶段性演化的特征。特别是近些年,传统省-市分层设权的权力组织关系被动态的、反复连续性的博弈所取代。本研究借助政治经济学与人文地理学关于“国家空间再中心化”及组织社会学者的“行政发包制”理论,立足区域基础设施项目,即“珠三角城际铁路网”展开实证,系统分析其规划、建设及运营过程。并聚焦其中的事权与财权动态演变过程,解析省政府的角色定位和省市关系的演变等两大关键问题,揭示中国城市区域治理重构的内在逻辑。研究发现:一方面,省政府的角色定位由“分包商”和“协调者”逐渐转变为协调与发展并重的新角色定位;同时,省市关系由结构化的“行政发包”转化为多轮协商的动态博弈连续体。
The restructuring of regional governance under the city regionalism of China: A case study of the Pearl River Delta intercity railway
DOI:10.11821/dlyj020190207
[本文引用: 1]
Regional governance in China has shown the periodic feature, notably under the city regionalism in recent years. Examining the formation of regional governance in China is conducive to probing the China’s city-regionalization as well as the features of institutional architecture oriented integrated development. The dynamic and continuing game process in terms of power configuration has replaced the traditional multi-level governmental system. Based upon a case study of Pearl River Delta intercity railway, this article examines the dynamic evolution of power and financial right relation in the planning, construction, and operation process systemically. The Pearl River Delta intercity railway is a large-scale infrastructure project in which multiple governments are fully involved and actively sought for their interests. Thereby, the primary objective of this article is to explore the dynamics of regional governance restructuring in China through interrogating the role of provincial government and the evolution of provincial-local relation. There are two important findings reported by this article. First, the role of provincial government has been transformed from subcontractor and coordinator to “subcontractor plus contractor” and “coordinator plus developer”. This indicates that the provincial government has operated towards both gatekeeper and competitor. The financial authority is essential to determining this role transformation. Second, the structural administrative subcontract of provincial-local relation has transformed to serval opposed and cooperation waves of continuum. This continuum has been driven by different types of interests and the provincial-local relation constitutes to the stability and structural coherence of regional governance in China. This finding rectifies existing understanding around the regional governance mechanism, that is top-down and bottom-up mechanisms. As such, the regional governance has generally manifested as the hybrid model in which different governmental agencies co-shaped. The changing regional governance in the Pearl River Delta intercity railway also implies that the regional governance is sensitive to the concrete socioeconomic environment and varied case by case. In this vein, we contribute to the understanding of recentralization of state space as well as the restructuring of provincial-local relation beyond administrative subcontractor. It concludes that China’s city-regionalization is orchestrated by different levels of government and the actual effect and modality of regional governance are determined by inter-scalar politics oriented economic growth.
Impact of the COVID-19 pandemic on urban human mobility: A multiscale geospatial network analysis using New York bike-sharing data
[J].
“流空间”视域下淮海经济区城乡融合发展驱动机制
[J].
Driving mechanism of urban-rural integration in Huaihai Economic Zone: Based on the space of flow
DOI:10.31497/zrzyxb.20200810 URL [本文引用: 1]
中国区域信息空间和人口空间的耦合关联分析
[J].
DOI:10.13249/j.cnki.sgs.2016.10.004
[本文引用: 1]
从流动空间角度出发,建立基于关系测度的空间耦合模型,采用复杂网络分析方法和灰色关联分析方法深入探讨区域信息空间和人口空间的耦合格局。研究发现信息空间和人口空间的耦合网络呈现“核心-边缘”模式,北京、上海、广东、天津、新疆和甘肃等耦合核心省市在整个省市内占据主导地位,是其他省市耦合发展所依附的核心。全国省市信息空间和人口空间耦合分布的总体布局呈现“川”型特征,分为高耦合协调型、中耦合磨合型以及低耦合发展型。信息空间和人口空间的耦合主要分为高耦合协调型、中耦合磨合型以及低耦合发展型3种,其中空间的高耦合程度一方面响应了国家加快推进互联互通建设的发展战略,另一方面也是京津冀一体化以及建设丝绸之路经济带的必然结果。
Grey associative analysis of regional population space and information space coupling in china
DOI:10.13249/j.cnki.sgs.2016.10.004
[本文引用: 1]
In the context of informatization, the information system and the population system interact with each other, and the information elements and the demographic factors affect the regional development more and more deeply. Therefor the study on the coupling of information space and population space could provide the government departments with scientific decision for regional development layout. From the perspective of the flow space, a spatial coupling model based on relations measurement is established in this paper. What’s more, complex network analysis and gray correlation analysis are used to discuss the characteristics of the coupling and coupling pattern. The results show that the coupling network of the population space and information space presents "core - periphery" model. As central provinces, Beijing, Shanghai, Guangdong, Tianjin, Xinjiang and Gansu provinces dominate in all provinces, which are attached cores of the other provinces. On the one hand, a coupling degree responses to the national strategy of interoperability, on the other hand it is the inevitable result of the integration of Beijing, Tianjin, and construction of the Silk Road economic belt. All the provinces are divided high coupling coordination group, running coupling group and low coupling development group.
基于地方化、城市化和全球化制造业空间集聚分析: 以长三角区域为例
[J].
DOI:10.13249/j.cnki.sgs.2021.10.009
[本文引用: 1]
以制造业集聚指数作为测度指标,利用空间面板数据模型检验了地方化、城市化以及全球化要素对制造业整体集聚水平的具体影响。研究发现:① 长三角区域制造业高度集中在苏南?上海?杭(杭州)绍(绍兴)甬(宁波)组成的区域且地位稳固,同时苏北和浙西南地区的制造业虽然比例较低,但是总体地位有所提升。② 地方化要素中的职工工资和开发区变量对县域制造业集聚具有显著的正向作用,土地价格则呈现出显著的负向影响,市场规模和交通的作用不稳定。城市化要素中的城市规模、城镇化率、外来迁入人口以及城市制造业结构多样化均表现出显著的正向促进作用,表明了长三角区域城市化的推进促进了制造业集聚水平的提升。全球化表现出不同的作用方向,其中FDI对制造业集聚指数的影响显著为负,出口变量表现出显著的正向作用。
Dynamic regional manufacturing agglomeration in the Yangtze River Delta region
DOI:10.13249/j.cnki.sgs.2021.10.009
[本文引用: 1]
This article proposes a theoretical framework composed of the effects of localization, urbanization and globalization to explain the evolution of regional manufacturing agglomeration in the Yangtze River Delta region. Further, based on the micro firm-level data from industrial enterprise database in China, using regional manufacturing agglomeration index as a measure index, this paper first described the spatial characters of manufacturing at the county level in the Yangtze River Delta region from 2000 to 2013, and then using the panel data model to measure the effects of localization, urbanization and globalization on manufacturing industry agglomeration. The results are as follows. Firstly, the manufacturing industry is highly concentrated at the region of South Jiangsu, Shanghai and Hangzhou-Shaoxing-Ningbo and changes little over time, and the manufacturing industry status in the north of Jiangsu and south west of Zhejiang has been improved. Secondly, the variables of wage and industrial development zones have a significant positive effect on the manufacturing agglomeration, while the variable of land price has a significant negative effect, and the effect of market and transportation are inconclusive. The urbanization factors, such as city size, urbanization rate, migration and urban manufacturing diversification, all show significant positive promoting effects, indicating that the urbanization will promote the level of manufacturing agglomeration in the Yangtze River Delta region. Globalization shows different directions, which FDI has a significant negative impact on the manufacturing agglomeration, and the variable of foreign capital is also negative, indicating that foreign investment is not conducive to the improvement of the manufacturing agglomeration level. Exports show a positive effect, but it is inconclusive.
产业一体化的内涵与途径: 以南昌九江地区工业一体化为实证
[J].
The connotation and development path of industrial integration: Take the industrial integration in Nanchang-Jiujiang region as the case
产业一体化与城市土地利用效率的时空耦合效应: 以长江中游城市群为例
[J].
Coupling effect of industrial integration and urban land use efficiency: Taking the urban agglomeration of the middle reaches of the Yangtze River as a case
城市群区域一体化与旅游共享合作机制: 长三角的经验借鉴
[J].
DOI:10.13284/j.cnki.rddl.003010
[本文引用: 1]
以长三角“无障碍旅游圈”的实践为例,通过对地方政府合作过程的梳理,运用博弈分析方法剖析了各城市政府之间共享合作的动力机制及策略选择。结果表明:区域一体化进程中合作达成需要尊重市场意愿,增强政府及公众层面的区域认同,通过不同地方政府间的多重博弈达到成本共担利益共享的“纳什均衡”。这一结论既能丰富地方政府合作研究的案例样本,总结长三角地区的成功经验,也可以为粤港澳大湾区建设过程中的地方政府合作提供参考和启示。
Tourism cooperation among governments in the metropolitan region and the integration mechanisms: Evidence from the Yangtze River Delta, China
珠三角城市区域治理的尺度重构机制研究: 基于产业合作项目与交通基础设施项目的比较
[J].
DOI:10.11821/dlyj020200517
[本文引用: 1]
珠三角作为中国东南沿海的巨型城市区域,旨在构建跨越经济社会系统的多元协同的综合一体化地区。本文以深汕特别合作区与穗莞深城际铁路两个区域合作项目为例,借鉴“新国家空间”理论,基于区域治理所面临的经济发展困境与行政治理困境,分析区域治理过程中的权力上移和下移,即省市关系调整的弹性应对策略。研究发现:区域产业合作项目中,为克服城市间合作的制度化不足的行政治理困境,省政府进行了包括资源注入、事权下放、去管制和扩大地方自主权的区域治理权力的尺度下移;区域基础设施项目中,为了解决省政府财权不足的行政治理困境,省政府进行了水平权力重组以构建综合博弈体、强制性地方事权上收和以收权导向的行政奖励的区域治理权力的尺度上移。由此,本文认为珠三角区域治理并非单向、机械的尺度建构过程,而是区域项目建设导向下,以修复行政治理困境为目标,灵活多向的尺度重配过程。
Rescaling of global city-regional governance in the Pearl River Delta: A comparative study on industrial project and transportation infrastructure project
DOI:10.11821/dlyj020200517
[本文引用: 1]
The Pearl River Delta (PRD) is the global city-region in China’s southeast coastal areas and aims to create a comprehensive cross-border region across divergent institutional systems. The city-region in China has been long deemed as the engine of the regional growth in the past four decades. This article draws upon the theory of “new state space” to investigate the two regional projects in PRD, that is Shenzhen-Shanwei Special Cooperation Zone and Sui-Guan-Shen (Guangzhou-Dongguan-Shenzhen) intercity railway projects. By examining the theory of “new state space” from the lens of rescaling, we build up a conceptual framework capable to understand the rescaling of city-regional governance in post-reformed China. Based upon crises of capital accumulation and administrative governance, this article is committed to tracking the upscaling and downscaling of powers in regional governance and the overall rescaling processes of relations between provincial and local governments. In general, this article develops a China-contextualized conceptual framework and two empirical cases to problematize the rescaling of regional governance, both of which are central to shed lights on the rationale of China’s political economy. Three major findings are reported as follows. First, in the industrial collaboration project, in order to overcome the crises of weak institutional framework for intercity cooperation, provincial government is devoted to injecting resources, devolving administrative powers, deregulation, and empowering great autonomies to localities. These actions constitute to the downscaling of regional governance. Second, in the large-scale infrastructure project, in order to overcome the lack of the financial authority, provincial government is committed to building strong bargainer through horizontal power reconfiguration, recentralizing the developmental power from localities compulsorily, and delivering actual incentives for power recentralization. These actions constitute to the upscaling of regional governance. Third, considering the above-mentioned findings, this article argues that rescaling of regional governance in PRD is a flexible and polydirectional rescaling process, which is differentiated by concrete regional projects, rather than a unidirectional and mechanical rescaling process as suggested by conventional literature.
区域一体化进程中的产业发展协作问题及其治理机制优化
[J].
Cooperation problem of industrial development in the process of regional integration and the optimization of its governance mechanism
Industrial collaborative agglomeration, marketization, and green innovation: Evidence from China's provincial panel data
[J].
Urban innovation, regional externalities of foreign direct investment and industrial agglomeration: Evidence from Chinese cities
[J].DOI:10.1016/j.respol.2016.01.014 URL [本文引用: 1]
Influence of marine industrial agglomeration and environmental regulation on marine innovation efficiency: From an innovation value chain perspective
[J].
Can environmental regulation directly promote green innovation behavior? Based on situation of industrial agglomeration
[J].
城市区域经济一体化水平测度: 基于深莞惠次区域的实证研究
[J].
Measuring economic integration of city region: A case study of Shenzhen-Dongguan-Huizhou sub-region
流空间视角下的粤港澳大湾区空间网络格局: 基于信息流与交通流的对比分析
[J].
Urban network structure of Guangdong-Hong Kong-Macao greater bay area with the view of space of flows: A comparison between information flow and transportation flow
粤港澳区域联动发展的关键科学问题与重点议题
[J].
DOI:10.18306/dlkxjz.2018.12.001
[本文引用: 1]
在新时期新背景下,实现粤港澳区域联动发展具有紧迫性、必要性和重大现实意义。本文认为研究粤港澳区域联动发展需要以区域一体化理论体系、“全球—地方”尺度理论、区域空间相互作用理论体系为主要的理论基础。其关键科学问题是研究“一国两制”下粤港澳尺度的区域联动理论,探索粤港澳区域联动的机制、关键因素、模式与路径;提出了粤港澳区域联动发展关注的4个重点议题:①粤港澳区域一体化/协同理论的研究与探索;②粤港澳地位与作用研究;③粤港澳联动的多尺度、多主体影响机制与模式研究;④粤港澳联动发展的实施路径研究。
Key scientific issues and important topics in the joint development of the Guangdong-Hong Kong-Macao region
DOI:10.18306/dlkxjz.2018.12.001
[本文引用: 1]
Given the modern background of economic globalization, regional economic integration, new global economic development trends caused by modern technological reforms, the Belt and Road initiative, and the Guangdong-Hong Kong-Macao Greater Bay Area development strategy, there is a growing sense of urgency, necessity, and practical significance in achieving the joint development of the Guangdong-Hong Kong-Macao region. This requires an in-depth understanding and accurate grasp of the key scientific issues and important topics related to this task. This article argues that research related to the joint development of the Guangdong-Hong Kong-Macau region must be based on a regionally unified theoretical framework, "global-local" scale theory, and regional spatial interaction theory as its theoretical basis. In this regard, key scientific issues include the study of the theory of regional linkages of scale in Guangdong, Hong Kong, and Macau under the "One Country, Two Systems" framework, and the exploration of mechanisms, factors, models, and pathways governing linkages in the Guangdong-Hong Kong-Macau region. In so doing, this article proposes four important topics that can be considered with regard to the joint development of the Guangdong-Hong Kong-Macau region: (1) Research and exploration of unification/coordination theory in the Guangdong-Hong Kong-Macau region under the "One Country, Two Systems" framework; (2) Research related to the location and role of the Guangdong-Hong Kong-Macau region; (3) Research related to the multi-scale and multi-agent impact mechanisms and models for the linkages between Guangdong, Hong Kong, and Macau; (4) Research related to implementation pathways for the unified development of Guangdong, Hong Kong, and Macau.
粤港澳大湾区发展的理论框架与发展战略探究
[J].
DOI:10.18306/dlkxjz.2018.12.002
[本文引用: 1]
粤港澳大湾区是在“一带一路”倡议下,由珠三角经济圈的强化合作而产生的新地理概念。作为新兴的全球化港湾,粤港澳大湾区如何突破新自由主义框架理论,探索出符合社会主义市场经济体制的发展路径,是当前决策者和规划者需要思考的重要问题。本文简要梳理了现有的城市群、区域增长极理论,新经济地理集群理论,全球产业链网络理论并结合大湾区现状优势,对湾区发展战略定位与发展路径进行探究,认为可通过粤港澳三方通力合作,创造一个内生型的经济与产业本土增长模式为主要方向。具体表现为:首先,要以先进制造业为立足点、实现自我创新的产业升级,形成完善的制造业产业链,并成为全球生产网络的重要节点与区域性枢纽;其次,大湾区还应利用自身的科研与教育、金融与创新资源优势,推进“一国两制三关税区”、尤其是与香港在大湾区建设中的全方位参与联动,完善产权制度,加强合规和规则经济的市场经济体系建设,将大湾区打造为中国的科创中心及全球性金融中心。
Theoretical framework and development strategy of the Guangdong-Hong Kong-Macao Greater Bay Area
DOI:10.18306/dlkxjz.2018.12.002
[本文引用: 1]
The Guangdong-Hong Kong-Macao Greater Bay Area is a new geographical concept arising from the enhanced cooperation of the Pearl River Delta Economic Zone under China's Belt and Road Initiative. As a new global bay area, how to make a theoretical breakthrough in neoliberalism framework and explore the development pathway in line with the socialist market economic system is an important issue that policymakers and planners need to think about. Based on a systematic review of the existing theories in urban agglomeration, regional growth pole theory, the cluster theory in new economic geography, and the global production network theory, this article seeks for a theoretical framework and grounding for understanding the development issues in the Greater Bay Area. In line with the existing advantages of the Greater Bay Area, this article identifies the strategic positioning and development pathway for the area, and argues that creating a new development model of endogenous growth with indigenous innovation is the first development priority for the Greater Bay Area. That is, through deepening the cooperation between Guangdong, Hong Kong, and Macau under "one country, two systems, three tariff zone," the Greater Bay Area could first achieve the transformation and upgrading in advanced manufacturing industry and secure a strategic position as an important regional hub in the global production network. Second, the Greater Bay Area should also use its own strengths in education, scientific research, and international financial services to develop China's innovation hub and global financial center with strong property rights, compliance, and rule-based economic system.
粤港澳大湾区的构建与制度创新: 理论基础与实施机制
[J].
Construction and institutional innovation of Guangdong-Hong Kong-Macao Greater Bay Area: Theoretical basis and implementation mechanism
粤港澳大湾区经济高质量发展的评价与靶向路径研究
[J].
Study on the measurement and targeting path for the economic high-quality development in the Guangdong-Hongkong-Marco Greater Bay Area
基于日高铁流量视角的中国高速铁路网络空间特征
[J].
DOI:10.11821/dlyj201811006
[本文引用: 1]
构建中国180×180的O-D城市日高铁流量矩阵,基于社会网络分析研究其高铁网络结构特征,结果表明:① 中国高铁网络松散,东、中部网络密度大于东北与西部,以长三角为核心的东南与其他区域不均衡特征凸显,东、中、西、东北包含不同的高铁区系与核心。② 日高铁流量表现为沿京沪高铁“廊道型”向东西两侧递减弱化的“非对称性”格局,形成京沪、京广、杭福深相串联的高铁大三角主骨架;高铁中心要素也呈现沿京沪、京广、沪昆、杭福深等向线路两侧不规则递减格局,“廊道效应”显著。③ 胡焕庸线东南侧城市对高铁要素掌控能力大于西北侧,省会或区域中心城市多为高铁通达服务“中介”,一线城市高铁空间溢出效应有向二、三线城市过渡态势。
Spatial characteristics of Chinese high-speed railway network from the perspective of daily flow
DOI:10.11821/dlyj201811006
[本文引用: 1]
This paper studied the spatial structure, pattern, and characteristics of China's high-speed railway (HSR) network. The paper first built a daily origin-destination (O-D) HSR flow matrix consisting of 180*180 cities to evaluate the daily HSR flow of China. Then by analyzing the network density, four kinds of centralities, core/periphery structure and cohesive subgroups using the network analysis software, i.e., University of California at Irvine Network (UCINET), this paper displayed the structure and characteristics of China's HSR network. Finally, the global trend analysis and spatial interpolation function of geographic information system (GIS) were used to simulate the pattern of the daily HSR flow and four kinds of centralities in China and to reveal the characteristics and the differentiation of their spatial distribution. The results are as follows. First, spatially, the HSR network of China is loosely organized. The HSR network density of different regions differs greatly as such: eastern China> central China> northeastern China> western China. Particularly, the HSR network density of the Yangtze River Delta is higher than that of other region in China. This phenomenon shows the imbalanced and uncoordinated development of China's current HSR network. The HSR cliques and cores of eastern China, central China, northeastern China and western China are different. Second, by analyzing the daily HSR flow, we find that the flow of Beijing-Shanghai HSR line which has developed into the main "corridor" of China's HSR flow is much higher than that of the rest lines. However, its west and east sides have shown an asymmetric reduction trend. Beijing-Shanghai HSR line, Beijing-Guangzhou HSR line and Hangzhou-Fuzhou-Shenzhen HSR line are the nation's HSR center-lines, as they have the highest daily HSR flow. These three lines have developed into a triangle pattern, which is the basis of China's HSR spatial structure. The spatial pattern of the flows of the key urban elements, such as the population and industries, has been affected by the HSR network. These key elements of both sides of the Beijing-Shanghai HSR, Beijing-Guangzhou HSR, Shanghai-Kunming HSR, Hangzhou-Fuzhou-Shenzhen HSR lines have an asymmetric reduction trend, which shows the strong influence of the "corridor". Third, key elements related to HSR such as population and industries of the cities located to the southeast of the Hu Huanyong Line are higher than those of the cities to the northwest of the line in China. Beijing, Guangzhou, Chengdu, Chongqing, Shenzhen, Zhengzhou, Shijiazhuang, Nanjing and Shanghai are the national important HSR accessibility intermediary cities. These cities, together with other provincial capitals and regional central cities, have spatially developed into multiple service centers of China. Besides, the spatial spillover effects based on the HSR accessibility have been spilled from the first-tier developed cities to the second-tier or third-tier cities. The HSR development and its accessibility have brought potential agglomeration chances to second-tier or third-tier cities.
耦合视角下长三角地区城镇化协调度的时空特征及交互机制
[J].
DOI:10.11821/dlyj020181167
[本文引用: 1]
随着中国城镇化发展的转型,测度城镇化过程中人口、土地和经济三者发展的耦合协调关系,探索其演化过程的时空动态规律,已成为人文地理学研究新型城镇化的重要科学问题。通过构建耦合协调度模型,在测度近16年来长三角地区城镇化进程中各子系统的协调发展水平的基础上,运用空间变差函数,LISA时空跃迁等方法,分析长三角地区城镇化耦合协调的交互过程,探索其城镇化协调空间集聚的形成机制。结果表明:① 伴随长三角地区城镇化水平的显著提升,“人口、土地和经济”总体和两两耦合协调度演化均呈稳步提升的趋同现象;② 长三角地区城镇化耦合协调度空间集聚程度逐年增强,空间关联作用范围不断扩大,形成了“一极独大、三角核心、周边低平”的空间形态;③ 从各个城市的城镇化耦合水平跃迁路径来看,大多呈协同增长态势,表明城市的整体耦合协调度具有明显的路径依赖和空间锁定特征;④ 长三角地区城镇化耦合协调水平从稳定和均衡→极化集聚状态的演变动力主要来自于土地-经济的交互作用,而从极化→均衡状态的演变动力更多地来自于人口-土地的交互作用。城镇化协调度的交互过程及机制研究为新型城镇化发展和长三角城市群构建提供了理论依据和调控方向。
Temporal and spatial characteristics and interaction process of urbanization coordination in the Yangtze River Delta region from the perspective of coupling
DOI:10.11821/dlyj020181167
[本文引用: 1]
With the transformation of China's urbanization, how to measure the coupling and coordination relationship between population, land and economy in the process of urbanization, and explore the temporal and spatial dynamics of its evolution process, has become an important scientific issue in the study of new urbanization in human geography. By constructing the model of coupling coordination degree, based on the coordinated development level of each subsystem in the process of urbanization in the Yangtze River Delta in the past 16 years, this paper analyzes the interaction process of urbanization coupling coordination, and explores the coupling mechanism of the formation of urbanization coordination space agglomeration in the study region by using spatial variogram, LISA time-space transition and other methods. The results show that: (1) with the remarkable improvement of population, land and economic urbanization level in the region, the evolution of the overall and the coupling coordination of population-land urbanization, land-economy urbanization and population-economy urbanization degree shows a steady convergence phenomenon; (2) the spatial agglomeration degree of the coupling coordination degree of urbanization is increasing year by year, and the scope of spatial correlation has been expanding continuously, basically forming a spatial pattern of "one pole alone, triangle core, peripheral low-level"; (3) from the perspective of the urbanization coupling level transition path of each city, most of the cities show a synergistic growth trend, indicating that the overall coupling coordination degree has obvious path dependence and space locking characteristics; (4) the evolution of urbanization coupling coordination level from the stability and equilibrium to polarization agglomeration state mainly comes from the interaction of land-economy, and the evolutionary power from polarization to equilibrium state comes more from population-land interaction. The study of the interaction process and mechanism of urbanization coordination provides a theoretical basis and direction for the construction and coordinated development of the Yangtze River Delta urban agglomeration.
STARS: Space-time analysis of regional systems
[J].DOI:10.1111/j.0016-7363.2005.00675.x URL [本文引用: 1]
中国城市区域治理的尺度重构与尺度政治
[J].
DOI:10.13249/j.cnki.sgs.2021.01.011
[本文引用: 1]
系统回顾西方尺度理论,尤其是尺度生产(尺度重构与尺度政治)理论,借此阐释中国城市区域治理形成的尺度逻辑。研究发现,中国城市区域包括城市群与都市区2个地理尺度;治理尺度是以行政权力为核心,形成自上而下的行政权力金字塔;治理尺度的动态重配并与地理尺度相耦合的过程是中国城市区域治理的尺度建构的本质;改革开放后,中国宏观政治经济在“去中心化-再中心化”过程中持续动态调整;中国城市区域的产生是国家空间选择性的结果,来克服以城市为基础的资本积累模式的体制危机;城市群治理以柔性尺度重构为主,都市区治理以刚性尺度重构为主;城市区域内部产生复杂的多主体间的尺度博弈。
Rescaling and politics of scale in China's city-regional governance
DOI:10.13249/j.cnki.sgs.2021.01.011
[本文引用: 1]
This article aims to systematically demonstrate the evolution and development of scale theory and its features in different periods. The perspective of scale theory is then used to elaborate the formation of city-regional governance in China. A conceptual framework is proposed in this article. Four major conclusions are presented as follows. First, the geographical scale of China’s city-region consists of two modalities, namely, metropolitan area and urban agglomeration. The governing scale of China’s city-region is essentially constituted by administrative powers, all of which made up a top-down power matrix. The restructuring of governing scale oriented geographical scale of city-region is the nature of rescaling of China’s city-regional governance. This restructuring process is central to understand the rationale of China’s city regional governance. Second, the macro socioeconomic development in China has manifested as the dynamic adjustment process between decentralization and recentralization. The rise of city-regional governance in China is the outcome of state spatial selectivity oriented city-regions to overcome the crises brought by the conventional city-based accumulation regime. Third, the governance of urban agglomeration is featured by the soft rescaling. Correspondingly, the governance of metropolitan area is characterized by rigid rescaling. This rigid rescaling has embodied as the reconfiguration of various jurisdictions oriented a new administrative relation. Last but not the least, there are complicated games between multiple actors at the city-region scale. To sum up, China’s city-regional governance reflects the changing political economy of regional development in post-reform era.
粤港澳大湾区府际合作网络特征及演变机制研究
[J].
Characteristics and evolution mechanism of inter-governmental cooperation network of Guangdong-Hong Kong-Macao Greater Bay Area
