

半导体产业是区域产业转型升级的“转换纽带”,它既能支撑传统工业的数字化、信息化改造,又能衍生出人工智能、移动互联网等新兴产业生态,这种双向促进的重要功能是主要国家围绕其争夺话语权的根本原因[1-2]。从20世纪80年代日美半导体贸易战到近年日韩半导体争端以及中美科技贸易战,再到2020年以来新冠肺炎疫情进一步加剧的全球“芯片焦虑”[3],半导体产业空间及组织已经成为区域产业发展战略以及区域产业研究重点关注的内容。20世纪80年代以来,美国半导体企业的全球扩张以及所引发的三次产业转移奠定了这一产业区位关联研究的历史基础。学者在解构美国半导体产业体系时发现其组织形成的根本动力来源于生产技术和商业模式之间的动态适应,集中表现为上下游企业之间的深度嵌入[4⇓⇓⇓-8]。21世纪初,国内学者聚焦上海浦东集成电路产业集群时同样发现上下游企业间的深度交流合作是其产业组织生存的基础,而企业与科技创新主体间的互动也能有利于保持较高的生产效率[9]。此外,集成电路产业集聚的形成更加依赖于“全球—本地”的交互影响[10],尤其是头部企业,一方面影响本地产业集聚的组织模式,另一方面也帮助本地集群嵌入全球价值链[11-12]。因此,半导体产业区位布局的组织模式对产业集群的塑造和演化具有深刻的影响。
企业作为经济活动的主要承担者,企业区位及空间组织是经济地理学中重要的基础科学问题[13-14]。当前关于企业区位的主流研究仍以单一产业整体为研究对象进行区位因子识别或多产业区位选择比较,具体集中在制造业[15⇓-17]、都市工业[18]、高新技术产业[19⇓-21]、文创产业[22]、生产性服务业[23-24]等产业门类,其研究的基本思路均围绕时空演化及其因素展开定量分析,市场规模、基础设施、制度政策、空间距离以及要素价格等宏观环境因素进一步丰富了古典区位理论体系下的区位解释。然而,上述区位研究均在强化外部因素对于产业布局决策的影响,而较少关注企业与企业之间的布局关系。相较之下,产业的区位关联研究则进一步揭示了在不同产业或同一产业内部不同企业的空间布局关系,以及不同企业的区位选择与周边其他企业的区位关系[25]。工业企业区位不仅与同类企业区位形成空间上的竞合关系,也会在不同环节上发生空间关联。现有研究中对于电子信息产业的笼统表达事实上忽略了半导体产品作为“中间品”属性在区域产业组织中的“嵌入性”,这种嵌入性需要通过区位关联进行空间表达。珠三角地区在既有电子信息产业集群的基础上已经初步构建起较为完整的半导体产业链,然而与北京、上海、无锡、绍兴等城市相比,珠三角地区并不具有早期半导体产业建设较为系统性的政策和智力支持,而后期的电子信息产业集群则是依靠民营经济为主体的市场力量逐步构建[2],总体上呈现出市场化驱动下一种相对自主性的产业演化路径,其“区位关联”更加能反映其半导体产业集群建设的路径与模式。“区位关联”这一基本思路被应用在许多方面,尤其在产业、设施、商业等布局研究中已经得到验证,且一般基于协同区位商的方法予以实现。Ke等[26]针对中国所有城市构建了制造业与生产性服务业协同集聚的分析模型,发现制造业倾向于选址于有生产性服务业的城市;Yuan等[27]则同样利用协同区位分析发现集聚经济和城市地价对制造业与生产性服务业的共同区位的影响。此外,生产服务业内部不同产业部门间也存在区位关联,张大鹏等[28]利用点位数据证明了上海市不同类型物流企业间形成的区位协同关系,严若谷[29]也发现了深圳市金融产业部门区位关联规律。Xue等[30]利用POI数据发现沈阳市装备制造业和汽车销售业呈现出空间互补整合的基本特征,并且认为这种关系能够促进产业生态系统的建设。上述研究为城市内部产业间以及产业内部不同部门间存在的区位协同规律提供了重要证据。除产业区位布局规律的探索外,商业网点布局以及城市内部不同功能空间的关系同样引起相关学者的关注。张英浩等[31]以咖啡店为对象总结出不同品牌连锁店布局的区位模式;孟斌等[32]则是从“职住分离”视角出发进一步揭示了北京市区内居住地和工作地之间的空间关联规律。由于产业链在空间上的布局本质上也是要素之间的相互作用关系,所以借助区位关联的基本思路研究不同生产环节的空间关系问题成为相对可行的探索方向。
半导体产业作为一种相对复杂的高技术产业链,其在区域内的相对集聚在更大程度上是上下游环节企业间深度关联而产生的自然结果。在上述区位协同的研究基础上,本文将针对半导体这一单一产业内部不同生产环节之间的区位关联进行解构,通过引入协同区位商的分析方法针对珠三角半导体产业布局的区位关联进行定量化研究。协同区位商(co-location quotient)分析来源于地理学第一定律在产业或经济区位商的空间化应用,通过对不同要素的空间分布关系的定量化和可视化,来识别在单个或多个要素群内部之间呈现的关系模式[33-34]。所以,不同生产环节布局所产生的区位关联可以被解释为在一定空间范围内2种环节企业布局之间的吸引力。相较于传统的产业区位商依赖于规模比重数据,协同区位商则更加依赖于地理最近邻原则生成全局和局域2种尺度下的区位关联结果,比产业区位商更能够反映地理空间中的关联效应[35]。本文立足于半导体设计、制造、封测、材料设备、分立器件及光电子元件等5个关键生产环节,对珠三角半导体产业布局及其主要集聚区进行分析和识别;同时,采用协同区位商方法定量计算对不同环节企业的区位关联格局,以此尝试论证和回答上述问题。
1 数据与方法
1.1 半导体产业链的基本结构
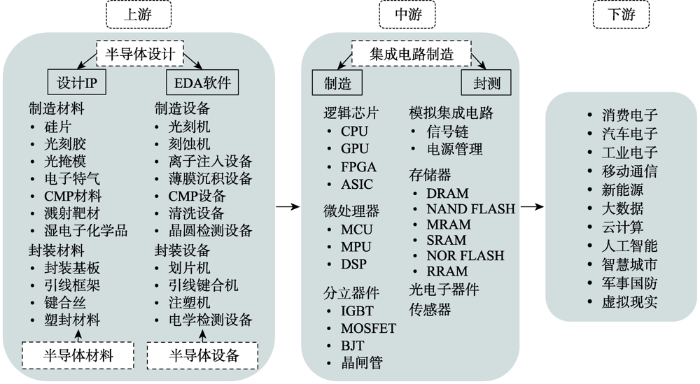
完整的半导体产业链涵盖上、中、下游3个主要环节[1-2]。上游环节包括集成电路设计、制造材料与制造设备三大模块,其中集成电路设计包括具体设计厂商、IP资产商以及软件开发商;支撑模块包括半导体专用设备(晶圆硅片和集成电路制造及封测专用设备)与特殊电子材料(特殊电子气体、特殊化学液体、印制电路板等)。中游环节为半导体晶圆制造及封装测试。下游环节则是半导体作为中间品嵌入到数字终端生产体系中(图1)。需要进一步说明的是,分立器件与光电子元件制造也属于半导体产业链,但相较于集成电路而言是相对独立的生产体系。尽管半导体上游和中游环节均具有较高的技术壁垒和增值能力,但根据初始投资的规模基准,晶圆制造是其中成本、风险及收益均达到最高的关键环节,也是全球主要国家竞相争夺的核心环节。此外,由于本文的关键对象是直接生产半导体产品的企业,所以数据收集和实际研究的范围只考虑上游和中游环节。
图1
1.2 企业数据采集与预处理
相较于现有产业地理研究对中国工业企业数据、中国海关企业进出口匹配数据以及历次中国经济普查数据等宏观数据库的充分利用,本文则采用“多源数据+交叉验证”的方法构建数据库。多源数据分别来自于“企查查”工商企业注册数据库、中国半导体行业协会(CSIA)企业名录数据、广东省及深圳市半导体行业协会企业名录数据、“行行查”产业研究综合数据库(企业名录+研究报告)以及基于2021年“慕尼黑·上海消费电子展”人工获取的国内展商名录数据。在此基础上,根据企业所属环节和地区进行筛选,初步形成半导体企业名录;同时,为了克服工商企业注册数据容易出现的失真和冗余,严格按照实际缴纳注册资本为基准进行二次清洗,同时将所有企业与其他数据库进行人工交叉验证,最终得到较为真实和完整的珠三角地区半导体企业数据库(表1)。
表1 珠三角半导体企业数据统计
Tab.1
| 企业属性 | 总体规模/家 | 数据来源 | |
|---|---|---|---|
| 芯片设计 | 781 | 行业协会数据+行行查 | |
| 晶圆制造 | 7 | 人工查找+行业协会数据 | |
| 封装测试 | 100 | 行业协会数据+展商数据 | |
| 半导体设备 | 制造设备 | 57 | 企查查数据+展商数据 |
| 封测设备 | 128 | 企查查数据+展商数据 | |
| 半导体材料 | 制造材料 | 40 | 企查查数据+展商数据 |
| 封测材料 | 72 | 企查查数据+展商数据 | |
| 分立器件及光电子元件 | 293 | 企查查数据 | |
该数据库中的企业均位于珠三角9市市域(广州、深圳、东莞、佛山、中山、珠海、惠州、肇庆、江门),按照企业成立年份划定其时间范围为1980—2020年。具体属性包括:企业名称、所在省市及区县、所属行业大类、经营状态(在业、存续、吊销和外迁)、注册资本、主营业务、最新年报地址等。在预处理时,借助Data-Map工具根据企业地址进行地理编码和坐标纠偏(WGS1984),并在ArcMap中输出点位数据。
1.3 研究方法
1.3.1 核密度分析(kernel density)
核密度分析工具可用于刻画基于区域内已知样本点数据可视化其空间分布特征,并能够平滑地表示样本点在研究区域内的集聚与分散情况[36]。本文将半导体企业抽象成点要素,分析半导体产业在珠三角地区内的空间集聚特征。核密度分析的数学表达式为:
式中:
1.3.2 协同区位商(co-location quotient)
式中:参考相关实证研究[32,36],将
表2 协同区位商的显著类型与对应区间
Tab.2
| CLQ类型 | CLQ值区间说明 |
|---|---|
| 协同区位—显著 | CLQ>1且P<0.05 |
| 协同区位—不显著 | CLQ>1且P>0.05 |
| 隔离—显著 | CLQ≤1且P<0.05 |
| 隔离—不显著 | CLQ≤1且P>0.05 |
| 未定义 | 要素在其等于0的邻域或带宽内没有任何其他要素 |
注:表中P代表企业点随机分布的概率值。
2 珠三角半导体产业布局总体特征
2.1 中小企业为主的半导体产业结构
珠三角地区不同生产环节的半导体企业在数量和资本规模2种维度下形成了较为显著的规模不对称性(图2)。总体上,半导体设计环节占据主导地位,而其他环节的规模不对称性存在差异。晶圆制造环节企业数量占比仅为1%,但注册资本占比高达21%;这也充分证明了晶圆制造在半导体生产环节中的高附加值特征,建厂门槛高的基本属性决定了其企业布局的风险及其谨慎性。其次是半导体封测及材料类企业,分别以6%和7%的企业数量占据了11%和10%的资本规模;半导体材料企业中高纯度化工技术和封测企业中对于先进封装技术的基本要求决定了其相对较高的制造门槛,2类企业均处于半导体价值链的中高端环节。而在分立器件及光电子元件、半导体设备和半导体设计3类环节中,珠三角企业呈现出典型的小微企业主导格局:数量庞大、资本投入低,3类企业分别以20%、13%和53%的数量占据了7%、4%和47%的资本,由于技术门槛较低为中小民营企业资本分散进入该领域提供了良好机遇,这是形成“小而多”基本结构的根本原因。
图2
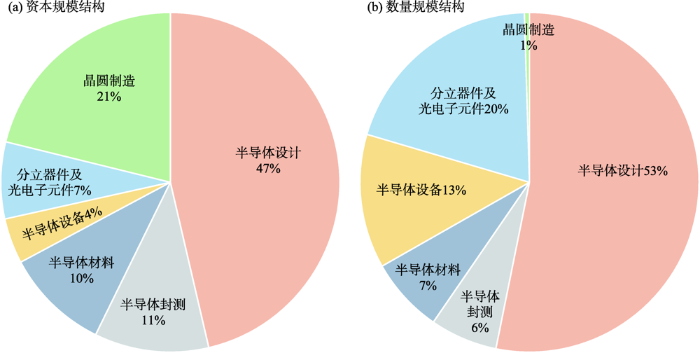
图2
珠三角地区半导体企业数量及注册资本量比重分布
Fig.2
The number of semiconductor companies and the distribution of registered capital structure in the Pearl River Delta region
2.2 半导体产业链在“广深莞”地区高度集聚
图3
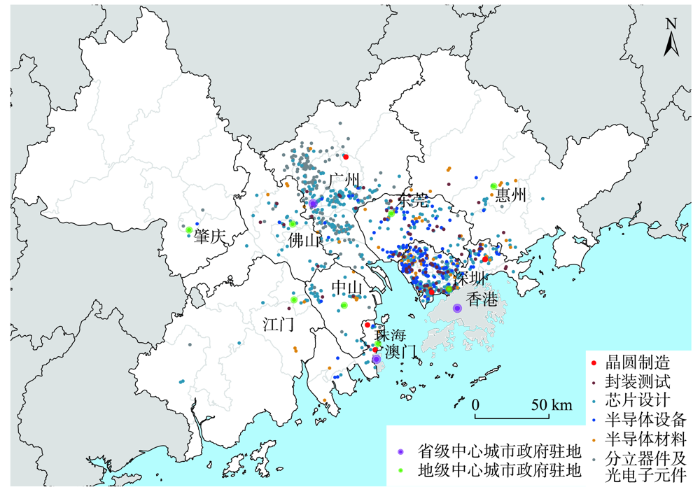
图3
珠三角地区半导体企业空间分布
注:本图基于自然资源部标准地图服务网站下载的审图号为GS(2019)4342号的标准地图制作,底图无修改。
Fig.3
Spatial distribution of semiconductor manufacturers in the Pearl River Delta region
图4
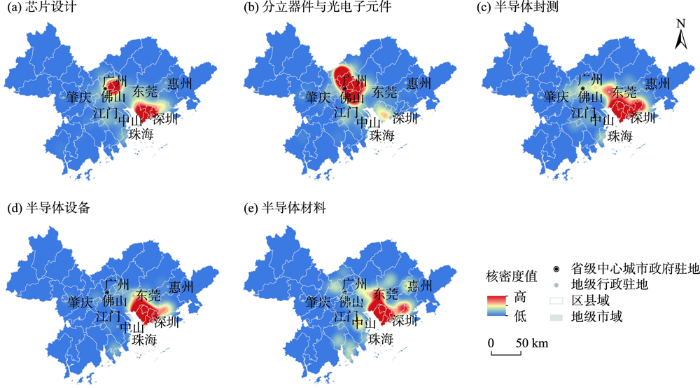
图4
珠三角半导体生产企业核密度分析结果
Fig.4
Kernel density of semiconductor manufacturing enterprises in the Pearl River Delta region
具体而言,芯片设计业务在地区内分布较广,是主要城市进入半导体产业链的普遍选择,但其产业资本投入却高度集中在广州和深圳两地。而在其他环节中,广州和深圳几乎形成了相对专业化的分工:分立器件及光电子元件制造企业在广州市呈现出高度集聚性,而深圳在半导体封测、材料和设备3个环节占据显著的规模优势,且东莞在上述环节中的集聚特征与深圳存在高度相似性。与上述环节相比,具有极高建厂门槛的晶圆制造企业在地区内仅有7家,尽管深圳在总体规模上占有相对优势,但仍未形成与其他环节相似的规模集聚效应。在半导体产业链的价值分布中,分立器件及光电子元件制造产值占比不足15%,而围绕集成电路形成的设计、材料、设备和晶圆制造业务产值超过80%。在这种产值分配前提下,珠三角城市间半导体产业空间异质性进一步凸显:广州半导体产业优势仍建立在较低增值能力的分立器件及光电子元件制造;而深圳—东莞地区已经在半导体产业链上游初步形成了增值优势;珠海、中山、佛山、惠州等城市在地区内半导体产业体系中仍然处于“边缘”角色。
3 珠三角地区重点城市半导体产业的区位关联
由于协同区位商在当前区位分析中以城市尺度为主流;同时考虑到广州和深圳是珠三角地区具有半导体全产业链构建能力的城市且具有足够数量的样本,所以本文将进一步针对半导体产业主要集聚城市——广州和深圳进行重点分析;一方面兼顾协同区位分析的尺度适用性;另一方面通过重点城市的产业集聚总结半导体产业布局的区位关联模式。
3.1 广州和深圳半导体产业区位关联的全局特征
广州和深圳半导体产业区位关联的全局特征集中表现为同类企业间关联与上下游企业间关联(表3)。广州已经形成了设计、材料以及分立器件制造产业的显著集聚,3类企业的GCLQ值均超过1,尤其是材料企业间的GCLQ值高达20.60;设计、设备环节各自企业的GCLQ值在1.9左右,而2类企业之间也同样存在显著的区位关联。深圳则在设备、设计环节中形成了专业化集聚,而上下游企业间的区位关联则以材料和设备企业间的区位协同关系为主导,GCLQ值分别超过1.6和1.4。值得注意的是,设计企业间的集聚程度相对于其他环节并不十分显著,其在广深两地的GCLQ平均值低于1.2;尽管设计业务在珠三角地区的分布最为广泛,但由于其本身需要面向前端客户进行定制化服务,这种供需特征决定了其区位并不受限于半导体产业链上下游环节的布局影响,以便于能够更容易嵌入与之高度相关的数字设备终端产业链。珠三角作为全球主要的信息与通信技术产业带,大量数字终端设备企业集中于此,如计算机制造、手机制造、智能网联汽车等一系列智能数字终端企业,这进一步分化了设计环节与其他环节之间的区位依赖。此外,由于在晶圆制造环节上布局有限,珠三角地区半导体产业集聚具有生产环节的非连续性特征。
表3 广州和深圳半导体产业GCLQ值显著性结果统计
Tab.3
| 城市 | 中心要素 | 相邻要素 | GCLQ | P值 |
|---|---|---|---|---|
| 广州市 | 设备 | 设计 | 1.84 | 0.02 |
| 设计 | 设备 | 1.97 | 0.02 | |
| 材料 | 材料 | 20.60 | 0.04 | |
| 设计 | 设计 | 1.21 | 0.04 | |
| 分立器件 | 分立器件 | 1.12 | 0.02 | |
| 深圳市 | 材料 | 设备 | 1.65 | 0.04 |
| 设备 | 材料 | 1.50 | 0.04 | |
| 设备 | 设备 | 2.07 | 0.02 | |
| 设计 | 设计 | 1.13 | 0.02 |
3.2 广州和深圳半导体产业区位关联的局域特征
3.2.1 广州:分立器件为主导的产业链建设
广州半导体设计、封测2个环节与分立器件制造环节间的显著区位关联主要集中在花都、荔湾和黄埔区(图5),且关联强度存在较大差距(表4)。分立器件制造是广州建设半导体产业集群的关键主体,而设计和封测环节均对分立器件制造形成高度的区位依赖。其中,分立器件制造和设计类企业在黄埔区形成了显著的区位关联,LCLQ值约为1.79~2.25。由于分立器件制造需要针对不同厂商的设计方案而做出生产布局,而半导体设计作为直接面向应用系统厂商的关键环节,它与分立器件制造厂商之间事实上存在较强的知识和技术共享基础。分立器件制造与封测企业之间的LCLQ值在荔湾和黄埔两区分别高达50.01和37.69,生产环节上的连续性是导致这一结果的根本原因。此外,花都区内半导体设计对于材料制造企业的区位吸引力高达68.67,显著高于其他生产环节企业间的区位关联程度。这在很大程度上是由于本地化的产业政策及其规划围绕设计企业展开全产业链建设引导产业空间布局的结果。概言之,广州半导体产业布局正处于依靠分立器件为区位载体建设半导体全产业链的过程中。
图5
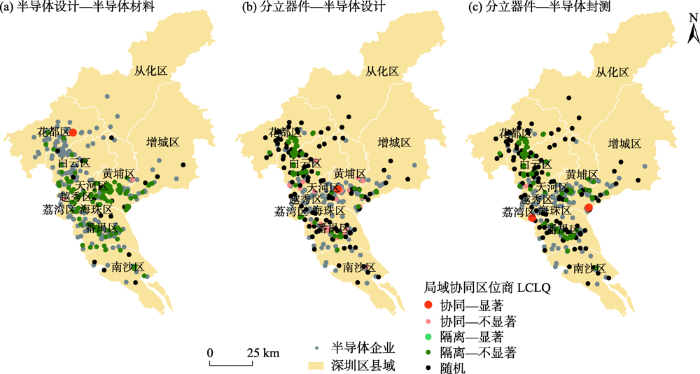
图5
广州市半导体产业局域协同区位商
注:分图中标题的基本范式为中心点属性—相邻点属性。
Fig.5
The LCLQ of semiconductor industry in Guangzhou City
表4 广州半导体产业LCLQ值显著性结果统计
Tab.4
| 显著点编号 | 中心要素 | 相邻要素 | LCLQ值 | P值 | 所属区县 |
|---|---|---|---|---|---|
| 1 | 设计 | 材料 | 68.67 | 0.02 | 花都区 |
| 2 | 分立器件 | 设计 | 2.25 | 0.02 | 黄埔区 |
| 3 | 分立器件 | 设计 | 1.79 | 0.02 | 黄埔区 |
| 4 | 分立器件 | 设计 | 1.79 | 0.04 | 黄埔区 |
| 5 | 分立器件 | 封测 | 50.01 | 0.04 | 荔湾区 |
| 6 | 分立器件 | 封测 | 37.69 | 0.04 | 黄埔区 |
3.2.2 深圳:上下游产业区位协同显著
深圳半导体产业的区位关联相较于广州更加具有全产业链特征,其中上下游企业间的区位关联较为完整,设计与设备生产环节是深圳半导体产业链布局的主要区位载体,这2个环节与其他环节均产生了显著的区位协同关系,是支撑深圳建设半导体全产业链的关键部分。首先,半导体设计与其他环节的区位协同关系集中分布在宝安、南山、光明及福田4个区(图6),但其LCLQ值存在较大差距(表5)。半导体设计企业在深圳的广泛分布直接导致了其与其他生产环节存在不对称的区位协同,尤其是晶圆制造与设计环节之间的LCLQ值在南山区达到58.03和26.77;分立器件制造与设计环节间的区位协同更多集中在福田与宝安,LCLQ值为9.27~14.80;封测企业对设计企业的区位依赖同样集中在福田、宝安和龙华3个区,LCLQ值为4.74~13.07。材料、封测与设备企业之间形成了相互的区位依赖,其LCLQ值为2.51~9.97,主要集中在宝安区与光明区。与之相比,材料与设备制造企业对于设计的区位依赖显著较低。从上述不同环节企业之间的LCLQ值结果中可以看出,深圳市已经基本构建完成本地化的半导体产业分工体系,尤其反映在深圳不同行政区均具有主导性的生产环节:南山区主要围绕设计和晶圆制造环节进行产业集群建设,宝安、福田、龙华3个区则承担着封测、制造材料和设备以及分立器件制造等需要综合性工业生产体系的重要环节。
图6
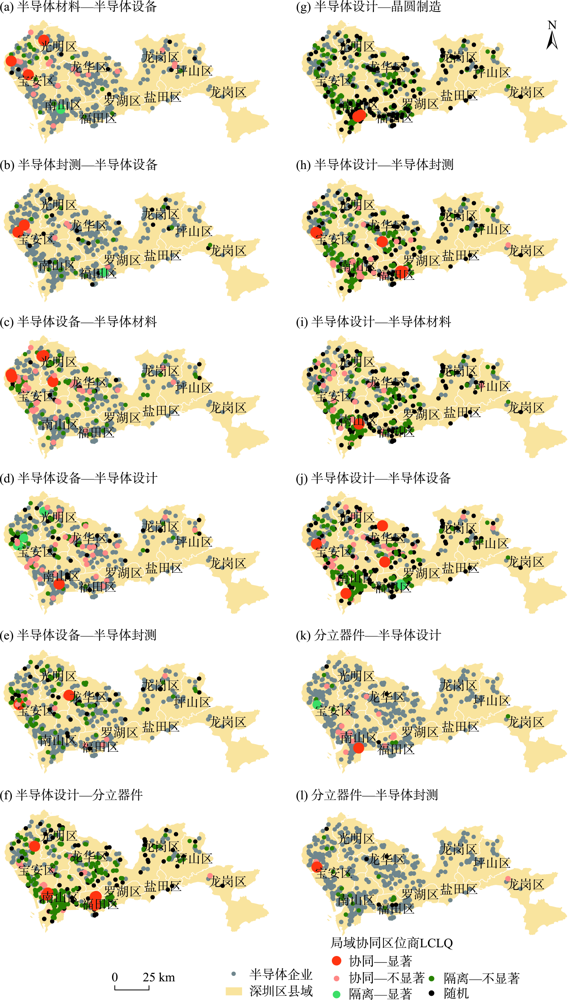
图6
深圳市半导体产业的局域协同区位商
注:分图中标题的基本范式为中心点属性—相邻点属性。
Fig.6
The LCLQ of semiconductor industry in Shenzhen City
表5 深圳半导体产业LCLQ 值显著性结果统计
Tab.5
| 显著点编号 | 中心 | 相邻 | LCLQ | P值 | 区县 | 显著点编号 | 中心 | 相邻 | LCLQ | P值 | 区县 |
|---|---|---|---|---|---|---|---|---|---|---|---|
| 1 | 材料 | 设备 | 4.45 | 0.02 | 宝安区 | 22 | 设计 | 晶圆制造 | 58.03 | 0.04 | 南山区 |
| 2 | 材料 | 设备 | 4.01 | 0.02 | 光明区 | 23 | 设计 | 晶圆制造 | 26.77 | 0.04 | 南山区 |
| 3 | 材料 | 设备 | 3.74 | 0.04 | 宝安区 | 24 | 设计 | 封测 | 13.07 | 0.04 | 龙华区 |
| 4 | 封测 | 设备 | 5.47 | 0.02 | 宝安区 | 25 | 设计 | 封测 | 6.43 | 0.02 | 福田区 |
| 5 | 封测 | 设备 | 2.51 | 0.04 | 宝安区 | 26 | 设计 | 封测 | 5.78 | 0.02 | 福田区 |
| 6 | 设备 | 材料 | 9.97 | 0.02 | 宝安区 | 27 | 设计 | 封测 | 5.76 | 0.02 | 福田区 |
| 7 | 设备 | 材料 | 9.87 | 0.02 | 宝安区 | 28 | 设计 | 封测 | 5.32 | 0.04 | 宝安区 |
| 8 | 设备 | 材料 | 8.75 | 0.02 | 宝安区 | 29 | 设计 | 封测 | 5.18 | 0.02 | 福田区 |
| 9 | 设备 | 材料 | 6.24 | 0.04 | 光明区 | 30 | 设计 | 封测 | 5.17 | 0.02 | 福田区 |
| 10 | 设备 | 材料 | 5.77 | 0.04 | 光明区 | 31 | 设计 | 封测 | 5.15 | 0.02 | 福田区 |
| 11 | 设备 | 材料 | 4.21 | 0.04 | 光明区 | 32 | 设计 | 封测 | 5.03 | 0.04 | 福田区 |
| 12 | 设备 | 设计 | 1.59 | 0.02 | 南山区 | 33 | 设计 | 封测 | 5.02 | 0.02 | 福田区 |
| 13 | 设备 | 封测 | 8.40 | 0.04 | 宝安区 | 34 | 设计 | 封测 | 4.74 | 0.02 | 宝安区 |
| 14 | 设备 | 封测 | 4.48 | 0.04 | 宝安区 | 35 | 设计 | 材料 | 7.64 | 0.02 | 南山区 |
| 15 | 设备 | 封测 | 3.92 | 0.04 | 宝安区 | 36 | 设计 | 材料 | 7.07 | 0.04 | 南山区 |
| 16 | 设计 | 分立器件 | 14.80 | 0.04 | 福田区 | 37 | 设计 | 设备 | 5.48 | 0.04 | 龙华区 |
| 17 | 设计 | 分立器件 | 13.34 | 0.02 | 宝安区 | 38 | 设计 | 设备 | 4.71 | 0.04 | 南山区 |
| 18 | 设计 | 分立器件 | 10.80 | 0.02 | 福田区 | 39 | 设计 | 设备 | 3.89 | 0.02 | 龙华区 |
| 19 | 设计 | 分立器件 | 10.69 | 0.04 | 宝安区 | 40 | 设计 | 设备 | 3.21 | 0.02 | 宝安区 |
| 20 | 设计 | 分立器件 | 9.68 | 0.04 | 福田区 | 41 | 分立器件 | 设计 | 1.55 | 0.02 | 南山区 |
| 21 | 设计 | 分立器件 | 9.27 | 0.04 | 宝安区 | 42 | 分立器件 | 封测 | 4.48 | 0.04 | 宝安区 |
3.3 珠三角地区半导体产业区位关联模式
基于协同区位商的区位关系量化结果,可以进一步提取出以广州和深圳为代表的珠三角地区半导体产业区位的基本关联模式。总体上,广州和深圳都存在着依靠设计、设备环节布局半导体产业链的基本动机,但实际形成的产业区位模式却具有差异性;即广州和深圳分别形成了以分立器件制造与设计和设备制造为重点的产业区位关联模式。对比全局和局域协同区位商结果,广州在形成设计、材料和分立器件制造专业化产业集聚的基础上,仅有分立器件制造与设计以及封测环节产生的区位关联塑造了其产业链建设的基本路径;而深圳则依赖于设计和设备制造2大环节构建了较为完整的半导体产业链,既形成了设计和设备制造的专业化集聚,也有效地与其他所有环节产生区位关联。
两座城市之间这种半导体产业区位关联模式的差异在珠三角地区极具代表性。广州和深圳作为珠三角地区的中心城市,在电子元器件制造、一般消费电子代工、数字技术服务等产业均具有不同程度的比较优势;然而在从中低端电子元件制造向系统化的半导体产业链转型的过程中却出现了差异化结果。广州更加侧重于半导体电子元件的一体化生产;由于分立器件制造既具有传统电子元件的基本属性,也是当前半导体产业中相对边缘化的业务环节,依靠该环节构建产业链具有前期投资成本较低、集群建设较快的基本优势。从国内半导体产业发展历史来看,相较于北京、河北、上海、无锡、绍兴等城市,由于缺乏半导体集成电路本地化的知识和技术基础,广州半导体产业起步较晚;同时,长期从事中低端电子元件加工已经形成了潜在的产业发展的路径依赖。所以,通过分立器件制造吸引其他关联环节的集中布局是广州在建设半导体产业链过程中的重要区位模式。与广州形成鲜明对比的是,深圳通过半导体设计和设备制造2个关键环节来主导半导体产业链在内部不同行政区之间的区位模式。半导体设计为导向的区位模式来源于其承担着半导体产业链与数字技术服务产业链之间的生产关联。由于对移动通信、智能终端、娱乐电子等行业企业定制化业务深度嵌入的现实需要,半导体设计事实上具有相关知识和技术的转化功能,使半导体作为一种中间品更容易进入更大尺度的数字服务产业链。深圳在下游半导体应用产业的巨大优势为半导体设计提供规模化、多元化的设计需求;同时以计算机科学和互联网为新经济支柱的产业结构也为半导体设计业的长足发展奠定了年轻的高素质劳动力及产业衍生基础。半导体设备制造在深圳与封测和材料制造的区位关联模式则具有工业集群建设的一般特征。设备与材料是半导体制造和封测环节的必要支撑,3个生产环节事实上具有连续性和不可分离性。即在很大程度上,深圳围绕半导体封测已经形成了材料和设备生产的本地化,这是深圳半导体全产业链基本成型的重要证据。就珠三角地区整体而言,其半导体产业集聚的基础事实上是依靠参与全球电子信息制造业价值链的组装代工而形成。改革开放后,珠三角地区依赖外资从初级电子加工逐步构建起电子信息制造产业集群,以专业镇和开发区为基本单元参与全球电子信息制造业的价值链循环过程,由此形成了地区内不同城市在半导体产业链上不同生产环节及其相应增值能力的异质性,这也进一步导致不同环节的企业布局也存在显著的空间异质性。
4 结论
产业布局及其区位模式的探索和讨论是经济地理研究中的基础问题之一。本文针对半导体产业链中不同环节企业在珠三角地区的布局区位问题展开探讨,引入基于最近邻原则的协同区位分析方法,并将不同环节企业的全局和局域协同区位商作为关键变量,识别和分析广州和深圳两大重点城市半导体产业的空间关联模式,旨在呈现半导体产业链内部不同环节企业之间的空间关系。研究所得到的关键结论如下:
珠三角地区半导体产业空间上总体形成以广深莞地区为主导的“核心—边缘”结构。半导体设计在珠三角地区内分布最为广泛,其数量及资本规模占据主导地位,是主要城市进入半导体产业链体系中的普遍选择;同时与半导体设备以及分立器件制造企业同样呈现出“多而小”的基本规模特征。晶圆制造企业数量极少,但资本规模较大,表现为少数大型企业形成的行业垄断态势。
广州和深圳作为珠三角地区半导体产业发展的中心城市,两地形成了不同环节的产业集聚及其区位关联模式。广州在材料、设计和分立器件制造环节上存在显著的产业集聚特征,分立器件制造是其半导体产业链布局的主体环节,仅与设计和封测环节存在显著的区位关联。深圳已经构建了以设计和设备2大环节专业化集群为主体的全产业链,尤其是设计与晶圆制造的区位协同关系较强。广州在局域尺度下的半导体产业区位关联显著性与深圳存在明显差距,深圳半导体产业链构建比广州更加完整。
广深两地半导体产业的区位关联模式形成与本地产业结构有关。在从一般电子元器件向半导体产业系统建设的过程中,分立器件制造环节的集聚有利于降低广州本地对半导体全产业链建设大规模前期投入带来的布局风险,而深圳能够围绕设计和设备构建全产业链的重要动力来自于数字技术和移动互联网企业在本地的大量集聚,通过半导体设计业务的定制化供需关系奠定了相关的知识、技术和人才基础。
参考文献
China's emerging role in the global semiconductor value chain
[J].
全球集成电路产业: 成长、迁移与重塑
[J].
Global integrated circuit industry: Evolution, migration and reconstruction
The US semiconductor industry: A locational analysis
[J].DOI:10.1068/a190875 URL [本文引用: 1]
The global assembly-operations of US semiconductor firms: A geographical analysis
[J].DOI:10.1068/a201047 URL [本文引用: 1]
Institutions, information processing, and organization structure in research and development: Evidence from the semiconductor industry
[J].DOI:10.1016/S0048-7333(99)00035-9 URL [本文引用: 1]
产业集群与浦东集成电路产业建设
[J].
Industrial clusters and the development of Pudong IC industry
基于全球性互动的地方产业网络发展研究: 以上海浦东 IC 地方产业网络为例
[J].
Development of local industrial network based on global interaction: A case study
价值链空间形态演变下的治理模式研究: 以集成电路(IC)产业为例
[J].
Study of value chain governance based on the change of value chain from the space perspective: Case of IC industry
嵌入性与FDI驱动型产业集群研究: 以上海浦东 IC 产业集群为例
[J].
Study of embeddedness and FDI-driven industrial cluster: Case of Pudong IC industrial cluster
The colocation quotient: A new measure of spatial association between categorical subsets of points
[J].DOI:10.1111/j.1538-4632.2011.00821.x URL [本文引用: 1]
Geographically weighted colocation quotients: Specification and application
[J].DOI:10.1080/00330124.2013.768130 URL [本文引用: 1]
中国公司地理研究进展及特色凝练
[J].
Progress of corporate geography research in China
中国工业地理学的传承发展与转型
[J].
DOI:10.11821/dlxb202108001
[本文引用: 1]

本文基于1934—2019年《地理学报》期刊发表的154篇工业地理学论文分析中国工业地理发展脉络与主要领域研究进展。中国工业地理在融合了西方工业地理理论和苏联工业地理理论基础上,结合中国实际情况逐渐发展出兼顾理论研究和实践双重任务驱动下的特色学科体系,在经历了诞生探索、成长总结、视角转换、稳步发展4个阶段后,学科内容和范式逐渐与国际接轨,成长为一门相对成熟且具有重要意义的学科。在学科建设方面,未来需要继续服务社会经济建设,增强理论创新能力,加强新技术手段应用,结合中国制度环境推动建设中国特色的工业地理学。
The inheritance, development and transformation of industrial geography in China: Based on analysis of articles published in Acta Geographica Sinica during 1934-2019
DOI:10.11821/dlxb202108001
[本文引用: 1]
It is very important to summarize the research, understand the development process and direction of industrial geography in China scientifically under the context of the development of international industrial geography. Based on 154 papers on industrial geography published in Acta Geographica Sinica from 1934-2019, this paper reviewed the development process of industrial geography in China and the progress of research in major fields. This paper showed that China's industrial geography is a unique theoretical system based on the integration of Western industrial geography theory and Soviet-style industrial geography theory, under the tasks of theory development and practices. Going through exploration, growth, perspective changing and deepening, industrial geography is gradually brought into line with the international researches on the content and paradigm. The development of discipline needs to meet the national strategic demand, raise theoretical innovation capacity, strengthen the application of new methods and techniques, and develop theories of industrial geography with the Chinese institutional context.
制造业内部产业关联与空间分布关系的实证研究
[J].
DOI:10.11821/dlyj201510012
[本文引用: 1]
聚焦于中国制造业内部的产业关联与空间分布,基于《中国投入产出表》中涉及的17个制造业细分行业和中国286个地级市空间单元的统计数据,研究与某一制造业细分行业具有较强产业关联的其他制造业细分行业与其空间分布之间是否存在相关性,并进一步分析产业关联强且具有空间关联的产业组合的主要特征。研究表明,在68个产业关联较强的产业组合中,有39个产业组合具有空间关联;产业关联较强的劳动/劳动密集型制造业和资本/技术密集型制造业更容易呈现空间关联;超过半数的制造业细分行业的产业关联和空间关联的程度之间存在正相关。此外,在产业特征分析基础上,利用GWR模型对39个产业关联强且具有空间关联的产业组合的空间关联度在空间分布上的特征和差异进行分析。结果显示,产业组合的空间关联度较高区域多分布在中等发展水平省区,而在经济发达或欠发达省区分布较少;东北三省区空间关联度较高的产业组合基本一致,产业发展情况较为相似。
Industrial linkage and spatial distribution of manufacturing industry
DOI:10.11821/dlyj201510012
[本文引用: 1]
The spatial distribution of the manufacturing industry based on industrial linkage has always been an important research topic. Using statistical data of 17 manufacturing industry segments in China (input-output table) and 286 prefecture-level spatial cells, this paper carries out input-output analysis and uses spatial regression models to determine the industrial linkage and spatial distribution of the manufacturing industry in China. Employing ordinary least squares (OLS), spatial lag regression model (SLM) and spatial error regression model (SEM), this paper determines whether there are correlations on spatial distribution between some manufacturing industry segments; it also aims to determine whether the distribution has strong industrial linkage to a specific segment. This paper also examines the characteristics of the industrial combinations with both strong industrial linkage and spatial correlation. Results show that, firstly, in 68 industrial combinations, 39 of these have both strong industrial linkage and spatial correlation, which proves the Marshallian externalities to some extent. Secondly, labor/labor-intensive manufacturing industries and capital/technology-intensive manufacturing industries can easily form such industrial combinations. Third, more than half of the manufacturing industry segments have positive correlations between industrial linkage and spatial correlation. Finally, "pgdp", "city", “kmt", and "zone" have good feedback, indicating that these elements have effects on the spatial distribution of the manufacturing industry in China. Apart from industrial combinations, this paper uses geographically weighted regression model (GWR) to study the spatial distribution of the degree of spatial correlation of 39 industrial combinations. Results show that industrial combinations with higher degree of spatial correlations are generally located in developing provinces (Heilongjiang, Jilin, Liaoning, Inner Mongolia, Shanxi, Hunan and Jiangxi), and not in developed provinces (Beijing, Tianjin, Jiangsu, Shanghai and Zhejiang) or under-developed provinces (Ningxia, Qinghai, Xinjiang and Tibet). Parts of the spatial distribution of the degree of spatial correlation of industrial combinations have regularities. Labor/labor-intensive manufacturing industries and capital/technology-intensive manufacturing industries differ in terms of the spatial distribution of the degree of spatial correlation. Moreover, the industrial combinations with higher degree of spatial correlations are basically the same in Heilongjiang, Jilin, and Liaoning. To ensure the future development of the manufacturing industry, the government should pay more attention to the mutual coordination and spatial correlation between manufacturing industry segments with strong industrial linkage. Formulating corresponding industrial linkages based on different manufacturing industry divisions and geographic spaces shall also play a positive role in the optimization of the spatial layout, further transforming and upgrading the manufacturing industry in China.
Geographic differences in the distribution of manufacturing firms in Ontario, Canada
[J].DOI:10.1111/area.12615 URL [本文引用: 1]
珠三角新晋跨境制造业企业地理集聚与区位选择
[J].
DOI:10.18306/dlkxjz.2019.10.013
[本文引用: 1]
珠三角的跨境资本因其文化多元性、地缘特殊性而受到国际经济地理学家的广泛关注,“多元资本主义”等多种理论框架被提出以解释其特殊性。然而,由于数据、方法的限制,相关研究多停留于理论及定性探讨层面,基于微观企业样点的研究较为欠缺,特别是纳入企业异质性等新经济因素的定量模型研究更为缺乏。论文基于微观企业样点数据,综合考虑传统一般经济因素与制度、集聚、创新、企业异质性等新经济因素,采用核密度分析方法以及空间回归分析,研究了2005—2009、2009—2013年2个时段的珠三角新晋跨境制造业企业(new-born cross-border manufacturing firms, NCMF)的空间分布格局与差异,并重点关注金融危机前后(2005—2009年)这一特殊的经济转型时期,珠三角NCMF区位选择的影响机制。结果表明:①珠三角NCMF的空间集聚程度较以往有所降低,2005—2009年与2009—2013年2个时段的NCMF在结构与分布特征上呈现出较大的差异,热点区位在2005年后开始由珠三角东岸地区向西岸拓展,2009年后则再次呈现以东岸为主的集聚特征;②金融危机前后,珠三角的发展动力发生了根本性的变化,以往吸引跨境制造业企业的劳动力成本优势与开发区政策优势逐步弱化,而集聚因素、创新因素以及企业异质性成为影响跨境制造业企业空间集聚与区位选择的关键影响因素;③处于动力转换期的珠三角,需要通过构建完善的制度环境、建立创新网络、增强要素集聚、根据企业偏好制定多元化引资政策来重新获得发展的新优势。论文旨在从企业微观层面揭示经济区域内部的外商直接投资区位,同时也为理解转型时期中国以珠三角为代表的外向型经济区域的动力转换与空间重构提供实证参考。
Geographical agglomeration and location factors of the new-born cross-border manufactural firms in the Pearl River Delta
DOI:10.18306/dlkxjz.2019.10.013
[本文引用: 1]
The cross-border capital of the Pearl River Delta has received extensive attention from international economic geographers because of its cultural diversity and geopolitical specificity. The theoretical model of "hybrid capitalism" was proposed base on this. However, due to the limitations of data and methods, relevant research mostly stays at the level of theoretical and qualitative exploration. The research based on firm-level samples is deficient, especially quantitative models that incorporate the new economic factors such as firm heterogeneity. Based on the sample data of enterprises, this study synthetically considered the traditional economic factors and new economic factors such as institution, agglomeration, innovation, and firm heterogeneity. In order to explain the mechanism of foreign direct investment (FDI) location choice from the firm level, we also combined a spatial analysis method and spatial regression model. Kernel density spatial analysis and spatial lag modeling based on firm samples were conducted to uncover the geographical agglomeration characteristics and location factors of the new-born cross-border manufacturing firms (NCMF) in the Pearl River Delta (PRD) during 2005-2009 and 2009-2013. To explore the location choice mechanism of FDI in the transitional period, we also focused on the impact mechanism of location choice of NCMF in the PRD before and after the global financial crisis (2005-2009). The main results are as follow: 1) The spatial agglomeration of the NCMF in the PRD is lower than before. The NCMF in the two periods of 2005-2009 and 2009-2013 showed great differences in structure and distribution characteristics. The hotspot of firm distribution began to expand from the east coast of the PRD to the west side after 2005, and after 2009, firm agglomeration in the east coast was again obvious. 2) After the global financial crisis, the development momentum of the PRD has undergone fundamental changes. The advantages of low labor cost and preferential policies of development zones that attracted cross-border manufacturing firms have gradually weakened, while agglomeration factors, innovation factors, and firm heterogeneity have become the key factors that affect the spatial agglomeration and location choice of NCMF. 3) In the period of a dynamic transformation, the Pearl River Delta needs to regain its new advantages of development by building a sound institutional environment, establishing innovation networks, enhancing factor agglomeration, and formulating diversified investment policies according to firm preferences. This study examined the location choice of FDI within the economic region using the firm-level data, and may provide an empirical reference for understanding the dynamic transformation and spatial reconstruction of the export-oriented economic region represented by the Pearl River Delta in China during the transition period.
基于点状数据的上海都市型工业空间格局研究
[J].
DOI:10.11821/dlyj201509000
[本文引用: 1]
镶嵌于城市地域的都市型工业,有着其独特的区位特征和空间格局。基于2008年上海都市型工业微观企业数据,探讨工业郊区化背景下都市型工业空间分布、集聚特征以及行业间的空间邻近关系。研究表明:上海都市型工业企业区位选择具有中心城区与近郊区双重指向性,在距离城市中心10~20 km区间都市工业分布最密集,空间分布的非均质特征明显。空间集聚以城市内各类园区(商业楼宇、都市工业园、工业园区)为主要载体,集聚格局在行业间存在一定差异。在空间邻近关系方面,各行业间呈现出基于相同要素投入、生产关联、共同市场、政策导向的邻近布局以及基于异质排他性、环境要求的弱邻近布局特征。
The spatial pattern of Shanghai urban industry based on point data
DOI:10.11821/dlyj201509000
[本文引用: 1]
The urban industry is embedded in the city area which has its unique location characteristics and spatial pattern. Based on the micro-data of Shanghai urban industry enterprises in 2008, with the methods of location quotient, hot spot analysis and proximity index analysis, the paper explores the spatial distribution and the agglomeration characteristics of urban industries, as well as the spatial proximity relations among various industries during the process of industrial suburbanization. Results show that: First of all, the location choice of urban industry enterprises in Shanghai has a dual directivity to both central city and suburban areas, the range of 10~20 kilometers from city center is the densest area of urban industries, and the overall spatial distribution of urban industries has obvious heterogeneous characteristics. Food processing, packaging and printing, manufacture of tourism crafts and manufacture of small-scale electronic information constitute comparative advantage industries of central city, manufacture of interior adornment composes the comparative advantage industry of suburbs, and clothing accessories industry and manufacture of makeup and washing supplies constitute comparative advantage industries of suburban regions. Secondly, all kinds of industrial parks including commercial buildings, urban industrial zones and industrial estates in the city have become the major carrier of spatial agglomeration, which present "crater" gathering morphology. There are also some differences among the inter-industry according to the pattern of spatial agglomeration. Thirdly, when it comes to the spatial proximity relations, aside from being affected by some factors including the local government development policies, economic history basis and traffic location, the layout between all urban industries shows the following characteristics: the proximity layout is based on the same factor inputs, productive correlation, common market and policy orientation while the weak proximity layout is based on the heterogeneous exclusivity and environmental requirements.
中国新创通信设备制造企业空间格局及其影响因素研究
[J].
DOI:10.18306/dlkxjz.2021.06.002
[本文引用: 1]
通信设备制造业是中国国民经济的重要产业。近年来,中国通信设备制造业发展迅速,其空间格局呈现出新的特征。论文基于中国2013年规模以上通信设备制造业企业数据、2014—2019年成立的通信设备制造企业数据,运用核密度分析、负二项回归分析等方法,分析中国新创通信设备制造企业空间格局及其影响因素。研究发现:① 中国新创通信设备制造企业趋向在该产业基础较好的珠三角、长三角、京津冀、成渝4大城市群集聚,其中以深圳为中心的珠三角产业集聚优势更加明显;② 在4大城市群内部,新创通信设备制造企业从核心地区向外围地区扩散;③ 该产业原有产业基础较弱的南昌市、红河州、郑州市、贵阳市等中西部地区,也集聚了一些新创通信设备制造龙头企业;④ 城市的知识复杂性和原有产业基础对所有类型新创通信设备制造企业进入具有正向的影响,产业关联密度有助于增加内资和大规模企业进入的机会,非相关多样化有利于外资企业和大规模企业进入,全球化和政府力量分别有助于外资企业、大规模企业进入。
Spatial pattern and underlying factors of new telecommunication equipment ventures in China
DOI:10.18306/dlkxjz.2021.06.002
[本文引用: 1]
Telecommunication equipment manufacturing is a pillar industry of the Chinese economy. Its spatial distribution has been evolving in recent years due to the rapid development of the industry. This study analyzed the spatial pattern and underlying factors of new telecommunication equipment ventures with detailed firm-level data from the National Enterprise Credit Information Publicity System and China's Annual Survey of Industrial Firms, as well as analytical methods including kernel density analysis and negative binomial regression. The analysis points to the following key findings: 1) China's new telecommunication equipment manufacturing ventures tend to cluster in four leading city-regions—the Pearl River Delta, Yangtze River Delta, Beijing-Tianjin-Hebei Area, and Chengdu-Chongqing Area. 2) Within these four city-regions, firms in this industry have been diffusing from central cities to the peripheries. 3) A few clusters of leading firms have been observed in inland regions previously with limited bases for this industry, such as Nanchang, Honghe, Zhengzhou, and Guiyang cities. 4) Knowledge complexity and the existing industrial base of cities are positively associated with the entry of all new firms. The density of related industries is positively associated with the entry of domestic enterprises and large-scale enterprises. Unrelated variety correlates with the entry probability of foreign-invested enterprises and large-scale enterprises. Furthermore, our analysis suggests that globalization and government intervention are associated with the entry of foreign-invested and large-scale enterprises, respectively.
The geography of industry 4.0 technologies across European regions
[J].DOI:10.1080/00343404.2021.1884216 URL [本文引用: 1]
新一代信息技术企业空间分布特征及影响因素: 以南京市中心城区为例
[J].
Spatial distribution characteristics and influencing factors of new-generation information technology companies: A case of Nanjing central city
DOI:10.1080/00130095.1966.11729843 URL [本文引用: 1]
城市文化创意产业微区位模型及杭州案例
[J].
Micro-location model of urban cultural & creative industries and its application in Hangzhou
兰州市生产性服务业的空间集聚及其影响因素
[J].
The spatial agglomeration characteristics and its influencing factors of producer services in Lanzhou
北京典型行业微区位选址比较研究: 以北京企业管理服务业和汽车制造业为例
[J].
DOI:10.11821/dlyj201812014
[本文引用: 1]
以微观企业数据为基础,采用核密度空间平滑和条件逻辑选择模型等方法,重点关注企业在城市内部微观尺度下的区位选择,并对北京典型现代服务业和制造业区位选择的差异进行对比分析。结果表明:① 北京中小型制造企业倾向于在集聚区分布,符合马歇尔式产业集群的特征,而服务业则是大型企业更倾向于集中布局;② 尽管微观尺度下多样化和上下游产业链对现代服务业和制造业依然有重要影响,但是与宏观尺度下不同的是对于现代服务业来说过度多样化并不利于其发展,对于制造业来说区域专业化劳动力规模而非专业化程度更为重要;③ 政府对地铁等公共设施布局选址将对现代服务业的微观区位产生重要影响。
Comparative study on micro-scale location choice of typical industries: The case study of management service and automobile manufacturing in Beijing
DOI:10.11821/dlyj201812014
[本文引用: 1]
Industrial location has attracted much attention since classical location theories were built, but most of literature focused on location choice at macro scale. However, micro-scale location choice became a troublesome problem due to the reduction of land and the increase of land price. The research employed a unique micro-firm dataset to identify industrial agglomeration areas of service and manufacturing industries in Beijing and then uncovered factors which have impact on micro-scale location choice within urban areas. Importantly, the result further showed difference of location choice between two typical economic sectors--management service and automobile manufacturing in Beijing. The findings are obtained as follows: (1) 102 service and 130 manufacturing agglomeration areas were identified by firm and employment densities. Firms within these two kinds of agglomeration areas accounted for 72.66% and 44% in service and manufacturing industries respectively. Generally, most of large service firms had concentrated into those service clusters, while large manufacturing enterprises used to be located otherwise. Compared with large firms, small and medium-sized manufacturing firms were more inclined to distribute in agglomeration areas. (2) Although the results showed that urbanization economies had significant effect on location choice of both modern service (representing by management service) and manufacturing industry (representing by automobile manufacturing), the influence mechanisms are completely different. The former prefers a diversified local labor market and relatively diversified industrial environment, while the latter needs a complete industry supplying chain. It is only because the automobile industry has a diverse and comprehensive range of auto parts, it seems that automobile manufacturing firms prefer diversified environment. Naturally, upstream and downstream industry chains and specialized labors are key factors for location choice of automobile firms. Even for the service industry, it is not the more diversified the better at the micro scale. (3) Different from existing literature, the results showed that industrial policies had more influence on service than manufacturing industry. It is partly because one of important factors for location of management service is public infrastructure such as subway, on which local governments have enough impact; and partly because, automobile, as an advanced manufacturing industry, is not among the negative list of manufacturing. Besides, enterprise property has significant influence on location choice of both industries.
Synergy and co-agglomeration of producer services and manufacturing: A panel data analysis of Chinese cities
[J].DOI:10.1080/00343404.2012.756580 URL [本文引用: 1]
Co-location of manufacturing and producer services in Nanjing, China
[J].DOI:10.1016/j.cities.2016.12.021 URL [本文引用: 1]
上海大都市区物流企业区位分布特征及其演化
[J].
Study on the distribution characteristics and evolution of logistics enterprises in Shanghai metropolitan area
金融业协同集聚的空间分异研究: 基于深圳金融企业选址的观察
[J].
Research on spatial differentiation of financial industry co-agglomeration: Based on the observation of location selection of financial enterprises in Shenzhen
Identification method and empirical study of urban industrial spatial relationship based on POI big data: A case of Shenyang City, China
[J].DOI:10.1016/j.geosus.2020.06.003 URL [本文引用: 1]
新零售背景下连锁店区位选择及其空间关联特征
[J].
DOI:10.13284/j.cnki.rddl.003353
[本文引用: 1]
零售活动的空间关系研究是城市地理学研究的一个热点问题。以上海市内环地区的星巴克、COSTA和瑞幸咖啡三家咖啡连锁公司的门店为研究对象,综合运用多种空间统计方法和实地调研分析三者之间的空间关联特征。结果表明:1)无论是传统零售还是新零售模式下的咖啡门店,其空间分布均大致表现出靠近消费市场的空间导向特征;2)星巴克门店的空间集聚程度最强,瑞幸咖啡门店空间集聚程度最弱;3)利用一种新的多元空间统计方法计算后发现,无论是传统咖啡零售星巴克和COSTA的门店,还是星巴克与新零售瑞幸咖啡的门店,均呈现显著相互吸引的空间关联特征,但其形成机制存在差异;4)星巴克与COSTA常常成对出现在商圈或商务区中心位置,而后进入市场的瑞幸咖啡门店常常位于“非中心”位置。新零售模式可以通过互联网平台、大数据分析等技术重构交易基础逻辑,改变传统零售依赖门店的成本结构模型;同时,新零售模式高度重视用户线上体验,在一定程度上弱化了实体区位的重要性。因此,在进行城市规划,特别是商业区规划时,应重视新零售模式对区位选择的影响,重视互联网与大数据在区位决策中的作用,挖掘传统弱区位地区或地段的发展可能性,提高城市土地利用效率。
Location selection and correlation characteristics of chain stores against the background of new retail
DOI:10.13284/j.cnki.rddl.003353
[本文引用: 1]
Research on the spatial relationship of retail activities is a hot topic in urban geography. With the continuous upgrade of Internet technology, the development mode of business has evolved from the traditional retail model into the e-commerce model, and now the new retail model. While the new retail model influences the locational decision-making behavior of enterprises, it also affects the intrinsic mechanism of attraction and avoidance among retail stores, which in turn affects the spatial association relationship of commercial retail. In such a context, we take the Starbucks, COSTA, and Luckin Coffee stores in Shanghai's inner ring as our research objects, and use a variety of spatial statistical methods and field research to analyze the spatial correlation characteristics among the three. The results show that, first, the spatial distribution of coffee stores under both traditional and new retail models generally exhibit the spatially oriented characteristics of being close to the consumer market. Therefore, it can be indirectly inferred that although Luckin Coffee, which is characterized by new retail, can create "infinite space" to meet consumers' consumption needs in different spaces by virtue of its own Internet development advantage, it remains difficult to completely break away from the spatial orientation of the offline consumption market. Second, in terms of spatial agglomeration, Starbucks' high sensitivity to specific consumer groups and its sales strategy of providing a comfortable environment have led the business to open stores in dense proximity in locations with high consumption potential, thus contributing to its strongest spatial agglomeration. Luckin Coffee, by contrast, has a certain degree of flexibility in choosing store locations due to its independent instant delivery service, and in order to occupy a wider market as soon as possible, it chooses store locations in favor of uniform coverage, resulting in the weakest degree of spatial agglomeration. Third, based on multivariate spatial statistics, it can be seen that Starbucks, COSTA, and Luckin coffee stores all exhibit positive spatial relationship characteristics in the two corresponding spatial relationships. Among them, traditional coffee retailers Starbucks and COSTA show a more obvious spatial relationship of mutual attraction, indicating that both can increase their market shares by converting the fierce price competition between them into an attraction drive to increase their total profits. At the same time, the stores of traditional retailer Starbucks and new retailer Luckin Coffee also show a significant spatial relationship of mutual attraction in space, indicating that the market share effect dominates. Finally, micro-location analysis reveals that Starbucks and COSTA stores have a stronger mutual attraction relationship and often appear in pairs in the center of shopping districts or business areas, while Luckin Coffee stores are often located in "non-central" areas. As a representative of new retail, Luckin Coffee can make up for its location disadvantage to a certain extent by virtue of its mobile application online service and instant delivery service. The store can also utilize its Internet platform, big data analysis, and other technical advantages, so that it can combine its own product positioning characteristics when choosing store locations, and accurately find potential store locations and opening models. Therefore, when carrying out urban planning, especially the planning of commercial areas, attention should be paid to the impact of the new retail model on location selection, the role of the Internet, and big data in location decision making. The development possibilities of traditionally weaker locations should be explored, and the efficiency of urban land use should be improved.
基于协同区位商的北京城市职住要素空间关联
[J].
DOI:10.11821/dlxb202106005
[本文引用: 2]
就业地和居住地是城市居民工作以及生活的主要场所,同样也是城市空间结构最重要的组成要素,写字楼与居民楼空间关联性研究对深刻理解职住关系有着至关重要的作用。利用协同区位商方法,对北京市写字楼与居民楼空间关联总体特征和局域空间关联格局进行分析。研究表明:① 协同区位商作为一种测量点要素之间联系的方法,能够很好的应用到职住关系的研究中,对丰富职住关系度量指标体系也具有非常重要的意义。② 对北京市的实证分析结果显示,北京市写字楼与居民楼全局协同区位商值小于1,空间关联性较差,表明职住要素的空间联系总体较弱。③ 局域协同区位商的分析表明,北京写字楼与居民楼局域空间关联格局差异明显,不仅不同区域两者空间关联性强弱差别显著,而且不同价位的居民楼和写字楼展现出不同的空间关联特征。④ 北京职住要素空间关联性深受写字楼、居民楼本身布局的影响,其主要影响因素还需要进一步全面分析,加强此领域研究,将有助于城市规划中职住要素的合理空间布局。
Spatial correlation analysis of residential and employment elements in Beijing based on collaborative location quotient
DOI:10.11821/dlxb202106005
[本文引用: 2]
Places of employment and residence are the main spaces in which urban residents work and live, as well as key elements of the urban spatial structure. Hence, thorough investigations of the spatial correlations of office and residential buildings are of great significance for the understanding of the spatial relationships of urban elements, especially that of job-housing relationships. In this study, the objects of the research were office and residential buildings in Beijing, China, and the global and local characteristics of the spatial relationships between job-housing elements were investigated using the collaborative location quotient method. The results demonstrate that: (1) The co-location quotient, a method used to measure the spatial correlations of point elements of a survey, can be effectively applied in studies of job-housing relationships, and contributes indicators and a method for the measurement of job-housing relationships. (2) The empirical analysis reveals that the global co-location quotient (GCLQ) of office and residential buildings in Beijing is below 1, indicating relatively weak spatial correlations of the job-housing elements in the city, which is consistent with the increasing job-housing separation. Overall, residential buildings are more attracted by office buildings, suggesting that the location selection of residential buildings is affected by the local distribution of office buildings, whereas the local distribution of office buildings is barely a consideration for the location selection of residential buildings. (3) The results of the local co-location quotient (LCLQ) demonstrate that the local relationships of office and residential buildings in Beijing vary significantly in space. As the distance from the urban center increases, the LCLQ of residential buildings to office buildings decreases, while the LCLQ of office buildings to residential buildings increases. Moreover, the spatial relationships of urban job-housing elements in the north and south areas of Beijing, the dividing line of which is Chang'an Avenue, are significantly different; the spatial correlation of office and residential buildings in the north area is relatively strong, while that in the south area is relatively weak (i.e., the distribution of residential buildings is independent of that of office buildings). Additionally, the result show that the spatial relationships of office and residential buildings are related to their prices. (4) Recently, researchers have turned from studies of the urban hierarchical structure based on theories of "the space of places" to studies of the trends of "the space of flows", namely population flow, logistics flow, and information flow. This study shares a similar logic, as it investigates the urban spatial structure from the perspective of elemental correlation. This research is of great significance for the understanding of the functional zones of living, working, recreation, and transportation in cities, and relevant studies will contribute to the reasonable spatial layout of job-housing elements in urban planning.
The colocation quotient: A new measure of spatial association between categorical subsets of points
[J].DOI:10.1111/j.1538-4632.2011.00821.x URL [本文引用: 2]
Local indicator of colocation quotient with a statistical significance test: Examining spatial association of crime and facilities
[J].DOI:10.1080/00330124.2016.1157498 URL [本文引用: 2]
Location patterns of urban industry in Shanghai and implications for sustainability
[J].
DOI:10.1007/s11442-017-1410-8
[本文引用: 2]
China’s economy has undergone rapid transition and industrial restructuring. The term “urban industry” describes a particular type of industry within Chinese cities experiencing restructuring. Given the high percentage of industrial firms that have either closed or relocated from city centres to the urban fringe and beyond, emergent global cities such as Shanghai, are implementing strategies for local economic and urban development, which involve urban industrial upgrading numerous firms in the city centre and urban fringe. This study aims to analyze the location patterns of seven urban industrial sectors within the Shanghai urban region using 2008 micro-geography data. To avoid Modi?able Areal Unit Problem (MAUP) issue, four distance-based measures including nearest neighbourhood analysis, Kernel density estimation, K-function and co-location quotient have been extensively applied to analyze and compare the concentration and co-location between the seven sectors. The results reveal disparate patterns varying with distance and interesting co-location as well. The results are as follows: the city centre and the urban fringe have the highest intensity of urban industrial firms, but the zones with 20-30 km from the city centre is a watershed for most categories; the degree of concentration varies with distance, weaker at shorter distance, increasing up to the maximum distance of 30 km and then decreasing until 50 km; for all urban industries, there are three types of patterns, mixture of clustered, random and dispersed distribution at a varied range of distances. Consequently, this paper argues that the location pattern of urban industry reflects the stage-specific industrial restructuring and spatial transformation, conditioned by sustainability objectives.
