

旅游需求是刺激内需、促进国内大循环形成的重要途径。新冠肺炎疫情暴发以来,虚拟博物馆等虚拟旅游业态迅速发展[4],愈益引起各方对虚拟旅游流的重视。区域间复杂的虚拟旅游流网络系统反映了区域间旅游需求倾向的相互关系及空间结构。全面地分析虚拟旅游流网络的空间结构及其演变趋势,对引导区域间的交流与合作、实现旅游资源的有效利用与配置、促进区域协调发展至关重要。遗憾的是,研究者对于虚拟旅游流及其空间网络结构变化的研究还相对较少。
国外学者较早地运用计量统计方法对旅游流进行了研究,包括经济水平与旅游流的关系[7]、旅游流量预测[8]、气候变化对旅游流季节性的影响[9]、旅游流空间网络结构[10]、国际贸易环境对旅游流的影响[11]等。从20世纪80年代起,国内大批地理学者从地理空间分布视角去研究旅游流的空间结构特征。这些研究主要着眼于出入境旅游流的空间结构[12⇓-14]、国内中微观尺度的旅游流空间结构[15-16]、旅游流理论探究[17-18]等方面。随后,大量研究者就旅游流空间分布与空间场效应[19-20],旅游流与区域经济、交通、环境等的耦合协调度[21⇓-23],旅游流与交通流、信息流、贸易流的相关性[24⇓-26]等展开研究。研究方法逐渐涉及计量统计[27]、社会网络分析与GIS空间分析[28-29]等多元方法。
新冠肺炎疫情以来,中国各地采取防控措施,旅游者流动受到限制,线上云旅游持续走热。自2020年2月起,各地政策逐步放开,旅游需求及网络搜索强度增强,虚拟旅游流受到越来越多学者关注。一些学者注意到百度指数数据可获得性高,兼具虚拟旅游流流向与流量特性,进而从区域流入与流出视角对虚拟旅游流空间结构进行研究。李山等[30]较早地运用百度指数对旅游景区网络空间关注度进行了研究,发现了旅游地关注度的“前兆效应”。随后,大量学者利用百度指数进行的相关研究证明,通过百度指数得到的网络关注度与实际旅游客流量相关性高[31⇓-33]。杜家禛等[34]基于百度指数对长三角虚拟旅游流流量特征展开研究,运用地理加权回归模型从流入与流出2个方面探究旅游流的影响因素。韩剑磊等[35]基于百度指数运用社会网络分析与地理探测器等方法,对中国省域旅游信息流的结构特征及影响因素展开研究。此外,一些学者运用在线旅行社(online travel agency, OTA)平台数据,分析了旅游信息流空间及其流向特征[36]。
遗憾的是,上述研究仍存在以下不足。其一,受数据可获得性限制,对虚拟旅游流流向关注还较少,对地区客源地与目的地双重身份有所忽略。其二,潜在旅游者的网络足迹对现实旅游流有着“先兆性”价值,已有虚拟旅游流研究对流向关注还比较鲜见。其三,新冠肺炎疫情扰乱了原有旅游流的流向和空间格局,分析各省份在全国旅游格局中的地位与作用及全国虚拟旅游流网络结构变化,对探索各地旅游业恢复路径具有重要价值。鉴于此,本文以全国31个省份(受数据可获得性及统一性限制,暂不含港澳台)为研究对象,基于百度指数获取的2016—2020年旅游信息搜索量,从旅游流流向视角切入,探究虚拟旅游流网络结构的时空演变特征及各省份在全国旅游业发展格局中的地位与作用,以探索加快旅游经济恢复、推进国内大循环格局形成的路径和机制,为区域旅游经济的协调发展、新发展格局的形成提供思路。
1 研究设计
1.1 数据采集与数据处理
1.1.1 数据来源与采集
百度是拥有目前世界上最大中文信息库[37]的数据搜索平台,已被大量运用于科研活动,具有较强的科学性与准确性。百度指数是以网民在百度的搜索量为数据基础,以关键词为统计对象,科学分析并计算各个关键词在百度网页中搜索频次的数据共享平台。
本文首先通过站长工具(
1.1.2 数据处理
在数据搜索过程中,针对一些异常数据,本文进行了修正与清洗。例如,2019年云南的关注度激增,尤其在2019年5月末至11月间,关注度数值最高达日常值10倍有余。经查询发现,在此期间,云南旅游股份有限公司对深圳华侨城文化旅游科技股份有限公司进行了并购重组。该事件影响极大,多次成为百度新闻头条,产生了大量的搜索量。且其搜索量也被归入了“云南旅游”这一关键词的搜索量中,导致这一年云南省的数据异常。由于云南涉及数据量大,且该事件数据难以剥离,而不宜采用直接删除的方式。因而本文基于2016—2018年的数据,通过指数曲线预测法,对2019年虚拟旅游数据进行预测,以降低云南旅游股份有限公司并购重组事件带来的数据偏差。
1.2 研究思路
1.2.1 虚拟旅游流作用力指标构建
旅游流驱动机制由客源地旅游需求推动和旅游目的地吸引构成[38]。从旅游客源地出游力和旅游目的地吸引力切入进行分析,能较准确地反映区域旅游流及资金等各项要素的循环流动特征。在互联网和移动互联网迅速发展背景下,潜在旅游者对旅游信息的搜索量反映了其实现旅游、休闲的潜在可能性,一定程度上体现了客源地居民的出游潜力。同时,网络平台对旅游地信息的传播,以及潜在旅游者对该地信息进行搜索或关注的数量,反映了该旅游地对游客的吸引力强度。
百度信息搜索量能够反映旅游者的需求倾向及旅游地的虚拟旅游吸引力。
式中:
1.2.2 虚拟旅游吸引力与出游潜力的空间差异测度指标
变异系数是测度数据离散程度的指标,通过对中国虚拟旅游吸引力与出游潜力的测算,能够度量其空间离散程度。变异系数越大,表明中国虚拟旅游吸引力或出游潜力的空间差异越大,反之越小。公式如下:
式中:
1.2.3 虚拟旅游吸引力与出游潜力的空间集聚特征分析方法
式中:
Getis-Ord G*统计量的计算公式如下:
式中:
1.2.4 虚拟旅游流网络结构的空间特征分析指标
式中:
引力模型体现了地区之间的关联强度,本文借鉴已有研究[45],根据引力模型,进一步以两区域之间信息搜索量乘积表征虚拟旅游流,以体现省际虚拟旅游关联强度,公式如下:
式中:
同时,为理清复杂的虚拟旅游网络结构,反映各省在虚拟旅游流空间结构中的地位与作用,本文借助测度模型测算各省的关联性。鉴于加权求和评分法能根据不同指标重要性赋予权重系数,故本文通过该方法,累加各项指标评价结果,测算出各省份的关联性得分,公式如下:
式中:
2 虚拟旅游流的空间分布特征
2.1 虚拟旅游吸引力与出游潜力的空间差异特征
表1 2016—2020年中国虚拟旅游整体空间差异特征
Tab.1
| 年份 | 变异系数 | |
|---|---|---|
| 虚拟旅游吸引力 | 虚拟出游潜力 | |
| 2016 | 0.60 | 0.47 |
| 2017 | 0.51 | 0.42 |
| 2018 | 0.61 | 0.41 |
| 2019 | 0.79 | 0.41 |
| 2020 | 0.67 | 0.46 |
2.2 虚拟旅游吸引力与出游潜力的空间集聚特征
表2 2016—2020年虚拟旅游吸引力与出游潜力的空间集聚性测算
Tab.2
| 指标 | 莫兰指数 | ||||
|---|---|---|---|---|---|
| 2016年 | 2017年 | 2018年 | 2019年 | 2020年 | |
| 虚拟旅游吸引力 | -0.0212 | 0.0055 | 0.0547 | 0.0587* | 0.1240** |
| 虚拟出游潜力 | 0.1551** | 0.2045*** | 0.1760*** | 0.1468** | 0.1523** |
注:***、**、*分别表示在1%、5%、10%水平上显著。
图1
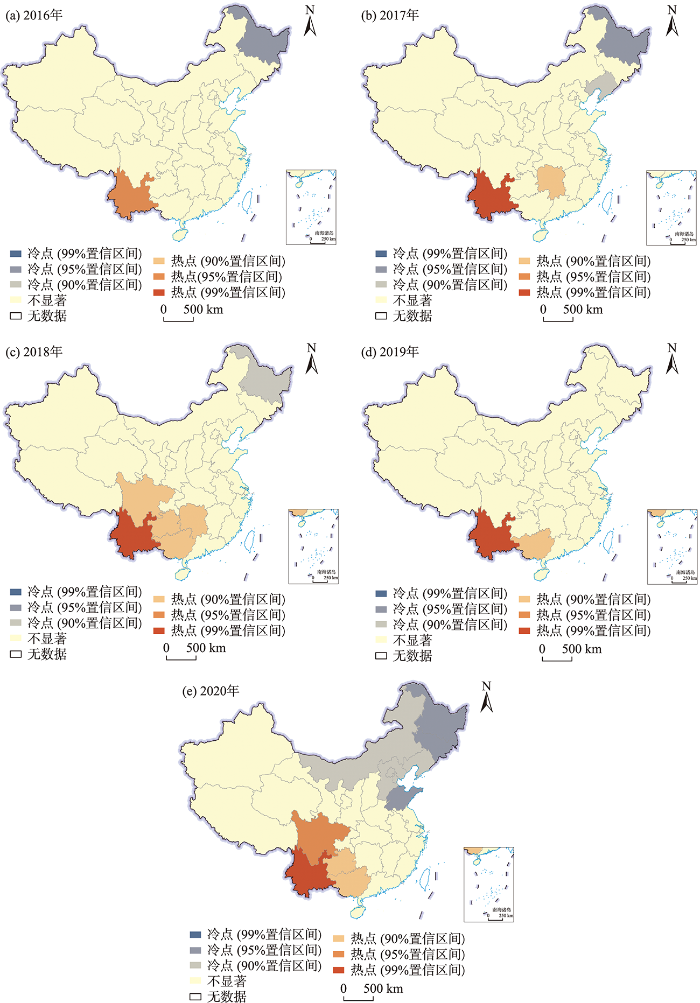
图1
2016—2020年中国虚拟旅游吸引力空间集聚特征
注:本图基于自然资源部标准地图服务网站下载的审图号为GS(2019)1823号的标准地图制作,底图无修改。下同。
Fig.1
Spatial agglomeration characteristics of virtual tourism attraction in China during 2016-2020
图2
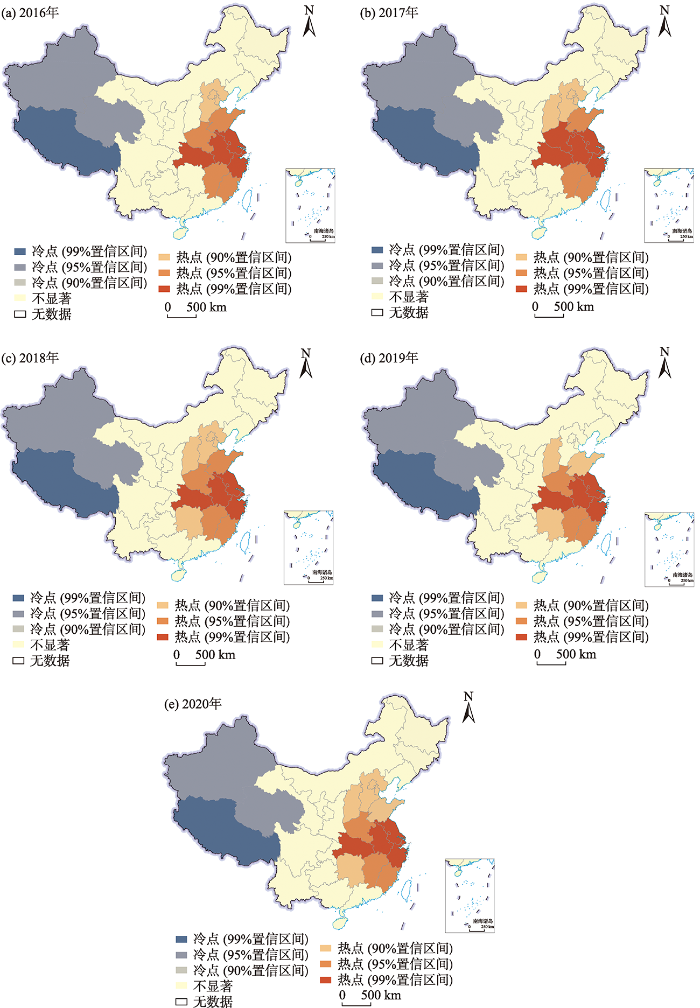
图2
2016—2020年中国虚拟出游潜力空间集聚特征
Fig.2
Spatial agglomeration characteristics of virtual latent emissiveness in China during 2016-2020
2.2.1 整体空间集聚特征度量
表2显示,2016—2020年虚拟旅游吸引力的空间分布情况由随机模式向集聚模式转变;虚拟出游潜力呈显著的空间集聚分布模式,且集聚程度略有下降。虚拟旅游吸引力的MC值除2016—2018年不显著外,其余均具有统计学意义上的显著性。虚拟旅游吸引力的MC值呈逐年上升,说明虚拟旅游吸引力的集聚程度逐步增强。虚拟出游潜力的MC值均为正,且至少在5%水平下显著,表明其集聚现象明显;从时序变化趋势来看,MC值的变化表明集聚程度呈下降趋势。
2.2.2 空间集聚演变特征分析
为进一步反映各省对全局空间自相关性的贡献情况,本文运用热点分析分别识别虚拟旅游吸引力与出游潜力的高值集聚区与低值集聚区。从虚拟旅游吸引力的空间演化特征来看(图1),其区域分异显著,呈增强趋势。高值集聚区稳定在云南等省份,低值集聚区则主要在黑龙江等省份。具体来看,2016—2019年低值集聚逐步弱化,黑龙江逐步退出低值集聚区。云南的集聚效应愈发明显,湖南、四川、重庆以及广西都曾为高值集聚区。2020年集聚最为显著,反映出西南部的高值集聚区与东北部的低值集聚区向中部扩张的态势,形成了以云南与四川为主要高值集聚区,贵州与广西为次要高值集聚区,黑龙江、吉林与山东为主要低值集聚区,辽宁、内蒙古、北京、天津以及河北为次要低值集聚区的西南—东北分异结构。
3 虚拟旅游流网络结构的空间特征
虚拟旅游流在区域间的交互运动引导了地区间各项要素的流动及空间配置,产生了区域旅游业发展的极化与扩散效应。在探析虚拟旅游流流向集聚与扩散现象的基础上,本文结合虚拟旅游流流量特征,对各节点的优势度与关联性特征、虚拟旅游流的运动路径及其网络特征进行分析;进而通过节点的优势度与关联性强度分析各省在区域旅游格局中的地位与作用以及相应的极化与扩散效应。
3.1 虚拟旅游流节点等级的时空特征
自然断裂点法是以每个类别的数据差异达到最小为原则,将该组相似数据划分为一类的分级方式,是比较理想的分类方式。当虚拟旅游优势度大于1时,表明该地虚拟旅游吸引力大于出游潜力,能有力促进当地旅游业发展,即1为中断值之一。基于此,本文在自然断裂点法划分结果基础上,不断地尝试与比较,最终以0.5、1、2、4、15为虚拟旅游优势度等级划分的中断值,共划分为5个节点等级。其中,数值在(4, 15]的节点处于第一等级,在(2, 4]的为第二等级,在(1, 2]的为第三等级,在(0.5, 1]的为第四等级,在[0, 0.5]的为第五等级(表3)。
表3 2016—2020年节点虚拟旅游优势度等级
Tab.3
| 等级 | 2016年 | 2017年 | 2018年 | 2019年 | 2020年 |
|---|---|---|---|---|---|
| 第一等级 (4, 15] | 西藏 | 西藏 | 西藏、云南 | 西藏、云南 | 西藏、云南、青海、新疆 |
| 第二等级 (2, 4] | 云南、青海、新疆、贵州、海南 | 云南、青海、新疆、海南 | 青海、海南、贵州 | 青海、新疆、贵州 | 海南、贵州、宁夏 |
| 第三等级 (1, 2] | 宁夏、重庆、甘肃、江西、山西、广西、上海、天津 | 贵州、宁夏、重庆、甘肃、江西、山西、广西、四川、上海、天津 | 新疆、宁夏、重庆、甘肃、江西、山西、广西、上海、天津 | 海南、宁夏、重庆、甘肃、江西、山西、上海、天津 | 重庆、甘肃、江西、山西、广西、四川、安徽 |
| 第四等级 (0.5, 1] | 四川、安徽、北京、福建、河南、湖南、湖北、内蒙古、山东、陕西 | 安徽、北京、福建、河南、湖南、湖北、内蒙古、山东、陕西、浙江 | 四川、安徽、北京、福建、河南、湖南、湖北、内蒙古、山东、陕西、浙江 | 广西、四川、安徽、北京、福建、河南、湖南、湖北、内蒙古、山东、陕西、浙江 | 上海、天津、北京、福建、河南、湖南、湖北、内蒙古、山东、陕西、浙江 |
| 第五等级 [0, 0.5] | 浙江、广东、河北、黑龙江、吉林、江苏、辽宁 | 广东、河北、黑龙江、吉林、江苏、辽宁 | 广东、河北、黑龙江、吉林、江苏、辽宁 | 广东、河北、黑龙江、吉林、江苏、辽宁 | 广东、河北、黑龙江、吉林、江苏、辽宁 |
注:第一列括号中数值为虚拟旅游优势度。
整体来看,西部地区的虚拟旅游优势度普遍高于东部地区,且绝大多数省份等级变化并不明显(表3)。但从虚拟旅游优势度的数值时序演变来看,天津、上海等地虚拟旅游优势度呈下降趋势;西藏的虚拟旅游优势度接近于10,呈先下降、后上升的变化态势。西藏、云南、青海、新疆、贵州、海南等省份虚拟旅游优势度较高,旅游发展潜力较强。新冠肺炎疫情暴发后,第三至第五等级的省份受影响较小,而第一、二等级的云南、青海、新疆及海南受影响较大。其中,新疆、青海虚拟旅游优势度的等级有所提升,云南的虚拟旅游优势度数值则下降了0.90。其余地区变化幅度均较小。
3.2 虚拟旅游流节点的关联性特征分析
图3
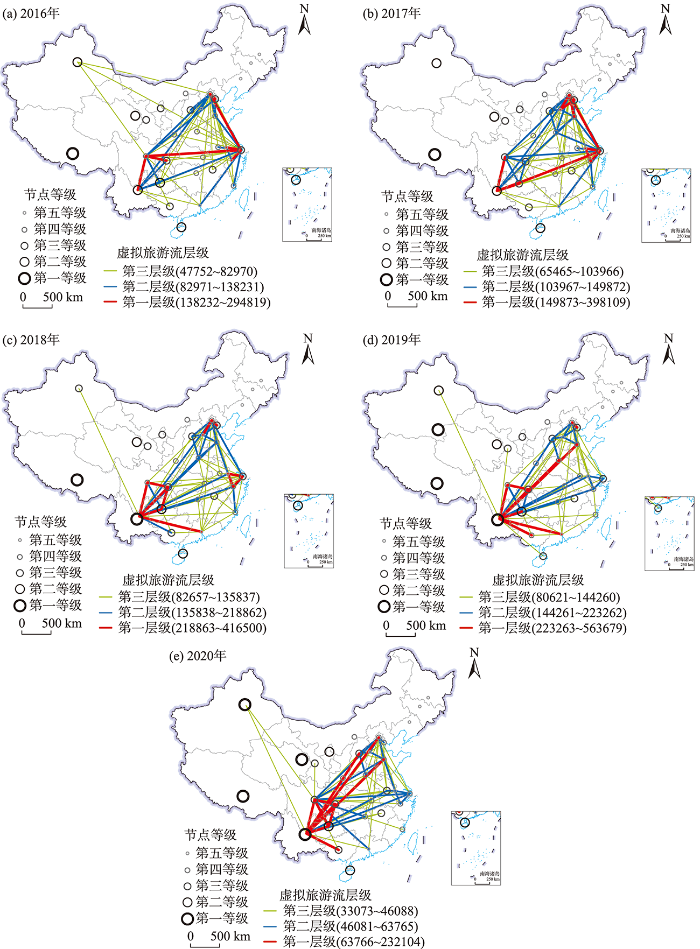
图3
2016—2020年中国虚拟旅游流网络结构的空间演变特征
Fig.3
Spatial pattern change of the network structure of inter-provincial virtual tourism flow in China during 2016-2020
图4

图4
2016—2020年节点虚拟旅游流关联性得分
Fig.4
The relatedness score of virtual tourism flow of provinces (autonomous regions, municipalities) during 2016-2020
根据图4,北京、上海、四川、重庆、云南及山东与各省关联性较强,其次为江苏、浙江、广东、天津、河南、河北、湖南、贵州以及山西。结合虚拟旅游流流向特征,从各省在区域旅游格局中的地位来看,北京、上海及云南为全国性中心地区,在全国发挥辐射带动作用。其余关联性较强的12个省份为区域性中心地区,在各片区发挥区域联动作用。
从历时演变来看,关联性较强的15个省份历时变化较为明显。其中,广东、贵州呈持续上涨态势。在新冠肺炎疫情冲击下,云南、重庆等省份关联性以往不断增强的态势转为急剧下降,四川等省份则相反。其余省份的变化幅度则相对较小。结合虚拟旅游流流向特征,从各省在区域旅游格局中的地位变化来看,北京与上海在全国范围内的中心性地位有所削弱。
3.3 虚拟旅游流网络结构特征分析
区域在地理空间上的强关联性,反映的是极少数区域对其他区域的支配或辐射带动。那么这些处于中心地位的省份是发挥着极化还是扩散效应,还需进一步结合虚拟旅游优势度与虚拟旅游流流量进行辨析。
虚拟旅游优势度体现了各省旅游业的发展潜力。结合各节点虚拟旅游优势度与节点间虚拟旅游流流量来分析虚拟旅游流网络结构特征,可以明确各省在全国及区域范围内主要客源地与主要旅游目的地的身份变化,反映节点的极化与扩散效应。根据图3,首先从虚拟旅游流强度变化来看,2016—2019年虚拟旅游流强度不断增强,总量由10771143猛增至20897049;而2020年虚拟旅游流强度骤减,总量降至7241960,较2019年下降了65%。其次,从网络结构的时空演变特征来看,北京、上海、云南三大中心地区联动周边省域,分别形成了京津冀及其以南片区、长三角地区,以及云贵川渝地区三大区域内的循环结构,且三大区域间及区域内部的虚拟旅游流强度不断增强。
进一步地,观察各区域内部空间结构的演变特征发现,内部结构存在一定变化。京津冀地区向南辐射带动,形成了北京、天津、河北、山西、山东以及河南6地的区域虚拟旅游流网络格局。在该区域内,山西、天津为主要旅游目的地,河北为主要客源地。2020年,天津的区域旅游目的地地位有所下降。从区域内部关联性来看,2016—2019年,区域内各省关联性不断增强,逐步形成了北京—天津、北京—河北、北京—山东、河北—天津等第一、二层级的虚拟旅游流;至2020年,区域内部关联性有所下降。在区域对外联系方面,北京、山东、山西与云南、四川分别形成了较强的虚拟旅游流。在长三角地区,上海为主要旅游目的地,江苏为主要客源地,江浙沪3省维持着较稳定的区域循环结构。而在2020年,安徽为主要旅游目的地。区域内外部的关联性逐渐下降。其中,从2018年起,上海—云南、上海—四川,以及安徽—云南等第一、二层级虚拟旅游流均为第二层级。在云贵川渝地区,逐步形成了以云南为核心的强循环流动结构。在此基础上,区域内外部联系愈发紧密。尤其在2020年,云贵川渝地区对外形成了更多的第一、二层级的虚拟旅游流。其中,四川对外联系愈发紧密,与北京、山东、上海、湖南、广东等省份的虚拟旅游流强度均提升至第二层级。
西部地区经济发展水平较低,地广人稀,距离阻力较大,而限制了旅游者的出游潜力,导致该地与其他省份联系较弱,仅形成了新疆与北京、上海、云南、四川等省的第三层级虚拟旅游流。2020年,西部的省份得益于地广人稀与丰富的自然资源,对外吸引力有所增强,优势度等级得到提升,但虚拟旅游流流量依旧较弱。
为进一步揭示虚拟旅游流网络结构的空间演变模式,探究各节点的极化与扩散效应,本文在图4的基础上,进行整合与抽象,提炼与归纳虚拟旅游流中心节点的极化与扩散演变模式(图5)。根据图5,可以归纳出3种演变模式。一是长三角地区,由极化向扩散效应演变。起初,以上海为主要集聚点向长三角集聚,后转为向云贵川渝地区的扩散效应为主。此外,2020年安徽极化效应明显。二是京津冀及其以南地区,极化与扩散效应并存,由双核结构向单核结构演变。起初,山西与天津的极化效应大于扩散效应,而呈双核结构。随时间演变,天津的极化效应减弱,而呈单核结构。在扩散效应方面,北京、山东等与长三角及云贵川渝地区联系紧密,对外扩散态势显著。三是云贵川渝地区,内部循环流动不断增强,由较强区域内循环、对外弱扩散效应向强区域内循环、强极化效应演变。云贵川渝地区呈多核心、多层次的空间结构,区域内部循环流动不断增强,推进了区域的极化效应。2020年新冠肺炎疫情暴发,该区域极化效应更加显著,吸引大量其他区域省份游客向该区域集聚。
图5
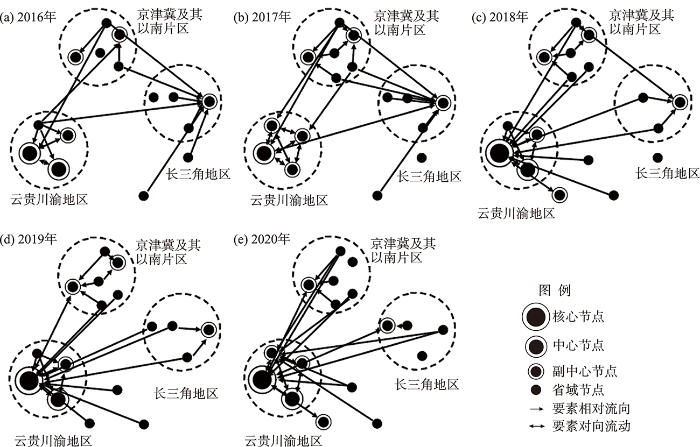
图5
中国省际虚拟旅游流中心节点的极化与扩散演变模式
Fig.5
Polarization and diffusion patterns of central nodes of inter-provincial virtual tourism flow in China
4 虚拟旅游流网络结构空间演变影响因素分析
中国旅游空间格局及其演变是经济发展水平、旅游资源禀赋、基础设施建设及时空邻近性[47]等多种因素[48-49]共同作用的结果[50]。其中,旅游吸引力受旅游资源、地区可达性影响较大[51-52],出游潜力主要与经济发展水平及交通设施相关[53]。除此之外,新冠肺炎疫情等突发事件、地区旅游政策制度等也是影响虚拟旅游流网络结构的重要因素。旅游资源丰度、品位度是影响旅游吸引力的系列因素。东部地区普遍优于中西部地区,中西部地区的云南、四川、湖南等地旅游资源也较优[54]。类似地,可达性较好区域多分布于长三角、环渤海、中原、成渝等地区[55]。经济发展水平与旅游地各项基础设施建设、旅游地环境、互联网普及率及客源地居民的出游潜力关系密切,在全国呈明显的东中西梯次递减规律。由此,中国虚拟旅游吸引力空间差异较大,虚拟出游潜力呈明显东西分异。同时,基于经济发展水平、旅游资源分布等地域差异与时空邻近性影响,形成了以京津冀、长三角以及云贵川渝地区为3大核心的空间结构。
首先,就虚拟旅游流空间分布特征演变的影响因素而言,其一,旅游资源丰富、品位度高的地区对旅游者更具吸引力。互联网数字鸿沟更是限制了旅游吸引力较弱地区的发展,因而虚拟旅游吸引力空间差异呈逐年加剧趋势。其二,随着居民生活水平不断提升,中等收入家庭不断增多,出游潜力逐步趋于均衡,空间集聚略有减弱。其三,近年来,西南地区采取多项优惠政策推进了当地旅游业发展,旅游吸引力进一步增强。例如,贵州与上海、江苏等多个省份签订了“客源互换”的战略协议,实行A级景区免门票策略。这些优惠策略增强了西南地区的旅游吸引力,在空间上为热点集聚区。其四,2020年新冠肺炎疫情暴发限制了各地的可进入性,疫情风险等级、各省防控政策差异,减弱了区域间旅游业交流与均衡的发展程度,各地虚拟旅游吸引力也呈较平均状态。
其次,就虚拟旅游流各节点与流向、流量演变的影响因素而言,其一,受新冠肺炎疫情影响,虚拟旅游流流量普遍骤减。其二,虚拟出游潜力受经济水平、人口、互联网发展水平等影响较大,且西部地区独有的自然风光等旅游资源极具吸引力,必然导致其虚拟旅游优势度极高,且更具发展潜力。东部经济发展水平较高,旅游者旅游经验丰富,开始转向中西部地区,而呈现出扩散效应大于极化效应的趋势。其中,安徽自身旅游资源丰富,且受周边地区辐射带动而对外吸引力逐步增强。其三,云贵川渝地区得益于地理邻近与资源优势,关联性不断增强,并促使区域极化效应不断增强。
5 结论与讨论
本文利用网络虚拟数据,从省域旅游目的地与客源地双重角度切入,分析虚拟旅游流网络结构的空间演变特征,延伸了旅游吸引力与出游潜力的分析内容和维度,突破了传统旅游流概念。从虚拟旅游优势度与关联性2个方面测度节点等级,结合虚拟旅游流的流量与通道,明确了各省在区域旅游格局中的地位与作用。主要结论如下:
(1) 从全国的空间差异与分布格局来看,虚拟旅游吸引力空间分布较均衡,仅西南地区呈集聚态势;虚拟出游潜力东西分异特征明显,且西部地区的虚拟旅游优势度明显高于东部地区。
(2) 从虚拟旅游流网络结构来看,北京、上海及云南为全国性中心地区,向外辐射带动形成京津冀及其以南片区、长三角地区、云贵川渝地区3大核心区域。具体来看,3大区域间及区域内部虚拟旅游流强度不断增强。长三角地区扩散效应明显;京津冀及其以南片区转为单核结构,区域内极化效应显著;云贵川渝地区呈多核心、多层级的区域内强循环结构,极化效应愈发显著。
(3) 从新冠肺炎疫情的影响来看,虚拟旅游流总量大幅下降;空间分异更为明显,整体空间结构变化较小。就虚拟旅游优势度而言,其数值在0~2间的省份受疫情影响普遍较小。
综上所述,区域间旅游流良性循环互动是促进区域协调发展的有效途径。云贵川渝地区以点带面,促成了区域内强循环流动的多核心、多层级空间结构,增强了区域的极化效应与扩散效应。长三角地区、京津冀及其以南片区进一步推进区域内旅游要素的循环流动,是推进3大核心区域间协调发展的一大途径。基于此,依托3大核心区域虚拟旅游流通道,推动区域旅游业协调发展是构建国内大循环格局、促进区域均衡发展的重要途径。
新冠肺炎疫情的暴发给区域旅游业协调发展带来了新的问题,为统筹好疫情防控与旅游业发展,日后研究中需要对以下问题进行深入研究。其一,纳入2021年数据,进一步分析新冠肺炎疫情对虚拟旅游流网络结构的影响机制。其二,新冠肺炎疫情暴发以来,游客的旅游需求行为或方式已发生较大改变,周边游兴起,因而需要缩小研究尺度,对更为微观的虚拟旅游流网络结构展开深入研究。其三,本文侧重于采用空间分析方法探讨虚拟旅游流网络结构的演变特征,后续研究可采用计量经济学等方法深入研究其演变机制。
参考文献
信息流视角下长株潭城市群关系网络特征辨析及规划启示: 基于百度指数的分析
[J].
Network characteristics and planning enlightenment of Changsha-Zhuzhou-Xiangtan urban agglomeration from the perspective of information flow: An analysis based on Baidu index
基于爬虫技术的城际信息流网络测度及其经济意义研究
[J].
Study on the measurement of inter-city information flow network based on crawler technology and its economic significance
基于网络团购的虚拟旅游流空间差异及动力机制研究
[J].
Spatio-temporal difference and influence mechanism of virtual tourist flows on the basis of network group-buying
基于计划行为理论的虚拟旅游行为影响机制研究
[J].
Exploring consumer behavior in virtual reality tourism using the theory of planned behavior
中国典型区域入境旅游流空间场效应实证研究: 以四川省为例
[J].
Empirical research on spatial field effects of inbound tourist flows in China: Case study of Sichuan Province
中国国内旅游流空间场效应分析
[J].
An analysis on spatial field effect of domestic tourist flows in China
Asimultaneous model of tourism flow, spending and receipts
[J].DOI:10.1177/135481669900500302 URL [本文引用: 1]
The impact of seasonal unit roots and vector ARMA modelling on forecasting monthly tourism flows
[J].DOI:10.5367/000000001101297766 URL [本文引用: 1]
Implications of global climate change for tourism flows and seasonality
[J].DOI:10.1177/0047287506295937 URL [本文引用: 1]
A complex network analysis of global tourism flows
[J].DOI:10.1002/jtr.2208 URL [本文引用: 1]
Do regional trade agreements enhance international tourism flows? Evidence from a cross-country analysis
[J].
东北区海外旅游客源市场的拓展
[J].
The expansion of the overseas tourist market in Northeast China
中国入境旅游流的空间分析
[J].
Spatial analysis of the inbound tourism flow to and in China
我国旅游热点城市境外游客旅游流空间分布特征分析
[J].
An analysis of the tourism movement spatial distribution of foreign tourism in Chinese famous tourism cities
旅游客源市场结构分析: 以南京市为例
[J].
An analysis on the structure of the tourist market: Taking Nanjing City as an example
DOI:10.1177/1942778620910901 URL [本文引用: 1]
江浙沪地区的内聚旅游流分析
[J].
An analysis on intra regional tourist flow of Jiangzhehu area
旅游流体系研究
[J].
Study on tourism flow system
旅游流空间模式的基本理论及问题辨析
[J].
Concentration on problems within spatial pattern of tourist flow in the way of critical thinking
基于航空口岸的台胞大陆旅游流空间场效应分析
[J].
An analysis of the spatial field effects of tourist flow of Taiwanese visiting Mainland China based on airports
洛阳城区旅游流空间网络结构特征
[J].
DOI:10.13249/j.cnki.sgs.2019.10.009
[本文引用: 1]

对网络大数据和社会调研数据的融合、挖掘,构建洛阳市区各景点间游客流动的关系矩阵,基于社会网络和空间统计分析方法,探究洛阳市区旅游流空间网络结构特征。结论如下:①洛阳市区旅游流网络呈现出东南龙门石窟和东北白马寺旅游区极为密集,中心老城区网络联系较为紧密,北部邙山旅游区相对稀疏,西部旅游区几乎孤立的空间分布格局,表现出明显的四大旅游集群的态势。②洛阳市区旅游流网络是典型的核心-边缘网络,且核心景区对边缘景区的“涓滴效用”有限。③洛阳市区旅游节点分为4个系统,分别为一级旅游核心、次级旅游核心、一般旅游节点和边缘旅游节点。④ 一级核心景点涉及面较广,对整体流动具有较强的支配作用,而边缘节点主要受到一级和次核心节点的约束。
Characteristics of spatial network structure of tourist flow in urban area of Luoyang
DOI:10.13249/j.cnki.sgs.2019.10.009
[本文引用: 1]
By integrating and exploring the large network data and social survey data, the relationship matrix of tourist flows among various scenic spots in urban area of Luoyang was constructed. By combining social network and spatial analysis, characteristics of Luoyang's tourist flows network were further analysed. Conclusions were shown as follows: 1) The network of tourism flow in Luoyang urban area showed that the networks of Longmen Grottoes in the southeast and Baima Temple in the northeast were very dense, the network of the old urban area in the center was relatively close, the tourism area in the north is relatively sparse, and the spatial distribution pattern of in the western area was almost isolated. On the whole, there were four obvious tourism clusters. 2) Tourist flows network is typical core-periphery, links between the core spots and the peripheries were very sparse, and the trickle-down effect was limited. 3) Tourism nodes in Luoyang urban area were divided into four systems: the first-class, the second-class, the general, and the marginal tourism node. 4) The first class core scenic spots were more extensive and had a strong dominating effect on the overall flow. The edge nodes were mainly constrained by the first-level and the second-class tourism core.
西安入境旅游流与城市旅游环境耦合协调关系研究
[J].
Coupling coordination of Xi'an inbound tourist flows and urban tourism environment
入境旅游流与区域经济耦合协调度时空差异动态分析: 基于全国31个省区1993-2011年面板数据
[J].
The spatial and temporal differences danamic analysis of the coupling coordination about the inbound tourists flows and regional economic: Based on the 31 provinces regional panel data from 1993 to 2011
高铁驱动下大尺度区域都市圈旅游空间结构优化: 以京沪高铁为例
[J].高铁“时空压缩”效应使都市圈旅游辐射范围进一步扩大。以都市圈为基本空间结构单元,分析高铁驱动下大尺度区域旅游空间结构优化具有重要意义。本文运用“核心-边缘”和“板块旅游”空间结构理论,结合京沪高铁线6个都市圈基本特征以及高铁旅游流空间网络结构和空间效应特征,通过节点优化,线状连接和面状拓展等空间优化路径,确定大尺度区域重点旅游发展点、旅游发展轴和旅游地系统,构建不同等级的旅游板块。通过一级核心旅游点和一级旅游地系统的核心扩散作用,将二级旅游板块和三级旅游板块由一、二、三级扩展轴融入一级旅游板块中,最终建构京沪高铁旅游带。高铁“时空压缩”效应使高铁旅游带的各都市圈空间联系增强,应加强都市圈区域旅游合作,进一步发挥高铁扩散效应和叠加效应,促使“旅游高地”不是对“旅游洼地”产生虹吸现象,而是更多发挥“旅游高地”的“溢出效应”,带动“旅游洼地”发展,进而实现高铁区域旅游一体化发展的目标。
Optimizing tourist spatial structure for large scale regional metropolitan circles under the Beijing-Shanghai high-speed rail
Metropolitan circles refers to densely urbanized regions centered around one or several central cities that keep close social and economic contact with nearby towns. The cities and towns in a metropolitan circle are adjacent to each other in geographical space,mutual cooperation in function showing circle structure in form and have a trend of integration. The spatial structure of metropolitan circles develops as the development mode of core-periphery,with a development goal being the realization of regional integration and equalization. Tourist radiation range of metropolitan areas will further expand with the Time-space Compression effect of high-speed rail and strengthen communication between different metropolitan circles along high-speed rail lines. This is of great importance when analyzing optimization of tourist spatial structures of large scale regions under the drive of high-speed rail regarding metropolitan circles as a basic unit of spatial structure. Here,we determined the important tourist development node,axis and resort system and structured the tourist plate with different grades by applying theories of spatial structure involving core-periphery and plate tourism,summarizing the basic characters of six metropolitan circles for the Beijing-Shanghai high-speed rail,spatial network and spatial effect of tourist flow using optimization of nodes,line connection of and expansion. With the core diffusion influence in both the first class tourist core nodes and first resort systems,the second class tourist plates and third class tourist plates would be integrated into the first tourist plates from the first,second and third class expanded axis;the tourist belt of the Beijing-Shanghai high-speed rail will be structured. In the high-speed rail tourism belt,the effect of Time-space Compression enhanced the spatial contact of various metropolitan circles along the high-speed rail line. Thus,regional cooperation in tourism between metropolitan circles should be strengthened to realize diffusion and superimposed effects. Spillover effects from tourism highlands,rather than siphon phenomenon from tourism highlands to tourism depression,will be promoted. The development of a tourism valley will be realized and achieve the goal of tourist integrative development of the high-speed rail region.
香港-大陆旅游流与贸易流的互动关系分析: 基于1990-2009年数据
[J].
An analysis of the interaction of Hong Kong-mainland between trade and tourism for resent 20 years
自然灾害事件下景区风险管理: 危机信息流扩散与旅游流响应
[J].
Risk management of scenic spots under natural disasters: Diffusion of crisis information flow and response of tourism flow
江苏省高速公路流与景区旅游流的空间关联及其耦合路径
[J].
Spatial correlation and coupling path between freeway flow and tourism flow of scenic spot in Jiangsu Province
基于空间面板计量模型的雾霾对中国城市旅游流影响的空间效应
[J].
DOI:10.11821/dlxb201904014
[本文引用: 1]
以中国342个市域单元为研究对象,借助双变量LISA模型、空间面板杜宾模型等方法,探究了1998-2016年雾霾与中国城市旅游流的空间关联特征,分析了雾霾对旅游流的影响及其空间溢出效应。结果表明,在中国雾霾PM<sub>2.5</sub>与城市旅游流有东高西低的分布特点,在胡焕庸线两侧的空间分布呈现出与地形和城市发展等因素的空间耦合性;雾霾与城市旅游流(含国内和入境旅游流)均表现出显著的空间集聚和空间依赖特征,雾霾污染对旅游流产生明显的影响并形成相应的空间效应;雾霾对旅游流的抑制区域在不断扩大,H-L型城市数量的增加、L-H型集聚区的片状扩张和华北、华中地区的L-H型集聚的“空心化”现象均表明旅游流具有低雾霾指向性;雾霾污染与旅游流的倒“U”型曲线关系表明经典的EKC假说对中国城市旅游流同样适用,且雾霾污染的显著负向影响主要存在于入境旅游方面;雾霾和旅游流均具有明显的正向空间溢出效应,将雾霾治理同经济发展、对外联系、旅游开发、生态保护和交通建设等因素结合起来进行综合治理,才能为旅游发展创造美好的环境,实现国际、国内旅游健康、协调、可持续的高质量发展。
The spatial effects of haze on tourism flows of Chinese cities: Empirical research based on the spatial panel econometric model
DOI:10.11821/dlxb201904014
[本文引用: 1]
Taking 342 cities in China as an example, this paper explores the spatial correlation between haze (PM2.5) and tourism flows, as well as analyzes the impact of haze on tourism flows and the spatial spillover effects from 1998 to 2016 by using bivariate LISA (Local Indications of Spatial Association) Model and Spatial Panel Dubin Model. The results show that the spatial distribution patterns of haze (PM2.5) pollution and tourism growth in China are both high in the eastern region and low in the western region, showing some regularity related to the factors, such as terrain and urban development on both sides of Hu Huanyong population line. Haze and tourism flows (including domestic tourism flows and inbound tourism flows) show both significant spatial agglomeration and spatial dependence during the study period, indicating that haze pollution has great spatial effect on tourism flows. The area where haze curbs tourism flows is expanding. The increase in the number of HL (High-Low) -type cities, the expansion of LH (Low-High) -type agglomeration area and the hollow phenomenon of LH-type agglomeration that appear in north and central China all show that tourists tend to travel to the cities with low haze pollution. The inverted U-shape curve relationship between haze pollution and tourism flows illustrates that the classical Environmental Kuznets Curve (EKC) hypothesis is suitable for tourism growth in the cities of China. The negative impact of haze on inbound tourism flows is significant. Both haze pollution and tourism flows have positive spatial spillover effects. Combining haze management with other measures, such as economic development, tourism development, ecological protection, traffic construction, we can create a beautiful environment for tourism development and achieve a healthy, coordinated and sustainable high-quality development of international and domestic tourism.
基于游记行程的湖南旅游流空间网络结构特征
[J].
Study on spatial network structure of Hunan tourist flow based on travel arrangement
中国东部沿海5大城市群旅游流网络结构空间分布特征研究
[J].
DOI:10.18306/dlkxjz.2021.06.005
[本文引用: 1]
基于大数据挖掘的旅游流网络结构研究,是旅游流深化研究的主要方向之一。论文基于网络爬虫技术抓取携程旅行网上的中国东部沿海5大城市群旅游线路相关数据,构建城市群旅游流网络,进一步利用社会网络分析法从网络密度、节点结构特征、网络凝聚子群、核心—边缘特征、结构洞等方面揭示旅游流网络结构特征。主要结论有:中国东部沿海5大城市群旅游流网络结构具有层级性和位序—规模特征;各凝聚子群内部联系较为紧密,但各子群之间的互动较少;核心区均位于长江三角洲城市群,核心节点对边缘节点的“涓滴效应”有限;北京、厦门、青岛、广州、中山、杭州等城市在旅游流网络中的结构洞优势较为明显。大数据视角下的旅游流空间网络结构特征的揭示,对于深入认知“流空间”的内涵以及优化城市旅游空间布局具有重要意义。
Spatial distribution characteristics of network structure of tourism flow in five major urban agglomerations of coastal China
DOI:10.18306/dlkxjz.2021.06.005 URL [本文引用: 1]
基于百度指数的旅游景区络空间关注度: 时间分布及其前兆效应
[J].
Cyberspace attention of tourist attractions based on baidu index: Temporal distribution and precursor effect
区域旅游网络关注度与客流量时空动态比较分析: 以四川为例
[J].
An analysis on the variation between the degree of consumer attention of travel network and tourist flow in regional tourism: A case of Sichuan Province
Forecasting tourist arrivals with machine learning and Internet search index
[J].DOI:10.1016/j.tourman.2018.07.010 URL [本文引用: 1]
Tourism demand nowcasting using a LASSO-MIDAS model
[J].DOI:10.1108/IJCHM-06-2020-0589 URL [本文引用: 1]
基于百度指数的长江三角洲虚拟旅游流流动特征和影响因素分析
[J].
Regional virtual tourism flow and its influencing factors based on baidu index: A case study in Yangtze River Delta
基于百度指数的中国省域旅游信息流网络结构特征及其影响因素分析
[J].
Analysis of the structural characteristics and influencing factors of tourism information flow network in China based on baidu index
基于在线平台的旅游信息流流空间特征: 以珠江-西江经济带核心城市为例
[J].
Flow space features of tourism information flow based on online platforms: a case study of core cities in the Pearl River-West River economic belt
基于百度指数的长三角核心区城市网络特征研究
[J].
The research of the Yangtze River Delta core area's city network characteristics based on Baidu index
旅游流驱动力系统分析
[J].
Study on the driving force of tourist flows
中国城市流动人口回流意愿的空间分异及影响因素
[J].
DOI:10.11821/dlyj020180473
[本文引用: 1]
基于国家卫计委2016年流动人口动态监测数据(CMDS),运用相关GIS空间统计工具探讨了中国279个地级及以上城市流动人口回流意愿空间分异问题,进而考察流动人口回流意愿的影响因素。研究发现:① 相比居留意愿及户籍迁移意愿,中国城市流动人口回流意愿偏低(6.17%),其中,绝大多数流动人口(74.05%)的回流去向地是返回原居住地。城市规模、城市等级与流动人口回流意愿呈非对称“U型”格局。② 流动人口回流意愿总体上呈现出集聚分布模式,并具有显著的空间分异特征,长江三角洲、京津冀等城市群流动人口的回流意愿较高,成渝和哈长城市群流动人口回流意愿较低;东部地区流动人口回流意愿最高,东北地区的回流意愿最低;华南、中南和部分华东地区为回流意愿热点区,东北和华北地区为回流意愿的冷点区。③ 回流意愿受流动人口内部因素与流入地外部因素的共同影响,同时作为内部因素和外部因素的教育水平及经济发展变量对流动人口回流意愿的影响方向不同。④ 流动人口的家庭联系、社会网络、住房及经济因素是塑造流动人口空间格局的主要力量,流入地家庭规模及住房拥有率等对流动人口回流意愿产生抑制作用,非流入地家庭规模、流动次数、家庭收入支出比等对回流意愿产生促进作用。
Spatial variation of migrant population's return intention and its determinants in China's prefecture and provincial level cities
DOI:10.11821/dlyj020180473
[本文引用: 1]
In China, population migration has an influence on the level of economic and social development in various regions. In 2016, the scale of migrant population reached 245 million, which became an important factor affecting population changes. From the perspective of migrant populations' destinations, with the control of population scale in some big cities in China, and the sustained economic growth in the central and western regions, the problem of population reflux is attracting more and more attention from the society. The spatial differentiation and influencing factors of migrant populations' return intention are vital issues which are urgent to be investigated. Based on data from the 2016 China Migrant Population Dynamic Survey (CMDS), this paper discusses the phenomenon about spatial differentiation of migrant populations' return intention in 279 prefecture and provincial level cities in China, using GIS spatial analysis methods such as Moran's I coefficient, Getis-Ord Gi *. Besides, we investigate the influencing factors of migrant populations' return intention. Study comes to the following conclusions: (1) Compared with the residence intention and hukou transfer intention, the return intention of migrant population in China is lower (6.17%), and the majority of migrants (74.05%) are eager to take their own home towns as refluxing destination. The scale of cities, the level of cities and the return intention of migrant population present an asymmetric "U"-shaped pattern. (2) The spatial distribution of return intention presents an aggregation pattern with marked spatial differentiation. The return intention of migrant population in Yangtze River Delta Urban Agglomeration, Beijing-Tianjin-Hebei Urban Agglomeration and Zhongyuan Urban Agglomeration is higher than that in Chengdu-Chongqing Urban Agglomeration and Harbin-Changchun Urban Agglomeration. Among the four main geographical divisions, the return intention of urban floating population in the eastern region is the highest while that of the northeast region is the lowest. South China, central-south China and part of East China are hot spots of return intention while Northeast and North China are in a weak corner. (3) The return intention is influenced by both internal factors of migrant population and external factors of in-flow area. Educational level and economic development are both internal and external factors that simultaneously play different roles in return intention. (4) Family connection, social networks, housing and economic factors of migrant population are main forces that shape the spatial pattern of return intention. Family scale in in-flow area and home-ownership rates inhibit return intention while variables such as family scale in non-in-flow area, migrant times and the family's income and expenditure proportion exert a positive influence on return intention. Based on the above conclusions, this paper proposes strategies for relevant departments on the management of migrant population.
Inter-regional agglomeration effects in tourism in Poland
[J].DOI:10.1080/14616688.2014.997279 URL [本文引用: 1]
信息化对中国产业结构升级影响分析: 基于省级面板数据的空间计量研究
[J].
The Impacts of informatization on industrial structure upgrading in China: Spatial econometric analysis based on province's panel data
中国红色旅游网络关注度时空特征及影响因素
[J].
Spatio-temporal characteristics and influencing factors of Chinese red tourism network attention
DOI:10.31497/zrzyxb.20200505 URL [本文引用: 1]
基于大数据分析的城市旅游地网络结构特征及其演化模式: 以新浪微博签到数据为例
[J].
DOI:10.11821/dlyj020180236
[本文引用: 1]
流动性表征了旅游地域系统要素间的内在关系,深刻影响着旅游地域网络结构的演变过程和方向。借助新浪微博爬虫技术,探讨了城市旅游地的网络结构特征,测度了旅游地节点的对外联系强度,提炼了复杂网络结构的演化模式。结果表明:① 从旅游地的等级结构来看,形成了以北京和上海为核心的全国性中心城市,核心城市凭借自身的旅游集聚和吸引功能,扩大了对周边城市的旅游影响,网络化的复杂程度逐步加深。② 从旅游地节点的层级结构来看,复杂化网络形态愈加明显,旅游地节点呈现明显的点状式分布态势,以北京、上海、广州为核心的旅游地域网络结构基本形成。③ 通过对比网络演化的过程表明,单中心发育模式由在一定时期内占据主导,逐渐转向以北京、上海、广州为核心的多地域、多中心的发展模式,核心城市的主导地位更加突显。与此同时,以成都和重庆为中心的区域性双核心空间结构发育模式表现突出,形成了以多中心发育模式和区域性双核心结构模式共存的局面。以上研究无疑为新流动性范式下重新认知和揭示复杂旅游网络体系特征及其对节点、网络、结构、空间的互动关系的深刻解读,提供了一次有益的理论尝试。
The network structure of urban tourist destination and its evolution mode based on big data analysis: Taking the data of Sina weibo sign-in as an example
DOI:10.11821/dlyj020180236
[本文引用: 1]
The movement demonstrates the internal association among the elements of the tourism regional system, and profoundly influences the course of evolution and the direction of the network structure in tourism zones. Using the data from the Sina weibo sign-in together with the perception of the city tourism destination node, this study examines how diverse levels of network nodes disseminate in the space-dimension and its hierarchical structure characteristics in the network. Then, through measurement of the external connection intensity of the nodes and its degree of association within various cities, the study discloses and extracts the evolution process of the network configuration in tourism areas. Results are as follows: (1) From the point of the city's hierarchical configuration, it creates several national center cities that consider Beijing and Shanghai as the core. Depending on the strength of tourism collection and tourist attraction in core cities, the adjacent towns develop their tourist market. Slowly, the nodes are enclosed in an increasing number of cities. Thus, the complexity level of the system deepened. (2) From the assessment of node hierarchy of the entire system, most nodes exhibit dotted distribution situation. The major cities play a major part in the core of the network system, which creates the tourism network space organization with cities such as Beijing, Shanghai and Guangzhou as the core. Hence, these cities become an essential growth ladder of tourism improvement in China. (3) The comparison of network structure course of evolution in two distinct years demonstrates that the sole center development pattern prevails in a period, which slowly turns into the development mode of multiregional and multi-center with the cities of Beijing, Shanghai and Guangzhou as the core, wherein the principal position of the core cities is further emphasized. Meanwhile, the development mode of dual-core space structure, with Chengdu and Chongqing as the core cities, dominates. Thereby, it presents the synchronized condition of multi-center development mode and dual-core structure mode. This research offers a theoretical struggle for rediscovering and revealing the extent and profoundness of tourism activities and deep analysis of interactive relations among the node, network, structure, and space under the new flow model.
中国省域间旅游关注网络格局及其影响因素空间异质性分析
[J].
Analysis of network patterns and spatial heterogeneity of influencing factors of inter-provincial tourism attention in China
基于百度指数的长三角城市群旅游流网络结构演变探究
[J].
Evolution of tourist flow network structure of the Yangtze River urban agglomeration based on baidu index
Exploring spatiotemporal heterogeneity in online travel searches: A local spatial model approach
[J].DOI:10.1080/00167223.2019.1601575 URL [本文引用: 1]
地理学第一定律与时空邻近度的提出
[J].
The first law of geography and spatial-temporal proximity
长三角城市群旅游流潜力格局演变及其影响因素
[J].
DOI:10.18402/resci.2016.02.18
[本文引用: 1]
旅游流潜力格局是影响城市群旅游空间竞合关系协调与一体化发展的根本基础。基于旅游供需系统视角,利用GIS和改进的旅游流潜力模型研究2000年、2010年两个时间点长三角城市群旅游流潜力格局的空间变化特征,利用离散指数和Zipf分维数研究旅游流潜力格局变化的等级秩序特征,并利用积矩相关与秩相关系数分析不同因素对旅游流潜力格局变化的影响差异。研究发现:①长三角城市群旅游流潜力格局整体呈现出以扩散为主的等级结构均衡化演变特征,上海、杭州的扩散特征显著,长三角中心区域的苏州、嘉兴、常州、无锡等城市的旅游流潜力集聚提升明显;②长三角城市群旅游流潜力分布具有非均衡、多层极核的结构特征,核心-边缘模式是解释长三角旅游流潜力格局的基本模式;③旅游流潜力格局的等级秩序存在幂律分布和分形特征,进一步证实说明旅游现象中可能普遍存在幂次法则和分形发育;④旅游业水平与旅游流潜力的等级相关性和影响程度最高,人口分布、时间距离的影响程度一般,但都呈现出不断增强趋势,影响因子体系之间的紧凑性和结构效率整体增强,说明长三角城市群旅游发展的整体服务效率和旅游流竞合格局趋于优化;⑤旅游流潜力与城市经济发展水平之间存在显著性相关并随时间变化呈现出一定程度的增强趋势,证实经济发展水平是影响城市旅游流潜力的重要变量,也相应说明了本文旅游流潜力模型具有有效性和实用性。
Evolution characteristics and factors affecting tourist flow potential in the Yangtze River Delta urban agglomerations
中国市域旅游流网络结构空间分异及其效应研究: 基于携程旅行网的大数据挖掘
[J].
Research on the spatial differentiation and effects of network structure in tourism flow in Chinese cities: Big data mining based on Ctrip
DOI:10.31497/zrzyxb.20220105 URL [本文引用: 1]
中国旅游经济空间格局演变特征及其影响因素分析
[J].
Spatial pattern evolution and influence factors of tourism economy in China
城市旅游吸引力影响因素综合分析: 基于面板数据的实证研究
[J].
A comprehensive analysis of the influencing factors in the tourism attractiveness of citie: An empirical research based on panel data
高速公路对武陵山区旅游城市吸引力影响及差异
[J].
Influence and differences of highway on tourism cities' attraction in Wuling Mountain area
DOI:10.2307/141815 URL [本文引用: 1]
中国旅游经济区域差异的空间分析
[J].
Spatial analysis for regional difference of tourism economy in China
