

随着城镇化的发展,城市人口不断增多,伴随而来的是城市空间迅速扩张[1⇓⇓-4]。由于城市要素的空间集聚,城市空间结构表现出明显的“中心—边缘”特征[5],即城市要素随到城市中心距离的增加而逐渐衰减,其中最典型的是城市人口密度的空间衰减,定量模型包括负指数模型[6]、逆幂模型[5]等。城镇化过程中,城市人口与土地利用变化密不可分[7]。近年来,针对城市建设用地密度空间衰减特征, Jiao[8]提出了反S函数模型,揭示了城市建设用地密度空间衰减规律。反S函数模型不仅对城市建设用地密度的拟合精度高,更重要的是模型参数具有明确的物理意义。反S函数不仅在中国城市适用,在全球多个国家的不同规模城市仍然适用[9-10];反S函数不仅可以拟合建设用地密度空间衰减[11],还可以拟合城市人口密度、路网密度、电子地图兴趣点(POI)密度的空间衰减特征[12⇓-14]。
夜间灯光强度与城市建设用地密度相同,都与城市人口密度紧密相关。城市人口稠密地区,社会经济活动更活跃,夜间灯光亮度值也越大;人口稀疏,夜间灯光亮度值也更低。城市土地密度的反S函数模型对于夜间灯光数据是否适用,夜间灯光强度空间衰减规律反映了城市扩张及城市形态的何种变化?本文以中国32个主要城市为研究区,利用圈层梯度分析法和反S函数对2012年和2020年2期夜间灯光数据的空间衰减进行拟合,探究反S函数模型对于夜间灯光数据的适用性及其表征城市扩张过程的能力;还从城市扩张幅度和紧凑度方面分析和讨论2012—2020年间中国主要城市的城市扩张格局与形态变化,以期为定量刻画城市空间扩张特征提供参考。
1 数据和方法
1.1 研究区域
本文选取中国32个主要城市作为研究样本,包括4个直辖市和28个省会城市,如图1所示。所选城市包括北京、上海、广州等超大型城市,武汉、成都、杭州等特大型城市,以及哈尔滨、兰州、西宁等大中型城市。所选城市处于不同发展阶段,具有不同的城市空间扩张特征,并且空间分布广泛。鉴于此,选取的研究样本对于分析中国不同区域城市扩张特征具有代表性。
图1
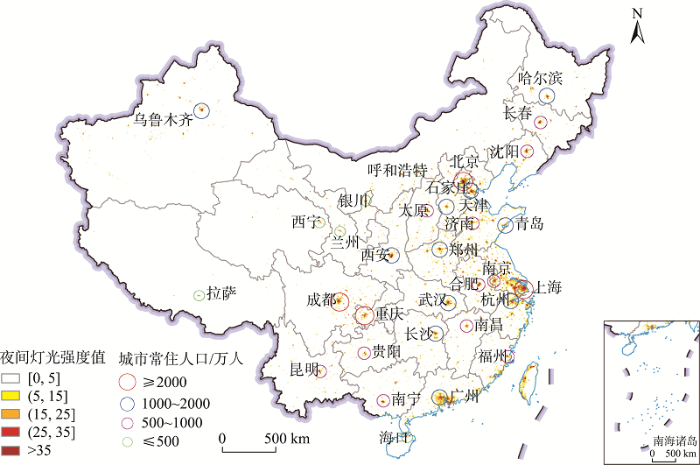
图1
样本城市空间分布
注:此图基于自然资源部标准地图服务网站下载的审图号为GS(2020)4632号的标准地图制作,底图无修改。
Fig.1
Spatial distributions of the 32 sample Chinese cities
1.2 数据及预处理
图2
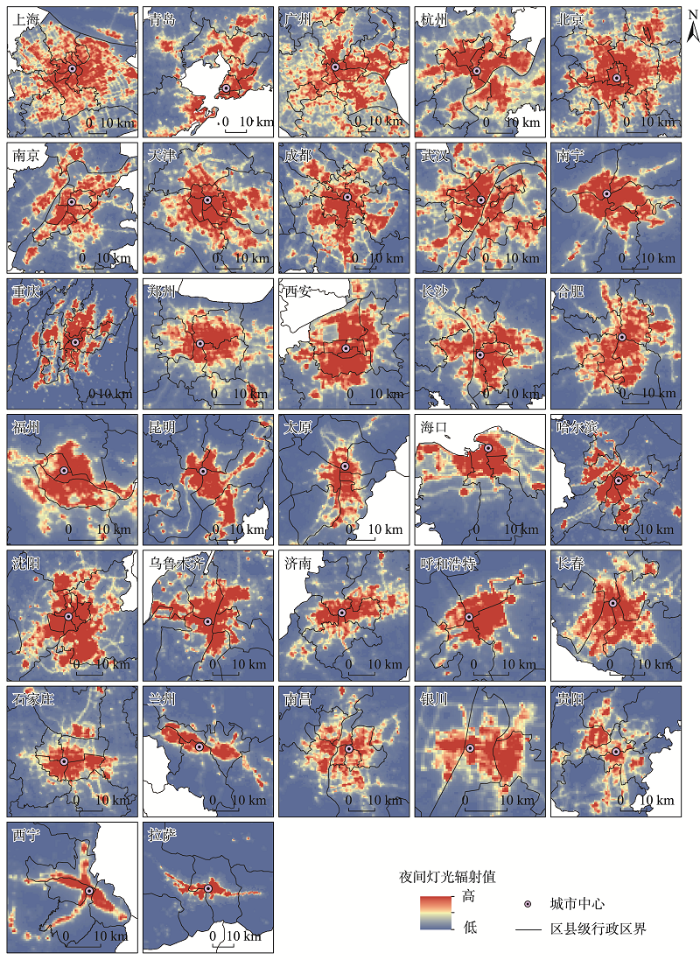
图2
32个城市2020年夜间灯光辐射值空间分布
Fig.2
Spatial distributions of nighttime lights in the 32 sample cities in 2020
1.3 圈层梯度分析法
图3
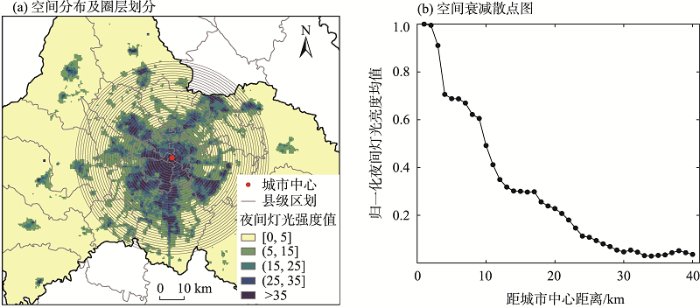
图3
成都市2020年夜间灯光空间分布及圈层划分(a)和归一化夜间灯光亮度均值的空间衰减(b)
Fig.3
Spatial distributions of nighttime lights (a) and distance decay (b) in Chengdu City in 2020
同心环内的夜间灯光亮度均值定义为圈层内夜间灯光亮度值总和与圈层面积之比。本文以2020年城市夜间灯光影像为基准选择城市预设边界,并对各城市2012年和2020年的圈层夜间灯光亮度均值进行离差标准化处理,使夜间灯光数据线性映射到0~1之间。夜间灯光数据归一化公式为:
式中:
由成都市2020年圈层归一化夜间灯光亮度值随到城市中心距离的衰减特征可以看出:城市夜间灯光亮度值在城市核心区最高,随着向四周的距离增加,夜间灯光强度先缓慢衰减,然后快速衰减,再次缓慢衰减,最终在城市边缘区趋于0,其衰减曲线呈现“反S”形态(图3b)。
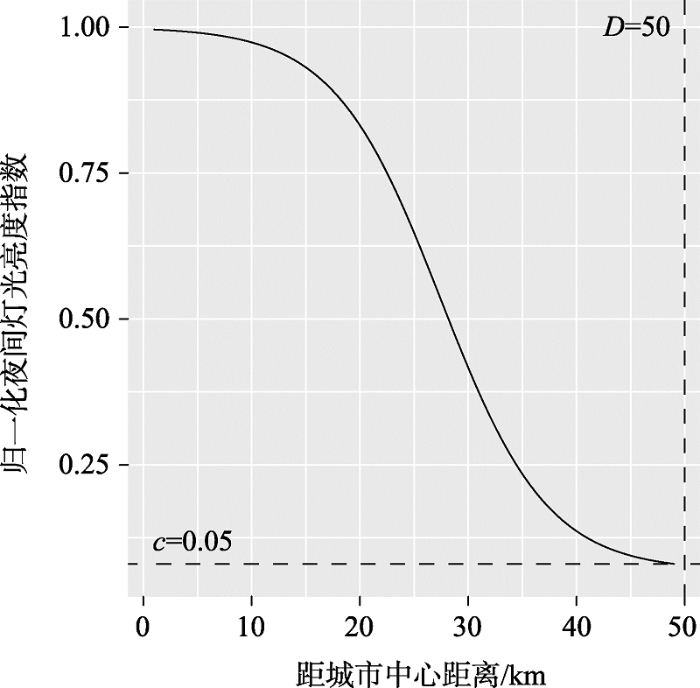
1.4 反S函数
图4
2 结果与分析
2.1 夜间灯光强度衰减特征与拟合
图5
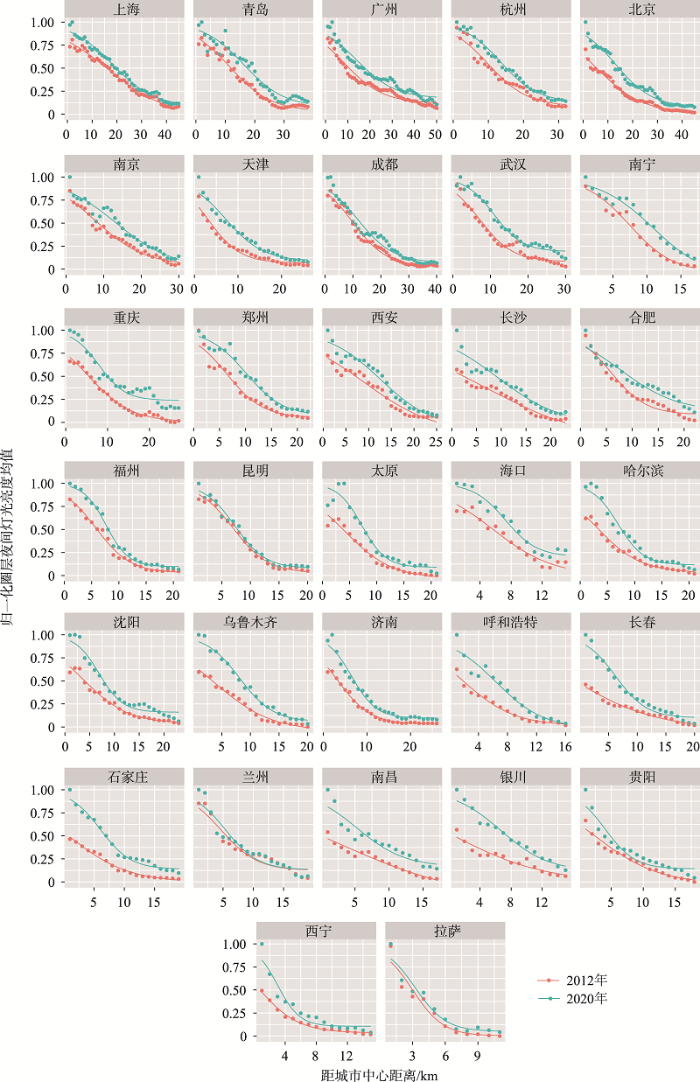
图5
中国32个主要城市夜间灯光亮度空间衰减特征及反S函数拟合曲线
Fig.5
Distance decay of nighttime lights and fitting curves using the inversed-S function in 32 major cities in China
表1 各城市反S函数拟合参数
Tab.1
| 城市 | 2012年 | 2020年 | |||||||
|---|---|---|---|---|---|---|---|---|---|
| D/km | D/km | ||||||||
| 上海 | 2.26 | 0.02 | 63.59 | 0.995 | 2.95 | 0.08 | 70.71 | 0.992 | |
| 青岛 | 1.55 | 0.03 | 43.96 | 0.989 | 2.29 | 0.08 | 63.05 | 0.971 | |
| 广州 | 0.88 | 0.12 | 31.03 | 0.981 | 1.57 | 0.07 | 54.25 | 0.971 | |
| 杭州 | 1.69 | 0.09 | 38.03 | 0.985 | 2.51 | 0.13 | 52.27 | 0.992 | |
| 北京 | 2.51 | 0 | 39.09 | 0.995 | 2.70 | 0.05 | 52.18 | 0.985 | |
| 南京 | 1.13 | 0.04 | 29.75 | 0.989 | 1.68 | 0.01 | 50.77 | 0.973 | |
| 天津 | 0.74 | 0.02 | 30.82 | 0.989 | 1.51 | 0.05 | 46.28 | 0.981 | |
| 成都 | 1.53 | 0.03 | 37.31 | 0.992 | 1.80 | 0.07 | 45.54 | 0.977 | |
| 武汉 | 1.49 | 0.08 | 26.43 | 0.987 | 2.71 | 0.09 | 41.66 | 0.991 | |
| 南宁 | 2.13 | 0.04 | 27.78 | 0.989 | 2.71 | 0.05 | 39.16 | 0.994 | |
| 重庆 | 0.96 | 0.01 | 29.86 | 0.997 | 2.41 | 0.04 | 38.92 | 0.967 | |
| 郑州 | 1.69 | 0.05 | 23.56 | 0.982 | 2.66 | 0.07 | 38.38 | 0.988 | |
| 西安 | 0.73 | 0.05 | 21.04 | 0.986 | 1.54 | 0.04 | 38.06 | 0.977 | |
| 长沙 | 1.56 | 0.04 | 24.83 | 0.989 | 2.38 | 0.03 | 35.25 | 0.953 | |
| 合肥 | 1.59 | 0.08 | 20.04 | 0.980 | 1.39 | 0.12 | 29.76 | 0.971 | |
| 福州 | 1.67 | 0.03 | 21.18 | 0.996 | 2.47 | 0.10 | 28.55 | 0.995 | |
| 昆明 | 1.12 | 0.03 | 25.92 | 0.996 | 1.73 | 0.08 | 27.15 | 0.993 | |
| 太原 | 1.02 | 0.03 | 14.34 | 0.992 | 2.09 | 0.09 | 27.03 | 0.969 | |
| 海口 | 1.34 | 0 | 20.80 | 0.986 | 1.79 | 0.20 | 26.75 | 0.982 | |
| 哈尔滨 | 0.66 | 0.03 | 10.64 | 0.996 | 1.76 | 0.12 | 25.91 | 0.982 | |
| 沈阳 | 0.68 | 0.04 | 12.55 | 0.995 | 2.70 | 0.16 | 25.63 | 0.978 | |
| 乌鲁木齐 | 0.66 | 0.04 | 13.19 | 0.996 | 2.61 | 0.06 | 24.58 | 0.992 | |
| 济南 | 0.68 | 0.03 | 10.49 | 0.998 | 2.15 | 0.10 | 24.07 | 0.986 | |
| 呼和浩特 | 0.56 | 0.01 | 7.14 | 0.994 | 1.77 | 0.02 | 23.52 | 0.964 | |
| 长春 | 0.83 | 0.05 | 6.48 | 0.996 | 2.13 | 0.10 | 23.02 | 0.979 | |
| 石家庄 | 1.07 | 0 | 11.29 | 0.997 | 2.19 | 0.14 | 22.21 | 0.988 | |
| 兰州 | 1.39 | 0.12 | 16.76 | 0.968 | 1.81 | 0.13 | 19.66 | 0.953 | |
| 南昌 | 0.77 | 0.09 | 9.75 | 0.990 | 1.39 | 0.16 | 19.36 | 0.935 | |
| 银川 | 0.75 | 0.09 | 5.07 | 0.995 | 2.08 | 0.04 | 16.11 | 0.983 | |
| 贵阳 | 0.44 | 0.02 | 8.62 | 0.989 | 1.54 | 0.04 | 14.33 | 0.951 | |
| 西宁 | 0.72 | 0.02 | 4.21 | 0.996 | 2.01 | 0.09 | 12.97 | 0.962 | |
| 拉萨 | 0.75 | 0 | 10.00 | 0.968 | 1.94 | 0.05 | 10.97 | 0.971 | |
从拟合曲线形态来看,夜间灯光强度的空间衰减普遍呈现先缓慢衰减、再快速衰减、最后缓慢衰减的“反S”形态(图5)。相对于2020年,各城市2012年中心区域缓慢衰减区间较短。2020年大部分城市拟合曲线“反S”形态完整,城市核心区出现明显的平缓特征。两期夜间灯光数据拟合曲线之间间隔越大,则该城市在2012—2020年间夜间灯光强度增长幅度更大。由表1可以看出,反S函数具有很好的拟合结果,所有城市的R2均在0.90以上。①
2.2 城市扩张过程与形态变化
本文根据各城市参数
图6
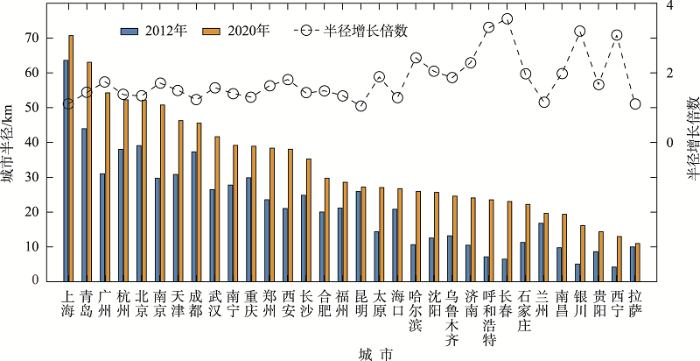
图6
2012年与2020年各城市半径对比
Fig.6
Comparison of the radius of the sample cities in 2012 and 2020
北京、上海为超大型城市,其半径增长速率较低。广州虽然也属超大型城市,但因其受地理位置因素影响,形成了沿江发展、顺山延伸的分散型城市格局,实体城市范围与佛山相融合,并不是严格按照城市中心扩张,因此城市半径增长幅度较大。杭州、武汉、南京等特大型城市可利用未建设土地密度比北京、上海更高,较西部城市具有更好的经济发展基础,2020年城市半径增长至2012年的1.5倍左右。西部和东北部城市在近几年发展尤为迅速,由于城市半径基数小,可发展空间大,城市半径增长幅度大,速度快。
参数
图7
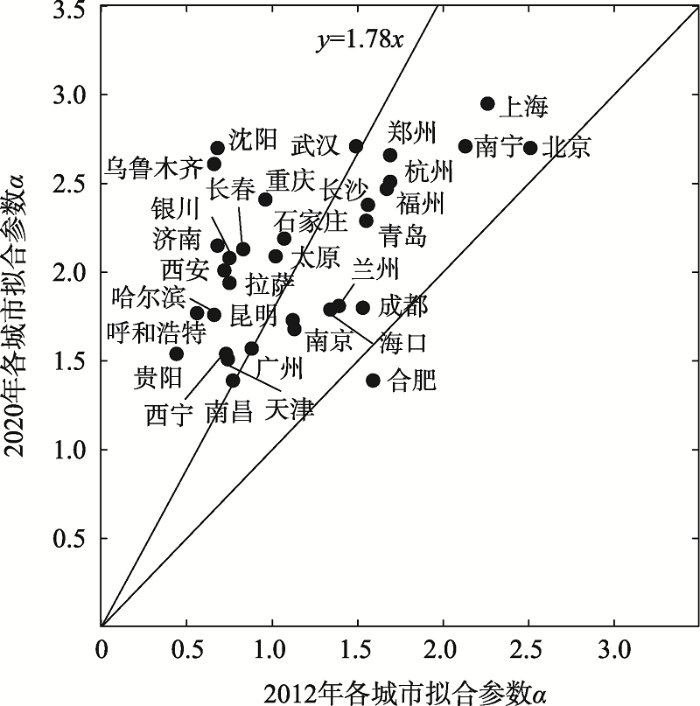
图7
2012年与2020年各城市紧凑度对比
Fig.7
Comparison of compactness of the sample cities in 2012 and 2020
3 结论与讨论
3.1 结论
本文采用反S函数模型揭示了城市夜间灯光强度空间衰减规律,并讨论了其在测度城市扩张过程和形态变化的应用。主要结论如下:
(1) 城市夜间灯光强度随到城市中心距离增加而逐渐衰减,其衰减特征表现为先缓慢衰减,后快速衰减,再缓慢衰减,整体呈现反S型变化。反S函数可以很好地拟合夜间灯光强度空间衰减过程,拟合优度(R2)在0.9以上。
(2) 反S函数模型参数D和α的变化分别反映了城市扩张过程和形态变化。2012—2020年间,各城市半径(参数D)增长到1.1~3.6倍;城市规模较小的呼和浩特和长春经历的夜间灯光增长幅度最大,而东部沿海城市城市增长幅度较小。参数α的变化说明中国主要城市由夜间灯光反映的空间形态趋于紧凑。反S函数为刻画夜间灯光强度空间衰减提供了新工具,为测度城市扩张和形态变化提供了新指标。
3.2 讨论
城市土地扩张最直接的是建成区面积不断扩大,也即城市半径的增长。在建成区面积和城市半径增长的同时,城市形态也会变化,变得更加紧凑或松散;这可用紧凑度来衡量。本文采用夜间灯光数据,基于反S函数模型测度中国主要城市2012—2020年城市空间扩张特征及变化,拟合得到的参数D和α分别反映了城市半径和紧凑度。2012—2020年间,中国主要城市在空间上均有拓展,这直接反映在城市半径的普遍增长;由参数α表征的城市形态普遍变得更加紧凑,这说明过去近10 a间由夜间灯光反映的城市社会空间集聚效应更加明显。夜间灯光强度空间衰减规律为分析城市扩张过程和形态变化提供了新视角。
本文亦存在不足。夜间灯光强度和城市建设用地密度具有相近的衰减特征,但由于夜间灯光的集聚效应更加明显,其空间衰减更快。后续研究可以对比夜间灯光和城市建设用地密度的“反S”衰减特征,探讨城市社会经济活动和物理空间的集聚效应的差异。此外,本文只选择了单一的城市主中心,未来可针对城市主、副中心建立多中心模型[35],进一步探究城市要素的空间集聚和距离衰减效应。
参考文献
The dimensions of global urban expansion: Estimates and projections for all countries, 2000-2050
[J].
可持续城市化与国土空间优化
[J].
Sustainable urbanization and territorial spatial optimization
我国土地城镇化与人口城镇化的趋势与问题
[J].
Trends and problems of China's land urbanization and population urbanization
70 years of urban expansion across China: Trajectory, pattern, and national policies
[J].
Form follows function: Reformulating urban population density functions
[J].
Urban population densities
[J].
1993-2008年中国土地与人口城市化协调度及区域差异
[J].
DOI:10.11820/dlkxjz.2014.05.006
[本文引用: 1]

当前,中国正经历着城市化的飞速发展和重要转型,认识把握土地城市化与人口城市化协调性和区域差异,对统筹区域城市化的“人地配置”和实现新型城镇化意义重大。选取全国地级以上城市为样本,运用协调度指数、塞尔指数等模型,考察20世纪90年代城市化快速发展以来,土地城市化与人口城市化速率及其协调性的时空变化,在此基础上分析由此造成的建成区非农人口密度变化及区域差异。结果表明:① 土地财政主导下,城市扩张速度普遍加快,土地城市化与人口城市化不协调现象由东部地区扩展到全国范围;② 地级以上城市建成区非农人口密度普遍下降,而直辖市等经济发达地区建成区的大幅扩张导致非农人口密度区域差异缩小;③ 区域间建设用地指标与人口非农化相匹配的“人地挂钩”,是未来实现健康、协调城市化的有效途径。
Coordination and regional difference of urban land expansion and demographic urbanization in China during 1993-2008
Urban land density function: A new method to characterize urban expansion
[J].
Urban expansion and form changes across African cities with a global outlook: Spatiotemporal analysis of urban land densities
[J].
Understanding urban expansion combining macro patterns and micro dynamics in three Southeast Asian megacities
[J].
武汉市城市空间集聚要素的分布特征与模式
[J].
DOI:10.11821/dlxb201708008
[本文引用: 1]
不同城市要素的集聚现象具有不同的空间模式,定量化研究城市要素集聚模式的差异和联系对于理解城市发展机理、合理制定城市规划具有重要意义。本文以武汉市为例,获取不透水表面、商业服务业网点(POI)、人口、容积率、城市道路等城市要素数据;采用核密度估计法识别城市主次中心,从城市要素的分布形态、集聚程度、集聚模式等来研究城市要素的空间分布格局特征。研究发现,武汉市呈现“一主七副”的多中心结构,各城市要素从城市中心向外呈反S型的圈层递减。采用集聚度指数衡量城市要素的集聚水平,结果显示商业POI、人口密度的集聚程度最大,其次是容积率、道路密度、不透水表面占比。高度集聚的商业POI、人口密度呈现出点状模式与带状模式相结合的分布模式,中度集聚的道路密度、容积率呈现点状模式、环状模式与轴状模式相结合的分布模式,低度集聚的不透水表面密度主要表现为环状模式。城市中心的吸引、立体空间开发等促进了城市要素的向心集聚,交通干线、稀缺景观资源的廊道效应等重塑了城市要素的空间分布形态。
The characteristics and patterns of spatially aggregated elements in urban areas of Wuhan
DOI:10.11821/dlxb201708008
[本文引用: 1]
Different urban elements may exhibit various aggregation patterns. It is of great significance to quantitatively investigate the disparity and connection among various aggregation patterns of urban elements for understanding the mechanism of urban development and supporting urban planning. Taking Wuhan city, Central China, as a case, we collected five types of urban elements, namely, impervious surface, population density, Point of Interest (POI), plot ratio, and road network, to explore their spatial distribution and characteristics of aggregation patterns. We first used Kernel Density Estimation (KDE) method to identify city centers and we found that there is one major center and seven sub-centers in Wuhan. Then we partitioned the study area by gradient analysis, and calculated the densities of urban elements. The density of urban element decreases outward from the centers, which is fitted well using "Inverse S-shaped" function. We used Concentration Degree Index (CDI) to reflect the aggregation degree of urban elements. The results indicate that the degrees of the aggregation of urban elements are: Commercial POI > population > plot ratio > road. Commercial POI and population are highly aggregated in the urban core area, while plot ratio and road are moderately aggregated in the urban core area. The spatial patterns of highly aggregated commercial POI and population are the combination of point pattern and zonal pattern, while the spatial patterns of moderately aggregated road network and plot ratio are the combination of point pattern, ring pattern and axial pattern. As for the lowly aggregated impervious surface, it shows a ring pattern. The attraction effect of city centers and vertical development promote the center-oriented agglomeration of urban elements. At the same time, the transportation lines and corridor effects of the scarce landscape resources reshape the spatial distribution pattern of urban elements.
Land surface temperature and urban density: Multiyear modeling and relationship analysis using MODIS and landsat data
[J].
Exploring the relationship between LST and land cover of Bengaluru by concentric ring approach
[J].
Understanding the macro-micro dynamics of urban densification: A case study of different sized Indian cities
[J].
The Night Light Development Index (NLDI): A spatially explicit measure of human development from satellite data
[J].
长江三角洲地区高温热浪人群健康风险评价
[J].
DOI:10.3724/SP.J.1047.2017.01475
[本文引用: 1]
在全球极端气象、气候事件频发的背景下,获取高分辨的灾害风险信息对于区域防灾减灾决策具有重要的参考价值。而在当前的灾害风险评估中,基于行政单元的人口和社会经济等承灾体信息与栅格水平上的致灾因子普遍存在空间不匹配的现象。本文通过融合多源遥感数据和人口、社会经济统计数据,在利用人居指数对高温人口暴露进行空间化的基础上,获取了250 m分辨率的长江三角洲地区高温热浪人群健康风险空间格局。结果表明,风险等级较高的地区集中在上海、常州、杭州、宁波、无锡、嘉兴、泰州等城市的中心城区,主要是较高的人口暴露度和城市高温共同作用的结果;而大城市近郊以及各规模较小的城区的风险等级次之;相对欠发达地区虽然人口暴露程度较低,但较高的高温危险性和社会经济脆弱性指数使得这些地区的高温人群健康风险也不容忽视。识别高风险地区的风险主导因子对于提高人群高温适应能力以及减轻高温健康风险具有重要意义。
Spatially explicit assessment of heat health risks using multi-source data: A case study of the Yangtze River Delta region, China
Detecting spatiotemporal dynamics of global electric power consumption using DMSP-OLS nighttime stable light data
[J].
基于夜光遥感与POI数据空间耦合关系的南海港口城市空间结构研究
[J].
DOI:10.12082/dqxxkx.2018.180020
[本文引用: 1]
南海港口城市研究是南海资源环境监测的重要内容,目前对于南海港口城市空间结构特别是港口在城市空间结构中的地位缺乏研究。夜光遥感数据和POI数据均为城市空间结构研究的重要数据源,但对于2种数据的空间耦合关系与集成应用研究存在不足。针对上述问题,本文选取南海港口城市典型代表的三亚市为研究区,以研究区2016年NPP-VIIRS夜光遥感数据和POI数据为数据源,利用叠加分析将夜光遥感数据和POI核密度分析结果数据分别网格化。然后,利用双因素组合制图法对两种数据的空间耦合关系进行可视化,分析空间耦合关系相异区域和城市空间结构的关系,并在此基础上探讨港口在三亚城市结构中的地位。研究表明,三亚市夜光遥感和POI数据的空间分布总体趋势相一致,空间耦合关系相近的区域占比达85.6%;夜光遥感和POI数据空间耦合关系在三亚市内存在一定量的相异区域,如新城区、经济开发区、城市边缘区和乡镇中心等,结合2种数据的特点可以更显著地表征这些区域的城市空间结构特征;三亚市作为重要的南海港口城市,其城市的中心区域与港口密切关联。本研究为港口城市空间结构研究提供了新视角。
Urban spatial structure of port city in South China Sea based on spatial coupling between nighttime light data and POI.
夜间灯光遥感与城市问题研究: 数据、方法、应用和展望
[J].
Nighttime light remote sensing and urban studies: Data, methods, applications,and prospects
论夜光遥感数据挖掘
[J].
An overview on data mining of nighttime light remote sensing
夜间灯光遥感对城市发展类动能与相似性评估
[J].
Kinetic energy assessment and similarity analysis of urban development based on NPP-VIIRS nighttime light remote sensing
中国大城市蔓延指数的开发
[J].
DOI:10.11821/dlxb202012013
[本文引用: 1]
城市蔓延已成为具有普遍意义的现象,然而,城市蔓延内涵的争议性和模糊性问题一直没有得到很好的解决。本文将城市蔓延定义为一种低效、低密度、无序的城市空间开发模式,这种开发模式与中国城市高质量发展的目标和要求是相违背的。为实现对城市蔓延的宏观管理和精准调控,有效遏制城市蔓延带来的负面影响,本文开发了一套多维度、可比较的,并且与城镇化质量紧密关联的城市蔓延指数。基于卫星影像与人口、经济统计数据,选取代表城市蔓延核心特征的多个指标,采用主成分分析法计算了全国主要大城市2014年城市蔓延指数。结果发现,经济效率维主成分对综合蔓延指数贡献最大(41.30%),人口密度维主成分次之(20.49%),空间形态维主成分贡献率排第三(12.35%)。值得注意的是,许多经济发展较落后的城市因为经济效率维度的短板效应显著而被列入最蔓延的行列。此外,不同维度城市蔓延指数空间分布差异明显,并且综合蔓延指数与城市规模呈一定的负相关关系。
Developing an urban sprawl index for China's mega-cities
DOI:10.11821/dlxb202012013
[本文引用: 1]
Urban sprawl has become a global phenomenon. There is, however, no consensus on the connotation of urban sprawl, which still remains subjective to controversy and ambiguity. In this paper, urban sprawl was defined as an inefficient, low-density and disordered mode of urban space development. The definition includes three of the most recognized characteristics of urban sprawl summarized from previous studies. Characterized by the features mentioned above, urban sprawl has been recognized as an important challenge to the high-quality development of cities in China. Therefore, to build an urban sprawl index that can reflect the quality of urbanization is of significance to macro-micro regulation of urban sprawl. Multiple metrics representing the core characteristics of urban sprawl were selected as measuring indexes, based on satellite images and socio-economic statistical data. Furthermore, in order to make the results more objective and comparable, the method of principal component analysis was applied to calculate the comprehensive sprawl index. Finally, 106 of China's mega-cities were chosen as cases, and the degree of urban sprawl of each city was measured for the year 2014. As shown from the results, the first principal component mainly reflected the dimension of economic efficiency, contributing 41.30% to the comprehensive sprawl index. The second principal component mainly represented the dimension of population density, followed by the third principal component that described morphological dimension. It is noteworthy that, because the short board effect of economic efficiency dimension was significant, many less-developed cities were ranked to a high sprawling level. In addition, the spatial distribution of different dimensions of urban sprawl index were distinct. Population density and land use efficiency were generally consistent with each other, while the distributing law of city form showed distinguishing features. Last but not least, the comprehensive sprawl index had a certain negative correlation with city scale, which reminds us to pay more attention to urban sprawl in medium-sized cities in the future.
A technique for using composite DMSP/OLS ''city lights'' satellite data to map urban area
[J].
基于夜间灯光数据的环渤海地区城市化过程
[J].
The urbanization model and process in Bohai Sea surrounding area in the 1990s by using DMSP/OLS data
基于夜间灯光数据的城市中心区域提取与分析: 以重庆市主城区为例
[J].
Urban centers extraction and analysis using night time light date: A case study of main urban areas of Chongqing
基于DMSP_OLS灯光数据的1992-2010年中国城市空间扩张研究
[J].
DOI:10.13249/j.cnki.sgs.2014.01.129
[本文引用: 1]
选择1992、2000和2010年的DMSP_OLS灯光数据,改进了基于统计数据提取城镇用地的算法,使用Python语言编程实现3个时期中国城市建成区的提取。利用ArcGIS 10、Visual FoxPro 6.0等软件,选择城市形态紧凑度和城市扩张速度2个指标,分别从城市规模(超大城市、特大城市、大城市、中等城市和小城市)、大区域(东部、中部、西部和东北区)、省级行政区划(省、自治区和直辖市)3个空间尺度分析了城市的空间扩张情况。结果表明:① 从城市形态紧凑度来看,同一年份,城市规模越大,城市外部形态紧凑度越小;而中、西部城市平均紧凑度大于东部、东北部。1992~2010年,除大城市和小城市平均紧凑度指数略微变小、基本不变外,其余各等级城市均变大;东部和西部城市平均紧凑度指数变小,而东北和中部变大。② 从城市扩张速度来看,同一时间段内,城市规模越大,城市建成区年均扩张速度越大;1992~2010年,东部城市建成区扩张速度最大,东北最小,中、西部次之;其中,北京、重庆、上海、天津扩张速度大,广东、江苏、山东、浙江和福建扩张速度次之,其余省份扩张速度较小;近20 a来,所有等级城市、不同区域城市以及各个省份内城市建成区在加速扩张。
Urban spatial expansion based on DMSP_OLS nighttime light data in China in 1992-2010
基于DMSP/OLS影像的我国主要城市群空间扩张特征分析
[J].
Analysis of the spatial expansion characteristics of major urban agglomerations in China using DMSP /OLS images
基于夜光遥感影像的“一带一路”沿线国家城市发展时空格局分析
[J].
The spatial temporal pattern analysis of city development in countries along the Belt and Road Initiative based on nighttime light data
Timely and accurate national-scale mapping of urban land in China using Defense Meteorological Satellite Program's Operational Linescan System nighttime stable light data
[J].
Monitoring urbanization dynamics in India using DMSP/OLS night time lights and SPOT-VGT data
[J].
Urban built-up area extraction from log-transformed NPP-VIIRS nighttime light composite data
[J].
Analyzing the impacts of urban expansion on green fragmentation using constraint gradient analysis
[J].
上海及周边主要城镇城市用地扩展空间特征及其比较
[J].
The comparison of spatial characteristics in urban landuse growth among the central and sub-cities in Shanghai region
城市土地密度圈层分布的反S型规律及其应用
[J].
Inverse S-shape rule of urban land density distribution and its applications
基于多源数据的武汉市多中心空间结构识别
[J].
DOI:10.18306/dlkxjz.2019.11.003
[本文引用: 1]
研究城市不同要素空间集聚水平与层级差异、明确城市各职能中心分布,对城市多中心空间结构的发展引导和规划调控具有重要意义。论文分别采用兴趣点(points of interest, POI)、夜间灯光和路网3种数据,利用局部等值线树算法,识别武汉市多中心空间结构。研究表明:① 武汉不同城市要素的总体集聚水平不均衡,其中在汉阳集聚水平较低,在汉口和武昌集聚水平较高,特别是二环以内区域;② 武汉中央活动区发展比较均衡,内部各城市要素高度集聚,随着向外扩展,部分城市要素易于在局部集聚形成城市中心;③ 结合武汉圈层发展布局,城市中心沿环线的“商-住-工”职能分布模式逐步确立,其中内环以及二环区域已形成稳定的商服中心;二环附近综合组团内部出现了较具代表性的居住中心;三环外的沌口和武钢主导发展工业,是典型的工业中心。
Identification of the polycentric spatial structure in Wuhan City based on multisource data
DOI:10.18306/dlkxjz.2019.11.003
[本文引用: 1]
Examining the spatial agglomeration level and hierarchy differences of various urban elements and the distribution of diverse functional centers is significant for guiding the development and regulating the plans of the polycentric spatial structure of cities. City center is represented by various urban elements. It is difficult to fully identify and recognize the urban spatial structure by using a single data source. Thus, combining different types of data to deeply understand the status of urban internal development is necessary. This study used points of interest (POI), nighttime light, and road network data and adopted the local contour tree algorithm to identify the polycentric spatial structure in Wuhan City. The results show that: 1) The overall agglomeration level of various urban elements in the three towns of Wuhan is not balanced—the agglomeration level is higher in Hankou and Wuchang, and lower in Hanyang. 2) The development of the core area of Wuhan City is relatively mature. In the process of outward expansion, various urban elements tend to aggregate in local areas to form an urban center. 3) Considering the zonal development of Wuhan City, the functional distribution model of business-housing-industry corresponding to the ring roads of the city center was gradually established. The inner ring and the second ring regions have formed stable business service centers. Representative residential centers appeared in the multifunctional clusters near the second ring road. Similarly, Zhuankou and Wugang outside the third ring road led the development of industries, and are typical industrial centers.
