

生态系统服务(ecosystem service,ES)是人类从生态系统中获取的各类直接或间接收益[1]。目前,强烈的人类活动产生了一系列生态环境问题[2],主要表现为由ES单一化导致的各类ES间逐渐增强的权衡关系[3],极大威胁人类福祉的持续改善。因此,亟需从多类ES构成出发,探究区域主导ES及其关系,从增进协同、减少权衡角度服务于空间管理和福祉提升。生态系统服务簇(ecosystem service bundles,ESB)为定量研究区域主导ES提供了有效视角。进行多类ES的综合管理比仅关注特定ES的管理更有效[4],因此在黄土丘陵沟壑区等生态脆弱区,识别村域尺度ESB对于厘清农业社会—生态系统的复杂特征、从多重ES供给视角提高ES的福祉贡献具有重要意义。
生态系统服务簇是指共现于某一时空尺度上的多类ES的组合[5]。ESB研究始于2007年[6],最早用于揭示ESB的空间分异[5],随后相关研究在ESB的时序演变[7-8]、ESB与人类福祉的关系[9-10]、空间规划[11⇓-13]等方面进行了深入研究。在ES类型表征上,现有研究大多关注供给服务与调节服务之间的聚簇现象[12,14],对文化服务的聚簇研究十分有限[15⇓-17],或仅通过森林覆盖率[18-19]、游客人数[20-21]等单一指标表征文化服务,这影响了人类对区域非物质利益的强烈诉求与政策管理的有效性。在聚簇的定量方法上,常见的聚类方式包括K-均值聚类与主成分聚类2种[4,22⇓⇓-25]。近年来,神经网络与概率分布模型等聚类方法也用于ESB的识别[26⇓-28],其中高斯混合模型(Gaussian mixture model,GMM)通过考虑数据的空间分布概率来优化重叠聚类误差,从而在ESB的聚类方面具有潜在优势,而目前研究较少。在聚簇的尺度上,相关研究多从省域[5,22]、县域[14,18]、流域[16,19]等大中尺度揭示ESB的空间格局,对村域尺度ESB的时空格局及演化关注还较少。村域是政策管理的基本单位,识别村域尺度ESB的时空格局对从空间视角进行农业生态系统多类ES的综合管理具有重要意义。综上,在ES评价框架下,有必要重新审视ES物质与非物质利益表征的完整性,在对聚簇方法进行优化的同时厘清村域尺度多要素的空间关系,并以此探讨ESB的时空演化。
目前,有关ESB的研究较少考虑地形复杂区域ESB的时空分异。尤其是黄土丘陵沟壑区等生态脆弱、经济落后的复合区域,当地农业生产与生态保护之间存在复杂冲突,亟需利用ESB的新视角和新工具为当地生态管理以及乡村振兴提供思路。鉴于此,本文以地处该区域的陕西省米脂县为例,在量化多类ES的基础上使用高斯混合模型识别村域尺度ESB的时空分布,并结合地形分布指数探究ESB在地形梯度上的分布模式,以期为当地生态管理与农户福祉改善提供依据。
1 研究区概况与数据来源
1.1 研究区概况
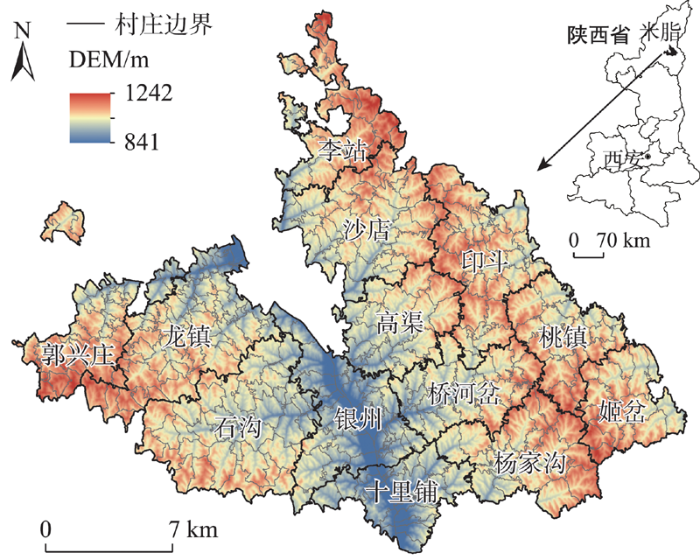
米脂县(109°49′E~110°29′E,37°39′N~ 38°05′N)位于陕西省榆林市东南部(图1),面积1178 km2,属于黄土丘陵沟壑区。气候上属中温带半干旱气候,年平均降水量451.6 mm,降水年较差较大,干旱与洪涝频发是影响食物供给的重要限制因素。地形总体上西北高、东南低;沟壑纵横,地形起伏度大,景观异质性强。土地利用类型以耕地、林地与草地为主,空间分布破碎,影响了各类ES的时空格局及演化。近年来,在退耕还林政策与经济利益的驱动下,地类结构持续优化,为揭示ES及其ESB的时空演化提供了良好的研究平台。
图1
1.2 数据来源与处理
本文所需数据如下:① DEM 数据源于地理空间数据云(
2 研究方法
2.1 生态系统服务量化
(1) 食物供给
式中:FPSi为第i类地类总热量(kcal,1 cal=4.18 J);Yj为第j类农产品单位产量,Aj为第j类农产品面积;Calj为第j类农产品每100 g的热量;i为土地利用类型,j为农产品类型。
(2) 调节服务
表1 调节服务量化模型及参数说明
Tab.1
| 调节服务类型 | 模型公式 | 参数说明 |
|---|---|---|
| 土壤保持 | 式中:SC为土壤流失量,R为降水径流,K为土壤可蚀性,LS为坡度坡长,C为植被覆盖因子,P为水土保持措施因子。模型参数参考研究区已有研究[32],基于InVEST模型土壤保持模块计算 | |
| 水源涵养 | 式中:WCij为产水量,j为地类,i为栅格,ETmean,ij为平均实际蒸散发量, Rainj为年降雨量。模型参数参考黄土高原相关研究[33],基于InVEST模型产水模块计算 | |
| 生境质量 | 式中:Qij为地类j中栅格i的生境质量;Hj为地类j的生境适宜度;Dij为地类j中栅格i的生境退化度;m为半饱和常数;z为归一化常量,取值2.5。模型参数参考研究区已有研究[31],基于InVEST模型生境质量模块计算 |
(3) 文化服务
2.2 生态系统服务簇的识别
高斯混合模型是k个高斯分布函数的线性组合,是目前学习速度最快的概率模型之一[40]。GMM的聚类原理是将每个样本划分到不同高斯分布中获取概率值,选择概率值最大类别作为聚类结果。k个高斯分布对应k个集群,因此计算GMM的概率分布即可求得样本所属聚类。与K-均值聚类为代表的硬聚类相比,GMM依据概率得到的聚类在信息完整性、聚类准确性方面优势明显,尤其提高了在类别重叠时聚类的科学性。设d维随机变量 x =(x1, x2, …, xd)T,则k个高斯分布的GMM公式如下:
式中:N(x|μi,
根据村域多重ES特征,基于GMM进行ESB的聚类与识别。计算村域各ES标准化均值,形成含396个样本(即村庄)、6项特征(即ES)的矩阵X。通过期望最大化(EM)估计模型参数,基于贝叶斯信息准则(BIC)确定最佳ESB数量;通过BIC确定最佳聚类数,是保证GMM结果可靠性的有效手段[41]。
2.3 地形起伏度及其分布指数
地形复杂性是导致黄土丘陵沟壑区诸多地理要素空间格局演化的主要原因[42],其空间不均衡导致了ES的空间异质性[15]:地形约束了耕地总量,限制了农户农耕活动的距离和程度,从而影响食物供给总量及其空间差异;同时,地形对土地利用的自然选择性造成地类之间的天然分割,进而导致调节服务的空间演化;破碎的地形影响了景观结构与功能的完整性,引致了区域间美学价值等文化服务的差异,这些影响使区域内各类ES甚至ESB的分布随地形呈现规律的变化特征。地形起伏度是表征地形切割程度的指标,常用于丘陵沟壑区地形地貌的制图与分析,本文结合分布指数[42],旨在探究ESB与起伏度的时空关联。分布指数通过消除起伏度和ESB的面积比重差异来揭示ESB在起伏度梯度上的迁移情况。公式如下:
式中:P为分布指数,Sij为j级起伏度下i类ESB面积,Si为i类ESB总面积,S为研究区总面积,Sj为j级起伏度总面积;i为ESB类型,j为起伏度等级。P>1,表明某类ESB在某等级起伏度上处于优势分布。
3 结果分析
3.1 生态系统服务时空分异
表2 生态系统服务分级标准
Tab.2
| ES类型 | 分级标准 | ||||
|---|---|---|---|---|---|
| I | II | III | IV | V | |
| 食物供给/109 kcal | <2.60 | 2.60~3.61 | 3.62~4.48 | 4.49~5.45 | >5.45 |
| 土壤保持/106 t | <1.08 | 1.08~1.88 | 1.89~2.89 | 2.90~4.30 | >4.30 |
| 水源涵养/106 m3 | <2.54 | 2.54~4.42 | 4.43~6.78 | 6.79~10.21 | >10.21 |
| 生境质量 | <0.52 | 0.52~0.62 | 0.63~0.69 | 0.70~0.76 | >0.76 |
| 景观美学 | <0.59 | 0.59~0.63 | 0.64~0.66 | 0.67~0.69 | >0.69 |
| 休闲娱乐/% | <0.20 | 0.20~0.61 | 0.62~1.34 | 1.35~2.99 | >2.99 |
图2
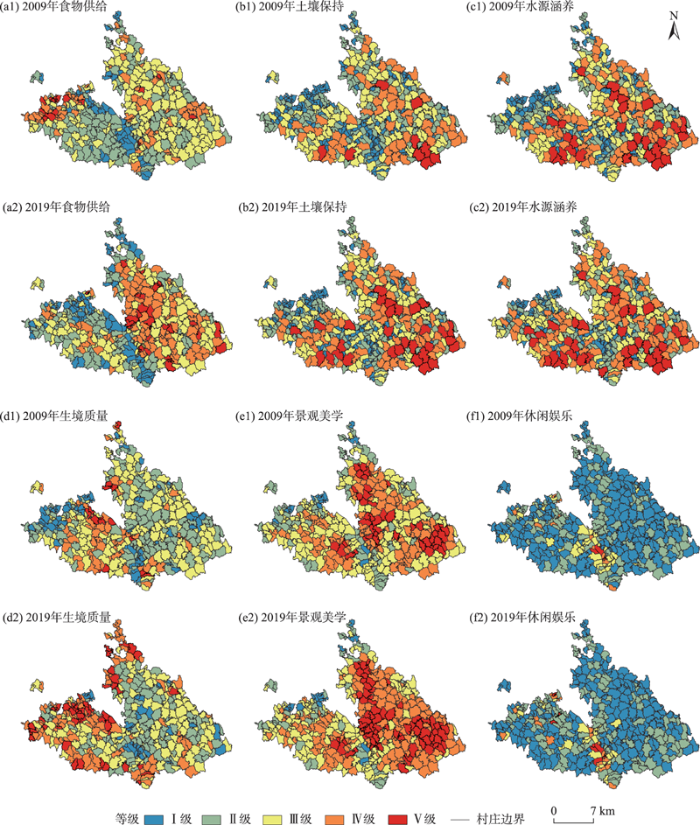
图2
米脂县村域生态系统服务的时空分异
Fig.2
Spatial and temporal differentiation of village ecosystem services in Mizhi County
图2中,各类ES的空间分异及演化呈现如下特点:① 2009、2019年米脂县食物供给总量分别为1.49×10¹²、1.53×10¹² kcal,2019年比2009年增加了2.68%,增长幅度较小。图2a1中,IV~V级食物供给分布于西北郭兴庄以及川道东部,I~II级食物供给分布于川道以及石沟,这反映了不同村庄农业发展水平的差异;2019年食物供给空间变化明显(图2a2),IV~V级集中于高渠和沙店,郭兴庄食物供给能力明显下降,这与10 a间地类的空间演变基本一致,同时耕地减少情况下食物供给总量的上升也说明了农业耕作效率的提高。② 土壤保持总量分别为6.96×10⁸、8.24×10⁸ t,2019年比2009年增加了18.39%;同时水源涵养总量分别为1.86×10⁹、2.05×10⁹ m3,2019年比2009年增加了10.22%。土壤保持与水源涵养能力得到较大提升,这与退耕还林政策关系密切,且两者空间分异大致呈现东南高西北低的梯度变化,具有较强协同性。土壤保持与水源涵养的村庄变化零散,西部乡镇以及川道地区村庄土壤保持得到提升;西部乡镇的水源涵养能力有较大提升,川道地区变化不大(图2c1、c2)。③ 生境质量指数分别为0.58、0.64,2019年比2009年提高了10.34%,这说明了当地环境整体改善。图2d1中,IV~V级生境质量集中于龙镇东北以及石沟,I~II级生境质量则位于川道下游、郭兴庄以及桃镇。生境质量的空间演变表现在郭兴庄、龙镇等西北部乡镇生境质量的提升,以及川道中心区生境质量的下降,这主要是由于人类对生态环境的扰动提高了生境敏感性,引致区域环境的差异演变。④ 文化服务整体变化不大,其中景观美学指数分别为0.65、0.68,2019年比2009年提高了4.62%,休闲娱乐指数分别为0.30%、0.32%,2019年比2009年提高了6.67%。景观美学空间分布从期初的川道东部高值居多演变为全域整体居于高值;川道以及郭兴庄沟谷是景观美学的低值区,且变化不大。与景观美学相反,休闲娱乐高值主要分布于川道地区,其他乡镇的休闲娱乐服务均为低值,且研究期间村庄数量变化不大。
3.2 生态系统服务簇时空分异
图3
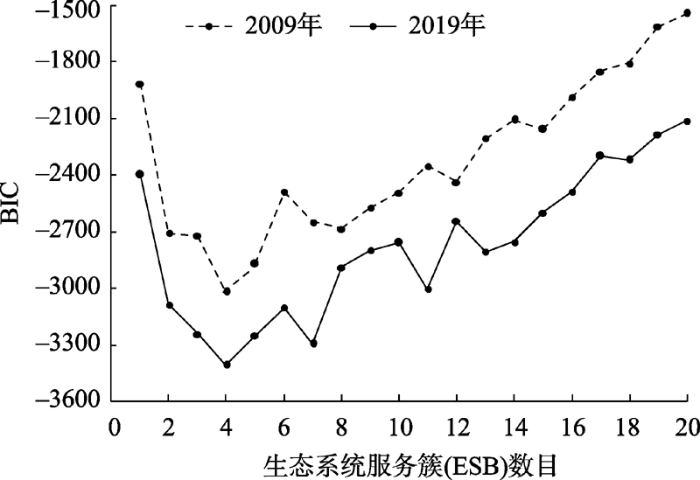
图3
生态系统服务簇数目的确定
Fig.3
Determination of the number of ecosystem service bundles
图4
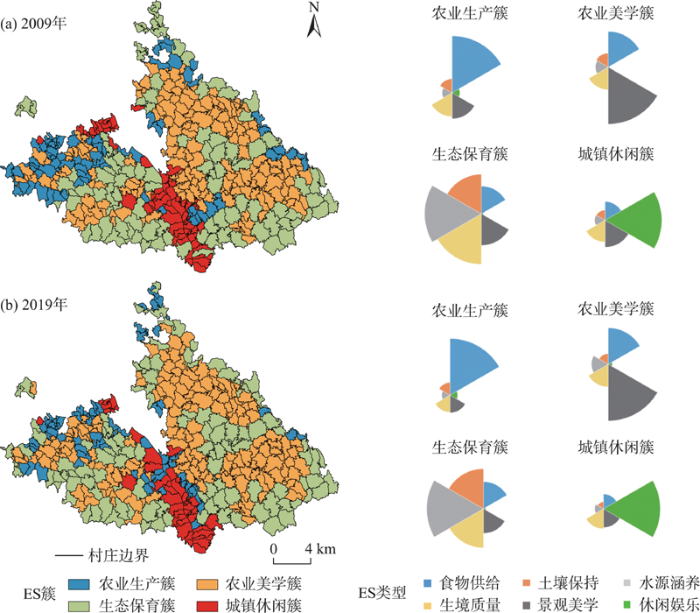
图4
米脂县村域生态系统服务簇的时空分异
Fig.4
Spatial and temporal differentiation of village ecosystem service bundles in Mizhi County
图5
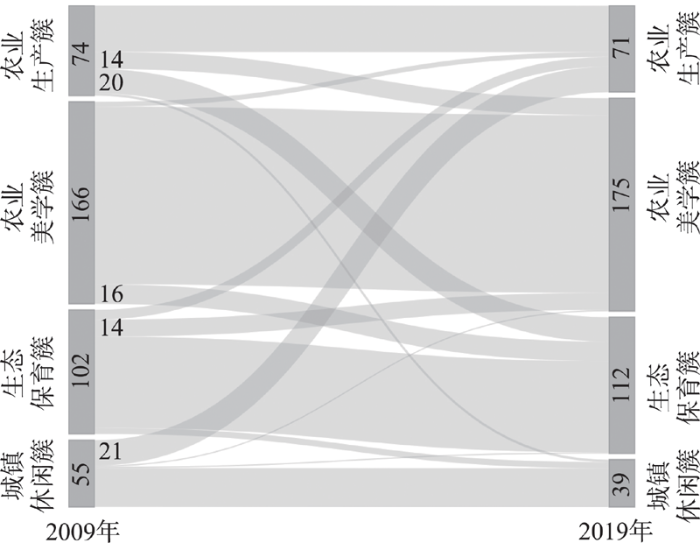
结合图4和图5,各类ESB的数量变化和空间演化呈现如下特征:① 农业生产簇以食物供给为最高,调节服务与文化服务供给量相近,主要位于西部的郭兴庄与龙镇,空间分布较为分散;研究期间农业生产簇村庄数量总体减少3个,同时川道地区增加了个别以食物供给为主导的村庄。② 农业美学簇以食物供给和景观美学为主导服务,即耕地的优化配置通过改变景观结构的组成进而提升了农业景观美学价值。该类ESB主要分布于川道东部沙店、高渠、印斗以及桃镇等乡镇,该区域是米脂县现代农业产区,注重耕地增产与景观维护的协同效应;研究期间农业美学簇村庄数量总体增加9个,且空间变化不大,郭兴庄与龙镇的农业美学簇逐渐呈连片趋势。③ 生态保育簇以调节服务(水源涵养、土壤保持)为主导,区域内以生态恢复为主,林地覆盖率较高,主要分布于石沟、杨家沟等乡镇,其中石沟是研究区流域治理与生态环境建设示范镇,注重山地果业等生态农业的培育与发展;研究期间生态保育簇村庄数量总体增加10个,但空间变化比较分散。④ 城镇休闲簇以休闲娱乐为主导服务,并提供一定的景观美学与生境质量服务,主要分布于川道的银州、十里铺以及龙镇的出谷口。该区域地形平坦,水域分布广泛且基础设施完善,是米脂县主要的城镇生活区;研究期间城镇休闲簇村庄数量总体减少16个,是变化最大的ESB类型。
图5中,ESB数量转移特征如下:① 农业美学簇与生态保育簇是当地主导的ESB,且研究期间村庄数量明显上升,而农业生产簇与城镇休闲簇的村庄数量有所下降。② 研究期间,农业生产簇中分别有14、20个村庄转变为农业美学簇、生态保育簇;同时16个村庄由农业美学簇转变为生态保育簇,而另14个村庄则发生了反向转化。另外,有相当数量的城镇休闲簇村庄转变为农业生产簇,这说明了川道地区农业发展逐渐影响了村庄各类ES的权衡关系,导致村庄休闲娱乐服务主导性下降。③ ESB转化趋势反映了当地土地利用空间格局的优化,这种优化提高了土壤保持等调节服务水平,并通过景观格局提高了农业景观美学价值,在保证农业产出的同时改善了当地生态环境。因此,对决策者而言,需要积极推动某些ESB的有效转化,例如,农业生产簇的内部结构中暗含食物供给与调节服务的权衡,因此引导此类ESB向其他ESB的转化,同时探究区域食物供给与调节服务的协同路径,促成新的ESB产生甚至主导区域农业生态系统的发展方向。
3.3 生态系统服务簇与地形起伏度的关系
ESB与地形起伏度的关系示于表3。从同一年份分布指数变化来看,随起伏度增加,ESB的分布表现为3种类型:一是倒U型,包括农业生产簇和农业美学簇,分别在2~4级、3~4级起伏度上呈优势分布,这与黄土沟壑区采用梯田、坡地与坝地共同耕作的独特农耕模式有关;二是增加型,为生态保育簇,在4~5级起伏度上呈优势分布,较高起伏度意味着较差的农耕适宜性与可达性,且高起伏度区域林草地广布,生态环境较好;三是减少型,为城镇休闲簇,在1~3级起伏度上呈优势分布,较低起伏度能指示较高的地形完整性与可达性,位于川道以及沟谷区域,该区域城镇建设密度高且伴随较高的休闲娱乐供给。
表3 生态系统服务簇与地形起伏度的分布关系
Tab.3
| ES簇类型 | 年份 | 分布指数P | ||||
|---|---|---|---|---|---|---|
| 1 (0.01~1.41 m) | 2 (1.42~4.37 m) | 3 (4.38~8.38 m) | 4 (8.39~14.49 m) | 5 (14.5~44.32 m) | ||
| 农业生产簇 | 2009 | 0.413 | 0.550 | 1.226 | 1.112 | 0.654 |
| 2019 | 0.522 | 2.408 | 1.329 | 0.814 | 0.504 | |
| 农业美学簇 | 2009 | 0.075 | 0.163 | 1.077 | 1.108 | 0.996 |
| 2019 | 0.062 | 0.097 | 1.108 | 1.115 | 0.962 | |
| 生态保育簇 | 2009 | 0.449 | 0.818 | 0.823 | 1.008 | 1.284 |
| 2019 | 0.423 | 0.182 | 0.860 | 1.102 | 1.309 | |
| 城镇休闲簇 | 2009 | 11.433 | 6.155 | 1.108 | 0.322 | 0.171 |
| 2019 | 11.703 | 7.626 | 0.758 | 0.174 | 0.411 | |
注:表中数字1~5表示起伏度梯度,基于自然断点法进行分级;灰色区域表示优势分布。
从不同年份分布指数变化来看,农业生产簇在2~3级起伏度优势分布上升,且4级起伏度的优势分布消失,说明该类簇趋向于向低起伏度转移;农业美学簇在3~4级起伏度优势分布上升,这意味着当地宽幅梯田的改造促进了农业增产与景观结构的优化;生态保育簇在4~5级起伏度的优势分布增加,说明丘陵坡地区域对当地生态维持与管护发挥了重要作用;城镇休闲簇在1~2级起伏度优势分布上升,且3级起伏度上的优势分布消失,这说明了当地城镇生活区的进一步集聚,并伴随休闲娱乐集中供给区域的形成。地形起伏度是研究ESB的有用视角,例如,农业美学簇趋向于向较高起伏度转移,这说明梯田对农业增收与景观格局优化的促进作用,但向更高起伏度的转移意味着对坡地的过度利用,导致农耕活动与生态环境的强权衡。厘清ESB在起伏度上的分布,对于丘陵沟壑区农耕管理和生态治理具有实践意义。
4 讨论与结论
4.1 讨论
作为一种系统方法,ESB提供了在决策中平衡经济、生态和社会发展的框架,从而使差异化的政策管理应用到具有不同社会—生态禀赋的村庄单元中。本文与以往研究的差异性体现在3个方面:① 从研究内容看,目前ESB研究侧重供给与调节服务的空间权衡及其聚簇[15,43],对文化服务的关注较少[12,16],仅有少量文化服务研究多侧重于生态旅游[18,21,27],这反映了城市居民[4]以及旅游者[23]的文化服务需求,却忽视了当地居民尤其是贫困地区农户对文化服务的积极诉求,导致基于ESB的政策管理缺乏对农户文化服务的充分考虑,进而影响农户福祉非物质维度的水平,如社会关系、主观福祉等[44]。本文结果表明,在退耕还林背景下,研究区供给与调节服务得到改善,与之相关的ESB也呈现一定空间扩展趋势,黄土高原的相关研究也支持了类似的结论[18,33];同时,本文将文化服务纳入ESB,例如,农业美学簇对当地农户福祉的贡献不限于供给服务,更在于美学价值等文化服务的贡献,这为乡村空间重构[16]充分体现生态系统的非物质价值提供了有效视角。② 从研究方法看,目前,K-均值聚类仍是聚簇的主流方法[12,18⇓-20,23⇓-25,43],此类方法将待辨识对象强制划分到某个“非此即彼”的类别中,甚至根据研究目标主观确定聚簇个数[4,15,45],主观性较强,这阻碍了ESB的实际应用。而GMM作为“软聚类”方法,其通过概率模型保留了待辨识对象的多属性特征,在揭示空间数据聚簇方面具有潜在优势[40],GMM在聚类路径中通过贝叶斯准则确定最佳聚类数,是保证结果可靠性的有效手段[41];类似地,自组织特征映射网络(SOM)通过轮廓宽度等指数[27-28]来确定最佳聚类数。目前,多数聚类方法尚缺少后验手段,但GMM等方法通过相应准则确定最佳聚类,一定程度上保证了结果的准确性,在诸多研究中被证明优于K-均值聚类、主成分聚类等传统方法[16,41],在未来研究中可以加强多模型之间的对比研究。③ 从研究尺度看,栅格、流域、行政区是主要的聚簇尺度。栅格尺度[15,20]、流域尺度[16,19]分别在保留数据精度、解决生态过程等方面具有优势,但这2种尺度与行政管理之间存在一定不匹配。现有基于行政单元的聚簇分析多关注省域[5,22]、县域[12,18,27,43],对村域的聚簇研究十分少见。村域是乡村地区行政管理的基本单位,本文村域ESB研究为乡村空间重构和乡村振兴提供了一些见解。空间重构是乡村振兴的基础[16],但目前研究忽视了ES在空间重构中的理论地位[46]。ESB制图揭示了清晰的产业布局、生态治理以及景观规划模式,这为乡村空间重构提供了理论支撑,因此,可以将ESB作为乡村重构框架的附加目标,进而服务于乡村振兴中产业兴旺、生态宜居等诸多核心目标。
未来研究中需考虑以下几点:① 高斯混合模型在一定程度上克服了ESB识别的强主观性,但仍缺乏聚簇结果的后验方法,因此在未来研究中需加强各类聚簇方法之间的对比,通过定量指标遴选最佳聚簇模型。同时,今后需要考虑相关领域专家以及当地决策者、农户等利益相关者偏好,从而将客观算法与主观专家知识相结合,提高ESB研究的科学性。② ESB的时空演变受自然环境演变与社会经济、政策等多要素综合影响,今后需要在探究ESB时空演化的基础上揭示影响ESB的社会—生态驱动力,并阐明ESB与驱动力之间的动态关系。 ③ 不同ESB的村庄在主导ES供给量以及不同ES权衡关系强弱等方面有很大差异,导致村域不同人类福祉水平的差异。因此,今后需要探究不同ESB对不同尺度人类福祉的差异性影响,从而为ES和人类福祉的关系研究提供新视角。
4.2 结论
在黄土丘陵沟壑区等生态脆弱、经济落后的复合区域,当地农业生产与生态保护存在复杂冲突,亟需利用ESB新工具为当地生态管理与乡村振兴提供有效视角。本文以该区域陕西省米脂县为例,探究了6类ES的时空演变,基于高斯混合模型识别出4类ESB并分析其时空演化,最后基于分布指数揭示了ESB与地形起伏度之间的关系。本文使用高斯混合模型识别ESB,为ESB的聚簇方法提供了一个有效的对比案例;同时,村域ESB及其与地形起伏度的关系分析厘清了研究区农业生态系统复杂特征,为从村域多重ES供给角度进行空间重构和农户福祉改善提供了科学的实践方法。主要结论如下:
(1) 各类ES空间分异明显,且各类ES之间空间分布差异较大;近10 a间各类ES水平均有不同程度的提高,其中调节服务水平有较大改善,而食物供给以及文化服务增幅较小;各类ES的空间变化格局具有较大差异,这与研究期间土地利用格局的空间演变关系密切。
(2) 高斯混合模型将研究区识别为4类ESB,包括农业生产簇、农业美学簇、生态保育簇以及城镇休闲簇;各ESB的空间分异明显,且存在较明显的数量和空间转移变化;农业美学簇与生态保育簇是当地主导ESB,且主导性增强,而农业生产簇与城镇休闲簇比重有所下降。
(3) 地形起伏度与ESB的空间关联密切。随起伏度上升,农业生产簇与农业美学簇呈倒U型,生态保育簇优势分布持续增加,城镇休闲簇优势分布持续减弱;研究期间农业生产簇与城镇休闲簇向低起伏度区域的转移趋势明显,而农业美学簇与生态保育簇趋向于向高起伏度区域转移。
参考文献
Twenty years of ecosystem services: How far have we come and how far do we still need to go?
[J].DOI:10.1016/j.ecoser.2017.09.008 URL [本文引用: 1]
人地系统耦合框架下的生态系统服务
[J].
DOI:10.18306/dlkxjz.2018.01.015
[本文引用: 1]

生态系统服务是连接自然环境与人类福祉的桥梁,是人地系统耦合研究的核心内容。本文在构建生态系统服务与人地系统耦合研究框架的基础上,系统梳理了生态系统服务评估、生态系统服务权衡、生态系统服务影响因素、生态系统服务供给流动与需求等研究前沿,提出了未来生态系统服务研究的重点领域。主要研究结论认为:①国际生态系统服务模型发展迅速,SAORES模型是中国生态系统服务模型优化与参数本地化的突出代表;②生态系统服务权衡具有相对复杂的时空尺度,权衡分析的前提是辨析不同尺度生态系统结构—过程—功能—服务的作用机制;③自然因素是生态系统服务时空分布的基础,土地利用能改变生态系统结构、功能与生态系统服务变化,社会经济因素会导致生态系统服务权衡的差异;④为明晰生态系统服务供给与需求耦合关系,需进一步识别生态系统服务流的运移路径;⑤未来生态系统服务研究需加强生态系统服务对全球变化的响应特征和机制分析、面向可持续发展目标的生态系统服务供给流动与需求研究、生态系统服务的动态评价集成与优化、生态系统服务与人地系统耦合、生态系统服务与大数据集成等。
Ecosystem services for coupled human and environment systems
DOI:10.18306/dlkxjz.2018.01.015
[本文引用: 1]
Ecosystem services bridge the natural environment and human well-being, and are the key content of coupled human-environment system research. This article puts forward a framework of research on ecosystem services for coupled human-environment systems, and systematically reviews the research hotspots of ecosystem services evaluation, ecosystem services trade-offs, ecosystem services driving factors, ecosystem supply-flow-demand, and identifies the key areas for future ecosystem services research. This article argues that: (1) international research on ecosystem services models have experienced a rapid development, and SAORES model is the outstanding representative of ecosystem service evaluation model in China; (2) ecosystem service trade-off analyses are relatively complex, and its mechanism depends on distinguish the relationships among ecosystem structure-process-function-service at multiple spatial and temporal scales; (3) natural factors are the basis of ecosystem services distribution, land use change can modify ecosystem structure, function, and services, and social and economic factors can lead to differences in ecosystem services trade-off and demand; (4) in order to clarify the coupling relationship between ecosystem service supply and demand, it is urgently needed to further identify the pathes of ecosystem service flowes; (5) future research of ecosystem services should include strengthening the analyses on the response of ecosystem services to global change, ecosystem services supply and demand flow focusing on the sustainable development aspect, integration and optimization of the dynamic evaluation of ecosystem services, the coupling of ecosystem services and human-environment systems, and the integration of ecosystem services and big data.
基于生态系统服务簇的福州市生态系统服务格局
[J].
Ecosystem service pattern of Fuzhou City based on ecosystem service bundles
DOI:10.13287/j.1001-9332.202103.013
PMID:33754571
[本文引用: 1]
Based on InVEST model, recreational opportunity spectrum, factor analysis, cold and hot spot analysis, SOFM neural network, relief degree of land surface (RDLS) methods, we evalua-ted six kinds of ecosystem service in Fuzhou City and analyzed the trade-offs and synergies among them, with the aim to clarify the dominant services and the spatial pattern of service bundles in different topographical regions. The results showed substantial spatial heterogeneity in different ecosystem services of Fuzhou City. Water yield, carbon sequestration, habitat quality, and recreational opportunities were totally high, whereas the supply of agricultural products and soil and water conservation were low and substantial differences. The interaction between water yield and cultural servi-ces were synergies, but trade-offs occurred among regulating service, supporting service and agricultural products service. There were spatial aggregations for both trade-offs and synergies. Ecosystem service bundles could be divided into suburban recreation bundle, water conservation bundle, agricultural products bundle, urban life bundle, and forest ecological conservation bundle. The composition of service bundles clusters was different under different RDLS, with obvious spatial heterogeneity.
Bundling ecosystem services in Denmark: Trade-offs and synergies in a cultural landscape
[J].
Ecosystem service bundles for analyzing tradeoffs in diverse landscapes
[J].
DOI:10.1073/pnas.0907284107
PMID:20194739
[本文引用: 4]
A key challenge of ecosystem management is determining how to manage multiple ecosystem services across landscapes. Enhancing important provisioning ecosystem services, such as food and timber, often leads to tradeoffs between regulating and cultural ecosystem services, such as nutrient cycling, flood protection, and tourism. We developed a framework for analyzing the provision of multiple ecosystem services across landscapes and present an empirical demonstration of ecosystem service bundles, sets of services that appear together repeatedly. Ecosystem service bundles were identified by analyzing the spatial patterns of 12 ecosystem services in a mixed-use landscape consisting of 137 municipalities in Quebec, Canada. We identified six types of ecosystem service bundles and were able to link these bundles to areas on the landscape characterized by distinct social-ecological dynamics. Our results show landscape-scale tradeoffs between provisioning and almost all regulating and cultural ecosystem services, and they show that a greater diversity of ecosystem services is positively correlated with the provision of regulating ecosystem services. Ecosystem service-bundle analysis can identify areas on a landscape where ecosystem management has produced exceptionally desirable or undesirable sets of ecosystem services.
Domesticated nature: Shaping landscapes and ecosystems for human welfare
[J].Like all species, humans have exercised their impulse to perpetuate and propagate themselves. In doing so, we have domesticated landscapes and ecosystems in ways that enhance our food supplies, reduce exposure to predators and natural dangers, and promote commerce. On average, the net benefits to humankind of domesticated nature have been positive. We have, of course, made mistakes, causing unforeseen changes in ecosystem attributes, while leaving few, if any, truly wild places on Earth. Going into the future, scientists can help humanity to domesticate nature more wisely by quantifying the tradeoffs among ecosystem services, such as how increasing the provision of one service may decrease ecosystem resilience and the provision of other services.
Historical dynamics in ecosystem service bundles
[J].DOI:10.1073/pnas.1502565112 URL [本文引用: 1]
基于生态系统服务簇的深圳市生态系统服务时空演变轨迹研究
[J].
Ecosystem service bundles based approach to exploring the trajectories of ecosystem service spatiotemporal change: A case study of Shenzhen City
Uncovering ecosystem service bundles through social preferences
[J].DOI:10.1371/journal.pone.0038970 URL [本文引用: 1]
An exploration of human well-being bundles as identifiers of ecosystem service use patterns
[J].DOI:10.1371/journal.pone.0163476 URL [本文引用: 1]
Integrating ecosystem service bundles and socio-environmental conditions: A national scale analysis from Germany
[J].DOI:10.1016/j.ecoser.2017.08.007 URL [本文引用: 1]
基于服务簇的东北地区生态系统服务权衡与协同
[J].
Quantifying ecosystem service trade-offs and synergies in Northeast China based on ecosystem service bundles
基于生态系统服务簇的小尺度区域生态用地功能分类: 以重庆两江新区为例
[J].
Function classification of ecological land in a small area based on ecosystem service bundles: A case study in Liangjiang New Area, China
基于生态系统服务簇的内蒙古自治区生态功能分区
[J].
Ecological function zoning in Inner Mongolia Autonomous Region based on ecosystem service bundles
Mapping the spatiotemporal heterogeneity of ecosystem service relationships and bundles in Ningxia, China
[J].DOI:10.1016/j.jclepro.2021.126216 URL [本文引用: 5]
Landscape functional zoning at a county level based on ecosystem services bundle: Methods comparison and management indication
[J].DOI:10.1016/j.jenvman.2019.109315 URL [本文引用: 7]
流域生态系统服务簇变化及影响因素: 以大清河流域为例
[J].
The change and driving factors of ecosystem service bundles: A case study of Daqing River Basin
Bundling ecosystem services for detecting their interactions driven by large-scale vegetation restoration: Enhanced services while depressed synergies
[J].DOI:10.1016/j.ecolind.2018.12.041 URL [本文引用: 6]
Identifying and analyzing ecosystem service bundles and their socioecological drivers in the Three Gorges Reservoir Area
[J].DOI:10.1016/j.jclepro.2021.127208 URL [本文引用: 4]
Identification of ecosystem service bundles and driving factors in Beijing and its surrounding areas
[J].DOI:10.1016/j.scitotenv.2019.134687 URL [本文引用: 3]
An ecosystem-based analysis of urban sustainability by integrating ecosystem service bundles and socio-economic-environmental conditions in China
[J].DOI:10.1016/j.ecolind.2020.106691 URL [本文引用: 2]
Mapping social-ecological systems: Identifying 'green-loop' and 'red-loop' dynamics based on characteristic bundles of ecosystem service use
[J].DOI:10.1016/j.gloenvcha.2015.07.008 URL [本文引用: 3]
Ecosystem service bundles along the urban-rural gradient: Insights for landscape planning and management
[J].DOI:10.1016/j.ecoser.2017.02.021 URL [本文引用: 3]
Using dimension reduction PCA to identify ecosystem service bundles
[J].DOI:10.1016/j.ecolind.2017.10.049 URL [本文引用: 2]
Linking ecosystem services trade-offs, bundles and hotspot identification with cropland management in the coastal Hangzhou Bay area of China
[J].DOI:10.1016/j.landusepol.2020.104689 URL [本文引用: 2]
雄安新区生态系统服务簇权衡与协同
[J].
DOI:10.11821/dlyj020181000
[本文引用: 1]
河北雄安新区建设是千年大计、国家大事。在生态优先、绿色发展理念引领下,深入理解生态系统服务间关系对于优化国土空间开发保护、实现自然资源可持续管理具有重要意义。本文基于多源数据评估了雄安新区四种生态系统服务,分析了生态系统服务间关系,并利用自组织映射特征网络划分了生态系统服务簇,以期为新区统筹权衡规划建设提供科学依据。研究结果表明:雄安新区生物多样性维持服务供给总体呈从东北向西南递增;食物供给服务在安新县与容城县供给较高,在雄县供给较低;产水服务供给以西南部地区较高,东北部地区较低;娱乐服务供给则以中北部地区较高,西南部地区较低。不同类型生态系统服务间多为协同关系,少为权衡关系。识别出四种生态系统服务簇,不同服务簇的主要土地利用类型及服务供给特点均存在差异,食物供给簇以旱地为主,主要提供食物供给服务;文化娱乐簇也以旱地为主,主要提供娱乐服务;生态保育簇以水域、旱地和林地为主,主要提供生物多样性维持服务;城镇生活簇则以建设用地为主,也包括少部分水田,主要以产水服务较高。根据不同生态系统服务供给间关系特征,为新区合理确定土地利用变更时序与位置以及促进多重生态系统服务可持续供给提出了建议。
Trade-offs and synergies of ecosystem service bundles in Xiong'an New Area
DOI:10.11821/dlyj020181000
[本文引用: 1]
The construction of Xiong'an New Area is crucial for generations and a national affair of China. Under the concept of ecological priority and green development, exploring the associations between ecosystem services is of vital significance for optimizing territory development plan and realizing the sustainable management of natural resources. In this study, four ecosystem services were quantified based on multi-sources data. The associations among ecosystem services were analyzed by using correlation analysis and ecosystem service bundles were identified by applying the self-organizing feature map, in the expectation of providing a scientific basis for balancing the planning and construction of Xiong'an New Area. The results showed that the supply of biodiversity protection service presented an increasing trend from the northeast to the southwest; the delivery of food production service was higher in Anxin county and Rongcheng county than that of Xiongxian county; the higher provision of water yield service mainly occurred in the southwest, while the lower provision of water yield service occurred primarily in the northeast; the recreation service supply was higher in the north-central part of Xiong'an New Area and lower in the southeast. Most of the associations among ecosystem services are synergistic and have less trade-offs. Four ecosystem service bundles were mapped with different main land use classes and supplies of ecosystem services. The food production bundle was predominantly covered by the dry lands and had the highest supply of food production service. The cultural entertainment bundle also primarily contained dry lands and dominated in providing recreation service. The ecological conservation bundle mainly consisted of water bodies, dry lands and forests, which had the highest delivery of biodiversity protection service. The urban life bundle was associated with urban areas and some paddy lands and showed a high provision of water yield service. On the basis of the characteristics of different ecosystem services supplies bundles, the suggestions were put forward for rationally determining the timing and location of changing land use types and promoting the sustainable provision of multiple ecosystem services in Xiong'an New Area.
Mapping ecosystem services bundles for analyzing spatial trade-offs in Inner Mongolia, China
[J].DOI:10.1016/j.jclepro.2020.120444 URL [本文引用: 4]
Exploring the heterogeneity and nonlinearity of trade-offs and synergies among ecosystem services bundles in the Beijing-Tianjin-Hebei urban agglomeration
[J].DOI:10.1016/j.ecoser.2020.101103 URL [本文引用: 2]
Improvements in ecosystem services from investments in natural capital
[J].DOI:10.1126/science.aaf2295 URL [本文引用: 1]
Urban expansion simulation and the spatio-temporal changes of ecosystem services, a case study in Atlanta Metropolitan area, USA
[J].DOI:10.1016/j.scitotenv.2017.12.062 URL [本文引用: 1]
黄土丘陵沟壑区生态风险时空动态及其风险分区: 以陕西省米脂县为例
[J].
Spatio-temporal variation of ecological risk in the loess hilly-gully region and its precaution partitions: A case study of Mizhi County, Shaanxi Province, China
DOI:10.31497/zrzyxb.20190916 URL [本文引用: 2]
生态脆弱区景观服务及其空间分异: 以米脂县为例
[J].
On the landscape service and spatial distribution in the fragile area: The case study of Mizhi County of Shaanxi Province
基于InVEST模型的陕北黄土高原水源涵养功能时空变化
[J].
DOI:10.11821/dlyj201604006
[本文引用: 2]
以陕北黄土高原为研究区,基于InVEST水源涵养功能评价模块,定量评价退耕还林还草工程背景下土地利用/覆被变化对研究区水源涵养的影响,在此基础上开展水源涵养空间分区。结果表明:① 2000-2010年,陕北黄土高原草地、灌丛和林地的面积分别增加了3204 km<sup>2</sup>、285.3 km<sup>2</sup>和122.7 km<sup>2</sup>,城镇面积增加了450.4 km<sup>2</sup>;农田、荒漠、湿地的面积分别面积减少了3984.5 km<sup>2</sup>、72.7 km<sup>2</sup>和5.2 km<sup>2</sup>。② 2000-2010年,陕北黄土高原水源涵养量整体以减少为主,中部减少最为显著,减少量在25 m<sup>3</sup>/hm<sup>2</sup>~40 m<sup>3</sup>/hm<sup>2</sup>,局部区域在40 m<sup>3</sup>/hm<sup>2</sup>以上;其他大部分区域均有0~25 m<sup>3</sup>/hm<sup>2</sup>不等的减少。③ 陕北黄土高原水源涵养功能高度重要区和极重要区的总面积为32255.1 km<sup>2</sup>,所占比例为40.5%。④ 通过陕北黄土高原水源涵养功能评价和重要性分区为生态系统的科学管理提供参考。
Spatial and temporal changes of water conservation of Loess Plateau in Northern Shaanxi Province by InVEST model
DOI:10.11821/dlyj201604006
[本文引用: 2]
The research on the assessment of ecosystem services is the hot spot and focus in global researches of ecology, geography, and exerted a profound influence on significantly regional ecosystem management, sustainable development and human welfare. We chose the InVEST model, a tradeoff model of regional development and ecosystem management, which provides a quantitative, scientific, dynamic assessment methods for regional water retention. Under the background of the project of Returning Farmland to Forestland, the influence of the land cover changes on the water retention was calculated quantitatively. The main conclusions are as follows: (1) The area of grass, scrub, woodland and towns increased by 3204 km2, 285.3 km2, 122.7 km2 and 450.4 km2, respectively in the Loess Plateau of northern Shaanxi from 2000 to 2010. By contrast, farmland, deserts and wetlands were reduced by 3984.5 km2, 72.7 km2 and 5.2 km2, respectively. (2) Water retention of the research area displayed a decreasing tendency in the 10 years, which has a remarkable reduction of 25 m3/hm2-40 m3/hm2 in the central part of the study area invloving the southwest of Wuding River basin, the upper reaches of Yanhe River and Qingjian River. Part of the central region has a more significant reduction exceeding 40 m3/hm2. And the reduction of other basins in this area was below 25 m3/hm2. (3) On the basis of these studies, the importance level of water conservation capacity in 2010 of the study area has been classified, and the total area of the water retention in highly important area and vital important area reached 32255.1 km2 with a proportion of 40.5%. (4) The assessment of water conservation function and the five partitions of importance level not only provides a reference for the effective management of ecosystems and is of great help to developing planning decisions in a scientific and rational perspective.
Modeling aesthetics to support an ecosystem services approach for natural resource management decision making
[J].DOI:10.1002/ieam.1944 URL [本文引用: 1]
Mapping cultural ecosystem services: A framework to assess the potential for outdoor recreation across the EU
[J].DOI:10.1016/j.ecolind.2014.04.018 URL [本文引用: 1]
陆地表层人类活动强度: 概念、方法及应用
[J].
DOI:10.11821/dlxb201507004
[本文引用: 1]
人类活动强度是表征人类对陆地表层影响和作用程度的综合指标。在定义陆地表层人类活动强度、建设用地当量等概念的基础上,建立了人类活动强度算法模型和土地利用/覆被类型的建设用地当量系数折算方法,并利用1984-2008年期间6个年份的土地利用数据,对中国进行了实证应用研究。结果表明:中国的人类活动强度变化大致以2000年为界,前期增长相对缓慢,后期增长明显加快,1984年全国的人类活动强度为7.63%,到2008年上升为8.54%。2008年县级单元的人类活动强度按大于27%、16%~27%、10%~16%、6%~10%和小于6%划分为高、较高、中等、较低和低5个等级,其空间分布格局大致以贺兰山—龙门山—景洪线为界分为东、西两个部分。东部是高、较高和中等类型的集中分布区,低和较低类型呈条带状分布于山地、丘陵区;西部以低和较低类型为主体,在甘肃河西走廊、青海东部及新疆天山南北坡有零散的中等和较高类型分布。
Human activity intensity of land surface: Concept, method and application in China
DOI:10.11821/dlxb201507004
[本文引用: 1]
Human activity intensity is a synthesis index for describing the effect and influence of land surface. This paper presents the concepts of human activity intensity and construction land equivalent, builds an algorithm model for human activity intensity, and establishes a method for converting different land use/land cover types into construction land equivalent as well. An application in China based on the land use data from 1984 to 2008 is also included. The results are shown as follows: (1) Human activity intensity is defined as the degree of land use, transformation and exploitation by human beings. It is an effective way to determine the construction land equivalent coefficient of different land use/land cover types by taking construction land equivalent as a basic unit and identifying the alteration of land surface natural properties caused by human activities. The application in China and correlation analysis with population density indicated that it is feasible to take the ratio of the construction land equivalent area to the total area as an indicator of human activity intensity. (2) We adopted a two-level method of eight attribute labels to construct general standard of converting different land use types into construction land equivalent, and establish a method for calculating the coefficient of construction land equivalent. We also built a coefficient table for constructing land equivalent of 49 land use types based on the latest land use classification system. (3) The human activity intensity in China increased from 7.63% in 1984 to 8.54% in 2008. It could be generally divided into five levels: very high, high, medium, low and very low, according to the human activity intensity at county level in 2008, which is rated by over 27%, 16%-27%, 10%-16%, 6%-10% and below 6%. The human activity intensity in China was spatially split into eastern and western parts by the line of Helan Mountain-Longmen Mountain-Jinghong; the eastern part was characterized by the levels of very high, high and medium, while the western part was featured by the low and very low levels.
基于地貌分区的陕西省区域生态风险时空演变
[J].
DOI:10.18306/dlkxjz.2020.02.006
[本文引用: 1]
论文采用“概率—损失”二维风险模型解构陕西省区域生态风险,基于地貌分区视角识别多源风险类型的同时以景观格局与生态系统服务价值为关联要素合成潜在生态损失,在此基础上分析了陕西省2000—2015年单一风险要素及区域生态风险的时空分异,并基于地貌分区视角结合重心模型探讨了生态风险的时空迁移。结果如下:① 2000、2015年陕西省多源危险度分别为0.3837、0.4558,上升18.79%,大致呈现南北高、中间低的空间格局,沿南北轴线呈现“W型”展布;潜在生态损失分别为0.5537、0.6270,上升13.24%,除高原南部与秦岭东部山区外,生态损失均呈现高值;区域生态风险分别为0.2429、0.2865,上升17.95%,空间上呈现“三高夹两低”的分布格局。② 从时序变化来看,秦巴山地保持较低风险且风险变化率较小;黄土高原与风沙过渡区变化率处于中等,后者面临较高风险;汉江盆地风险最高,该区域与关中平原分别为风险变化率的首位与次位。从生态风险重心变化趋势看,黄土高原与风沙过渡区重心均向西南移动,关中平原与秦岭山地重心东移趋势明显,汉江盆地与大巴山地重心跃向东南。
Spatiotemporal changes of regional ecological risks in Shaanxi Province based on geomorphologic regionalization
Exploring the linkage between the supply and demand of cultural ecosystem services in Loess Plateau, China: A case study from Shigou Township
[J].DOI:10.1007/s11356-020-07852-y URL [本文引用: 3]
Stakeholder perspectives on ecosystem service supply and ecosystem service demand bundles
[J].DOI:10.1016/j.ecoser.2019.100938 URL [本文引用: 1]
城市轨道交通通勤与职住平衡状况的关系研究: 基于大数据方法的北京实证分析
[J].
DOI:10.18306/dlkxjz.2019.06.001
[本文引用: 2]
城市轨道交通网络的发展在提高居民通勤效率的同时也对其职住平衡状况产生了一定影响。论文以北京市206个轨道站点为例,基于高斯混合模型(Gaussian mixture model, GMM)和一卡通刷卡数据将轨道站点按职住功能进行分类,利用腾讯“宜出行”定位数据考察轨道站点周边的动态人口分布并计算就业居住比。研究发现:① 中心城区的职住状况明显优于中心城区以外区域;② 轨道交通线网末端区域的职住平衡程度较差,仅有少数成规模的高端服务产业集中分布的轨道站点周边形成了区域性就业中心;③ 部分就业-居住较为均衡的城郊地区仍存在一定的职住不匹配现象。随后,通过计算一卡通出进站比和“宜出行”职住比得到出进站均衡度和职住平衡度,利用广义自回归条件异方差(generalized autoregressive conditional heteroskedasticity, GARCH)模型对轨道交通通勤和职住平衡程度进行相关性分析,研究结果表明:① 出进站均衡度与职住平衡度具有非常显著的正向关系,即站点进出站人数越接近,站点周边区域的职住状况越好;② 典型就业地站点与站点周边区域的职住平衡程度显著正相关,而典型居住地站点与站点周边区域的职住状况存在显著的负相关性。这表明,人口稠密的聚居区无法带动同样数量就业岗位的产生,而完善的就业中心能够吸引一定数量的人口在附近居住;③ 轨道站点的区位条件与职住平衡状况存在一定正向关系;④ GMM能够对属性复杂模糊的轨道站点进行有效的聚类分析;⑤ 具有实时性强、精确度高、覆盖度广、获取难度低等优点的“宜出行”数据能够在微观空间尺度下弥补其他捕捉和分析实时人口时空分布特征方法的局限性。
Relationship between urban rail transit commuting and jobs-housing balance: An empirical analysis from Beijing based on big data methods
DOI:10.18306/dlkxjz.2019.06.001
[本文引用: 2]
The development of urban rail transit (URT) network improves the commuting efficiency of residents while it has a certain impact on their jobs-housing balance. This study took 206 URT stations in Beijing as an example and classified them according to their jobs-housing functions based on the Gaussian mixture model (GMM) and smart card data. The dynamic population distribution characteristics around URT station were explored and jobs-housing ratio was calculated by "Yichuxing" position data. The study found that: 1) The jobs-housing balance in the central city is obviously better than that outside of the central city. 2) At the ends of the URT network, the jobs-housing balance is worse while only a few stations with concentrated distribution of top service industries have formed regional employment centers. 3) There still exists a certain degree of jobs-housing mismatch in the areas around some suburban stations where employment and residential functions are relatively equal. Station outflow-inflow and jobs-housing balances were calculated by the station egrass-ingrass ratio and the jobs-housing ratio, and the correlation between URT commuting behavior and jobs-housing balance was analyzed by generalized autoregressive conditional heteroskedasticity (GARCH) model. The results of this study indicate that: 1) There is a very strong positive relationship between URT station egrass-ingrass balance and jobs-housing balance. The closer the numbers of URT station outflow and inflow population, the better the jobs-housing balance around the URT station is. 2) There is a strong positive relationship between employment opportunity and jobs-housing balance around a URT station; and there is a strong negative relationship between residential function and jobs-housing balance around a URT station. This suggests that dense settlement will not generate the same quantity of jobs while well-developed employment hubs can attract a certain number of residents to live nearby. 3) There is a positive correlation between locational conditions of URT stations and jobs-housing balance. 4) The GMM can effectively cluster URT stations with complex and unclear attributes. 5) With its advantages of real-time data capturing, high precision, wide coverage, and great accessibility, "Yichuxing" position data can effectively compensate for the limitations of other methods on collecting and analyzing spatial-temporal characteristics of real-time population distribution at the microscopic scale.
基于高斯混合模型聚类和多维尺度分析的负荷分类方法
[J].
A load classification method based on Gaussian mixture model clustering and multi-dimensional scaling analysis
黄土丘陵沟壑区生态风险动态变化及其地形梯度分析: 以陕西省米脂县为例
[J].
The dynamic changes to ecological risk in the loess hilly-gully region and its terrain gradient analysis: A case study of Mizhi County, Shaanxi Province, China
Mapping ecosystem services bundles to detect high- and low-value ecosystem services areas for land use management
[J].DOI:10.1016/j.jclepro.2019.03.242 URL [本文引用: 3]
Insights into the importance of ecosystem services to human well-being in reservoir landscapes
[J].DOI:10.1016/j.ecoser.2019.100987 URL [本文引用: 1]
Mapping hotspots and bundles of forest ecosystem services across the European Union
[J].DOI:10.1016/j.landusepol.2020.104840 URL [本文引用: 1]
Rural restructuring in China: Theory, approaches and research prospect
[J].DOI:10.1007/s11442-017-1429-x URL [本文引用: 1]
