

IPCC第六次评估报告指出,自1850—1900年以来,全球地表温度已上升0.99 ℃,并在考虑所有排放情景下,至20世纪中叶,全球地表温度仍将持续上升[1]。全球气候变暖导致了世界各地广泛的气候异常,特别是极端高温事件的发生频率、强度和持续时间都有明显提升[2⇓-4],与高温相关的疾病发病率和死亡率也随之显著增长[5⇓-7]。2017年日本的夏季高温热浪在一周内就造成4241人因中暑而送医院抢救[8];2019年西欧高温热浪席卷,中暑、呼吸道疾病和心脑血管疾病等发病人数激增,并带来数千人的超额死亡[9];2000—2019年北美地区平均每10万居民中有6例与高温有关的死亡[10]。极端高温已成为人类社会面临的突出风险之一[11-12],并且,受快速城市化和城市热岛效应的影响,越来越多的城市人口暴露于更加严峻的城市热环境之中[13],给城市人口健康与社会经济的可持续发展带来严重威胁。如何准确衡量暴露于高温环境中的人口规模,合理测度人口暴露风险并精准揭示其空间分异格局,是科学研判高温灾害险情、制定精细化适应对策、构建气候安全与气候适应型城市的前提基础和重要依据。
人口暴露风险是指人群暴露于高温环境而受到不利影响的可能性[14]。目前关于高温暴露风险的研究主要集中在针对已发生高温事件的暴露度评估[15⇓⇓-18]和高温暴露影响因素分析[19⇓-21],此外,基于“暴露—敏感—适应能力”的脆弱性评估框架也对人口的高温热浪暴露危险性进行了深入的分析和探讨[22-23]。然而,上述研究大多采用基于行政单元的静态人口统计数据,忽视了各行政单元内部的人口时空分布异质性,因此,难以开展精细化时空尺度上的人口暴露风险评估。随着大数据的发展及其可获得性的改善,基于移动定位服务的手机信令数据可以提供更丰富和精准的人口时空信息,近年来常被应用于各类精细化尺度的人口分布和人群行为空间研究[24⇓-26],为精细化尺度下人口在灾害中的动态暴露评价研究提供了有力的数据支撑。
高时空分辨率的温度数据同样是开展精细化尺度人口暴露风险评估的关键。已有研究中的温度表征多采用气温观测数据或热红外遥感反演地表温度数据[27-28]。气温观测数据时间分辨率高,但受城市气象观测站点数量所限,其空间分辨率较低。遥感卫星地表温度数据具有易于获取和连续覆盖的优点,且由于地温和气温密切相关,对替代气温来表征热环境具有较强的指示意义[29]。地球静止卫星(如GOES-R、MSG、FY等)能在每小时(或半小时)的时间尺度上提供高频日地表温度数据,但其空间分辨率(2~5 km)相对粗糙。相对而言,具有更高空间分辨率的Landsat (60~120 m)[30]和ASTER (90 m)[31]数据被广泛用于分析城市内地表温度的空间变化,然而,ASTER对于每个城市只有很少的图像,并且每个城市的观测时间是固定的,难以反映地表温度的时间变化;而Landsat卫星周期长,且不能获取夜间图像,同样具有时间连续性上的缺陷。
2018年6月29日,由美国国家航空航天局(NASA)建造的生态系统星载实验热辐射计(ECOsystem Spaceborne Thermal Radiometer Experiment on Space Station,ECOSTRESS)被发射到国际空间站。ECOSTRESS可以在一天中的不同时间连续收集53.6°N~53.6°S之间的地球表面温度值,能够捕获到太阳同步轨道卫星(如Landsat、Sentinel、Terra等)未观测到的昼夜温度差异[32]。地球上任何一个地点的重返周期为1~5 d,具体取决于纬度[33],最低点的像素尺寸为38 m×69 m,由ECOSTRESS数据制作软件重新采样为70 m×70 m,以降低噪点和易于使用。凭借良好的空间和时间分辨率及昼夜采样能力,使其在城市地表温度日变化的观测中具有巨大的潜力,为阐明精细化尺度上的地表温度时空动态演变特征提供了有效的数据支持。
综上,本文基于ECOSTRESS数据集和手机信令数据,构建人口暴露风险评价模型,在精细化的时空尺度上开展西安市主城区热环境人口暴露风险评价,揭示人口暴露风险空间格局,识别高风险区域,为制定精细化与精准化的城市高温应对策略提供参考依据。
1 研究区域
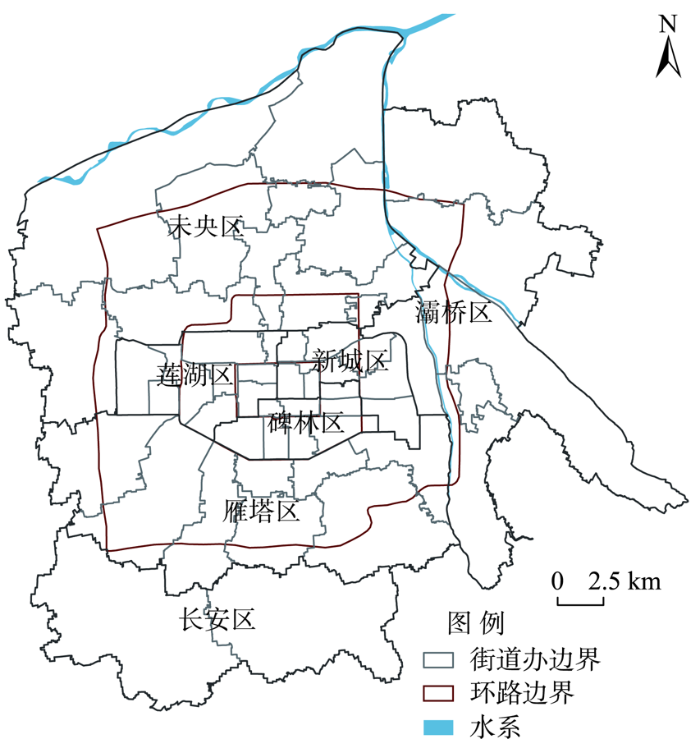
西安市位于关中平原中部,北临渭河和黄土高原,南接秦岭,属暖温带半湿润大陆性季风气候,冬季寒冷少雨雪,夏季炎热多雨,年平均气温13.1~14.3 ℃,7月平均气温26.5~27.0 ℃,年降水量528.3~716.5 mm。受全球气候变暖、城市热岛效应、秦岭焚风效应等因素的综合影响,西安市夏季极易出现极端高温天气,历史极端最高气温达43.4 ℃(2006年)。作为中国西部地区重要的中心城市和关中平原城市群核心城市,人口和社会经济要素高度集聚,2020年全市常住人口达1295.29万人,相比2010年增加448.51万人,人口增量全国排第三,人口的快速增长也提升了其暴露于高温热浪灾害的风险性,因此,将西安市作为人口暴露风险的研究区具有较强的代表性。综合考虑城市热岛效应的显著性、人口分布的集聚性及行政区划的相对完整性,最终确定的研究范围集中在西安市主城区,包括新城区、碑林区、莲湖区、未央区、雁塔区以及灞桥区和长安区的部分区域,总面积782 km2,共辖52个街道办事处(图1)。
图1
2 数据与方法
2.1 数据来源与处理
2.1.1 地表温度数据
本文采用的地表温度数据来源于国际空间站生态系统星载实验热辐射计(ECOSTRESS)下的大气校正地表温度和发射率二级产品(ECO2LSTE)(
表1 不同观测时间的天气情况
Tab.1
| 日期 | 时刻(北京时间) | 最高气温/℃ | 最低气温/℃ |
|---|---|---|---|
| 2019-09-22 | 02:09 | 26 | 13 |
| 2020-08-27 | 04:25 | 31 | 20 |
| 2021-08-21 | 06:29 | 33 | 21 |
| 2019-07-06 | 09:40 | 34 | 21 |
| 2019-08-10 | 12:03 | 32 | 20 |
| 2021-08-01 | 14:13 | 38 | 25 |
| 2020-07-26 | 16:55 | 32 | 20 |
| 2021-09-14 | 20:35 | 33 | 19 |
| 2020-09-07 | 23:44 | 34 | 19 |
这9个场景的地表温度数据是在3年内的不同日期获得的,虽然已尽量选择天气条件相近的日期,但仍需对数据进一步处理以克服不同气温的影响。本文选择来自哥白尼全球陆地作业(Copernicus Global Land Operations, CGLOPS)的地球静止卫星每小时地表温度产品(
式中:LSTa(t)表示调整后t时刻的地表温度;LST(d,t)表示d日期t时刻的ECOSTRESS地表温度;T(d,t)表示d日期t时刻的CGLOPS地表温度,Tm(t)表示整个研究期间内(6月1日至9月30日)t时刻的平均CGLOPS地表温度。
由于条件限制,无法对14:13和20:35这2个时刻的ECOSTRESS地表温度进行修正,因而最后得到的70 m×70 m的地表温度空间分布数据未包含这2个时刻数据。
2.1.2 人口数据
手机信令数据具有动态、连续、覆盖率高且持有率高(西安市2018年移动电话普及率为185.74%)的优势,可以较好地反映高分辨率下居民总体的时空间行为规律。本文使用的手机信令数据来源于联通智慧足迹科技有限公司,时间为2018年10月,数据空间精度为250 m×250 m,时间精度为1 h,该数据需要乘以扩样系数( 采用的手机信令数据来自中国联通公司,由于联通用户仅为所有手机用户的一部分,且不同城市联通用户所占比例不同,因此,需要将原始数据乘以扩样系数才能获得全部手机用户数量。经与西安联通公司确认,本文使用的西安市手机信令数据扩样系数为3.734。)方能得到较真实的西安市常住人口总量。为检验使用该扩样系数后得到的人口数是否符合实际常住人口数,本文通过计算2018年10月连续3个工作日的手机信令人口平均值,得到西安市全域人口约1200万人,对比西安市2018年统计年鉴中常住人口数1000万人(包括西咸新区),由于常住人口是按照在居住地6个月以上统计的,所以计算出来全域停留超过3 d的实际服务人口1200万人在相对合理区间。由于数据获取途径的限制,本文难以获取到与地表温度数据日期相同的手机信令数据,但它在很大程度上仍能反映西安市常住人口的日常空间分布特征与活动规律[40]。为排除国庆期间外来人口的影响,本文随机选择除国庆假期外一周工作日的手机信令数据(2018年10月15—19日),分别筛选出02:00、04:00、06:00、10:00、12:00、14:00、17:00、21:00、24:00的人口分布数量,从而与地表温度数据的时间单元保持一致,并对其横向平均化处理,得到工作日下的西安市250 m×250 m的常住人口动态分布数据。
2.2 城市热岛等级划分
表2 城市热岛等级划分标准
Tab.2
| 温度范围 | 温度等级 |
|---|---|
| 1 | |
| 2 | |
| 3 | |
| 4 | |
| 5 | |
| 6 |
注:
2.3 人口暴露相对风险评价模型
式中:Ri表示格网i的人口暴露风险,Ti表示格网i的地表温度,popi表示格网i内的人口数量,n是整个空间单元包含的总格网数。人口暴露相对风险等级见表3。
表3 人口暴露相对风险等级
Tab.3
| 人口暴露风险 | 人口暴露风险等级 | 含义 |
|---|---|---|
| ≤0.5 | 1 | 无风险 |
| 0.5~1.5 | 2 | 低风险 |
| 1.5~2.5 | 3 | 中等风险 |
| 2.5~3.5 | 4 | 高风险 |
| ≥3.5 | 5 | 极高风险 |
3 结果分析
3.1 地表温度的时空格局
在所获得的ECOSTRESS地表温度和对应日期的CGLOPS地表温度基础上(图2a),根据式(1)对研究区域不同时刻的地表温度进行修正,结果如图2b所示。西安市夏季一天的地表温度呈现出明显的波动特征,02:09~06:29地表温度保持大致不变,平均地表温度在20 ℃左右,从06:29~14:13开始逐步升高并在14:13达到最大值(51.9 ℃),然后从14:13温度逐步下降,至夜间23:44,稳定在20 ℃左右。总的来说,西安市夏季昼夜地表温度差异较大,白天平均地表温度为35.5 ℃,夜间平均地表温度为21.5 ℃。12:03~16:55内的地表温度的平均值与标准差都显著大于其他时间,如14:13时的平均温度为51.9 ℃,标准差为4.55 ℃,而02:09时的平均温度为19.9 ℃,标准差为1.21 ℃。
图2
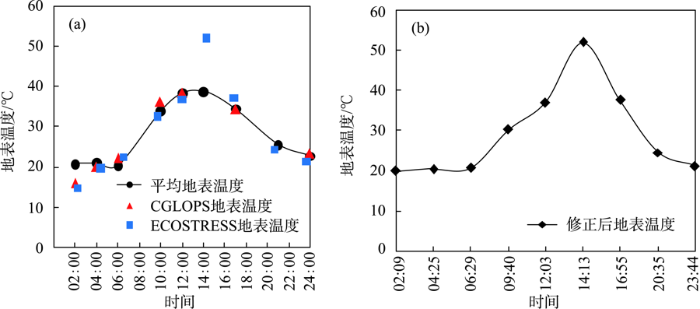
图2
西安市日内不同时间的地表温度平均值
Fig.2
LST averaged across Xi'an City for different times of the day and the night
将修正后各时刻的地表温度进行空间可视化,得到西安市一天内9个观测时刻的地表温度空间分布特征(图3a~3i),计算白天与夜间格网地表温度均值差,并按照自然间断点法进行等级划分,可以看出地表温度的昼夜差异(图3j)。夜间地表温度相对较高的区域主要集中在城市中心区和灞河区域,包括莲湖区、碑林区、新城区、雁塔区以及未央区的张家堡街道和大明宫街道;地表温度较低区域主要分布在城市边缘区以及公园绿地等植被覆盖区域,形成从中心向四周递减的空间格局。与夜间相比,研究区白天整体地表温度上升,城市中心区保持较高地表温度且高温区域向外围扩散,并出现了明显的极端高温区域,如在城市西部的六村堡、三桥、鱼化寨以及西南部的高新区等地呈明显热岛状分布,这些点状区域多以工业用地和仓储用地为主。
图3
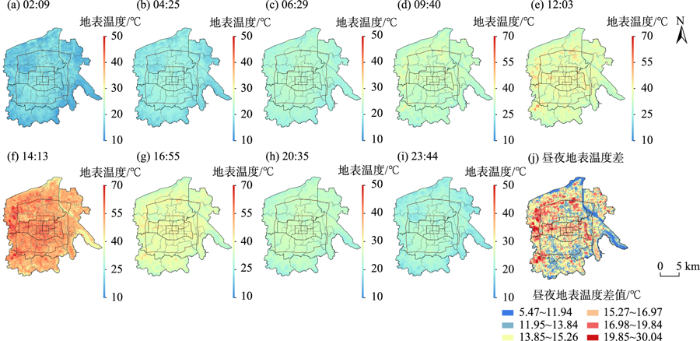
图3
西安市不同时间地表温度空间分布及昼夜地表温度差异
Fig.3
Spatial distribution of LST in Xi'an City at different times and diurnal difference
为了进一步定量分析西安市城市热岛的日变化规律,按照均值—标准差法对这9个场景的地表温度进行等级划分,结果如图4所示。经过分析,西安市日内所有时刻均存在不同强度的城市热岛效应,从昼夜比较来看,夜间热岛面积平均占比为54.55%,白天热岛面积平均占比为51.15%,夜间热岛强度略高于白天的热岛强度。从各时刻热岛覆盖面积来看,所有时刻热岛面积占比均超过了50%,最高时刻为20:35,此时的热岛面积占比为55.78%。从热岛空间分布变化来看,整体表现出从聚集状态向离散状态再过渡至聚集状态的趋势,02:09、04:25和06:29均呈中心聚集状态,09:40热岛区域向西北方向偏移,12:03城市西南部也出现了大片热岛区域,14:13和16:55在原有热岛区基础上进一步向外扩散,至20:35和23:44,又逐渐回到中心聚集的分布状态。
图4
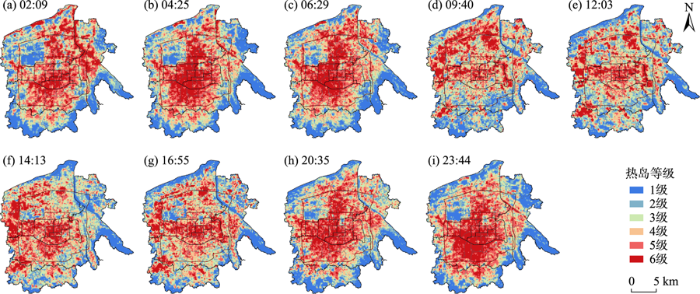
图4
西安市不同时间城市热岛空间分布
Fig.4
Spatial distribution of urban heat island in Xi'an City at different times
3.2 人口分布的时空格局
通过对手机信令数据的筛选和平均化处理,得到西安市一天内人口空间分布动态变化(图5a~5i)。从结果来看,西安市人口空间分布格局呈明显的单中心结构,研究区域73.6%的人口都分布在三环以内,且沿城市中轴线集中的现象显著,主要分布在莲湖区、新城区、碑林区和雁塔区。从具体时间来看,一天内主城区人口密度先上升,并在10:00达到最大值,平均密度为10986人/km2,然后开始下降,在晚上24:00达到人口密度最小值(9721人/km2),城市平均人口密度为10439人/km2。部分格网出现人口密度超过10万人/km2的情况,主要集中在城市中心的钟楼商圈、城市南二环的小寨商圈等。
图5
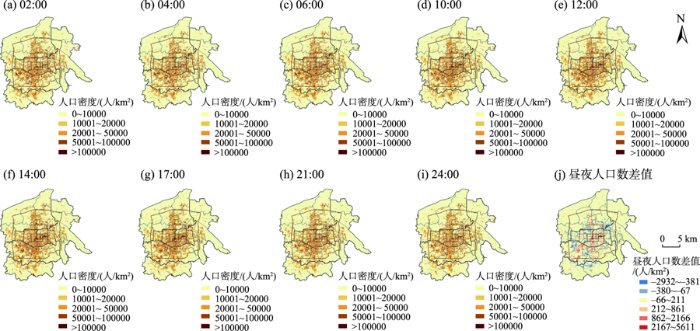
图5
西安市不同时间人口密度及人口数量昼夜差异
Fig.5
Population density at different times and diurnal population difference in Xi'an City
为了进一步了解西安市昼夜人口分布差异,计算了白天和夜间格网人口数量的均值差,并按照自然间断点法进行等级划分,结果如图5j所示。总的来看,西安市人口昼夜分布基本呈现出“白天向中心集聚、夜间向外围分散”的变化趋势,白天人口相对于夜晚具有更显著的中心集聚特征。白天中心城区人口显著增加,一环内、二环内和三环内白天人口数量大于夜间人口数量的格网占比分别达到89.5%、75.4%和70.6%,但内部差值大小具有明显空间差异,白天人口显著大于夜间人口的区域主要位于钟楼、解放路、康复路、南门及南稍门等,这些都是西安市传统的商圈和就业中心。此外,位于二环与三环之间的西高新、小寨以及北部地铁2号线沿线区域(包括熙地港、大融城、西安市行政中心等),是近年来兴起的商业与办公就业中心。夜间人口从中心城区开始向外扩散,北部的龙首原、西部的高新区、南部的韦曲、东南部的曲江新城以及东北部的辛家庙等地夜间人口显著大于白天人口,是西安市规模较大的居住板块。
3.3 人口暴露风险时空格局
图6
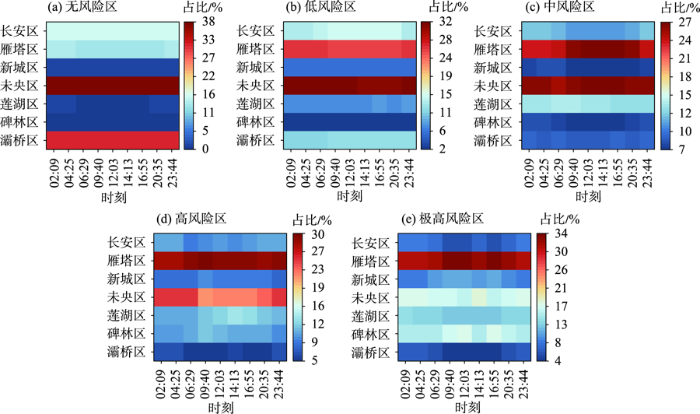
图6
不同等级暴露风险在各区的面积占比
Fig.6
Proportion of different levels of exposure risk in each area
图7
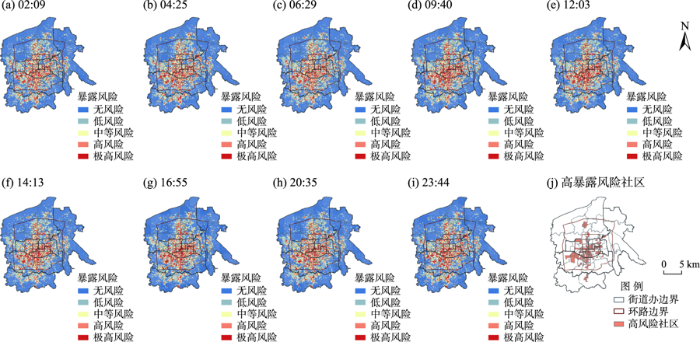
图7
西安市不同时间相对暴露风险空间分布及高暴露风险社区分布
Fig.7
Spatial distribution of relative exposure risk at different times in Xi'an City and distribution of high exposure risk communities
将人口暴露风险空间分布图与西安市社区分布图相叠加,统计各时刻高风险区与极高风险区平均面积占比超过50%的社区,结果如图7j所示。西安市具有高或极高暴露风险的社区共有167个,占研究区范围内社区总数的17.1%,且主要分布在三环以内。进一步对各时间各区域内暴露在极高风险区的人数进行统计,雁塔区在白天最高有近120万人暴露在极高风险区下;其次是碑林区,最高有约60万人暴露在极高风险区下;未央区、莲湖区、新城区和长安区暴露在极高风险区下的人口也较多,最高分别达到约52万、42万、37万和27万人;最少的为灞桥区,约18万人处于极高风险区中。
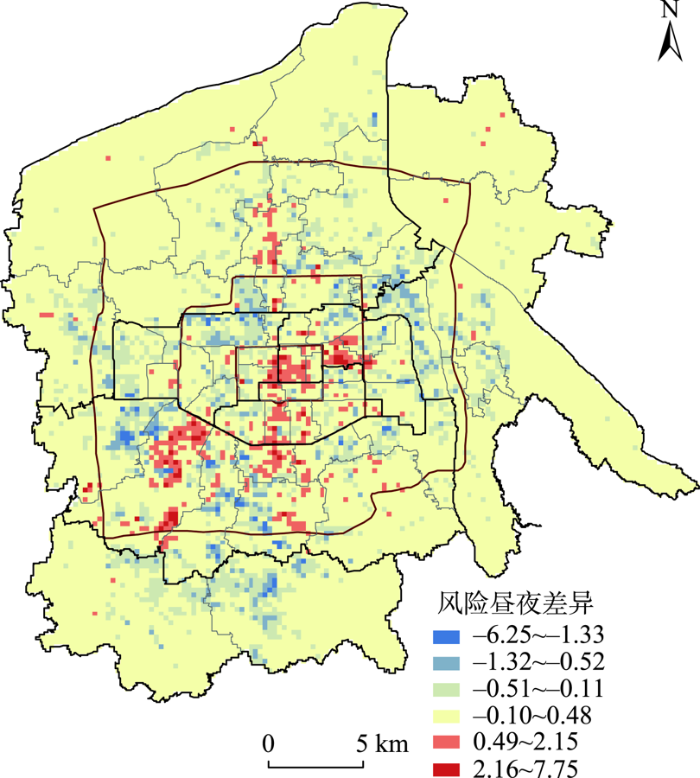
如上文所言,研究区内大部分地区的人口暴露风险都呈现出稳定的状态,但仍有部分区域呈现出了动态变化的特征。为了获得日内暴露风险差异较大的地区,计算了白天和夜间暴露风险的均值差,按照自然断点法分为6级,结果如图8所示。可以发现,白天暴露风险明显高于夜间的区域主要位于城市中轴线一带的张家堡街道、西一路街道、长安路街道和西南方向的丈八沟街道,以及东部的长乐西路街道;夜间暴露风险明显高于白天的区域分布相对较为分散,主要位于鱼化寨街道、红庙坡街道、韦曲街道等。
图8
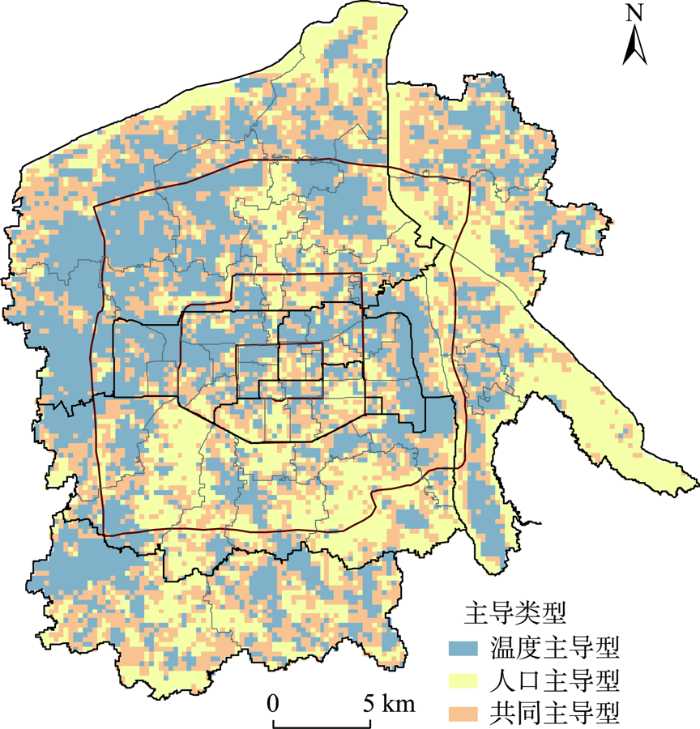
为了进一步分析温度与人口在暴露风险差异中的贡献作用,参考相关研究[44],本文将昼夜地表温度差值、昼夜人口数量差值按照自然断点法分为6级,通过对比这两者等级大小来划分主导类型。将地表温度差值等级大于人口数量差值等级的区域划为温度主导型,地表温度差值等级小于人口数量差值等级的区域划为人口主导型,地表温度差值等级等于人口数量差值等级的区域划为共同主导型(图9)。从结果来看,不同主导类型的面积占比依次为温度主导型(37.9%)>共同主导型(31.5%)>人口主导型(30.6%)。温度主导型主要分布在城市中心区、西部和北部地区,这些区域昼夜地表温度差异较大,从而导致白天暴露风险的升高;人口主导型主要位于城市南部以及灞河沿线,这些区域在白天或夜晚具有明显的人口集中趋势,从而引起该区域暴露风险等级的升高或降低;共同主导型分布较为分散。
图9
4 结论与讨论
4.1 结论
本文整合ECOSTRESS地表温度数据和手机信令数据,构建城市热环境下人口暴露风险评价模型,揭示了精细化时空尺度下的西安市人口暴露风险时空格局及其动态变化,主要结论如下:
(1) 西安市夏季一天内的地表温度呈现出明显的波动特征,先升高后下降,昼夜地表温度差异较大,白天平均温度为35.5 ℃,夜间平均温度为21.5 ℃。白天与夜间的地表温度分布格局差异显著,夜间地表温度差异较小,地表温度较高区域集中在城市中心区,白天高温区域较夜间明显扩大,出现多个极端高温“热岛”,且表现出更明显的空间异质性。西安市日内所有时刻均存在不同强度的城市热岛效应,热岛分布变化表现出从聚集状态向离散状态再过渡至聚集状态的特征。
(2) 西安市的人口空间分布格局呈明显的单中心结构,73.6%的人口集中在三环以内,且沿中轴线集聚的现象显著。白天人口分布明显增加的区域主要位于钟楼、解放路、康复路、南门、南稍门、西高新、小寨、行政中心等商圈和办公就业中心,而夜间人口明显增加的区域包括龙首原、高新区、曲江、辛家庙等,形成了“白天向中心集聚、夜间向外围分散”的人口昼夜分布特征。
(3) 西安市人口暴露的无风险区域、低风险区域、中风险区域、高风险区域和极高风险区域所占面积比例均值分别为57.33%、21.33%、9.20%、4.91%和7.23%。中风险区、高风险区与极高风险区主要呈散点式分布在城市中心区,且86.6%的极高风险区位于三环以内,而无风险和低风险区主要集中连片分布在城市外围。
(4) 白天人口暴露风险高于夜间的区域主要位于中轴线一带的张家堡街道、西一路街道、长安路街道以及丈八沟街道和长乐西路街道,而夜间人口暴露风险高于白天的区域分布相对较为分散,主要位于鱼化寨街道、红庙坡街道、韦曲街道等。导致昼夜人口暴露风险差异的各主导类型的面积占比依次为温度主导型(37.9%)>共同主导型(31.5%)>人口主导型(30.6%)。
4.2 讨论
城市热环境下的人口暴露是人口分布与高温环境共同作用的结果,当前已有的人口暴露风险研究多是基于静态的、以行政单元为主的分析,在精细化时空尺度上的量化表达仍存在不足,由此阻碍了城市人口暴露风险的精准化治理策略的形成。本文基于ECOSTRESS地表温度数据和手机信令数据的高时空分辨率优势,为从更精细化的时空尺度揭示人口暴露风险的空间分布格局和动态演变规律提供了方法借鉴,同时,也为精准识别人口暴露风险区并制定具有针对性和空间指向性的应对策略提供了案例参考。
从昼夜人口暴露风险差异的不同主导类型结果来看,温度主导型所在的区域与09:40~16:55出现的城市热岛格局具有一定的空间相似性,这些区域白天温度迅速上升,因此,应在该区域内加强蓝绿空间建设以降低城市热岛效应。人口主导型是由于人口数量在某一时刻的集聚从而导致暴露风险水平的提高,这与职住空间的分离有关,居住地与就业地作为城市空间结构的重要构成要素,未来应当通过产业发展的引导、功能空间的重构等手段,促进城市内部空间结构优化调整,改变单中心的城市结构,疏解中心城区密集的人口,降低高密度人口集聚带来的环境暴露风险。
本文仍然存在一定的局限性。由于国际空间站运行轨道的特殊性,构成一天内地表温度变化的ECOSTRESS数据是在不同日期得到的,在本文中尽管已经使用地球静止卫星的地表温度数据对它进行了修正,但可能仍然无法完全消除这种不确定性,因此,需进一步研究如何调整ECOSTRESS地表温度以适应不同天气和大气条件的差异。
参考文献
Climate Change 2021:The physical science basis
Exploring extreme warm temperature trends in South Africa
1960-2016 [J].DOI:10.1007/s00704-020-03479-8 URL [本文引用: 1]
Temporal and spatial trend detection of maximum air temperature in Iran during 1960-2005
[J].DOI:10.1016/j.gloplacha.2013.08.011 URL [本文引用: 1]
More intense, more frequent, and longer lasting heat waves in the 21st century
[J].
DOI:10.1126/science.1098704
PMID:15310900
[本文引用: 1]

A global coupled climate model shows that there is a distinct geographic pattern to future changes in heat waves. Model results for areas of Europe and North America, associated with the severe heat waves in Chicago in 1995 and Paris in 2003, show that future heat waves in these areas will become more intense, more frequent, and longer lasting in the second half of the 21st century. Observations and the model show that present-day heat waves over Europe and North America coincide with a specific atmospheric circulation pattern that is intensified by ongoing increases in greenhouse gases, indicating that it will produce more severe heat waves in those regions in the future.
Heat waves in the United States: Mortality risk during heat waves and effect modification by heat wave characteristics in 43 U.S. communities
[J].
DOI:10.1289/ehp.1002313
PMID:21084239
[本文引用: 1]
Devastating health effects from recent heat waves, and projected increases in frequency, duration, and severity of heat waves from climate change, highlight the importance of understanding health consequences of heat waves.We analyzed mortality risk for heat waves in 43 U.S. cities (1987-2005) and investigated how effects relate to heat waves' intensity, duration, or timing in season.Heat waves were defined as ≥ 2 days with temperature ≥ 95th percentile for the community for 1 May through 30 September. Heat waves were characterized by their intensity, duration, and timing in season. Within each community, we estimated mortality risk during each heat wave compared with non-heat wave days, controlling for potential confounders. We combined individual heat wave effect estimates using Bayesian hierarchical modeling to generate overall effects at the community, regional, and national levels. We estimated how heat wave mortality effects were modified by heat wave characteristics (intensity, duration, timing in season).Nationally, mortality increased 3.74% [95% posterior interval (PI), 2.29-5.22%] during heat waves compared with non-heat wave days. Heat wave mortality risk increased 2.49% for every 1°F increase in heat wave intensity and 0.38% for every 1-day increase in heat wave duration. Mortality increased 5.04% (95% PI, 3.06-7.06%) during the first heat wave of the summer versus 2.65% (95% PI, 1.14-4.18%) during later heat waves, compared with non-heat wave days. Heat wave mortality impacts and effect modification by heat wave characteristics were more pronounced in the Northeast and Midwest compared with the South.We found higher mortality risk from heat waves that were more intense or longer, or those occurring earlier in summer. These findings have implications for decision makers and researchers estimating health effects from climate change.
Historical global analysis of occurrences and human casualty of extreme temperature events (ETEs)
[J].DOI:10.1007/s11069-013-0884-7 URL [本文引用: 1]
Interactions between urbanization, heat stress, and climate change
[J].DOI:10.1007/s10584-013-0936-8 URL [本文引用: 1]
Primary factors behind the heavy rain event of July 2018 and the subsequent heat wave in Japan
[J].
Human contribution to the record-breaking June and July 2019 heatwaves in Western Europe
[J].
Global, regional, and national burden of mortality associated with non-optimal ambient temperatures from 2000 to 2019: A three-stage modelling study
[J].
极端天气气候事件监测与预测研究进展及其应用综述
[J].
Research progresses on extreme weather and climate events and their operational applications in climate monitoring and prediction
中国气候变化对人口健康影响研究评述
[J].
Review on effects of climate change on population health in China
The urban heat island: Implications for health in a changing environment
[J].
DOI:10.1007/s40572-017-0150-3
PMID:28695487
[本文引用: 1]
The Urban Heat Island (UHI) is a well-studied phenomenon, whereby urban areas are generally warmer than surrounding suburban and rural areas. The most direct effect on health from the UHI is due to heat risk, which is exacerbated in urban areas, particularly during heat waves. However, there may be health benefits from warming during colder months. This review highlights recent attempts to quantitatively estimate the health impacts of the UHI and estimations of the health benefits of UHI mitigation measures.Climate change, increasing urbanisation and an ageing population in much of the world, is likely to increase the risks to health from the UHI, particularly from heat exposure. Studies have shown increased health risks in urban populations compared with rural or suburban populations in hot weather and a disproportionate impact on more vulnerable social groups. Estimations of the impacts of various mitigation techniques suggest that a range of measures could reduce health impacts from heat and bring other benefits to health and wellbeing. The impact of the UHI on heat-related health is significant, although often overlooked, particularly when considering future impacts associated with climate change. Multiple factors should be considered when designing mitigation measures in urban environments in order to maximise health benefits and avoid unintended negative effects.
Global urban population exposure to extreme heat
[J].
基于手机定位数据的深圳市热浪人口暴露度分析
[J].
DOI:10.18306/dlkxjz.2020.02.005
[本文引用: 1]
热浪作为城市化特征灾害之一,严重影响着城市居民的生命健康。目前针对热浪的研究主要聚焦基于静态数据的时空模式、风险管理和脆弱性评价分析方向,对动态人口暴露度的研究尚少。论文基于手机定位数据,首先融合深圳市逐时人口与气温时空分布模型,揭示热浪动态人口暴露度水平;其次,构建基于7类城市兴趣点(point of interest,POI)与不同时段人口分布的地理加权回归模型,初步分析了热浪环境下POI对人群行为模式的影响机制。结果显示:① 相比于基准时段(2018年7月28日12:00~18:00),2018年7月26日至8月1日热浪平均辐射范围在7月29日以8.66倍速增长,至7月30日则以18.93倍速跃至峰值,覆盖区域整体呈现西部高于东部、南部低于北部的特征;② 人口在不同时段均表现为明显的带状聚集分布态势,且人口暴露度与气温和人口的动态演变紧密关联,其暴露度同热浪扩散幅度相似,总体呈2.29倍等比增长,辐射范围包括南山区、福田区、罗湖区等城市商业、工业、住宅中心人口密集区域;③ 同类POI在不同时刻、不同POI在相同时刻对人群减少热浪暴露的移动交互行为具有明显的时空驱动机制差异及选择偏好特征。在持续性城市化背景下,该研究方法可为同类的城市灾害人口暴露度分析提供一定的科学参考。
Population exposure to heatwaves in Shenzhen based on mobile phone location data
DOI:10.18306/dlkxjz.2020.02.005
[本文引用: 1]
As one of the characteristic disasters of urbanization, heatwaves seriously affect the life and health of urban residents. Existing research on heatwaves mainly focuses on the spatial and temporal pattern based on static data, risk management, and vulnerability assessment, and studies on dynamic population exposure are relatively few. This study first integrated spatial and temporal distribution models of population and temperature hourly in Shenzhen to reveal the dynamic population exposure to heatwaves based on mobile phone location data. Then a set of geographically weighted regression models in different time were built based on seven types of points of interest (POIs) and population distribution to explore the influencing mechanisms of POIs on crowd behavior patterns during the heatwaves. The results show that: 1) Compared with the baseline (12:00 to 18:00 on 28 July 2018), the average radiation range of the heatwaves increases by 8.66 times on 29 July, and jumped to the peak of 18.93 times on 30 July from 26 July to 1 August 2018. The overall coverage shows that temperature in the west was higher than the east and temperature in the south was lower than the north. 2) Population distribution exhibited an obvious zonal distribution of aggregates in different time periods, and population exposure was closely related to the dynamic evolution of temperature and population. The population exposure was similar to that of heatwaves, showing 2.29 times proportional growth. The coverage included densely populated urban commercial, industrial, and residential centers such as Nanshan District, Futian District, and Luohu District. 3) The same type of POIs at different times and the different types of POIs at the same time showed obvious spatial-temporal differences as driving mechanisms and selection preferences in the interactive mobility behavior of reducing population exposure. Under the background of sustainable urbanization, this research can provide a scientific reference for the analysis of population exposure to similar urban hazards and disasters.
高温热浪暴露风险评价: 以内蒙古包头市为例
[J].
Risk assessment of population exposure to heat wave: A case of Baotou City, Inner Mongolia, China
Assessment of heat exposure in cities: Combining the dynamics of temperature and population
[J].
Population dynamics modify urban residents' exposure to extreme temperatures across the United States
[J].
Avoiding population exposure to heat-related extremes: Demographic change vs climate change
[J].DOI:10.1007/s10584-017-2133-7 URL [本文引用: 1]
Global and regional changes in exposure to extreme heat and the relative contributions of climate and population change
[J].The frequency and intensity of extreme heat wave events have increased in the past several decades and are likely to continue to increase in the future under the influence of human-induced climate change. Exposure refers to people, property, systems, or other elements present in hazard zones that are thereby subject to potential losses. Exposure to extreme heat and changes therein are not just determined by climate changes but also population changes. Here we analyze output for three scenarios of greenhouse gas emissions and socio-economic growth to estimate future exposure change taking account of both climate and population factors. We find that for the higher emission scenario (RCP8.5-SSP3), the global exposure increases nearly 30-fold by 2100. The average exposure for Africa is over 118 times greater than it has been historically, while the exposure for Europe increases by only a factor of four. Importantly, in the absence of climate change, exposure is reduced by 75-95% globally and across all geographic regions, as compared with exposure under the high emission scenario. Under lower emission scenarios RCP4.5-SSP2 and RCP2.6-SSP1, the global exposure is reduced by 65% and 85% respectively, highlighting the efficacy of mitigation efforts in reducing exposure to extreme heat.
Impacts of climate change, population growth, and urbanization on future population exposure to long-term temperature change during the warm season in China
[J].DOI:10.1007/s11356-019-07238-9 URL [本文引用: 1]
中国城市高温特征及社会脆弱性评价
[J].
DOI:10.11821/dlyj020190608
[本文引用: 1]
极端高温对人类健康与城市社会发展影响显著,如何衡量城市高温特征及其社会后果是地理学人地关系研究的新命题。将社会脆弱性分析工具应用到该命题研究中,以中国296个城市为研究对象,采集各城市日最高气温数据、社会经济统计数据和人口普查数据,建立了高温日数、高温强度、热浪频次、热浪持续时间和热浪强度等表征城市高温特征的量化指标,对1960—2016年中国主要城市高温特征进行了系统分析;基于城市高温社会脆弱性分析框架,从暴露度、敏感性和适应能力3个维度构建中国城市高温社会脆弱性评价指标体系,并开展社会脆弱性评价,划分社会脆弱性等级,分析城市社会脆弱性致脆原因。结果表明:① 中国极端高温和热浪事件的分布主要集中在南方城市,尤其是在华东和华中地区,尽管北方城市高温热浪事件较少,但高温强度较为突出。② 中国城市高温暴露度指数具有明显的空间集聚特征,而各城市的敏感性指数和适应能力指数分布较为分散。③ 中国高社会脆弱性指数城市主要集中在华东和华中大部分地区,以及西南和华北少部分地区;高、中、低社会脆弱性指数城市比例分别为25.3%、46.3%和28.4%。④ 社会敏感致脆型城市数量最多(46.9%),其次为高温暴露致脆型(44.3%),适应能力不足致脆型城市数量最少(8.8%),在高社会脆弱性城市中,暴露度指数贡献度最大,中、低社会脆弱性城市中敏感性指数贡献度最大,适应能力指数对城市高温社会脆弱性的贡献度较小。本研究可在灾害-社会关系研究、城市高温特征的量化表达与高温社会脆弱性评价等方面提供借鉴和启示。
Characteristics of urban extreme heat and assessment of social vulnerability in China
DOI:10.11821/dlyj020190608
[本文引用: 1]
Human health and social development are significantly affected by urban extreme heat. It is a new proposition for human-land relationship in the field of geography to measure the characteristics and social consequences of urban extreme heat. Applying the tool of social vulnerability to studies of urban extreme heat, this paper takes 296 cities in China as research objects and establishes quantitative indicators of urban extreme heat such as high temperature days, high temperature intensity, heat wave frequency, heat wave duration and heat wave intensity. By using daily maximum temperature data, urban statistics and census data, we systematically analyze the characteristics of urban extreme heat. Meanwhile, we construct a framework for urban social vulnerability to extreme heat and based on this framework, we developed a common evaluation index system of social vulnerability according to the three dimensions of exposure, sensitivity and adaptive capacity. Finally, we conduct social vulnerability assessments for the 296 cities, classify social vulnerability levels, and analyze the causes of urban social vulnerability. The results are shown as follows. (1) The extreme heat events are mainly concentrated in southern cities, especially in the eastern and central parts of the country. Although there are fewer extreme heat events in northern cities, the intensity of high temperature is more prominent. (2) The urban exposure index to extreme heat in China has obvious spatial agglomeration characteristics, while the sensitivity index and adaptability index are scattered. (3) Cities with high social vulnerability index are mainly concentrated in most areas of East and Central China, and in a few areas of Southwest and North China. The proportion of cities with high, middle and low social vulnerability index was 25.3%, 46.3% and 28.4%, respectively. (4) The number of social sensitive cities is the largest, followed by high temperature exposure cities, and the number of insufficient adaptability cities is the smallest. In addition, exposure index contributes the most in cities with high social vulnerability index, and sensitivity index contributes the most in cities with middle and low social vulnerability indexes. This study can provide reference and enlightenment for relationship research between disaster and society, quantitative expression of characteristics of urban extreme heat and assessment of social vulnerability to extreme heat.
基于居民健康的城市高温热浪灾害脆弱性评价: 研究进展与框架
[J].
DOI:10.11820/dlkxjz.2015.02.005
[本文引用: 1]
随着全球气候变化和城市热岛效应增强,近年来城市高温热浪灾害在世界各地频繁发生,给城市居民健康和社会经济带来了极大的负面影响。目前,国内已有的高温热浪灾害研究大多关注热浪强度、发生频率、持续时间等灾害特征,以城市居民健康作为承灾体的城市高温热浪灾害脆弱性研究尚不多见,相关的评价框架和方法亟待梳理和完善。本文从高温热浪灾害脆弱性的研究主题、脆弱性框架和定量化方法三个方面系统梳理了高温热浪灾害脆弱性国内外研究进展;在广义脆弱性概念框架的基础上完善了基于“暴露—敏感—适应能力”的高温热浪灾害脆弱性评价概念框架,并梳理了相应的指标体系;强调通过自然环境、社会经济、居民感知等多角度的定性、定量数据综合表征城市居民高温热浪灾害脆弱性,以期为高温热浪灾害脆弱性评价提供理论与方法支持,并为规避高温热浪灾害风险、响应高温热浪紧急事件及适应气候变化等提供科学指引。
Health related urban heat wave vulnerability assessment: Research progress and framework
DOI:10.11820/dlkxjz.2015.02.005
[本文引用: 1]
With global climate change and urbanization, nature hazards such as extreme heat, rainstorm, water-logging, and fog and haze pollution have become much more frequent in urban areas during the past decades. As a part of the urban hazards, heat wave has been a leading cause of weather related human mortality in many countries and given rise to dramatic negative effects on the health of urban residents and the economy. Heat wave events are attracting widespread attention of the academic research community. In China, existing studies on heat waves mainly focused on the intensity, frequency, duration as well as the spatial patterns of the events and seldom explored the impacts of the heat waves on the health of vulnerable urban residents. Adverse health effects of heat waves can be avoided by identifying populations that are vulnerable to heat waves and providing targeted assistance, thus the improvement of the assessment framework and methodology for health related urban heat wave vulnerability is of great significance. This article reviews the development in research themes, assessment framework, and quantitative methods about health related urban heat wave vulnerability in China and abroad during the past decades and presents a new research framework. Most of the conventional vulnerability assessments contain the elements of exposure and sensitivity. However, in this research, adaptive capacity at both individual and community scales has been taken into account in addition to exposure and sensitivity. An index system combining environmental indicators (such as air temperature, land surface temperature, and land use), demographic indicators (such as age, gender, and education level), and socioeconomic indicators (such as household income, employment, and neighborhood stability) has been built for quantitative vulnerability assessment. Meanwhile, qualitative data from questionnaire survey and in-depth interviews are recommended to be added to the framework for first hand information of the residents and local governments. This research provides theoretical support for health related heat wave vulnerability assessment, as well as help focus attention and resources on more targeted health interventions, heat hazards mitigation, and climate change adaptation strategies.
上海市人口分布与空间活动的动态特征研究: 基于手机信令数据的探索
[J].
DOI:10.11821/dlyj201705013
[本文引用: 1]
对城市人口空间分布的动态把握是了解人口活动规律、认识城市空间结构、配置城市基础设施和公共服务设施及制订城市公共安全应急保障方案的重要依据。由于目前国内缺少系统的人口动态变化统计数据,城市内部层面的人口空间分布和活动的动态特征方面的相关研究难以开展,研究成果较为有限。移动电话是目前普及率最高的通讯终端设备,其用户的动态分布信息可以准确地反应整个城市人口的空间分布与活动的动态特征。利用手机信令数据,以上海市为例,构建“人口—时间—行为”关系的人口空间动态分析框架,分析上海市人口分布和活动的动态特征。结果表明:上海整体人口密度呈单中心的圈层空间分布结构,昼夜空间分布经历“白天向中心集聚、夜晚向郊区分散”的流动过程;人的各类活动(如通勤、消费休闲)会产生人口空间分布的动态变化,职住关系的不匹配和活动对中心的高度依赖使得人口的空间分布不均,形成向心流动模式。消费休闲行为对中心城区的依赖度明显高于就业活动,且集中体现在紧邻中心城区的外围近郊呈圈层分布。
Dynamic characteristics of Shanghai's population distribution using cell phone signaling data
DOI:10.11821/dlyj201705013
[本文引用: 1]
Analysis of the dynamic characteristics of Shanghai's population distribution is an important basis for recognizing people's behaviors, allocating urban infrastructures, and making safety emergency plans. Be short of statistical data of temporal and spatial dynamic distribution of population, research on this topic is limited in China. Due to cell phone is the most popular communication terminal equipment, the distribution of cell phone users is able to reflect the distribution of population accurately. Using datasets of cell phone signaling records from Shanghai, this study builds a framework based on the relationship among population, time, and behavior to analyze dynamic characteristics of Shanghai's population distribution. The results show that: (1) there is a single center where the density of population at daytime and nighttime is the highest; (2) people gather in the center at daytime and flow to the suburbs at nighttime; (3) different types of people's behavior result in dynamic changes of population distribution; (4) spatial mismatch between employment and place of residence, and the dependence on city center cause a large number of people flow to city center; (5) the degree of dependence of leisure consumption behavior on city center is obviously higher than that of employment, especially in the ring areas adjacent to city center.
基于手机定位数据的城市人口分布近实时预测
[J].
DOI:10.12082/dqxxkx.2018.170536
[本文引用: 1]
精细时空尺度下城市人口分布的近实时预测可为优化公共资源配置、协助城市交通诱导、制定公共安全应急预案、探索城市居民活动规律等提供重要科学依据。本文采用城市手机定位数据,基于时间序列分析方法,分别建立参数预测模型和非参数预测模型,对精细尺度下的城市人口空间分布开展近实时预测。预测结果表明,基于时间序列分析方法的预测模型可为精细尺度下的城市人口分布近实时预测提供方法支持;在本文实验条件下,从人口规模、时空分布、多时间尺度、特殊事件等多个角度评估模型精度,非参数预测模型其预测误差均小于参数预测模型,且预测结果更为稳定。
The near-real-time prediction of urban population distributions based on mobile phone location data
基于手机信令数据的特大城市人口时空分布及其社会经济属性估测: 以北京市为例
[J].
Using mobile phone data to estimate the temporal-spatial distribution and socioeconomic attributes of population in megacities: A case study of Beijing
长江三角洲地区高温热浪人群健康风险评价
[J].
DOI:10.3724/SP.J.1047.2017.01475
[本文引用: 1]
在全球极端气象、气候事件频发的背景下,获取高分辨的灾害风险信息对于区域防灾减灾决策具有重要的参考价值。而在当前的灾害风险评估中,基于行政单元的人口和社会经济等承灾体信息与栅格水平上的致灾因子普遍存在空间不匹配的现象。本文通过融合多源遥感数据和人口、社会经济统计数据,在利用人居指数对高温人口暴露进行空间化的基础上,获取了250 m分辨率的长江三角洲地区高温热浪人群健康风险空间格局。结果表明,风险等级较高的地区集中在上海、常州、杭州、宁波、无锡、嘉兴、泰州等城市的中心城区,主要是较高的人口暴露度和城市高温共同作用的结果;而大城市近郊以及各规模较小的城区的风险等级次之;相对欠发达地区虽然人口暴露程度较低,但较高的高温危险性和社会经济脆弱性指数使得这些地区的高温人群健康风险也不容忽视。识别高风险地区的风险主导因子对于提高人群高温适应能力以及减轻高温健康风险具有重要意义。
Spatially explicit assessment of heat health risks using multi-source data: A case study of the Yangtze River Delta region, China
福建省高温热浪风险评估与空间分异研究
[J].
DOI:10.12082/dqxxkx.2018.180295.
[本文引用: 1]
作为气候变化风险问题之一,高温热浪已引起各国政府与学术界的普遍关注。基于VSD (The Vulnerability Scoping Diagram)模型,文章构建了高温热浪风险评价指标体系,同时引入空间关联指数,探讨了福建省高温热浪风险时空分异特征、热点区演化以及类型划分。结果表明:① 2000-2015年,福建省高温热浪风险水平整体呈下降趋势,且不同城市间风险等级转化明显;② 高温热浪风险空间为跳跃变化的“圈层”结构,风险指数呈由中心向外围 “低-高-低”变化;③ 高温热浪风险的空间集聚程度整体趋于减小,热点区呈收缩态势并由“多核心”演变为“双核心”结构,冷点区则稳定分布于闽东北的宁德地区;④ 福建省高温热浪风险划分为5大类型,即省会-副省级高风险区、市辖区次高风险区、河谷中风险区、沿海平原次低风险区以及闽东-内陆山区低风险区。研究结果能够为未来福建省高温热浪风险格局演变提供预判依据,并为风险管理和合理布局公共服务设施提供决策参考。
Evaluation and spatial differentiation of heat waves risk of Fujian Province
基于卫星遥感的长江三角洲地表热环境人口暴露空间特征
[J].
Population exposure risk to land surface thermal envirionment over Yangtze River Delta based on multi-satellite data
An operational land surface temperature product for landsat thermal data: Methodology and validation
[J].DOI:10.1109/TGRS.2018.2824828 URL [本文引用: 1]
Generating consistent land surface temperature and emissivity products between ASTER and MODIS data for earth science research
[J].DOI:10.1109/TGRS.2010.2063034 URL [本文引用: 1]
New ECOSTRESS and MODIS land surface temperature data reveal fine-scale heat vulnerability in cities: A case study for Los Angeles County, California
[J].
ECOSTRESS: NASA's next generation mission to measure evapotranspiration from the international space station
[J].
In-flight validation of the ECOSTRESS, Landsats 7 and 8 thermal infrared spectral channels using the Lake Tahoe CA/NV and Salton Sea CA automated validation sites
[J].DOI:10.1109/TGRS.2019.2945701 URL [本文引用: 1]
First comparisons of surface temperature estimations between ECOSTRESS, ASTER and Landsat 8 over Italian volcanic and geothermal areas
[J].
Validation and quality assessment of the ECOSTRESS level-2 land surface temperature and emissivity product
[J].
遥感反演和站点观测的地气温度分布特征差异
[J].
Difference of temperature distribution characteristics based on remote sensing and meteorological station temperature data
1961—2010年中国0 cm地温变化特征及其与气温变化的关系
[J].
DOI:10.18402/resci.2016.09.11
[本文引用: 1]
近年来,气候变化尤其是气候变暖已成为一个全球性问题。下垫面作为大气的直接热源、水源,对气候的形成及维持具有重要意义。因此,研究地温变化特征及其与气温变化之间的关系,对探究气候变化机理具有重要意义。本研究利用中国581个气象站1961-2010年0cm地温、气温数据,将全国分为8个区域,采用相关分析、M-K非参数检验等方法,对0cm地温的时空变化、区域分异以及季节分异特征进行了研究,并分析了0cm地温变化与气温变化的关系。研究表明:中国0cm地温呈先降低后升高的趋势,2000年突变后升温趋势更为明显;中国大部分地区0cm地温都表现为升温趋势,且北方地区较南方升温更加明显,在过去50年中,南北温差呈现缩小的趋势;就各季节而言,冬季升温最明显,夏季升温最弱;相关分析表明,气温与0cm地温变化趋势及程度在大部分地区很相近,但在20世纪70年代之前及20世纪后期,0cm地温与气温变化存在较大差异。相对于气温的变化,0cm地温的升温幅度更大,突变时间较晚。
Variation in ground temperature at a depth of 0 cm and the relationship with air temperature in China from 1961 to 2010
DOI:10.18402/resci.2016.09.11
[本文引用: 1]
In recent years,climate warming has become a global problem. As the underlying surface is the direct heat and water source of the atmosphere,it has a strong effect on forming and maintaining local climates. The study of ground temperature variation characteristics helps to understand climate change more clearly and researching the relationship between ground temperature and air temperature variation is of great significance to understanding the mechanism of climate change. Based on daily mean air temperature and ground temperature at a depth of 0 cm from 581 stations during 1961 to 2010,correlation analysis and Mann-Kendall nonparametric tests,spatial and temporal variation characteristics,regional differentiation characteristics and seasonal differentiation characteristics of ground temperature at the depth of 0 cm and air temperature were analyzed. The results indicate that ground temperature at a depth of 0 cm in China decreased and then increased with an abruption around 2000,after the abruption the rising trend of ground temperature tended to be more obvious. In most regions,ground temperature at 0 cm rose and the trend in the north was more obvious than the south. The rise in ground temperature at 0 cm in winter was more apparent than in summer. Correlation analysis showed that variation air temperature and ground temperature at 0 cm were similar,but before the1970s and after the 20th century,large differences were apparent. Compared to variation in air temperature,ground temperature at 0 cm from 1961 to 2010 tended to have a larger range and later abruption.
Exploring diurnal thermal variations in urban local climate zones with ECOSTRESS land surface temperature data
[J].
Mining daily activity chains from large-scale mobile phone location data
[J].
粤港澳大湾区城市热岛空间格局及影响因子多元建模
[J].
DOI:10.18402/resci.2019.06.14
[本文引用: 1]
探究影响城市热岛空间格局的因子,及科学分析各因子的作用机制,对揭示城市热岛效应的机理有着重要意义。本文以粤港澳大湾区为研究区,综合利用数据空间化表达、空间叠置、地理探测器等方法,对影响城市热岛空间格局的因子开展研究,并构建地表温度与影响因子间的多元关系模型。结果表明,粤港澳大湾区的城市热岛强度等级呈现中间高四周低的空间分布格局,并在珠江入海口两岸形成半环状城市热岛带。本文选取的5种影响因子对城市热岛的空间格局皆具有较高的解释力,平均解释力排序为:单元人口密度(0.668)>建设用地面积占比(0.577)>单元路网密度(0.573)>植被面积占比(0.538)>水体面积占比(0.428)。所构建的多元关系模型,能较准确地反映城市热岛区域地表温度的分布状况,所拟合的地表温度结果与实际地表温度平均值的误差为0.34℃。
Spatial pattern of urban heat island and multivariate modeling of impact factors in the Guangdong-Hong Kong-Macao Greater Bay area
DOI:10.18402/resci.2019.06.14
[本文引用: 1]
To explore the influence of various factors on the spatial differentiation of urban heat island intensity, and to reveal the impact mechanism of the factors, spatial expression, spatial overlay, and geographical detector methods were used in this study. The impact of five influencing factors on the spatial differentiation of urban heat island intensity in the study area was examined, and a multivariate relationship model was constructed. The results show that the intensity of urban heat island in the Guangdong-Hong Kong-Macao Greater Bay area is high in the central part and low in the surroundings, which has formed a semicircular urban heat island belt on both sides of the estuary of the Pearl River. According to the results of the geographical detector analysis, the five selected factors have a high explanatory power on the spatial differentiation of the urban heat island intensity at the 1 km×1 km grid scale, in the order of population density (0.668) > proportion of construction land area (0.577) > length of roads (0.573) > proportion of vegetation cover (0.538) > proportion of surface water area (0.428). The constructed multivariate relationship model can accurately reflect the distribution of land surface temperature in urban heat island area, and the error between the modeling result and the observed average land surface temperature is 0.34℃.
基于多源数据的长沙市人居热环境效应及其影响因素分析
[J].
DOI:10.11821/dlxb202011013
[本文引用: 1]
针对城市人居热环境效应研究缺乏从自然—人文多维因子组合综合评价分析的现状,本文基于多源空间数据(Landsat 5、Landsat 8卫星影像数据、POI空间大数据、数字高程模型等)反演长沙市2000年、2009年和2016年城市地表温度格局,并快速获取与城市热环境密切相关的自然和人文因素共12个影响因子。应用标准差椭圆、空间主成分分析(PCA)等方法多角度分析了城市人居热环境效应及影响因素的联动关系。结果表明:① 2000—2016年共16年间热岛面积共增加547 km<sup>2</sup>、地表最高温度差达到10.1 ℃。城市热岛区的空间分布主要集中在城市建成区,如工商业集中和人口密集的城市中心地区,并呈现出地表温度从城市中心向郊区逐渐降低的热岛的空间分布格局,出现多个高温中心点,如五一广场商圈、长沙县星沙经济技术开发区、望城工业区、岳麓工业集中区、天心工业区等;② 2000—2016年热岛空间发展主轴保持在东北—西南方向,2000—2009年热岛重心向西南偏移了2.7 km,偏转角度为54.9°,2009—2016年热岛重心向东北偏移了4.8 km,偏转角度为60.9°。整体上,长沙市热环境空间格局的变化和城市的建设强度的变化存在一定的关联;③ 通过主成分分析得出影响长沙城市热环境格局的因子为景观格局、城市建设强度、地形地貌3个主因子;④ 人文因素对于当前加剧热岛效应形成产生的促进作用明显大于自然因素的抑制作用,综合作用下地区将升温0.293 ℃。影响城市人居热环境的因素众多,多源数据有助于揭示城市热环境空间格局及演变规律,深化对城市热岛效应成因分析认知,明确人文和自然影响因素间相关关系和相关程度,以此为改善城市人居环境质量提供科学依据。
Thermal environment effects of urban human settlements and influencing factors based on multi-source data: A case study of Changsha City
DOI:10.11821/dlxb202011013
[本文引用: 1]
In view of the lack of comprehensive evaluation and analysis from the combination of natural and human multi-dimensional factors, the urban surface temperature patterns of Changsha in 2000, 2009 and 2016 are retrieved based on multi-source spatial data (Landsat 5, Landsat 8 satellite image data, POI spatial big data, digital elevation model, etc.), and 12 natural and human factors closely related to urban thermal environment are quickly obtained. The standard deviation ellipse method and spatial principal component analysis (PCA) method are used to analyze the effect of urban human residential thermal environment and the linkage of its influencing factors. The results show that: (1) During the 16 years from 2000 to 2016, the heat island area increased by 547 km2, and the maximum surface temperature difference reached 10.1 ℃. The spatial distribution of urban heat island was mainly concentrated in urban built-up areas, such as industrial and commercial areas and densely populated urban centers. The spatial distribution pattern of heat island is gradually decreasing from the urban center to the suburbs. There were many high-temperature centers, such as Wuyi square business circle, Xingsha economic and technological development zone in Changsha County, Wangcheng industrial zone, Yuelu industrial concentration zone, and Tianxin industrial zone. (2) From 2000 to 2016, the main axis of spatial development of heat island maintained in the northeast-southwest direction. From 2000 to 2009, the center of gravity of heat island shifted 2.7 km to the southwest, and the deflection angle was 54.9°; the center of gravity of heat island shifted to the northeast by 4.8 km, and the deflection angle was 60.9°. On the whole, the change of spatial pattern of thermal environment in Changsha was related to the change of urban construction intensity. (3) Through the principal component analysis method, it was concluded that the factors affecting the urban thermal environment pattern of Changsha were landscape pattern, urban construction intensity and landform. (4) The promotion effect of human factors on the formation of heat island effect was obviously greater than that of natural factors. Under the comprehensive effect, the temperature would rise by 0.293 units. There are many factors influencing the urban human settlements thermal environment. Multi-source data could help to reveal the spatial pattern and evolution law of urban thermal environment, deepen the understanding of the causes of urban heat island effect, and clarify the correlation and degree between human and natural factors, so as to provide scientific supports for the improvement of the quality of urban human settlements.
中国城市空气污染时空分布格局和人口暴露风险
[J].
DOI:10.18306/dlkxjz.2021.10.004
[本文引用: 1]
近年来,中国空气污染及其对人口健康危害的时空分布呈现出新的特征。论文使用5 a(2015—2019年)间逐小时的空气质量监测数据,利用变化率计算、热点分析、趋势分析和超标频数统计等方法,分析了中国332个城市的空气质量及人口空气污染暴露风险的时空分布特征,结论如下:① 中国城市近年来空气质量有好转趋势,环境空气质量指数(AQI)下降的城市占所研究城市总数的91.3%;PM<sub>2.5</sub>、PM<sub>10</sub>、SO<sub>2</sub>和CO等4种污染物浓度均有所下降,而NO<sub>2</sub>和O<sub>3</sub>浓度有所上升;② PM<sub>2.5</sub>、PM<sub>10</sub>、SO<sub>2</sub>和CO浓度变化率的热点分布于新疆地区和云南—华南地区,NO<sub>2</sub>浓度变化率的热点为新疆地区和河套平原,O<sub>3</sub>浓度变化率的热点为华北平原至长江中下游流域;西北地区和华南地区空气质量变化幅度较小;③ 9个城市在PM<sub>2.5</sub>、PM<sub>10</sub>、SO<sub>2</sub>、NO<sub>2</sub>、O<sub>3</sub>和CO等6种污染物中均有暴露,分布于山西、河北与山东。暴露风险均为0级的低风险城市共有12个,分别位于新疆、云南、贵州、四川、广东、福建和黑龙江。研究结论对于跨区域空气污染的协同治理以及制定差异化的空间人口流动管理政策具有重要参考价值。
Spatiotemporal pattern and population exposure risks of air pollution in Chinese urban areas
DOI:10.18306/dlkxjz.2021.10.004
[本文引用: 1]
In recent years, the spatiotemporal distribution and its hazards to republic health of air pollution in China have shown new characteristics. Using hourly air quality monitoring data for five years (2015-2019) in 332 Chinese cities, this study analyzed the spatiotemporal distribution characteristics of air quality and urban population exposure risks by different methods. The results suggest that: 1) Air quality in Chinese urban areas has improved in recent years. Ambient Air Quality Index (AQI) decreased in 303 cities (91.3%). The concentrations of PM2.5, PM10, SO2, and CO declined while the concentrations of NO2 and O3 increased. 2) The hotspots of PM2.5, PM10, SO2, and CO concentration change rates were distributed in Xinjiang and Yunnan-South China. The hotspots of NO2 concentration change rate were in the Xinjiang area and the Hetao Plain. The hotspots of O3 concentration change rate were from the North China Plain to the middle and lower reaches of the Yangtze River. The trends of air quality change in the Northwest and South China were relatively slow. 3) Nine cities were exposed to PM2.5, PM10, SO2, NO2, O3, and CO pollution, which were located in Shanxi, Hebei, and Shandong provinces; 12 cities had no exposure risks to these six pollutants, which were distributed in Xinjiang, Yunnan, Guizhou, Sichuan, Guangdong, Fujian, and Heilongjiang provinces. These conclusions are of important reference value for collaborative treatment of cross-regional air pollution and formulating spatially diffenrentiated population flow management policies in China.
高温影响下西安市人口脆弱性评估及其空间分异
[J].
DOI:10.11821/dlyj020200922
[本文引用: 1]
高温给城市人口健康和社会发展带来的脆弱性后果愈发严重,如何科学量化与评估城市高温人口脆弱性,为制定更具针对性的高温适应对策提供科学依据成为当前国际研究热点。在城市高温人口脆弱性分析框架基础上,以西安市为例,整合遥感影像、手机信令、POI、社会经济等多源数据,从高温暴露、敏感性、适应能力3个维度构建高温影响下人口脆弱性评估指标体系和脆弱性测度模型,揭示高温人口脆弱性等级分布特征和空间异质性,识别人口脆弱性空间地域及其致脆因子类型。结果表明:① 西安市高温暴露、敏感性和适应能力都表现出显著的空间集聚特征,且总体上均呈现出“中心-边缘”结构,即城市中心地区形成“高暴露、高敏感、高适应”,城市边缘表现为“低暴露、低敏感、低适应”。② 西安市人口脆弱性以低值和较低水平为主,脆弱性也具有显著的空间集聚性,脆弱性较高地区主要集中在城市三环以内,形成断续的“岛状”分布形态,脆弱性低值和较低值地区分布在城市边缘。③ 不同致脆类型的面积占比依次为综合主导型(37.3%)>高温暴露主导型(33.3%)>适应能力不足主导型(23.6%)>人口敏感主导型(5.8%);高温暴露主导型广泛分布在城市中心、北部和西部等地,人口敏感主导型相对集中在城市中心偏南地区,适应能力不足主导型主要分布在城市边缘,综合主导型主要集中在城市南部,北部也有大量分散式分布。本研究可在城市高温人口脆弱性评估方法,城市高温人口脆弱性的减缓与治理等方面提供借鉴和启示。
Assessment of population vulnerability to heat stress and spatial differentiation in Xi'an
DOI:10.11821/dlyj020200922
[本文引用: 1]
Due to extreme heat events and urban heat island effects, urban population health and socio-economic development have become increasingly vulnerable. How to accurately quantify and assess the urban population vulnerability to heat, and provide a scientific basis for formulating more targeted heat adaptation strategies has become an international research hotspot. This study aimed to assess the population vulnerability to heat stress in Xi'an, and obtain a fine-scale urban vulnerability map. First, we integrated remote sensing, cellular signaling data, POI and other socioeconomic data, and constructed an assessment index system of population vulnerability based on three dimensions including exposure, sensitivity and adaptive capacity. Second, we developed a population vulnerability model to measure exposure index, sensitivity index, adaptive capacity index, and population vulnerability index at grid scale in Xi'an. Finally, this study revealed the spatial distribution and heterogeneity of population vulnerability in the study area, and identified vulnerability types and its spatial pattern. The results are shown in the following aspects. (1) The exposure index, sensitivity index and adaptability index not only present significant spatial agglomeration characteristics, but also show a clear center-periphery structure. The central areas of the city are dominated by the high exposure index, high sensitivity index, and high adaptive capacity index, while the outer urban areas are dominated by low exposure index, low sensitivity index, and low adaptive capacity index. (2) The proportion of the area with the lowest and lower levels of population vulnerability index is larger in Xi'an. The population vulnerability index also shows significant spatial agglomeration. The areas with high population vulnerability index are mainly concentrated within the third ring road of the city, while the areas with low vulnerability index are concentrated in the urban fringe areas. (3) According to different dominant factors, vulnerability is grouped into four types including exposure-dominated, sensitivity-dominated, low adaptability, and comprehensive type, and their proportions to the total urban area are 33.3%, 5.8%, 23.6%, and 37.3%, respectively. The spatial distribution of the four types is as follows: the exposure-dominant areas are concentrated in the center, north and west of the city; the sensitivity-dominant areas are in the center and south of the city; the low adaptability areas are concentrated in the urban fringe areas; the comprehensive type areas are mainly distributed in the south and north of the city. This study can provide a new approach for assessing urban population vulnerability to heat stress at fine-scale, and give enlightenment for mitigation and governance of urban heat vulnerability.
